impact of excessive groundwater pumping on rejuvenation ... · report impact of excessive...
TRANSCRIPT

REPORT
Impact of excessive groundwater pumping on rejuvenationprocesses in the Bandung basin (Indonesia) as determinedby hydrogeochemistry and modeling
Ahmad Taufiq1,2,3& Takahiro Hosono1,4
& Kiyoshi Ide1& Makoto Kagabu5
& Irwan Iskandar6 & Agus J. Effendi7 &
Lambok M. Hutasoit2 & Jun Shimada1
Received: 22 March 2017 /Accepted: 15 November 2017 /Published online: 14 December 2017# The Author(s) 2017. This article is an open access publication
AbstractIn the Bandung basin, Indonesia, excessive groundwater pumping caused by rapid increases in industrialization and populationgrowth has caused subsurface environmental problems, such as excessive groundwater drawdown and land subsidence. In thisstudy, multiple hydrogeochemical techniques and numerical modeling have been applied to evaluate the recharge processes andgroundwater age (rejuvenation). Although all the groundwater in the Bandung basin is recharged at the same elevation at theperiphery of the basin, the water type and residence time of the shallow and deep groundwater could be clearly differentiated.However, there was significant groundwater drawdown in all the depression areas and there is evidence of groundwater mixingbetween the shallow and deep groundwater. The groundwater mixing was traced from the high dichlorodifluoromethane (CFC-12) concentrations in some deep groundwater samples and by estimating the rejuvenation ratio (R) in some representativeobservation wells. The magnitude of CFC-12 concentration, as an indicator of young groundwater, showed a good correlationwith R, determined using 14C activity in samples taken between 2008 and 2012. These correlations were confirmed with theestimation of vertical downward flux from shallower to deeper aquifers using numerical modeling. Furthermore, the change invertical flux is affected by the change in groundwater pumping. Since the 1970s, the vertical flux increased significantly andreached approximately 15% of the total pumping amount during the 2000s, as it compensated the groundwater pumping. Thisstudy clearly revealed the processes of groundwater impact caused by excessive groundwater pumping using a combination ofhydrogeochemical methods and modeling.
Keywords Over-abstraction . Groundwater age . Groundwatermixing . Numerical modeling . Indonesia
Introduction
Groundwater is an essential and valuable water resource inmany developing countries, especially in cities where thereis pressure on public water supply because of insufficient in-frastructure. In many areas, groundwater can be used easilyand inexpensively, and it normally has good quality with re-spect to human health and industrial purposes. Population,industrial and economic growth are often significant, withconsequent increases in groundwater exploitation to meet de-mand. Thus, a sustainable use of groundwater resources isrequired urgently in many cases, taking account of the region-al groundwater flow dynamics (Kagabu et al. 2013). Somesubsurface environmental problems have been reported thatare the result of excessive groundwater pumping such as in-creasing underground temperature (Yamano et al. 2009;Taniguchi et al. 2009), groundwater drawdown and land
* Ahmad [email protected]; [email protected]
1 Graduate School of Science and Technology, Kumamoto University,2-39-1 Kurokami, Kumomoto 860-8555, Japan
2 Faculty of Earth Science and Technology, Bandung Institute ofTechnology, Ganesha 10, Bandung 40132, Indonesia
3 Research Center for Water Resources, Ministry of Public Work andHousing, Juanda 193, Bandung 40135, Indonesia
4 Priority Organization for Innovation and Excellence, KumamotoUniversity, 2-39-1 Kurokami, Kumomoto 860-8555, Japan
5 Graduate School of Fisheries and Environmental Science, NagasakiUniversity, 1-14 Bunkyo-Machi, Nagasaki 852-8521, Japan
6 Faculty of Mining and Petroleum Engineering, Bandung Institute ofTechnology, Ganesha 10, Bandung 40132, Indonesia
7 Faculty of Civil and Environmental Engineering, Bandung Instituteof Technology, Ganesha 10, Bandung 40132, Indonesia
Hydrogeology Journal (2018) 26:1263–1279https://doi.org/10.1007/s10040-017-1696-8

subsidence (Foster and Chilton 2003), and groundwater re-newal (Yamanaka et al. 2011; Kagabu et al. 2013).
In some large Asian cities, groundwater level drawdownshave been reported (Taniguchi et al. 2008; Yamanaka et al.2011; Kagabu et al. 2011, 2013). It is also suggested that thedegree of groundwater drawdown depends on the developmentstage of each city (Taniguchi et al. 2008; Onodera et al. 2009;Kagabu et al. 2011). In Indonesia, significant groundwaterdrawdown, and consequently land subsidence and evengroundwater quality changes, have been reported in cities suchas Jakarta, Bandung, and Semarang (Wirakusumah andDanaryanto 2004; Taniguchi et al. 2008; Umezawa et al.2008; Hosono et al. 2011, Kagabu et al. 2011, 2013).
In the Bandung basin, groundwater pumping has beenrecorded since the early 1900s and found to be increasing(unpublished report, 1991) by Sutrisno, see Table 1).Since 1970, many textile factories have been establishedin this basin. These factories rely almost entirely ongroundwater and have caused significant groundwaterdrawdowns. In addition, 60% of the total water demandof the Bandung basin is supplied by groundwater(Wangsaatmaja et al. 2006). Consequently, land subsi-dence has occurred at a rate of 5–75 cm between 2000and 2008 (Abidin et al. 2008). According to calculationsby Taufiq (2010), the groundwater drawdown has contrib-uted to 30–70% of the land subsidence rate.
Recent studies have emphasized the impact of subsurfaceenvironmental problems, but in this study the focus is ondescribing the processes that leading to these impacts.Understanding and predicting these processes at basinscale entails developing and integrating knowledge of
hydrogeochemical characteristics, aquifer heterogeneity, andfield-scale parameterizations, and then simulating a ground-water flow model (Dai et al. 2010, 2014). One of the impactsof excessive groundwater pumping is to cause changes in thegroundwater rejuvenation process. Understanding thesechanges is an important task for effective groundwatermanagement because such changes can cause unexpectedproblems such as groundwater quality degradation and thedisturbance of regional groundwater flow systems (Kagabuet al. 2013).
This study describes the rejuvenation processes of theBandung basin by using multiple hydrogeochemical tech-niques (stable isotopes, major ions, and CFC-12 analyses)and estimating a rejuvenation ratio (R) for 14C activity,and then testing this with numerical modeling. The objec-tives are to systematically examine the groundwater flowsystem, to trace the rejuvenation processes, and to revealthe groundwater fluxes, thus demonstrating how under-standing the rejuvenation phenomenon is important formanagement of some human activity with respect togroundwater resource protection.
Study area
The Bandung-Soreang groundwater basin, commonly knownas the Bandung basin, is located in the center of the westernpart of Java, an island of Indonesia. This intra-montane basinis surrounded by up to 2,400-m-high volcanic rocks of the lateTertiary and Quaternary. The Citarum River flows in the cen-ter of the basin, and is the main river. This basin is one of most
Table 1 The unpublished reports/papers featured in this report
Author/s Year Title Organization (Republic of Indonesia)
Geyh MA 1990 Isotopic hydrological study in the Bandung Basin – Indonesia.Project Report No. 10
Directorate of Environmental Geology;Ministry of Energy and MineralResources
Iwaco – Waseco, Ministry ofPublic Works
1990 West Java Provincial Water Sources Master Plan for WaterSupply, Bandung.
Directorate General for HumanSettlements; Directorate of WaterSupply; Ministry of Public Works
Office of Energy and MineralResources - West JavaProvince
2010 Evaluation and updating of conservation zone inBandung-Soreang groundwater basin, Bekasi-Karawanggroundwater basin and Sukabumi groundwater basin
Office of Energy and Mineral Resources -West Java Province
Office of Energy and MineralResources - West JavaProvince
2004 Monitoring of groundwater condition in Bandung-Soreanggroundwater basin, Bogor groundwater basin andBekasi-Karawang groundwater basin
Office of Energy and Mineral Resources -West Java Province
Office of Energy and MineralResources - West JavaProvince, LPPM–ITB
2002 Master plan study for the utilization of groundwater inBandung-Soreang groundwater basin
Office of Energy and Mineral Resources -West Java Province
Sutrisno D 1991 Utilization, impact and countermeasures of groundwaterabstraction in Bandung basin
Directorate of Environmental Geology;Ministry of Energy and MineralResources
1264 Hydrogeol J (2018) 26:1263–1279

developed basins in Indonesia. It has an area of 2,300 km2
and five administrative areas—three regencies (part ofBandung, West Bandung and Sumedang) and two cities(Bandung and Cimahi). The central part of the basin,mostly comprising urban and industrial areas, is a plainmeasuring about 40 km east–west and about 30 km north–south. The population in Bandung basin is currently morethan 7 million people. As regards the regional climate ofthe Bandung basin, the mean annual temperature is about23.7 °C, the annual precipitation is 1,500–2,500 mm, andthe annual potential evapotranspiration is 1,606 mm(Nurliana 2009). Meanwhile, wet season usually occursin September–May throughout the region and dry seasonoccurs during June–August—unpublished report (1991)by Iwaco-Waseco (see Table 1).
A geological map of the Bandung basin has been generatedby Hutasoit (2009), and is presented in Fig. 1. Thehydrostratigraphy of this basin is classified (older to youngerorder) into the following three formations: CikapundungFormation (basement rock), Cibeureum Formation (the mainaquifer), and Kosambi Formation (aquitard). A description ofeach formation follows:
& The Cikapundung Formation is the oldest rock exposed inthis basin and consists of conglomerates and compactedbreccia, tuff, and andesite lava. The estimated age of thisformation is early Pleistocene. The high degree of com-paction of this formation differentiates it from theCibeureum Formation, and forms the basement of thegroundwater basin.
Fig. 1 Location map of the sampling points plotted on a geological map of Bandung basin (Hutasoit 2009). Three representative hydrogeological crosssections of the Bandung basin along the A–A′ line, B–B′ line and C–C′ line. The C–C′ line is shown in Figs. 4 and 5
Hydrogeol J (2018) 26:1263–1279 1265
& The Cibeureum Formation lies under the KosambiFormation and is found in the periphery of the basin, asa fan-shaped distribution of volcanic deposits. It is com-posed of partially consolidated breccia and tuff deposits,with some lava intrusions, and is late Pleistocene–Holocene age.
& The Kosambi Formation is the upper surface layer and isdistributed in the center of this basin, as a lake deposit. Itslithology consists of unconsolidated claystone, siltstone,and sandstone of Holocene age.
The most recent study of the groundwater flow systemof the Bandung basin was done by Sunarwan (2014), usingdescriptions of cuttings, drilling well logs, resistivity logs,major ions, and stable isotopes. Hydrostratigrapically, theBandung basin can be divided into three units—units ofhydrostratigraphy 1 (UHs 1), UHs 2, and UHs 3. UHs 1is composed of three layers: sandy tuff, clayey sand andsilty clay, as a combined aquitard which containsshallow groundwater. UHs 2 (composed of two layers:sandy silt and tuffaceous sandstone) and UHs 3(composed of one layer, tuffaceous breccia) are distinctlithologically, but it is not clear if they are hydrologi-cally separate; therefore, UHs 2 and UHs 3 werecombined as a combined UHs which contains deepgroundwater as a semi-confined and confined aquifer.Priowirjanto (1985) and Arianto (2010) also dividedthe groundwater into two systems: a shallow and a deepgroundwater flow system. The shallow groundwater isfound in an aquitard with local flow. The deep ground-water is allied in a semi-confined and confined aquiferwith an intermediate and regional flow.
For the purposes of this study, the authors also dividedthe groundwater flow system in the Bandung basin intoshallow and deep groundwater flow systems. It was con-sidered that the shallow groundwater is from a combinedaquitard (UHs 1) which can be accessed via dug wells,which will be defined as zone S (see section ‘Model de-scription’). This assumption concurs with all previousstudies. It was also assumed that the deep groundwateris from a combined UHs and is obtained using drilledwells, which will be defined as zone D (see section‘Model description’). This assumption follows the ap-proach of Hutasoit (2009), with the deep groundwaterobtained from interconnected multi-aquifers belonging tothe Cibeureum Formation.
Sampling and methodology
As part of this study, 40 shallow and 65 deep groundwatersamples were collected between May and July 2015. The
samples were collected from springs, dug wells, productionwells, and observation wells. Sampling and field measure-ments were carried out following standard procedures(Wood 1981). Some in situ tests such as temperature, pH,dissolved oxygen (DO), electrical conductivity (EC), and ox-idation–reduction level (ORP) of the water samples were mea-sured in the field with minimal atmospheric contact and byusing a portable meter (WM-32EP, TOA DKK Inc).
All the water samples were collected after purging thewells and were filtered using 0.2-μm cellulose acetate fil-ters (Advantec) before storing. The samples for analysis ofstable isotopes (δ18O and δ2H) and major ions (Na+, K+,Ca2+, Mg2+, Cl−, SO−
4 , HCO−3 ;NO
−3 ) were collected in 100-
ml polyethylene bottles for analyses at the chemical labo-ratory of the Center of Geological Resources, GeologicalAgency of Indonesia. Major cations were analyzed usingMicrowave Plasma-Atomic Emission Spectroscopy (4100MP-AES, Agilent Technologies Inc) and the major anionsusing ion chromatography (DIONEX ICS 1600, ThermoFisher Scientific Inc). The analytical error for major ionsanalyses was typically within 10%. Stable isotopes weremeasured relative to VSMOW (Vienna Standard MeanOcean Water) by using an integrated isotope analyzer(Picarro L2120, Picarro Inc). The analytical error for thestable isotopes analyses was ±0.2% for δ18O and ±1.0% forδ2H.
Chlorofluorocarbons (CFCs) are useful tools for tracingand dating groundwater after 1945 (Busenberg andPlummer 1992; Plummer et al. 2000, 2001) because therelease of CFCs into the atmosphere started after the1940s (USGS 2010). Therefore, CFCs were employed asa marker for young groundwater; consequently, if thesamples possess some dissolved CFCs, it means a fractionof the water had been recharged since 1940. The samplesfor CFCs analyses were collected in triplicate and storedin glass bottles sealed with metal-lined caps (Busenbergand Plummer 1992). The CFCs were analyzed usingclosed-system purge-and-trap gas chromatography andan electron capture detector (GC-2014, Shimadzu Inc) atthe Hydrology Laboratory of Kumamoto University,Japan. The analytical uncertainty associated with theCFC analyses was less than 5%. The values were reportedonly if the concentrations of at least two measurementswere within 10% for concentrations higher than 100 ρg/kg as the detection limit (Johnston et al. 1998).
A numerical groundwater flow model was applied toreveal the fluxes in the rejuvenation processes in theBandung basin. A modular three-dimensional (3D)finite-difference groundwater flow model and structuredrectilinear grid operating system was used—the VisualMODFLOW Classic v.2011 (Waterloo HydrogeologicInc). The model was constructed for a long-term ground-water flow system, from 1950 to 2015.
1266 Hydrogeol J (2018) 26:1263–1279
Results
Groundwater potential
Measurement of shallow and deep groundwater levels wasdone by the basin authority: the Office of Energy andMineral Resources, West Java Province (see unpublishedreport, 2010, in Table 1). The results show that the shallowgroundwater flows correspond with the local topographic pat-tern (Fig. 2a). Shallow groundwater flows from the peripheryto the center of the basin, with levels strongly influenced bythe season and the amount of rainfall. The shallow groundwa-ter level showed very little drawdown or significant variations(Fig. 2b); however, the deep groundwater potential for 2010showed some groundwater depression cones in the textile in-dustry areas such as Cimahi (CMHI), Rancaekek (RCK), andDayeuhkolot (DHYK; Fig. 2b). The results for the deepgroundwater potentials in this study (Fig. 2b) clearly showthat the groundwater depressions have become deeper. In theCMHI area, which has the biggest drawdown, groundwaterlevels dropped from 620 m relative to sea level (sl) in 2010 to610 m sl in 2015. The same phenomenon also occurred in theRCK and DHYK areas, but with smaller drawdowns.
Major ions
Table 2 shows the results of the hydrogeochemical analyses.Figure 3a,b shows the distribution maps of water type classi-fied on the basis of major ions using a Stiff diagram. Thedistribution of shallow groundwater generally shows the waterwas a Ca-HCO3 and Na-HCO3 type only in the center of thisbasin, where flows are slower or stagnant. A Ca-Cl type wasonly found at the southern side of the basin because of prox-imity to a hot spring. In contrast, the distribution map of deepgroundwater shows a different dominant water type, the Na-HCO3 type, but there were some seemingly random occur-rences of the Ca-HCO3 type in all the groundwater depressionareas.
Evaluating the redox processes is an essential tool for un-derstanding geochemical evolution in groundwater systemsaccording to Chapelle et al. (1995). Usually the ORP valueis used to evaluate the redox potential (Lindberg and Runnells1984). Figure 4 shows a geological cross-section with param-eters in line with the flow path. The south to north cross-section (C′–C cross-section) is the most representative cross-section towards the flow path because it crosses the DHYKarea where the magnitude of groundwater drawdown is thesmallest. A redox boundary was found in the deep groundwa-ter at 14 km along this section, marked by a change in theredox level (ORP) of <0 mV, coinciding with a completereaction of oxygen (DO) of 2 mg/l. A change in temperaturewas found near the northern limit of the section: increasingfrom 25 ± 1 °C at a fairly constant rate to 28 ± 1 °C just after
the boundary. The ORP value was also used to indicate aero-bic conditions. That the deep groundwater changes from aer-obic to anaerobic was confirmed by the changes from uncon-fined to confined below the Kosambi Formation.
The deep groundwater indicates more progression in geo-chemical evolution than the shallow groundwater. The clearestexamples are the enrichment of Na+ rather of Ca2+ and themNa/Ca ratio (Fig. 5). The increasing mNa/Cl ratio, an indi-cator of strong rock interaction, is also shown clearly. It can beseen on the distribution maps that the Ca-HCO3 type wasdominant at the periphery of this basin, and changed to theNa-HCO3 type after reaching the center of the basin. Thischange could be explained by the cation exchange reaction(Ca2+⇔Na+; Appelo and Postma 2005). The cation exchangereaction in deep groundwater also occurred in the groundwa-ter flow system of the Osaka basin in Thailand (Yamanakaet al. 2011) and the Jakarta basin in Indonesia (Kagabu et al.2011).
Stable isotopes
Stable isotope ratios of oxygen (δ18O) and hydrogen (δ2H) areideal tracers for identifying the source of groundwater. Theresults presented in Table 2 show that the groundwater sam-ples were almost all within the same range, but the deepgroundwater had a slightly more homogeneous range (−7.4to −3.8% δ18O and −54 to −34% δ2H) than the shallowgroundwater (−7.4 to −3.8% δ18O and −54 to −34% δ2H).These almost identical ranges of values indicate that the shal-low and deep groundwater were recharged at approximatelythe same elevation. These results are in agreement with anal-yses of the groundwater source determined by thetemperature-depth profile that showed the recharge area tobe at the periphery of the basin (Delinom and Suridarma2010).
CFC-12 concentration
CFC-11, CFC-12, and CFC-113 concentrations were mea-sured for all the samples, but only the CFC-12 concentrationwas used as a marker for young groundwater in this studybecause of its stability in the subsurface environment(Plummer et al. 1998). As presented in Table 2, the CFC-12concentration in the shallow groundwater exhibited a widerange (12.2–540.8 pptv). Moreover, some of the shallowgroundwater exceeded the maximum atmospheric concentra-tion (>546 pptv; USGS 2010). For the samples with CFC-12concentrations greater than 546 pptv, it was not possible toevaluate the exact residence time of the groundwater becausethe samples were contaminated by local CFC sources. Thisphenomenon has also been reported in some large cities suchas Las Vegas and New York in the USA, and Beijing in China(Carlson et al. 2011).
Hydrogeol J (2018) 26:1263–1279 1267

1268 Hydrogeol J (2018) 26:1263–1279

Figure 3c,d shows the distribution of CFC-12 concentra-tion (pptv) on the land use map. The shallow groundwaterwith a high CFC-12 concentration indicates a modern(young) groundwater age and that it was recharged after the1940s. This result is consistent with Tritium (3H) analyses thatindicated an apparent age of 12.35–58.38 years (3.13–0.23TU; Sunarwan 2014). In contrast, the deep groundwater hada low CFC-12 concentration, and most of the deep wells hadno CFC-12 or were below the detection limit. This resultagrees with 14C analyses that indicated that the apparent agewas 1,291–35,000 years—Wahyudin Matahelumual 2008;Satrio et al. 2012; and an unpublished report (1990) byGeyh (see Table 1). However, some of the deep groundwatersamples from the groundwater depression areas had highCFC-12 concentrations, indicating that modern (young)groundwater might be recharged to the deeper aquifer.
Discussion
Groundwater flow system of the Bandung basin
This report discusses the groundwater flow system for both theshallow and deep groundwater in theBandung basin based on theresults of all the hydrogeochemical data. According to the resultsof the stable isotope analyses, all the groundwater is recharged atthe periphery of the basin. After recharge, the groundwater flowsare divided into twomajor systems, i.e. shallow and deep ground-water flow systems. This subdivision is consistent with the strat-ification of the local geology. Comparing the distribution map ofwater type with the distribution map of CFC-12 concentrationsfor shallow groundwater, shows that theCa-HCO3 typewith highCFC-12 concentrations occur at the periphery of the basin, whilethe Na-HCO3 typewith lowCFC-12 concentrations occurs in thecenter of the basin (Fig. 3). In addition, for the deep groundwater,the Na-HCO3 type water had low or no CFC-12 concentrations,which indicates a relatively long residence time. Since there wereCa-HCO3 types that appear to be randomly distributed in thegroundwater depression areas, it is assumed that the subsurfaceenvironment has been disturbed. This assumption will be ad-dressed in the following discussion.
Rejuvenation processes
Some high CFC-12 concentrations were found in some of thedeep groundwater samples that were collected in all the
groundwater depression areas—for example, in the CHMIarea approximately 50% of deep wells (10, 2, 3, 5, 6c, 4, 6b,7c, 7, and 7b) had CFC-12 concentrations of more than 100pptv. The samples from all the other depression areas (RCKand DHYK) that also possessed CFC-12 concentrations arepresented in Fig. 4. This reveals that shallow, younger ground-water clearly contributes to the rejuvenation of deep ground-water in the Bandung basin. Furthermore, for each groundwa-ter depression area, the magnitude of groundwater drawdownhas an impact on groundwater mixing that will be discussedfurther in a separate study.
The rejuvenation ratio (R) was calculated as an indicator ofrejuvenation based on 14C activity (in pMC; percent of ‘moderncarbon’) in deep groundwater. At three observation wells, repre-sentative of different depression areas (1, 6, and 8; as presented inFig. 2b) samples had been taken in 2008 and in 2012, as listed inTable 3. The measured pMC activity exhibited an increasingtendency implying that the apparent groundwater age decreasedin 2012. This phenomenon is the so-called ‘rejuvenation’ ofgroundwater age (Stewart et al. 2004; Kagabu et al. 2013). Todiscuss rejuvenation based on the observed 14C activity, R isdetermined as an indicator of rejuvenation (Eq. 1).
R ¼ Rm−Ro
Ro� 100 ð1Þ
In Eq. (1), R (dimensionless) is a ratio between the differenceof 14C activity (pMC) in two different years to concentration atthe initial year, and Ro and Rm (pMC), respectively denote the14C activity in 2008 (initial year) and 2012 (measured year)
Figure 6 shows that R increases with CFC-12 concentra-tion. The strong relationship is an indication that greater shal-low groundwater intrusion provides higher R values—for ex-ample, the CMHI area with the largest groundwater draw-down had the highest average CFC-12 concentration (190pptv) and the highest R (50%). This relationship will be fur-ther investigated by the following numerical modeling.
Groundwater flow modeling
Model description
A 3D model of the groundwater flow system in the Bandungbasin was first accomplished by Hutasoit (2009). The modeldomain covers an area of approximately 4,225 km2. The mod-el is divided into a grid of equally spaced 0.5-km2 cells, with130 grid lines for both rows and columns, and has 16,900 cells(Fig. 7a). The vertical extent of the Bandung basin is repre-sented by two groundwater flow systems that denoted into sixmodel layers (Fig. 7b) and the thickness of each layer repre-sents the hydrogeological layer thickness. Layers L1, L2 andL3 are set as the shallow groundwater system from a com-bined aquitard (defined as zone S). Layer L4, L5 and L6 are
�Fig. 2 Historical change of groundwater potential map for shallow anddeep groundwater in a 2010 and b 2015. There is no significant differencein shallow groundwater for the two periods; however, there are threegroundwater depression areas in deep groundwater (CMHI, RCK, andDHYK area). The analyses of some representative observation wells (1, 6and 8) are presented in Table 2 and Fig. 6, and for all observation wellspresented in Fig. 8
Hydrogeol J (2018) 26:1263–1279 1269

Table 2 Results for chemical and isotopes analyses of shallow and deep groundwater
SampleNo.
Ca2+
(mg/l)Mg2+
(mg/l)Na+
(mg/l)K+
(mg/l)HCO3
−
(mg/l)Cl−
(mg/l)SO4
−
(mg/l)NO3
−
(mg/l)δ18O(%)
δ2H(%)
Temp(°C)
DO(mg/l)
ORP(mV)
CFC-12(pptv)
CFC-12apparentresidencetime (years)
Shallow groundwater1 38.2 38.2 11.1 42.3 0.0 277.4 20.2 9.0 −5.2 −43.0 23.0 4.9 90.0 85.0 39.82 38.1 38.1 11.0 42.4 0.0 278.7 20.4 8.7 −5.2 −43.0 23.0 3.7 90.0 488.0 28.33 38.9 38.9 12.2 46.8 0.0 227.2 13.5 41.8 −5.3 −43.5 24.4 4.1 95.7 – –4 51.0 51.0 18.1 24.0 34.3 121.1 44.4 87.2 −6.9 −42.8 24.9 5.8 191.0 630.8 Contam.5 65.1 65.1 25.5 27.5 42.3 176.4 77.6 104.7 −5.4 −35.0 24.5 6.7 102.0 579.0 Contam.6 55.1 15.5 28.3 11.7 176.2 77.5 104.9 3.9 −6.3 −44.1 25.0 4.3 124.0 327.3 34.96a 62.0 23.1 31.1 6.4 168.4 86.6 43.3 1.4 −5.5 −39.0 24.5 5.2 192.0 9.1 64.87 75.5 75.5 9.1 16.7 3.9 276.7 5.8 3.8 −5.3 −44.0 25.1 3.3 85.0 159.8 24.89 51.1 18.1 23.9 9.4 121.1 44.1 87.2 10.4 −6.9 −42.8 24.8 5.0 84.0 767.9 Contam.10 76.6 9.2 17.0 8.2 280.7 6.0 90.1 1.7 −6.2 −46.8 24.5 4.0 68.2 646.7 Contam.11 52.4 15.5 27.4 10.3 248.1 12.0 49.7 9.0 −5.2 −42.7 23.8 2.9 82.0 192.7 42.311a 52.5 15.5 27.1 10.3 247.9 11.0 49.5 9.0 −5.2 −42.7 23.3 1.8 162.0 646.7 Contam.12 53.8 17.8 61.2 9.0 283.6 33.5 34.3 1.0 −4.9 −41.8 26.1 3.9 130.0 –13 56.6 18.5 76.1 34.4 371.5 91.1 32.5 4.8 −5.3 −45.0 26.5 2.1 116.0 40.4 54.815a 45.2 18.8 31.9 10.2 290.5 20.9 21.8 2.3 – – – – 115.0 692.8 Contam.16 61.2 19.7 89.4 27.2 423.1 111.3 24.5 5.8 −4.9 −41.5 25.5 4.2 107.0 84.7 49.418 55.0 15.3 29.1 11.4 177.0 77.3 104.6 3.9 −5.3 −44.1 23.8 3.5 125.0 1,132.0 Contam.19 62.4 23.1 30.3 6.5 168.3 86.5 43.3 3.3 −4.5 −29.8 24.9 3.5 90.0 250.3 39.820 55.5 14.5 48.1 13.5 310.2 16.8 29.2 1.1 −6.2 −48.5 26.5 3.7 173.0 21.3 59.821a 19.6 11.0 60.1 5.8 251.9 52.3 1.8 1.3 −4.9 −41.8 – 6.6 90.0 58.2 52.323 58.2 22.8 69.7 16.4 385.8 91.2 18.9 1.7 −3.9 −41.5 24.8 2.5 87.0 56.0 52.524 53.9 17.6 61.1 8.9 283.8 33.4 34.5 2.0 −5.5 −48.0 26.0 4.2 174.0 12.2 63.326 54.0 17.6 58.1 8.8 283.8 33.5 34.7 1.1 −4.9 −41.8 – – – – –27 61.1 61.1 25.5 37.4 42.2 176.3 77.1 104.2 −5.4 −35.0 24.1 3.6 4.7 579.0 Contam.28 42.0 16.7 60.2 9.9 176.2 47.2 1.4 1.3 −4.2 −38.4 26.4 1.9 26.4 345.7 33.829 53.4 17.6 61.7 8.9 284.0 33.8 34.6 7.6 −5.0 −43.2 26.5 3.2 132.7 148.8 38.330 55.6 14.9 48.4 13.6 310.9 16.8 29.2 20.7 −6.2 −48.5 27.9 4.0 147.8 – –30a 55.5 14.5 48.1 13.5 310.2 16.8 29.2 1.1 −6.2 −48.5 26.5 4.7 99.5 21.3 59.831 17.7 6.6 11.7 3.5 130.2 4.1 9.6 3.0 −5.6 −35.6 26.9 4.6 124.6 1,276.2 Contam.31a 55.1 55.1 15.5 28.2 42.7 176.2 77.5 103.6 −5.5 −44.9 31.0 100.0 164.5 1972.0a 9.4 9.4 6.9 4.3 0.0 43.6 22.6 1.9 −6.3 −48.0 23.5 5.7 110.8 304.0 33.8a1 17.8 17.8 6.5 11.7 0.0 130.3 4.0 1.7 −5.9 −46.3 23.3 5.4 80.1 110.8 33.8b 9.6 9.6 6.4 4.2 0.0 43.2 22.2 1.9 −6.0 −47.8 22.4 5.5 304.0 80.1 38.3c 9.5 7.0 4.2 1.5 43.4 22.2 1.8 2.1 −6.3 −50.0 24.4 5.2 94.0 225.5 40.8c1 9.5 7.0 4.3 1.5 43.2 22.4 1.9 4.3 −6.3 −50.0 23.4 4.2 180.0 368.6 32.3d 21.1 8.6 12.4 3.7 74.6 54.7 4.6 2.6 −5.3 −44.7 23.0 6.4 248.0 676.2 Contam.d1 20.8 8.6 12.8 3.7 74.5 54.8 4.6 4.0 −5.5 −40.0 22.3 7.9 254.0 676.2 Contam.e 23.0 8.4 20.3 3.6 81.6 71.5 2.8 0.4 −6.5 −54.0 25.1 6.6 107.0 179.3 43.3f 58.9 24.0 27.6 10.5 128.5 122.3 68.3 3.1 −5.7 −49.5 24.2 6.5 94.0 365.7 32.8g 34.0 13.1 16.2 7.9 74.1 69.6 43.1 5.6 −4.3 −40.6 20.9 6.0 147.0 540.8 17.3
Deep groundwater1 23.8 10.7 16.9 7.8 184.7 4.0 8.6 1.6 −5.5 −44.2 24.6 3.8 92.0 0.0 75.92 28.0 13.0 24.0 9.3 219.2 9.8 14.5 1.1 −6.2 −46.6 26.1 5.2 25.5 321.6 35.32a 45.2 18.8 31.9 10.2 290.5 20.9 21.8 0.2 −6.3 −46.9 23.5 3.8 90.1 0.0 75.93 27.9 13.9 23.9 9.2 217.9 9.8 15.2 1.1 −5.6 −44.8 21.9 2.1 66.9 129.5 –4 29.0 13.2 24.9 9.5 219.4 10.0 15.5 1.1 −6.1 −46.5 27.6 3.4 31.2 243.0 40.44a 55.8 23.8 62.5 10.9 205.4 44.2 24.1 1.1 −6.1 −46.5 26.8 3.0 −68.5 0.0 75.95 68.1 26.7 86.3 14.9 295.7 104.6 54.0 1.9 −5.9 −45.5 27.2 4.3 39.3 314.7 35.85a 28.8 12.8 23.8 9.3 217.4 8.8 14.5 3.0 −6.2 −45.6 28.3 2.5 48.1 0.0 75.96 57.0 24.1 63.1 11.5 206.7 45.2 25.2 3.2 −4.7 −39.9 26.4 2.1 −10.8 292.7 36.86a 44.9 19.2 31.9 10.2 289.8 20.7 21.9 0.2 −5.6 −44.6 29.5 1.9 71.9 80.0 49.96b 45.2 19.3 32.6 10.5 290.5 21.9 22.4 1.2 −5.6 −44.6 30.0 5.8 61.3 117.9 46.96c 43.9 18.9 30.9 9.9 288.4 21.7 21.9 1.2 −5.7 −44.7 24.3 2.3 75.7 186.3 42.97 60.8 21.0 73.6 11.2 386.9 31.8 98.1 4.1 −5.9 −40.7 26.7 3.0 −60.4 143.1 45.47a 60.6 20.8 72.9 11.1 385.1 30.4 97.9 3.6 −5.9 −40.8 33.3 6.3 −44.1 86.7 49.47b 60.1 24.0 33.7 9.9 285.8 21.9 13.8 3.6 −6.0 −40.8 32.2 2.7 14.0 126.6 45.47c 45.2 18.8 32.6 10.5 290.5 21.9 22.4 5.3 −6.1 −46.3 25.5 2.7 17.0 169.2 43.88 59.9 23.1 32.5 7.4 279.5 20.9 13.4 4.0 −5.5 −44.2 25.6 2.1 96.0 0.0 75.99 59.9 22.9 32.6 7.5 275.2 20.8 12.7 1.4 −5.4 −38.3 25.6 2.1 51.2 0.0 75.910 60.2 23.2 33.5 8.7 280.9 21.2 13.8 1.3 −6.2 −46.8 28.6 4.1 79.0 405.2 30.311 27.5 13.2 18.2 8.4 126.7 40.5 14.0 2.0 −6.1 −46.6 24.0 3.0 100.0 0.0 75.9
1270 Hydrogeol J (2018) 26:1263–1279

set as the deep groundwater system from a combined aquifer(defined as zone D). The descriptions of zone S are: layer L1 ismade up of volcanic deposits (sandy tuff) on the basin’sslopes, and is part of the upper Cibeureum Formation; layerL2 is a clayey sand layer of the upper Kosambi Formation andspreads only in the center of this basin; and layer L3 is a siltyclay layer, and is part of the lower Kosambi Formation.Meanwhile, for zone D: layer L4 is a sandy silt layer in theupper layers of the Cibeureum Formation, and spreads only inthe central bottom of the basin; layer L5 is a composed oftuffaceous sandstone of the Cibeureum Formation, and forms
the middle aquifer (or UHs 2); layer L6 is composed of tuff-aceous breccia of the Cibeureum Formation, and forms thelowest aquifer (or UHs 3). At the bottom of these layers isbasement rock of the Cikapundung Formation, which is olderand harder, and is set as a no-flow boundary.
The Citarum River was adopted as a constant-head bound-ary because there were very little data about the interactionbetween river water and groundwater. No-flow boundary con-ditions were assumed for the bottom and the outer sides of themodel. The various recharge rates were assigned to the modelgrid at the periphery of this basin as recharge area. For the
Table 2 (continued)
SampleNo.
Ca2+
(mg/l)Mg2+
(mg/l)Na+
(mg/l)K+
(mg/l)HCO3
−
(mg/l)Cl−
(mg/l)SO4
−
(mg/l)NO3
−
(mg/l)δ18O(%)
δ2H(%)
Temp(°C)
DO(mg/l)
ORP(mV)
CFC-12(pptv)
CFC-12apparentresidencetime (years)
11a 60.3 24.1 35.0 10.0 286.0 22.3 14.3 0.6 −6.3 −46.9 24.0 2.9 100.0 224.0 41.312 37.9 19.7 22.0 10.5 305.2 7.8 9.1 2.8 −6.0 −46.7 27.4 3.1 72.0 – –12a 38.8 19.9 22.3 11.9 305.5 8.0 9.1 3.0 −4.6 −38.3 27.0 3.1 38.7 – –12b 39.0 18.7 23.1 11.8 280.7 8.6 9.3 3.0 −4.6 −38.3 29.4 2.0 −32.0 0.0 75.912c 38.9 19.9 22.9 12.0 299.9 8.1 9.2 3.0 −5.4 −42.5 27.8 2.3 −60.4 0.0 75.913 79.1 34.5 187.1 18.5 580.1 140.5 1.5 3.8 −5.8 −44.7 28.3 2.9 −5.2 0.0 75.915 79.3 34.6 188.3 18.6 583.3 141.3 1.6 0.1 −5.5 −44.9 26.1 3.5 −14.0 255.3 39.415a 23.8 8.9 78.7 9.1 302.8 43.8 2.7 2.6 −6.8 −44.0 29.5 2.4 31.2 0.0 75.917 24.4 9.6 79.5 9.2 304.9 43.8 2.7 2.6 −5.5 −49.0 29.4 2.0 −32.0 46.0 53.818 47.3 19.4 111.5 9.2 379.0 123.8 2.8 0.2 −5.1 −45.4 32.2 5.6 −15.2 0.0 75.918a 46.5 19.2 110.5 9.1 375.4 121.7 2.7 0.2 −4.5 −42.8 27.9 4.4 −6.0 27.9 57.819 27.1 11.5 63.6 9.3 321.6 23.5 0.3 0.3 −6.0 −41.7 23.2 3.3 8.0 156.8 44.319b 36.3 20.5 57.1 19.8 612.6 94.4 1.6 1.6 −6.1 −41.0 41.2 2.5 2.0 0.0 75.919c 38.0 18.1 50.8 7.8 298.3 60.7 0.6 0.3 −5.5 −47.0 30.3 2.2 5.0 68.1 50.920 33.2 25.0 55.6 13.6 375.4 42.6 0.8 2.0 −5.4 −45.8 26.5 4.0 99.5 48.3 53.320a 36.1 16.3 49.8 6.5 278.0 44.9 8.3 0.6 −5.8 −48.4 30.4 3.2 45.6 38.6 −60.521 39.2 9.3 13.6 5.0 170.4 0.7 1.2 2.1 −6.3 −51.1 26.0 5.3 171.0 100.3 48.322 39.9 7.4 6.9 3.0 110.6 2.7 0.5 4.0 −6.3 −50.8 24.4 5.6 124.0 302.1 36.922a 39.2 9.2 13.5 5.0 160.8 0.6 1.1 2.0 −6.1 −41.0 29.0 5.3 130.9 120.7 46.923 21.5 8.3 10.5 2.3 157.2 2.0 3.2 3.2 −6.2 −51.5 26.7 4.3 147.2 0.0 75.924 25.2 14.1 16.8 7.1 233.1 1.3 6.4 0.5 −6.1 −48.8 26.5 3.2 132.7 11.7 63.424a 25.2 14.1 16.1 7.1 230.2 1.2 6.3 0.2 −5.4 −45.8 27.9 4.0 159.0 105.7 47.925 36.3 14.9 48.2 6.5 280.1 44.1 8.7 0.5 −6.0 −48.9 24.1 5.5 134.6 238.4 40.327 42.4 19.9 30.2 5.7 323.4 26.0 2.0 0.3 −4.5 −42.8 27.4 7.0 −30.0 0.0 75.928 33.2 13.5 53.1 10.3 308.5 27.0 6.4 6.6 −5.5 −42.9 29.1 3.5 −39.7 0.0 75.928a 32.9 13.4 52.8 10.1 304.6 24.6 6.0 5.7 −4.6 −42.9 27.5 2.8 −13.0 0.0 75.929 16.2 7.5 162.6 22.6 395.0 40.2 6.2 1.1 −5.6 −43.8 27.7 5.0 −19.6 285.1 37.829a 16.2 7.4 162.7 22.6 395.7 40.5 6.4 1.3 −5.6 −43.8 29.3 2.0 0.0 195.0 42.330 30.1 15.1 89.8 11.4 324.3 73.8 2.0 7.4 −5.7 −44.0 28.8 4.9 −5.2 269.5 38.830a 30.6 11.6 35.3 7.0 295.9 2.0 4.8 0.9 −5.7 −44.0 27.6 3.0 −42.2 0.0 75.931 44.4 18.7 31.8 10.2 288.9 20.7 21.7 1.1 −5.9 −42.9 24.5 3.1 150.0 363.8 32.831a 28.2 17.9 54.0 10.7 268.4 18.5 9.3 2.4 −5.4 −43.3 28.1 4.7 −5.2 225.0 40.932 30.2 15.2 89.9 11.5 324.4 74.2 1.9 7.8 −5.0 −42.9 27.5 3.0 −42.2 98.2 48.333 36.2 15.7 47.4 6.2 270.5 40.3 8.3 0.1 −5.8 −48.4 28.3 3.7 105.0 39.1 55.433a 36.1 15.5 48.9 6.3 275.9 44.2 8.1 0.4 −5.8 −48.4 30.9 3.7 18.0 234.8 40.434 23.3 8.6 75.5 9.1 300.7 42.6 2.6 0.4 −6.0 −42.6 27.8 2.3 −60.4 0.0 46.939 24.2 9.6 78.5 8.8 302.7 43.4 2.5 2.5 −6.5 −42.2 26.9 3.2 50.6 0.0 75.940 31.2 15.2 97.9 12.4 326.8 75.2 1.8 5.7 −5.3 −40.7 27.5 2.9 −13.0 300.6 36.941 26.8 15.1 88.8 11.3 320.2 73.8 1.8 2.4 −6.0 −40.6 24.5 3.3 64.4 0.0 75.842 29.1 16.8 95.9 11.6 330.5 74.7 1.8 2.4 −5.5 −42.5 24.5 4.0 −42.2 130.5 45.943 38.2 15.2 99.8 11.3 324.3 74.4 1.8 6.6 −5.8 −40.7 27.5 3.9 −38.7 0.0 75.944 44.1 18.6 31.9 10.1 289.5 18.9 20.9 1.1 −6.1 −46.5 26.1 3.0 188.0 – –45 60.8 13.0 73.7 10.9 388.5 32.0 90.8 1.7 −6.2 −45.6 28.5 2.8 −30.3 0.0 75.846 24.8 11.1 31.2 8.9 250.8 3.9 5.9 0.3 −6.0 −45.5 28.3 3.2 110.0 0.0 75.947 25.1 11.1 31.6 8.9 253.5 4.0 4.0 0.4 −6.5 −45.5 25.0 2.8 124.6 23.2 49.4
Hydrogeol J (2018) 26:1263–1279 1271

entire model domain, recharge was set at 20–100 mm/year,with an absorption coefficient that changed according to land-use change (Nurliana 2009).
Hydraulic parameters and their calibration
For this study, the groundwater flow model was set up usingparameters as presented in Table 4. Hydraulic conductivity(K) and transmissivity (T) were determined initially byHutasoit (2009) from pumping test results and had been cali-bratedwith the groundwater potential distributionmeasured in
1950 representing natural groundwater conditions.Furthermore, in this study, those parameters were calibratedby comparing the computed and observed groundwater poten-tial, as described later. The aquifer was assumed to be anisotropic with fixed vertical and horizontal hydraulic conduc-tivity for each layer, and heterogeneity was represented by anequivalent homogeneous aquifer with anisotropic hydraulicconductivity (i.e. Kx =Ky >Kz).
In the calibration process, the parameters were adjusted to bestfit the long-term fluctuations of groundwater potential by compar-ing the computed and observed groundwater potential for the
Fig. 3 Distribution maps of water type for a shallow groundwater and b deep groundwater; and distribution maps of CFC-12 concentration for c shallowgroundwater and d deep groundwater plotted on a land-use map (Bakorsortanal 2009)
1272 Hydrogeol J (2018) 26:1263–1279

long-term period 1994–2015 (Fig. 8a), and simultaneously thecalculated pumping volumes were obtained. The initial parame-ters were from a previous study (Hutasoit 2009) that had beencalibrated up to 2016, and the final adjusted parameters werealmost the same as the initial ones. The observed groundwater
potential values are from ten observation wells with records ofgroundwater potentials in the deep aquifer (their locations arepresented in Fig. 2b). The relationship between the observedgroundwater potentials and the estimated values at the end of eachyear period is in good agreement, thereby validating the model
Fig. 4 A geological cross section(C′–C, Fig 1) with selectedparameters. The position of theredox boundary is shown by adotted line. The geological crosssection adapted from anunpublished report (2002) by theOffice of Energy and MineralResources - West Java Provinceand LPPM–ITB (see Table 1) isshown at the top with observedgroundwater potentials (dashedlines) for 2015
Hydrogeol J (2018) 26:1263–1279 1273
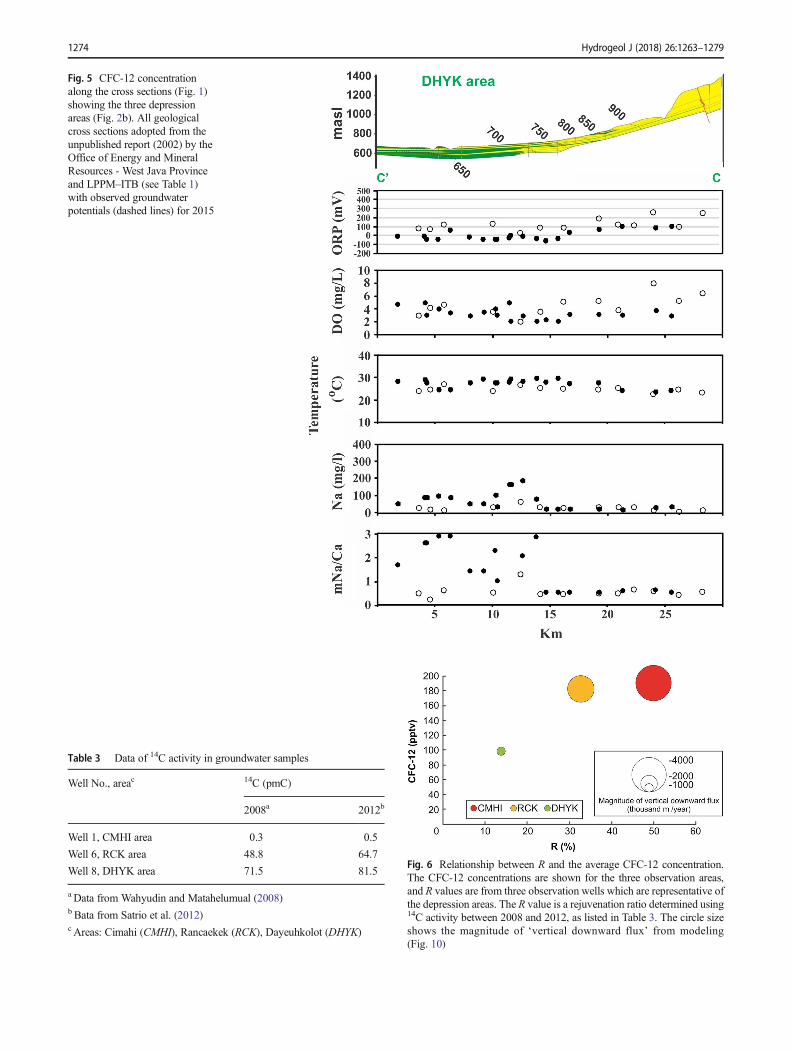
Fig. 5 CFC-12 concentrationalong the cross sections (Fig. 1)showing the three depressionareas (Fig. 2b). All geologicalcross sections adopted from theunpublished report (2002) by theOffice of Energy and MineralResources - West Java Provinceand LPPM–ITB (see Table 1)with observed groundwaterpotentials (dashed lines) for 2015
Table 3 Data of 14C activity in groundwater samples
Well No., areac 14C (pmC)
2008a 2012b
Well 1, CMHI area 0.3 0.5
Well 6, RCK area 48.8 64.7
Well 8, DHYK area 71.5 81.5
a Data from Wahyudin and Matahelumual (2008)b Bata from Satrio et al. (2012)c Areas: Cimahi (CMHI), Rancaekek (RCK), Dayeuhkolot (DHYK)
Fig. 6 Relationship between R and the average CFC-12 concentration.The CFC-12 concentrations are shown for the three observation areas,and R values are from three observation wells which are representative ofthe depression areas. The R value is a rejuvenation ratio determined using14C activity between 2008 and 2012, as listed in Table 3. The circle sizeshows the magnitude of ‘vertical downward flux’ from modeling(Fig. 10)
1274 Hydrogeol J (2018) 26:1263–1279

(Fig. 8b). The calculated groundwater pumping volumes werevery different to the official records of volumes—unpublishedreport (2004) from the Office of Energy and Mineral Resources
- West Java Province, see Table 1. The calculated volumeswere up to 14 times higher than the official volumes inrecent years, as presented in Fig. 9. Similar anomalies were
Fig. 7 a Model grid of the numerical model. The grid comprises 0.5 × 0.5-km2 cells in surficial distribution; b The vertical distribution represents thesubsurface condition along the south to north line (a)
Hydrogeol J (2018) 26:1263–1279 1275

Table 4 Properties of thegroundwater flow model Property Value/set up
Grid size 0.5 × 0.5 km2
Number of grids 130 rows and 130 columns
Layer structure: K, T Zone S, layer L1: K = 4 × 10⁻⁵ m/s, T = 44 m2/day
Zone S, layer L2: K = 1 × 10⁻⁵ m/s, T = 30 m2/day
Zone S, layer L3: K = 8 × 10⁻⁷ m/s, T = 2 m2/day
Zone D, layer L4: K = 1 × 10⁻⁵ m/s, T = 47 m2/day
Zone D, layer L5: K = 5 × 10⁻⁵ m/s, T = 75 m2/day
Zone D, layer L6: K = 1.2 × 10⁻⁵ m/s, T = 50 m2/day
Computation period 1950–2015
Top boundary Flexible head
Bottom boundary No-flow
Initial condition Steady state, without groundwater pumping. Natural groundwater flow (1950)
Calibration data Groundwater potential observations for 1994–2015 at ten representative observation wells
The shallow groundwater system (zone S) consists of three layers (L1, L2, L3) and the deep groundwater system(zone D) also consists of three layers (L4, L5, L6). Hydraulic conductivity (K) has the relation (Kx =Ky =Kz ×10−1 ); T is transmissivity
Fig. 8 a The long-term fluctuation of groundwater potentials (GWL =groundwater level) between the observed (solid line) and estimated(dashed line) values; b The relationship between the observed
groundwater potentials with the estimated values is in good agreement.The observation well locations are presented in Fig. 2b
1276 Hydrogeol J (2018) 26:1263–1279

found in the Jakarta area, with calculated volumes reaching12 times the official volumes (Kagabu et al. 2013). Theseanomalies might be caused by unregistered wells(Braadbaart and Braadbaart 1997) and the fact that manyof the pumping volumes have not been reported in officialdocuments. This is one of the biggest problems in ground-water management in Indonesia. This might also have oc-curred in other Asian cities where there are subsurfaceproblems; therefore, this finding regarding under-reportedpumping volumes could provide valuable information forimproving monitoring and modeling.
Estimated groundwater flux from the simulation model
Water budget analyses were conducted to calculate thevertical downward flux from zones S to D. The changein this flux was estimated for each year during 1950–2015. The change in vertical flux is affected by thechange in groundwater pumping, as shown in Fig. 10.Since the 1970s, the vertical flux has increased signifi-cantly, suggesting that the shallow groundwaterrecharged the deeper aquifer. The flux reached approxi-mately 15% of the total pumping amount during the2000s, compensating the groundwater pumping in theBandung basin. In addition, according to Arianto(2010), this vertical flux phenomenon was also indicatedby pumping tests at some of the deep drilled wells in theBandung basin with leakage factor ranging between0.167 and 1.25 m.
Comparison between observed hydrogeochemicaltracer and estimated vertical flux
In the previous section, the shallow groundwater intrusioncaused by groundwater pumping was estimated using the sim-ulation model. Figure 6 shows the relationship between R andCFC-12 concentration, and also the estimated ‘vertical down-ward flux’ at each depression area. The magnitude of this fluxis expressed as the diameter of a circle. The biggest flux was atthe CMHI area where the biggest drawdown occurred, and theflux is also clearly shown in the other areas. Figure 6 confirmsthat the vertical downward flux in each area affects the mag-nitude of the shallow groundwater intrusion, which is alsoconfirmed by CFC-12 concentrations and R values. Thus,the modeling confirmed the results obtained from the hydro-geochemical techniques, i.e. by observed high concentrationsand by estimating the R of 14C activity.
A similar calculation was applied to the Jakarta area, and itwas found that the vertical flux reached approximately 50%(Kagabu et al. 2013). The differences in flux might be causedby many factors such as the geologic conditions, the magni-tude of groundwater drawdown, the amount of groundwaterpumping, and the number and distribution of deep wells.
Conclusions
The differences between the shallow and deep groundwaterflow systems in Bandung basin were hydrogeochemically
Fig. 9 Comparison ofgroundwater pumping volumebetween the volume from theofficial report (block bar) and thecalculated volume from themodeling (blank bar)
Fig. 10 Calculated groundwaterpumping volume (solid line), andthe vertical downward flux(dotted line) from shallowgroundwater (zone S) to deepgroundwater (zone D) below theBandung basin, from a numericalmodel for period 1950–2015
Hydrogeol J (2018) 26:1263–1279 1277

characterized. The shallow groundwater is generally a Ca-HCO3 type, with high CFC-12 concentrations; however, aNa-HCO3 type was found in the center of the basin whereflow rates are less. Some of the shallow groundwater hadCFC-12 concentrations that exceeded the maximum atmo-spheric concentration, thus indicating that they were contam-inated by local CFC sources. In comparison, the deep ground-water was a Na-HCO3 type with low CFC-12 concentrations;in fact, most of the deep groundwater wells had no CFC-12 orwere below the detection limits. Stable isotopes analyses re-vealed that both groundwater systems were recharged fromthe periphery of the basin; however, the deep groundwatershowed more progression in terms of geochemical evolutionthan the shallow groundwater.
Significant groundwater drawdown has caused age rejuve-nation processes in all the groundwater depression areas.These processes were identified by evidence of the observedCFC-12 concentration in the deep groundwater, which can bean indicator of young age. The rejuvenation ratio R was de-termined using the observed 14C activity at representative ob-servation wells between 2008 and 2012 and showed goodcorrelation with the CFC-12 concentrations, increasing asCFC-12 concentrations rose. This correlation was confirmedby the vertical downward flux obtained from modeling.Furthermore, this ‘vertical downward flux’ was greater inthe groundwater depression area and in the shallower part ofthe deep aquifer, affecting the magnitude of the shallowgroundwater intrusion. This increase of flux is caused by ex-cessive groundwater pumping corresponding to industrializa-tion occurring in the Bandung basin. Since the 1970s, thisvertical flux has increased significantly and reached approxi-mately 15% of the total pumping amount during the 2000s.The vertical flux model result confirmed the results of otherapproaches using hydrogeochemical techniques, i.e. by ob-served high CFC-12 concentrations and by the estimated Rfrom 14C activity.
This study clearly reveals the rejuvenation processes in theBandung basin by combining multiple hydrogeochemical tech-niques and numerical modeling. The magnitude of shallow(young) groundwater intrusion into the deeper aquifer is tracedsystematically by hydrogeochemical markers, the estimation ofR, and groundwater fluxmodeling. The groundwater potential isexpected to decline further, and the deeper groundwater is ex-pected to be even more affected by shallow groundwater that ishighly polluted by urban and industrial contaminants. Thusthere is an urgent need for better monitoring and a reductionof the excessive pumping by either securing alternative waterresources or introducing pumping regulations.
1278 Hydrogeol J (2018) 26:1263–1279
Open Access This article is distributed under the terms of the CreativeCommons At t r ibut ion 4 .0 In te rna t ional License (h t tp : / /creativecommons.org/licenses/by/4.0/), which permits unrestricted use,distribution, and reproduction in any medium, provided you give
appropriate credit to the original author(s) and the source, provide a linkto the Creative Commons license, and indicate if changes were made.
References
Abidin HZ, Andreas H, Gamal M, Wirakusumah AD, Darmawan D,Deguchi T, Maruyama Y (2008) Land subsidence characteristicsof Bandung basin, Indonesia, as estimated from GPS and InSAR.J Appl Geodesy 2:167–177
Appelo CAJ, Postma D (2005) Ion exchange. In: Appelo CAJ, Postma D(eds) Geochemistry, groundwater and pollution. Balkema, Leiden,The Netherlands, pp 241–309
Arianto SS (2010) The study of inter aquifer transfer through aquiferleakage phenomenon in Bandung groundwater basin (inIndonesian). MSc Thesis, Bandung Institute of Technology (ITB),Bandung, Indonesia
Bakorsotanal (2009) Land use map, sub Bandung region, scale 1: 50.000.Agency of Geospatial Information, Republic of Indonesia, Jakarta
Braadbaart O, Braadbaart F (1997) Policing the urban pumping race:industrial groundwater overexploitation in Indonesia. WorldDevelop 25(2):199–210
Busenberg E, Plummer LN (1992) Use of chlorofluorocarbons (CCl3F2and CCl2F2) as hydrologic tracers and age-dating tools: the alluviumand terrace system of central Oklahoma. Water Resour Res 28:2257–2283
Carlson MA, Lohse KA, McIntosh JC, McLain JET (2011) Impacts ofurbanization on groundwater quality and recharge in a semi-aridalluvial basin. J Hydrol 409(1–2):196–211. https://doi.org/10.1016/j.jhydrol.2011.08.020
Chapelle FH, McMahon PB, Dubrovsky NM, Fujii RF, Oaksford ET,Vroblesky DA (1995) Deducing the distribution of terminalelectron-accepting processes in hydrologically diverse groundwatersystems. Water Resour Res 31(2):359–371
Dai Z, Keating E, Gable CW, Levitt D, Heikoop J, Simmons A (2010)Stepwise inversion of a groundwater flow model with multi-scaleobservation data. Hydrogeol J 18:607–624. https://doi.org/10.1007/s10040-009-0543-y 2010
Dai Z, Keating E, Bacon D, Viswanathan H, Jordan SP, Pawar AR (2014)Probabilistic evaluation of shallow groundwater resources at a hy-pothetical carbon sequestration site. Scientific Reports. https://doi.org/10.1038/srep04006
DelinomRM, SuridarmaA (2010) Groundwater flow system of Bandungbasin based on hydraulic head, subsurface temperature, and stableisotopes (in Indonesian). J Geologic Mining Res 20(1):55–68
Foster SSD, Chilton PJ (2003) Groundwater: the process and global sig-nificance of aquifer degradation. Philosoph Trans Royal SocLondon Ser B 358:1957–1972
Hosono T, Delinom R, Nakano T, Kagabu M, Shimada J (2011)Evolution model of δ34S and δ18O in dissolved sulfate in volcanicfan aquifers from recharge to coastal zone and through the Jakartaurban area, Indonesia. Sci Total Environ 409:2541–2554
Hutasoit LM (2009) Groundwater condition of Bandung area, with andwithout artificial recharge: numerical simulation results (inIndonesian). Indo J Geosci 4:1777–1188
Johnston CT, Cook PG, Frape SK, Plummer LN, Busenberg E, BlackportRJ (1998) Ground water age and nitrate distribution within a glacialaquifer beneath a thick unsaturated zone. GroundWater 36:171–180
Kagabu M, Shimada J, Delinom R, Tsujimura M, Taniguchi M (2011)Groundwater flow system under a rapidly urbanizing coastal city asdetermined by hydrogeochemistry. J Asian Earth Sci 40:226–239
Kagabu M, Shimada J, Delinom R, Toshio Nakamura T, Taniguchi M(2013) Groundwater age rejuvenation caused by excessive urban

pumping in Jakarta area, Indonesia. Hydrolog Processes 27:2591–2604. https://doi.org/10.1002/hyp.9380
Lindberg RD, Runnells DD (1984) Ground water redox reactions: ananalysis of equilibrium state applied to Eh measurements and geo-chemical modeling. Science 225:925–927
Nurliana, L (2009) Groundwater recharge study in Citarum upper water-shed (in Indonesian). PhD Thesis, Bandung Institute of Technology(ITB), Bandung, Indonesia
Onodera S, Saito M, Sawano M, Hosono T, Taniguchi M, Shimada J,Umezawa Y, Lubis RF, Buapeng S, Delinom R (2009) Effects ofintensive urbanization on the intrusion of shallow groundwater intodeep groundwater: examples from Bangkok and Jakarta. Sci TotalEnviron 407:3208–3217
Plummer LN, Busenberg E, Drenkard S, Schlosser P, McConnell JB,Michel RL, Ekwurzel B, Weppernig R, McConnell JB, Michel RL(1998) Flow of river water into a karstic limestone aquifer-2, datingthe young fraction in groundwater mixtures in the upper Floridanaquifer near Valdosta, Georgia. Appl Geochem 13:1017–1043
Plummer LN, Rupert MG, Busenberg E, Schlosser P (2000) Age ofirrigation water in ground water from the eastern Snake River plainaquifer, south-central Idaho. Ground Water 38:264–283
Plummer LN, Busenberg E, Böhlke JK, Nelms DL,Michel RL, SchlosserP (2001) Groundwater residence times in Shenandoah NationalPark, Blue Ridge Mountains, Virginia, USA: a multi-tracer ap-proach. Chem Geol 179:93–111
Priowirjanto, G.H (1985) Untersuchungen zur Hydrogeologie desBandung-Beckens und zur Wassergewinnung der Stadt Bandungmit Hilfe eines mathematischen Modells [Investigations on the hy-drogeology of the Bandung basin and the water production of theCity of Bandung using a mathematical modell]. PhD Thesis,RWTH-Aachen, Germany
Satrio, Paston S., Leong Chung S, Syafalni S (2012) Groundwater dy-namic and its interrelationship with river water of Bandung Basinusing environmental isotopes (δ18O, δ2H, 14C) modern applied sci-ence. Canadian Center of Science and Education, vol 6, no. 11,CCSE, Toronto
Stewart MK, Thomas JT, Norris M, Trompetter V (2004)Paleogroundwater in the Moutere gravel aquifers near Nelson,New Zealand. Radiocarbon 46:517–529
Sunarwan, B (2014) Hydro-stratigraphy study for volcanic deposit inBandung-Soreang groundwater basin, West Java (in Indonesian).PhD Thesis, Bandung Institute of Technology (ITB), Bandung,Indonesia. http://digilib.itb.ac.id/gdl.php?mod=browse&op=read&id=jbptitbpp-gdl-bambangsun-19308&q=sunarwan .Accessed November 2017
Taniguchi M, Shimada J, Fukuda Y, Yamano M, Onodera S, Kaneko S,Yoshikoshi A (2009) Anthropogenic effects on the subsurface ther-mal and groundwater environments in Osaka, Japan and Bangkok,Thailand. Sci Total Environ 407:3153–3164
Taniguchi M, Burnett WC, Ness GD (2008) Integrated research on sub-surface environments in Asian urban areas. Sci Total Environ 404:377–392
Taufiq, A (2010) Land subsidence study for Bandung and surroundingareas (case study area: Dayeuhkolot, Rancaekek and Cimahi) (inIndonesian). MSc Thesis, Bandung Institute of Technology (ITB),Bandung, Indonesia
USGS (2010) The Reston Groundwater Dating Laboratory. http://water.usgs.gov/lab/software/air_curve/. Accessed November 2017
Umezawa Y, Hosono T, Onodera S, Siringan F, Buapeng S, Delinom R,Yoshimizu C, Tayasu I, Nagata T, Taniguchi M (2008) The sourceand mechanisms controlling nitrate and ammonium contaminationsin groundwater at developing Asian-mega cities, metro manila,Bangkok and Jakarta. Sci Total Environ 407:3219–3231
Wahyudin Matahelumual BC (2008) Hydrogeology Research with iso-topes and hydro chemical method in Bandung-Soreang groundwaterbasin. Directorate of Environmental Geology; Ministry of Energyand Mineral Resources, Jakarta,Indonesia
Wangsaatmaja S, Sutadian AD, Prasetiati MAN (2006) A review ofgroundwater issues in the Bandung Basin, Indonesia: managementand recommendations. Int Rev Environ Strategies 6(2). https://pub.iges.or.jp/pub/review-groundwater-issues-bandung-basin.November Accessed 2017
Wirakusumah AD, Danaryanto H (2004) Groundwater management inIndonesia case study: groundwater conservation in Jakarta,Bandung and Semarang. 41st Coordinating Committee forGeoscience Programmes in East and Southeast Asia (CCOP),Tsukuba, Japan
WoodWW (1981) Guidelines for collection and field analysis of ground-water samples for selected unstable constituents. US Geol SurvTechniques Water Resour Invest, book 1, chap D2
Yamanaka T, Mikita M, Lorphensriand O, Shimada J, Kagabu M, IkawaR, Tsujimura M (2011) Anthropogenic changes in confined ground-water flow system in the Bangkok Basin, Thailand, part II: howmuch water has been renewed? Hydrol Process 25:2734–2741
YamanoM, Goto S, Miyakoshi A, Hamamoto H, Lubis RF, Monyrath V,Taniguchi M (2009) Reconstruction of the thermal environmentevolution in urban areas from underground temperature distribution.Sci Total Environ 407:3120–3128
Hydrogeol J (2018) 26:1263–1279 1279