impact of exchange rate volatility on commodity trade between u.s. and china: is there a third...
TRANSCRIPT

Impact of exchange rate volatility on commodity tradebetween U.S. and China: is there a third country effect
Mohsen Bahmani-Oskooee & Jia Xu
Published online: 6 April 2010# Springer Science+Business Media, LLC 2010
Abstract Impact of exchange rate uncertainty on trade flows still continues to dominatethe literature. Most previous research has used aggregate trade data between one countryand the rest of the world or between two countries at a bilateral level. A recent study,however, considered the trade between the U.S. and China at the commodity level, butexcluded the “third-country” effect in its analysis. In this paper, we consider thecommodity trade between the U.S. and China one more time and investigate whethervolatility of the real U.S. dollar-Canadian dollar has any implication on the trade flowsbetween the U.S. and China. The answer happens to be in the affirmative, though a moresignificant third-country effect is found in the short run as compared to the long run.
Keywords Exchange Rate Volatility . China . The U.S. . Canada . Industry Data
JEL Classification F31
1 Introduction
Since the late 1970s when China adopted some liberalization measures to boost hertrade and some elements of free-market economy to improve her standard of living,
J Econ Finan (2012) 36:555–586DOI 10.1007/s12197-010-9126-y
Mohsen Bahmani-Oskooee is Patricia and Harvey Wilmeth Professor of economics and director of theCenter for Research on International Economics at the University of Wisconsin-Milwaukee. Jia Xu is adoctoral student in the department of economics at the University of Wisconsin-Milwaukee.
Valuable comments of an anonymous referee as well as those of the editor are greatly appreciated withoutimplicating them.
M. Bahmani-Oskooee (*) : J. XuThe Center for Research on International Economics, The University of Wisconsin-Milwaukee,Milwaukee, WI 53201, USAe-mail: [email protected]
M. Bahmani-Oskooee : J. XuThe Department of Economics, The University of Wisconsin-Milwaukee, Milwaukee, WI 53201, USA

it has become one of the major trading partners of the U.S. In 1978, the U.S. exportsto China were in the magnitude of almost 816 million dollars, exceeding her importsfrom China in tune of 356 million dollars. However, in 2006, the last year for whichdata were available, that trend has shifted in favor of China. In that year, the U.S.exported about 51 billion dollars while she imported 306 billion dollars. During thesame period, the yuan has fluctuated against the U.S. dollar from 1.684 yuan perdollar to 7.973 yuan per dollar.1
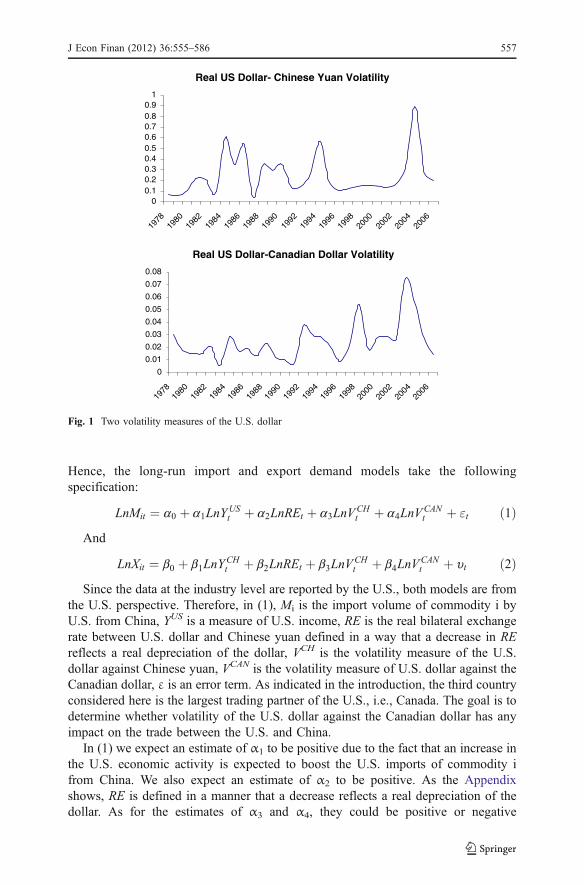
A glance through the monthly obervations of the yuan-dollar real exchange rateindicate some degree of volatility, as reflected in Fig. 1. In addition to the realdepreciation of the yuan against the U.S. dollar which could influence China’sexports to and imports from the U.S., the volatility of the yuan-dollar exchange ratecould also affect the trade flows between the two countries. Could part of theincreased trade between the U.S. and China be also due to exchange rate volatilitybetween the U.S. dollar and the Canadian dollar? As reflected in Fig. 1, thisvolatility has also been erratic during the period of 1978–2006 and could giveincentive to traders in the U.S. to shift their imports or exports from Canada toChina. This third country effect was originally recognized by Cushman (1983, 1986)who investigated the impact of exchange rate uncertainty on bilateral trade flows ofseveral industrial countries. Concentrating on the floating exchange rate period andthe U.S.-Canadian trade, Cushman (1986) found a significantly positive effect ofexchange rate uncertainty on U.S. exports to Canada. However, this significantlypositive effect disappeared when the third-country effect was included in theanalysis. Thus, it appears that excluding the third-country effect could haveimplications on the results.
In a recent article, Bahmani-Oskooee and Hegerty (2007) investigated the impact ofvolatility of the yuan-dollar rate on commodity trade between the U.S. and China. Outof 88 industries considered, they showed that imports and exports of 38 indistrues wereaffected significantly in the short run. In the long run, however, while 36 of China’sexporting industries were significantly affected, only 33 of her importing industrieswere affected. Following Cushman’s (1986) analysis, we wonder if including the third-country effect in Bahmani-Oskooee and Wang’s (2007) models will change theirfinding in one direction or another.2 To this end, we introduce the models and themethodology in Section 2. Section 3 reports the results and Section 4 concludes.
2 The models and methods
To investigate the imact of exchange rate volatility on trade flows, every studyexpresses the volume of imports and exports as a function of a scale variable andrelative prices in addition to a measure of exchange rate volatility. Since our goal isto include a third-country effect, we add the volatility measure of the real U.S.dollar-Canadian dollar to Bahmani-Oskooee and Wang’s (2007) specifications.
1 For more on China’s reform policies see Zhang (1999).2 A review article by Bahmani-Oskooee and Hegerty (2007) shows that as a matter of fact, most studieshave ignored the third-country effect in the literature.
556 J Econ Finan (2012) 36:555–586
Hence, the long-run import and export demand models take the followingspecification:
LnMit ¼ a0 þ a1LnYUSt þ a2LnREt þ a3LnV
CHt þ a4LnV
CANt þ "t ð1Þ
And
LnXit ¼ b0 þ b1LnYCHt þ b2LnREt þ b3LnV
CHt þ b4LnV
CANt þ ut ð2Þ
Since the data at the industry level are reported by the U.S., both models are fromthe U.S. perspective. Therefore, in (1), Mi is the import volume of commodity i byU.S. from China, YUS is a measure of U.S. income, RE is the real bilateral exchangerate between U.S. dollar and Chinese yuan defined in a way that a decrease in REreflects a real depreciation of the dollar, VCH is the volatility measure of the U.S.dollar against Chinese yuan, VCAN is the volatility measure of U.S. dollar against theCanadian dollar, ε is an error term. As indicated in the introduction, the third countryconsidered here is the largest trading partner of the U.S., i.e., Canada. The goal is todetermine whether volatility of the U.S. dollar against the Canadian dollar has anyimpact on the trade between the U.S. and China.
In (1) we expect an estimate of α1 to be positive due to the fact that an increase inthe U.S. economic activity is expected to boost the U.S. imports of commodity ifrom China. We also expect an estimate of α2 to be positive. As the Appendixshows, RE is defined in a manner that a decrease reflects a real depreciation of thedollar. As for the estimates of α3 and α4, they could be positive or negative
Real US Dollar- Chinese Yuan Volatility
00.10.20.30.40.50.60.70.80.9
1
1978
1980
1982
1984
1986
1988
1990
1992
1994
1996
1998
2000
2002
2004
2006
Real US Dollar-Canadian Dollar Volatility
0
0.01
0.02
0.03
0.04
0.05
0.06
0.07
0.08
1978
1980
1982
1984
1986
1988
1990
1992
1994
1996
1998
2000
2002
2004
2006
Fig. 1 Two volatility measures of the U.S. dollar
J Econ Finan (2012) 36:555–586 557

depending on the risk-taking position of traders. An increase in volatility of the U.Sdollar-yuan rate could introduce uncertainty about the future prices and profitshurting trade today. On the other hand, the same volatility could induce traders totrade more in order to avoid loss of profit and income in the future. The same couldapply to volatility of the U.S. dollar-Canadian dollar. Increased volatility couldintroduce more uncertainty which in turn, could intice U.S. traders to divert tradefrom Canada to China. Alternatively, increased U.S. dollar-Canadian dollar volatilitycould provide opportunities for traders to capitalize on the situation and divert tradefrom China to Canada.
Shifting to the export demand model (2), Xi denotes the U.S. export of commodityi to China which is expected to depend positively on Chinese income (YCH) andnegatively on the real exchange rate, RE. Therefore, we expect estimates β1 and β2
to be positive and negative respectively. Following the same argument as above, theestimates of β3 and β4 could be negative and positive.
In line with Bahmani-Oskooee and Wang’s (2007) approach, we also try todistinguish the short-run effects of all right-hand side variables in (1) and (2) fromtheir long-run effects on the trade flows by specifying these models in error-correction modeling formats. Like them, we follow Pesaran et al.’s (2001) boundstesting approach as in (3) and (4) below:
ΔLnMit ¼ c0 þXn1
k¼1
c1k ΔLnMit�k þXn2
k¼0
c2k ΔLnYUSt�k þ
Xn3
k¼0
c3k ΔLnREt�k þXn4
k¼0
c4k ΔLnVCHt�k
þXn5
k¼0
c5k ΔLnVCANt�k þd0LnMit�1 þ d1LnY
USt�1 þ d2LnREt�1 þ d3LnV
CHt�1 þ d4LnV
CANt�1 þ mt
ð3Þ
And
ΔLnXit ¼ d0 þXn1
k¼1
d1k ΔLnXit�k þXn2
k¼0
d2k ΔLnYCHt�k þ
Xn3
k¼0
d3k ΔLnREt�k þXn4
k¼0
d4k ΔLnVCHt�k
þXn5
k¼0
ΔLnVCANt�k þl0LnXit�1 þ l1LnY
CHt�1 þ l2LnREt�1 þ l3LnV
CHt�1 þ l4LnV
CANt�1 þ xt
ð4ÞThe advantage of the bounds testing approach is that there is no need for pre-unit
root testing and variables could be a combination of stationary and non-stationaryvariables. Pesaran et al. (2001) account for stationary and non-stationarity when theyapply the F test for joint significance of the lagged level variables in each model as asign of cointegration. An upper bound new critical value is tabulated by Pesaran etal. (2001) by assuming all variables to be non-stationary. Similarly, when all thevariables are assumed to be stationary, they tabulate a lower bound critical value. Toestablish cointegration, the calculated F statistic must be greater than the upperbound critical value. Another advantage of specifications (3) and (4) are that theyprovide the short-run and the long-run effects in one estimation step. For example,concentrating on the effects of VCH on imports while the short-run effects areinferred by the estimates of c4k’s in model (3), its long-run effects are judged by the
558 J Econ Finan (2012) 36:555–586

estimate of δ3 normalized on δ0. The same interpretation applies for other variablesin both models (3) and (4).3
3 The results
Error-correction models (3) and (4) are estimated for 101 industries that tradebetween the U.S. and China, using annual data over the period 1978–2006. Theupdated data is longer than the period considered by Bahmani-Oskooee and Wang(2007) by 2 years and includes 13 additional industries for which the revised data setis complete. Like Bahmani-Oskooee and Wang (2007) and many others, we imposea maximum of four lags on each first differenced variable and use Akaike’sInformation Criterion (AIC) to select the optimum number of lags in each model. Wethen report selected results for each industry from each optimum model. Consideringmodel (3) first, the results are reported in Tables 1, 2 and 3.
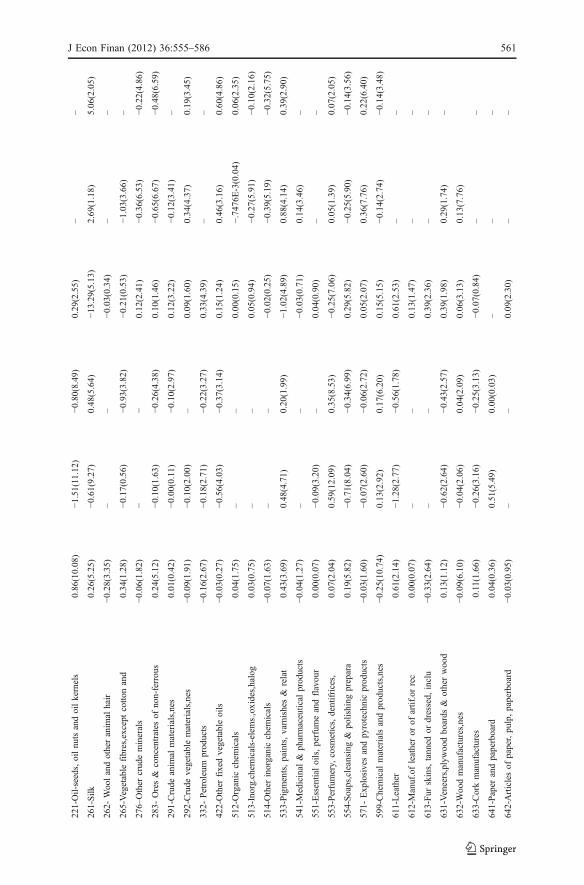
Table 1 includes only the short-run coefficient estimates. However, due to volumeof results we only report the short-run coefficient estimates of two exchange-ratevolatility measures. From these results we gather that the real U.S. dollar-Chineseyuan volatility (VCH) carries at least one lagged significant coefficient at the 10%level in 87 out of 101 industries, implying that the U.S. imports (or Chinese exports)of most industries are affected by their own exchange rate uncertainty. The real U.S.dollar-Canadian dollar volatility measure (VCAN) carries at least one significantcoefficient in 88 of 101 industries, implying that indeed, the third country effect is inforce and has implication on the U.S. imports from China. What remains to be seenis whether these significant short-run effects are transitory or if they last into the longrun. To answer this question, we shift to Table 2.
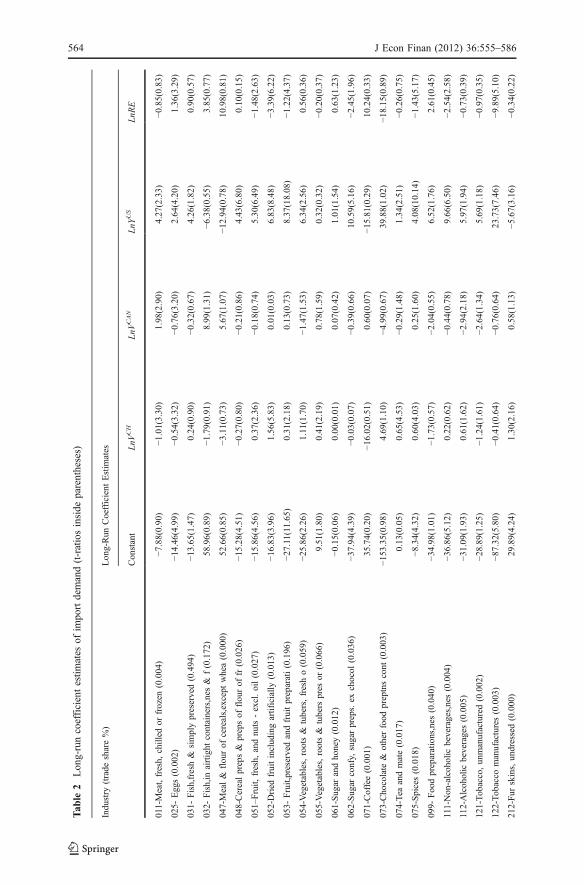
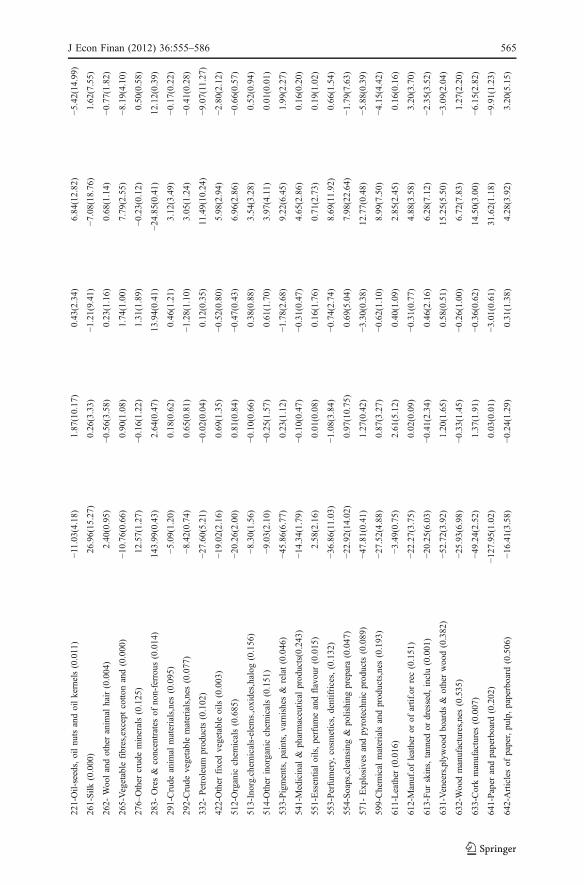
Table 2 reports the long-run coefficient estimates for all variables. As can be seen,the VCH variable carries a significant coefficient, at least at the 10% level, in only 44industries. Furthermore while the estimated coefficient is negative in 20 cases, it ispositive in the remaining 24 industries. However, the VCAN measure of volatilitycarries a significant coefficient only in 27 cases. More precisely, in 16 industriescoded 011, 221, 276, 514, 551, 553, 554, 613, 656, 665, 698, 711, 812, 842, 861,861, and 896 the long-run effect is positive impying that volatility of the U.S. dollaragainst the Canadian dollar induces U.S. importers to import more from China. Onthe other hand in 11 industries coded 025, 112, 261, 533, 553, 653, 841, 864, 893,894, and 895 the effect is negative. In sum, it appears that while the third countrymeasure of exchange rate volatility has short-run effects on the majority of the U.S.importing industries from China, the short-run effects last into the long run in only25% of the industries which all together do have almost 25% of the market share.4
Majority of the affected industries happen to be small as measured by their marketshare. The only large industries that are affected by third-country effect is 841
4 Note that the market share of each industry is reported inside the parenthesis next to the name of eachindustry in Tbale 2. For example, 0.494 as market share of industry 031 means that this industry hasalmost 0.5% (not 5%) market share. These shares are defined as the ratio of each industry’s imports as apercent of total U.S. imports from China.
3 For other applications of this approach see Siddiki (2000), Boyd et al. (2001), Bahmani-Oskooee et al. (2005),Halicioglu (2007), Tang (2007), Mohammadi et al. (2008), and Bahmani-Oskooee and Bolhasani (2008).
J Econ Finan (2012) 36:555–586 559

Tab
le1
Short-run
coefficientestim
ates
oftheU.S.Im
portDem
andfrom
model
3(absolutevalueof
t-ratio
sinside
parentheses)
Industry
Short-Run
Coefficient
Estim
ates
ΔLnV
CH
tΔLnV
CH
t�1
ΔLnV
CH
t�2
ΔLnV
CAN
tΔLnV
CAN
t�1
ΔLnV
CAN
t�2
011-Meat,fresh,
chilled
orfrozen
−0.73(5.66)
––
0.16(0.88)
−0.87(4.42)
−0.76(4.58)
025-
Eggs
−0.20(3.80)
0.39(5.48)
0.34(5.55)
−0.07(0.98)
0.41(4.81)
0.20(3.02)
031-
Fish,fresh&
simplypreserved
0.08(1.32)
––
0.20(2.65)
––
032-
Fish,in
airtight
containers,nes
&f
−0.37(5.53)
−0.50(6.68)
−0.31(3.74)
0.44(4.65)
−0.81(4.80)
−0.24(2.33)
047-Meal&
flourof
cereals,except
whea
0.52(2.67)
0.96(4.66)
−0.89(3.76)
−2.20(5.32)
−0.89(3.02)
048-Cerealpreps&
prepsof
flourof
fr−0
.01(0.31)
0.10(4.52)
–−0
.07(1.99)
––
051–Fruit,
fresh,
andnuts-excl.oil
0.04(0.88)
−0.12(2.78)
–0.09(1.85)
0.30(6.22)
–
052-Dried
fruitincludingartificially
0.62(6.06)
−1.16(4.53)
−0.44(3.51)
−0.20(1.82)
0.31(2.62)
–
053-
Fruit,preservedandfruitpreparati
−0.06(1.26)
−0.32(5.40)
−0.21(4.56)
0.13(2.20)
0.08(1.32)
–
054-Vegetables,roots&
tubers,fresho
0.22(2.90)
−0.17(1.96)
−0.17(2.13)
−0.16(1.79)
0.41(3.16)
0.24(2.45)
055-Vegetables,roots&
tubers
pres
or0.06(1.79)
−0.19(3.49)
−0.18(4.23)
0.08(1.47)
−0.25(4.81)
−0.13(2.82)
061-Sugar
andhoney
0.04(0.41)
––
−0.00(0.03)
––
062-Sugar
confy,
sugarpreps.ex
chocol
0.05(1.61)
−0.03(0.75)
−0.11(3.13)
0.09(2.16)
0.14(3.20)
0.18(4.82)
071-Coffee
0.40(0.83)
2.63(3.33)
2.51(3.84)
−2.12(3.98)
−0.93(1.87)
–
073-Chocolate
&otherfood
preptnscont
−0.01(0.06)
−0.60(3.74)
–0.41(2.13)
1.23(5.01)
0.65(3.58)
074-Tea
andmate
0.15(4.31)
−0.29(5.20)
−0.14(3.07)
0.03(0.70)
0.21(3.89)
0.07(1.55)
075-Spices
0.19(6.37)
−0.17(2.76)
−0.38(7.06)
0.11(2.99)
−0.15(3.58)
–
099-
Foodpreparations,nes
−0.10(4.28)
0.02(0.49)
0.09(2.90)
−0.09(2.63)
0.17(5.84)
–
111-Non-alcoholic
beverages,nes
0.19(2.44)
0.25(3.36)
–−0
.17(1.89)
−0.20(1.82)
−0.27(3.18)
112-Alcoholic
beverages
0.05(2.47)
−0.01(0.51)
0.18(7.41)
−0.10(3.26)
0.34(6.45)
0.06(1.61)
121-Tobacco,unmanufactured
−0.21(0.90)
––
−0.08(0.28)
1.08(3.21)
1.45(4.94)
122-Tobacco
manufactures
−0.37(1.53)
−0.38(1.64)
–1.60(5.57)
1.31(3.50)
1.18(4.26)
212-Fur
skins,undressed
0.10(0.34)
−1.06(4.27)
–0.53(1.55)
––
560 J Econ Finan (2012) 36:555–586
Industry
Short-Run
Coefficient
Estim
ates
ΔLnV
CH
tΔLnV
CH
t�1
ΔLnV
CH
t�2
ΔLnV
CAN
tΔLnV
CAN
t�1
ΔLnV
CAN
t�2
221-Oil-seeds,oilnutsandoilkernels
0.86(10.08)
−1.51(11.12)
−0.80(8.49)
0.29(2.55)
––
261-Silk
0.26(5.25)
−0.61(9.27)
0.48(5.64)
−13.29(5.13)
2.69(1.18)
5.06(2.05)
262-
Woolandotheranim
alhair
−0.28(3.35)
––
−0.03(0.34)
––
265-Vegetable
fibres,exceptcotto
nand
0.34(1.28)
−0.17(0.56)
−0.93(3.82)
−0.21(0.53)
−1.03(3.66)
–
276–
Other
crudeminerals
−0.06(1.82)
−−
0.12(2.41)
−0.36(6.53)
−0.22(4.86)
283-
Ores&
concentrates
ofnon-ferrous
0.24(5.12)
−0.10(1.63)
−0.26(4.38)
0.10(1.46)
−0.65(6.67)
−0.48(6.59)
291-Crude
anim
almaterials,nes
0.01(0.42)
−0.00(0.11)
−0.10(2.97)
0.12(3.22)
−0.12(3.41)
–
292-Crude
vegetablematerials,nes
−0.09(1.91)
−0.10(2.00)
–0.09(1.60)
0.34(4.37)
0.19(3.45)
332-
Petroleum
products
−0.16(2.67)
−0.18(2.71)
−0.22(3.27)
0.33(4.39)
––
422-Other
fixedvegetableoils
−0.03(0.27)
−0.56(4.03)
−0.37(3.14)
0.15(1.24)
0.46(3.16)
0.60(4.86)
512-Organic
chem
icals
0.04(1.75)
––
0.00(0.15)
−.7476E-3(0.04)
0.06(2.35)
513-Inorg.chem
icals-elem
s.,oxides,halog
0.03(0.75)
––
0.05(0.94)
−0.27(5.91)
−0.10(2.16)
514-Other
inorganicchem
icals
−0.07(1.63)
––
−0.02(0.25)
−0.39(5.19)
−0.32(5.75)
533-Pigments,paints,varnishes&
relat
0.43(3.69)
0.48(4.71)
0.20(1.99)
−1.02(4.89)
0.88(4.14)
0.39(2.90)
541-Medicinal
&pharmaceutical
products
−0.04(1.27)
––
−0.03(0.71)
0.14(3.46)
–
551-Essentialoils,perfum
eandflavour
0.00(0.07)
−0.09(3.20)
–0.04(0.90)
––
553-Perfumery,
cosm
etics,dentifrices,
0.07(2.04)
0.59(12.09)
0.35(8.53)
−0.25(7.06)
0.05(1.39)
0.07(2.05)
554-Soaps,cleansing
&polishing
prepara
0.19(5.82)
−0.71(8.04)
−0.34(6.99)
0.29(5.82)
−0.25(5.90)
−0.14(3.56)
571-
Explosivesandpyrotechnicproducts
−0.03(1.60)
−0.07(2.60)
−0.06(2.72)
0.05(2.07)
0.36(7.76)
0.22(6.40)
599-Chemical
materialsandproducts,nes
−0.25(10.74)
0.13(2.92)
0.17(6.20)
0.15(5.15)
−0.14(2.74)
−0.14(3.48)
611-Leather
0.61(2.14)
−1.28(2.77)
−0.56(1.78)
0.61(2.53)
––
612-Manuf.ofleatheror
ofartif.orrec
0.00(0.07)
––
0.13(1.47)
––
613-Fur
skins,tanned
ordressed,
inclu
−0.33(2.64)
––
0.39(2.36)
––
631-Veneers,plywoodboards
&otherwood
0.13(1.12)
−0.62(2.64)
−0.43(2.57)
0.39(1.98)
0.29(1.74)
–
632-Woodmanufactures,nes
−0.09(6.10)
−0.04(2.06)
0.04(2.09)
0.06(3.13)
0.13(7.76)
633-Corkmanufactures
0.11(1.66)
−0.26(3.16)
−0.25(3.13)
−0.07(0.84)
––
641-Paper
andpaperboard
0.04(0.36)
0.51(5.49)
0.00(0.03)
––
–
642-Articlesof
paper,pulp,paperboard
−0.03(0.95)
––
0.09(2.30)
––
J Econ Finan (2012) 36:555–586 561

Tab
le1
(con
tinued)
Industry
Short-Run
Coefficient
Estim
ates
ΔLnV
CH
tΔLnV
CH
t�1
ΔLnV
CH
t�2
ΔLnV
CAN
tΔLnV
CAN
t�1
ΔLnV
CAN
t�2
651-Textileyarn
andthread
0.17(2.04)
−0.71(3.71)
−0.39(3.03)
0.38(2.76)
––
652-Cottonfabrics,woven
ex.narrow
ors
0.03(0.68)
––
−0.07(1.17)
0.33(4.27)
0.24(3.56)
653-Textfabricswoven
exnarrow
,spec,
−0.03(1.65)
−0.56(13.65)
−0.29(12.60)
0.25(8.64)
0.42(9.44)
0.29(8.58)
654-Tulle,lace,em
broidery,ribbons,t
−0.29(2.65)
––
−0.06(0.42)
––
655-Special
textile
fabricsandrelated
0.06(1.19)
−0.27(3.94)
−0.28(5.09)
−0.02(0.30)
−0.30(4.78)
−0.12(2.18)
656-Made-up
articles,wholly
orchiefly
0.1768(0.01)
−0.27(7.38)
−0.13(5.19)
0.22(7.09)
−0.10(3.97)
–
657-Floor
coverings,tapestries,etc.
0.06(4.05)
––
0.07(3.94)
––
661-Lim
e,cement&
fabr.bldg.mat.-ex
gla
−0.21(3.70)
−0.38(6.14)
–0.38(4.47)
0.14(1.73)
–
663-Mineral
manufactures,nes
0.45(3.85)
−0.68(3.17)
−0.81(5.39)
0.25(2.81)
0.29(2.23)
0.42(4.26)
664-Glass
0.03(0.68)
0.19(3.44)
–−0
.19(2.88)
−0.12(1.84)
−0.15(2.63)
665-Glassware
−0.18(5.31)
−0.11(3.34)
–0.10(2.72)
−0.26(3.94)
−0.10(1.75)
666-Pottery
−0.09(6.76)
−0.04(2.83)
–0.08(5.36)
0.01(0.64)
0.06(3.84)
667-Pearlsandprecious
andsemi-precio
0.56(11.78)
0.54(8.90)
0.16(4.36)
−0.67(10.80)
0.16(2.61)
0.18(4.26)
687-Tin
−0.31(3.51)
––
0.11(0.97)
––
689-Miscell.non-ferrousbase
metals
0.16(3.55)
−0.34(6.79)
−0.10(2.09)
0.18(3.63)
−0.27(4.03)
−0.28(4.77)
692-
Metal
containers
forstorageandtr
0.21(5.22)
0.24(4.64)
0.12(2.72)
−0.16(3.02)
−0.13(2.54)
−0.27(5.59)
694-Nails,screw
s,nuts,bolts,rivetsand
−0.05(0.93)
––
0.12(1.68)
−0.32(3.65)
−0.14(2.22)
695-Toolsforusein
thehand
orin
mac
−0.03(1.64)
−0.06(2.77)
−0.06(2.85)
0.06(2.47)
0.04(1.59)
0.07(2.82)
696-Cutlery
−0.06(1.68)
––
−0.02(0.35)
0.13(2.48)
0.20(3.78)
697-Household
equipm
entof
base
metals
−0.05(1.90)
––
−0.07(2.41)
−0.07(2.62)
−0.08(3.07)
698-Manufacturesof
metal,nes
−0.04(2.16)
−0.12(6.46)
–0.06(2.59)
––
711-Pow
ergeneratin
gmachinery,othert
0.07(2.66)
−0.28(5.61)
−0.07(2.20)
0.13(4.35)
––
714-Officemachines
0.03(0.27)
––
−0.36(1.75)
0.35(1.79)
0.64(3.93)
562 J Econ Finan (2012) 36:555–586

Tab
le1
(con
tinued)
Industry
Short-Run
Coefficient
Estim
ates
ΔLnV
CH
tΔLnV
CH
t�1
ΔLnV
CH
t�2
ΔLnV
CAN
tΔLnV
CAN
t�1
ΔLnV
CAN
t�2
715-Metalworking
machinery
0.10(1.86)
−0.13(2.24)
–0.13(1.94)
0.16(2.34)
0.13(2.28)
717-Textileandleathermachinery
0.24(2.42)
−0.26(2.07)
−0.26(2.36)
0.45(3.47)
––
719-Machinery
andappliances-non
electr
−0.09(2.77)
0.03(0.91)
0.09(3.03)
−0.13(3.60)
−0.08(2.21)
−0.17(5.20)
722-Electricpower
machinery
andsw
itch
−0.11(0.90)
––
0.30(2.26)
––
724-
Telecom
munications
apparatus
0.07(1.09)
−0.18(2.34)
−0.27(3.74)
−0.09(0.96)
−0.26(3.13)
–
725-Dom
estic
electrical
equipm
ent
0.06(1.48)
−0.18(3.71)
−0.16(3.36)
0.08(1.54)
––
726-Elec.apparatusformedic.purp.,radi
−0.03(0.38)
0.27(2.48)
0.41(5.03)
0.11(1.07)
––
729-Other
electrical
machinery
andappa
−0.17(4.66)
−0.11(2.90)
–0.16(3.58)
––
812-Sanitary,plumbing,heatin
g&
lightin
−0.40(9.37)
−0.07(1.68)
–0.09(2.17)
−0.11(2.00)
–
821-Furniture
−0.09(4.62)
––
0.02(0.79)
0.13(4.58)
0.07(2.79)
831-Travelgoods,handbags
andsimilar
0.07(5.03)
−0.09(5.45)
−0.07(4.86)
−0.01(0.40)
0.08(4.13)
0.06(2.96)
841-Clothingexcept
furclothing
0.03(1.62)
−0.16(4.57)
−0.08(2.83)
0.05(1.80)
0.28(6.49)
0.23(6.70)
842-Fur
clothing
andarticlesof
artifi
0.01(0.14)
––
0.37(3.50)
−0.52(4.22)
−0.27(3.11)
851-Footwear
−0.02(1.35)
−0.05(3.12)
−0.04(2.69)
0.02(1.33)
––
861-Scientific,m
edical,optical,m
eas./co
−0.39(8.27)
––
0.25(4.34)
−0.39(6.03)
−0.21(3.85)
862-Photographicandcinematographic
su−0
.33(2.23)
––
0.90(4.16)
−1.59(5.80)
−0.73(3.64)
864-Watches
andclocks
−0.22(3.88)
0.47(3.96)
0.51(4.92)
−0.07(1.00)
0.32(4.03)
–
891-Musical
instruments,sound
recorders
−0.07(1.70)
––
0.09(1.81)
––
892-Printed
matter
−0.02(0.81)
––
−0.06(1.39)
––
893-Articlesof
artificialplastic
mate
−0.01(0.18)
0.27(4.77)
0.21(4.38)
−0.17(3.15)
0.10(2.17)
–
894-Peram
bulators,to
ys,gam
esandsporti
0.03(0.71)
0.07(2.04)
–−0
.09(2.04)
0.34(4.54)
0.16(3.14)
895-Officeandstationery
supplies,nes
0.23(3.39)
––
−0.11(1.52)
0.41(4.59)
0.40(5.29)
896-Works
ofart,collectorspieces
and
−0.37(5.77)
−0.50(7.96)
–0.67(7.04)
0.06(0.62)
0.19(2.37)
897-Jewellery
andgold/silv
er-smith
swa
−0.09(4.17)
0.07(2.14)
0.13(4.79)
−0.05(1.95)
––
899-Manufacturedarticles,nes
−0.03(2.05)
0.11(5.35)
–−0
.01(0.34)
−0.07(3.06)
–
941-Animals,nes-incl.zoo
anim
als,dogs
−0.30(1.97)
−0.34(2.49)
−0.52(3.40)
0.38(2.32)
−2.53(6.66)
−0.97(3.66)
951-Firearm
sof
war
andam
munition
ther
0.17(1.76)
−0.64(4.80)
−0.45(3.84)
−0.06(0.47)
0.77(3.99)
0.32(1.94)
J Econ Finan (2012) 36:555–586 563
Tab
le2
Long-runcoefficientestim
ates
ofim
portdemand(t-ratiosinside
parentheses)
Industry
(trade
share%)
Long-Run
Coefficient
Estim
ates
Constant
LnV
CH
LnV
CAN
LnY
US
LnR
E
011-Meat,fresh,
chilled
orfrozen
(0.004)
−7.88(0.90)
−1.01(3.30)
1.98(2.90)
4.27(2.33)
−0.85(0.83)
025-
Eggs(0.002)
−14.46(4.99)
−0.54(3.32)
−0.76(3.20)
2.64(4.20)
1.36(3.29)
031-
Fish,fresh&
simplypreserved(0.494)
−13.65(1.47)
0.24(0.90)
−0.32(0.67)
4.26(1.82)
0.90(0.57)
032-
Fish,in
airtight
containers,nes
&f(0.172)
58.96(0.89)
−1.79(0.91)
8.99(1.31)
−6.38(0.55)
3.85(0.77)
047-Meal&
flourof
cereals,except
whea(0.000)
52.66(0.85)
−3.11(0.73)
5.67(1.07)
−12.94(0.78)
10.98(0.81)
048-Cerealpreps&
prepsof
flourof
fr(0.026)
−15.28(4.51)
−0.27(0.80)
−0.21(0.86)
4.43(6.80)
0.10(0.15)
051–
Fruit,
fresh,
andnuts-excl.oil(0.027)
−15.86(4.56)
0.37(2.36)
−0.18(0.74)
5.30(6.49)
−1.48(2.63)
052-Dried
fruitincludingartificially
(0.013)
−16.83(3.96)
1.56(5.83)
0.01(0.03)
6.83(8.48)
−3.39(6.22)
053-
Fruit,preservedandfruitpreparati(0.196)
−27.11(11.65)
0.31(2.18)
0.13(0.73)
8.37(18.08)
−1.22(4.37)
054-Vegetables,roots&
tubers,fresho(0.059)
−25.86(2.26)
1.11(1.70)
−1.47(1.53)
6.34(2.56)
0.56(0.36)
055-Vegetables,roots&
tubers
pres
or(0.066)
9.51(1.80)
0.41(2.19)
0.78(1.59)
0.32(0.32)
−0.20(0.37)
061-Sugar
andhoney(0.012)
−0.15(0.06)
0.00(0.01)
0.07(0.42)
1.01(1.54)
0.63(1.23)
062-Sugar
confy,
sugarpreps.ex
chocol
(0.036)
−37.94(4.39)
−0.03(0.07)
−0.39(0.66)
10.59(5.16)
−2.45(1.96)
071-Coffee(0.001)
35.74(0.20)
−16.02(0.51)
0.60(0.07)
−15.81(0.29)
10.24(0.33)
073-Chocolate
&otherfood
preptnscont
(0.003)
−153.35(0.98)
4.69(1.10)
−4.99(0.67)
39.88(1.02)
−18.15(0.89)
074-Tea
andmate(0.017)
0.13(0.05)
0.65(4.53)
−0.29(1.48)
1.34(2.51)
−0.26(0.75)
075-Spices(0.018)
−8.34(4.32)
0.60(4.03)
0.25(1.60)
4.08(10.14)
−1.43(5.17)
099-
Foodpreparations,nes
(0.040)
−34.98(1.01)
−1.73(0.57)
−2.04(0.55)
6.52(1.76)
2.61(0.45)
1 11-Non-alcoholic
beverages,nes(0.004)
−36.86(5.12)
0.22(0.62)
−0.44(0.78)
9.66(6.50)
−2.54(2.58)
112-Alcoholic
beverages(0.005)
−31.09(1.93)
0.61(1.62)
−2.94(2.18)
5.97(1.94)
−0.73(0.39)
121-Tobacco,unmanufactured(0.002)
−28.89(1.25)
−1.24(1.61)
−2.64(1.34)
5.69(1.18)
−0.97(0.35)
122-Tobacco
manufactures(0.003)
−87.32(5.80)
−0.41(0.64)
−0.76(0.64)
23.73(7.46)
−9.89(5.10)
212-Fur
skins,undressed(0.000)
29.89(4.24)
1.30(2.16)
0.58(1.13)
−5.67(3.16)
−0.34(0.22)
564 J Econ Finan (2012) 36:555–586
Industry
(trade
share%)
Long-Run
Coefficient
Estim
ates
Constant
LnV
CH
LnV
CAN
LnY
US
LnR
E
221-Oil-seeds,oilnutsandoilkernels(0.011)
−11.03(4.18)
1.87(10.17)
0.43(2.34)
6.84(12.82)
−5.42(14.99)
261-Silk
(0.000)
26.96(15.27)
0.26(3.33)
−1.21(9.41)
−7.08(18.76)
1.62(7.55)
262-
Woolandotheranim
alhair(0.004)
2.40(0.95)
−0.56(3.58)
0.23(1.16)
0.68(1.14)
−0.77(1.82)
265-Vegetable
fibres,exceptcotto
nand(0.000)
−10.76(0.66)
0.90(1.08)
1.74(1.00)
7.79(2.55)
−8.19(4.10)
276–
Other
crudeminerals(0.125)
12.57(1.27)
−0.16(1.22)
1.31(1.89)
−0.23(0.12)
0.50(0.58)
283-
Ores&
concentrates
ofnon-ferrous(0.014)
143.99(0.43)
2.64(0.47)
13.94(0.41)
−24.85(0.41)
12.12(0.39)
291-Crude
anim
almaterials,nes
(0.095)
−5.09(1.20)
0.18(0.62)
0.46(1.21)
3.12(3.49)
−0.17(0.22)
292-Crude
vegetablematerials,nes
(0.077)
−8.42(0.74)
0.65(0.81)
−1.28(1.10)
3.05(1.24)
−0.41(0.28)
332-
Petroleum
products(0.102)
−27.60(5.21)
−0.02(0.04)
0.12(0.35)
11.49(10.24)
−9.07(11.27)
422-Other
fixedvegetableoils(0.003)
−19.02(2.16)
0.69(1.35)
−0.52(0.80)
5.98(2.94)
−2.80(2.12)
512-Organic
chem
icals(0.685)
−20.26(2.00)
0.81(0.84)
−0.47(0.43)
6.96(2.86)
−0.66(0.57)
513-Inorg.chem
icals-elem
s.,oxides,halog(0.156)
−8.30(1.56)
−0.10(0.66)
0.38(0.88)
3.54(3.28)
0.52(0.94)
514-Other
inorganicchem
icals(0.151)
−9.03(2.10)
−0.25(1.57)
0.61(1.70)
3.97(4.11)
0.01(0.01)
533-Pigments,paints,varnishes&
relat(0.046)
−45.86(6.77)
0.23(1.12)
−1.78(2.68)
9.22(6.45)
1.99(2.27)
541-Medicinal
&pharmaceutical
products(0.243)
−14.34(1.79)
−0.10(0.47)
−0.31(0.47)
4.65(2.86)
0.16(0.20)
551-Essentialoils,perfum
eandflavour(0.015)
2.58(2.16)
0.01(0.08)
0.16(1.76)
0.71(2.73)
0.19(1.02)
553-Perfumery,
cosm
etics,dentifrices,(0.132)
−36.86(11.03)
−1.08(3.84)
−0.74(2.74)
8.69(11.92)
0.66(1.54)
554-Soaps,cleansing
&polishing
prepara(0.047)
−22.92(14.02)
0.97(10.75)
0.69(5.04)
7.98(22.64)
−1.79(7.63)
571-
Explosivesandpyrotechnicproducts(0.089)
−47.81(0.41)
1.27(0.42)
−3.30(0.38)
12.77(0.48)
−5.88(0.39)
599-Chemical
materialsandproducts,nes
(0.193)
−27.52(4.88)
0.87(3.27)
−0.62(1.10)
8.99(7.50)
−4.15(4.42)
611-Leather
(0.016)
−3.49(0.75)
2.61(5.12)
0.40(1.09)
2.85(2.45)
0.16(0.16)
612-Manuf.ofleatheror
ofartif.orrec(0.151)
−22.27(3.75)
0.02(0.09)
−0.31(0.77)
4.88(3.58)
3.20(3.70)
613-Fur
skins,tanned
ordressed,
inclu(0.001)
−20.25(6.03)
−0.41(2.34)
0.46(2.16)
6.28(7.12)
−2.35(3.52)
631-Veneers,plywoodboards
&otherwood(0.382)
−52.72(3.92)
1.20(1.65)
0.58(0.51)
15.25(5.50)
−3.09(2.04)
632-Woodmanufactures,nes(0.535)
−25.93(6.98)
−0.33(1.45)
−0.26(1.00)
6.72(7.83)
1.27(2.20)
633-Corkmanufactures(0.007)
−49.24(2.52)
1.37(1.91)
−0.36(0.62)
14.50(3.00)
−6.15(2.82)
641-Paper
andpaperboard
(0.202)
−127.95(1.02)
0.03(0.01)
−3.01(0.61)
31.62(1.18)
−9.91(1.23)
642-Articlesof
paper,pulp,paperboard
(0.506)
−16.41(3.58)
−0.24(1.29)
0.31(1.38)
4.28(3.92)
3.20(5.15)
J Econ Finan (2012) 36:555–586 565

Tab
le2
(con
tinued)
Industry
(trade
share%)
Long-Run
Coefficient
Estim
ates
Constant
LnV
CH
LnV
CAN
LnY
US
LnR
E
651-Textileyarn
andthread
(0.079)
−0.90(0.10)
1.94(2.49)
1.53(1.51)
3.64(2.43)
−0.99(0.67)
652-Cottonfabrics,woven
ex.narrow
ors(0.084)
−6.52(0.46)
0.06(0.51)
−0.93(0.90)
2.63(0.86)
−0.65(0.36)
653-Textfabricswoven
exnarrow
,spec,(0.202)
−12.95(8.41)
0.84(5.86)
−0.35(2.65)
5.35(13.61)
−1.84(3.76)
654-Tulle,lace,em
broidery,ribbons,t(0.056)
−18.84(4.77)
−0.32(1.23)
−0.12(0.49)
3.10(3.19)
5.52(8.28)
655-Special
textile
fabricsandrelated(0.123)
−14.23(4.55)
0.48(3.05)
0.39(1.55)
5.59(8.88)
−1.16(2.92)
656-Made-up
articles,wholly
orchiefly(1.583)
−1.43(0.28)
0.60(4.33)
1.11(2.07)
4.07(8.59)
−0.93(1.35)
657-Floor
coverings,tapestries,etc.
(0.129)
−0.29(0.49)
0.10(3.33)
0.02(0.39)
1.71(12.72)
0.24(2.85)
661-Lim
e,cement&
fabr.bldg.mat.-ex
gla(0.433)
−19.71(1.91)
0.24(0.47)
1.12(1.54)
7.36(4.34)
−0.91(1.03)
663-Mineral
manufactures,nes(0.282)
−25.36(1.40)
−3.93(2.71)
1.06(0.91)
4.22(1.13)
6.40(2.75)
664-Glass
(0.233)
−29.58(5.68)
−0.39(1.81)
−0.28(0.69)
6.21(5.48)
3.71(5.45)
665-Glassware(0.190)
−12.53(1.96)
−0.57(1.60)
1.20(2.04)
4.59(3.44)
1.29(1.44)
666-Pottery
(0.416)
5.93(0.56)
−0.47(1.42)
0.46(0.72)
−0.36(0.16)
3.23(2.74)
667-Pearlsandprecious
andsemi-precio
(0.069)
74.76(0.72)
−1.58(0.92)
11.87(1.06)
−6.08(0.39)
−1.68(0.71)
687-Tin
(0.016)
6.86(2.48)
−0.28(2.38)
0.29(1.37)
−0.09(0.13)
−0.06(0.13)
689-Miscell.non-ferrou
sbase
metals(0.094)
86.04(0.54)
3.82(0.52)
8.09(0.58)
−16.87(0.48)
14.98(0.54)
692-
Metal
containers
forstorageandtr(0.041)
−30.87(2.95)
−0.57(1.04)
−0.50(0.55)
6.04(2.89)
3.48(1.74)
694-Nails,screw
s,nuts,bolts,rivetsand(0.429)
1.30(0.05)
−0.36(0.39)
4.33(0.91)
8.88(1.33)
−8.33(1.01)
695-Toolsforusein
thehand
orin
mac
(0.410)
−14.35(2.92)
−0.02(0.11)
0.04(0.12)
4.72(5.97)
0.90(1.16)
696-Cutlery
(0.289)
−25.52(2.21)
−0.42(1.16)
−0.88(0.96)
6.22(2.77)
1.32(1.14)
697-Household
equipm
entof
base
metals(1.261)
−23.94(4.83)
−0.58(2.70)
0.31(0.77)
6.54(5.89)
2.02(2.83)
698-Manufacturesof
metal,nes(1.563)
−13.39(2.38)
−0.03(0.24)
0.52(1.74)
4.84(5.81)
1.72(3.31)
711-Pow
ergeneratin
gmachinery,othert(0.230)
−24.04(27.08)
0.41(5.84)
0.11(2.18)
6.97(40.41)
0.28(1.38)
714-Officemachines(16.187)
−60.22(2.59)
−0.45(0.49)
−3.22(1.36)
12.19(2.48)
3.72(1.35)
566 J Econ Finan (2012) 36:555–586

()
Industry
(trade
share%)
Long-Run
Coefficient
Estim
ates
Constant
LnV
CH
LnV
CAN
LnY
US
LnR
E
715-Metalworking
machinery
(0.068)
1.18(0.06)
0.73(0.82)
0.34(0.29)
2.19(0.64)
−0.75(0.41)
717-Textileandleathermachinery
(0.076)
−3.43(0.15)
1.88(0.93)
0.49(0.41)
1.07(0.30)
5.32(2.18)
719-Machinery
andappliances-non
electr(3.114)
−25.75(9.38)
−0.23(1.94)
0.10(0.48)
7.20(13.95)
1.52(4.12)
722-Electricpower
machinery
andsw
itch(2.593)
−18.91(2.65)
−0.55(1.67)
0.41(1.16)
4.89(2.96)
4.11(4.11)
724-
Telecom
munications
apparatus(10.675)
10.42(0.31)
0.93(0.81)
1.28(0.73)
2.10(0.45)
−0.58(0.14)
725-Dom
estic
electrical
equipm
ent(2.442)
−15.76(2.23)
0.62(1.04)
0.25(0.65)
3.62(2.62)
5.27(4.26)
726-Elec.apparatusformedic.purp.,radi(0.074)
−41.65(10.40)
−0.70(2.28)
−0.14(0.49)
9.12(10.88)
2.44(4.13)
729-Other
electrical
machinery
andappa
(2.622)
−26.44(5.54)
−0.41(1.79)
0.42(1.43)
6.03(5.81)
4.86(7.09)
812-Sanitary,plumbing,heatin
g&
lightin
(1.685)
−17.82(2.95)
−1.51(5.03)
1.44(2.85)
4.37(3.36)
5.51(7.73)
821-Furniture
(5.752)
−145.67(0.07)
−20.17(0.05)
−22.14(0.05)
14.07(0.14)
14.11(0.05)
831-Travelgoods,handbags
andsimilar(1.846)
−4.18(1.56)
0.48(4.07)
−0.22(1.25)
3.01(6.70)
0.62(1.36)
841-Clothingexcept
furclothing
(7.768)
−10.20(2.58)
0.83(2.94)
−0.81(2.33)
4.91(4.68)
−0.92(1.02)
842-Fur
clothing
andarticlesof
artifi(0.045)
−1.13(0.20)
−0.00(0.01)
1.10(2.52)
2.20(2.08)
1.02(2.35)
851-Footwear(4.730)
−9.35(2.98)
−0.18(0.76)
0.11(0.73)
2.97(3.79)
3.62(6.73)
861-Scientific,m
edical,optical,m
eas./co(1.403)
5.74(0.43)
−1.45(3.57)
2.32(2.21)
−0.70(0.25)
7.04(5.38)
862-Photographicandcinematographic
su(0.027)
15.97(0.88)
−0.50(1.48)
4.52(3.24)
0.24(0.07)
2.42(1.48)
864-Watches
andclocks
(0.233)
−15.70(3.36)
−0.94(4.11)
−0.54(1.81)
2.17(2.30)
5.47(12.35)
891-Musical
instruments,sound
recorders(3.980)
−22.47(8.03)
−0.15(1.31)
0.18(1.42)
5.57(8.61)
4.22(10.26)
892-Printed
matter(0.527)
−36.47(16.15)
−0.48(3.12)
−0.10(0.77)
8.50(13.39)
2.63(4.77)
893-Articlesof
artificialplastic
mate(2.343)
−19.65(2.91)
−0.55(2.31)
−0.73(2.18)
3.94(3.47)
4.45(7.60)
894-Peram
bulators,to
ys,gam
esandsporti(7.493)
−20.35(5.37)
0.01(0.07)
−1.10(4.05)
4.45(5.93)
3.78(6.50)
895-Officeandstationery
supplies,nes(0.271)
−44.35(3.57)
0.99(1.60)
−3.71(2.48)
8.57(3.33)
1.32(0.78)
896-Works
ofart,collectorspieces
and(0.092)
1.58(0.22)
0.01(0.04)
1.21(2.00)
2.72(1.90)
−1.59(2.04)
897-Jewellery
andgold/silv
er-smith
swa(0.785)
−24.24(11.63)
−0.47(3.32)
0.04(0.30)
6.40(14.67)
1.95(6.41)
899-Manufacturedarticles,nes(1.099)
4.88(0.67)
−0.75(2.89)
0.36(1.24)
0.23(0.14)
2.31(3.84)
941-Animals,nes-incl.zoo
anim
als,dogs
(0.010)
102.91(0.78)
−1.96(0.67)
12.47(0.97)
−14.61(0.66)
5.71(0.84)
951-Firearm
sof
war
andam
munition
ther
(0.013)
−71.43(1.73)
3.61(1.86)
−4.72(1.48)
17.35(1.67)
−6.52(0.86)
J Econ Finan (2012) 36:555–586 567

Tab
le3
Diagnostic
statisticsfortheU.S.Im
portdemandmodel
(3)
Industry
Diagnostics
FECM
t−1
LM
RESE
TCUSU
MCUSU
MSQ
Adj.R2
011-Meat,fresh,
chilled
orfrozen
8.94
−0.95(7.87)
15.87
0.80
SS
0.87
025-
Eggs
7.27
−1.01(7.24)
0.24
3.27
SS
0.73
031-
Fish,fresh&
simplypreserved
1.39
−0.34(3.08)
0.50
0.34
SS
0.72
032-
Fish,in
airtight
containers,nes
&f
9.98
−0.26(8.28)
0.61
0.09
SS
0.84
047-Meal&
flourof
cereals,except
whea
4.10
−0.38(5.29)
3.77
0.67
SS
0.67
048-Cerealpreps&
prepsof
flou
rof
fr1.64
−0.26(3.25)
0.96
0.80
SS
0.59
051–Fruit,
fresh,
andnu
ts-excl.oil
8.08
−0.82(7.64)
2.76
0.06
SS
0.90
052-Dried
fruitincludingartificially
2.54
−1.20(4.47)
5.20
11.99
SS
0.81
053-
Fruit,preservedandfruitpreparati
4.14
−0.95(5.46)
0.03
0.05
SS
0.80
054-Vegetables,roots&
tubers,fresho
3.55
−0.46(5.06)
5.34
1.51
SU
0.49
055-Vegetables,roots&
tubers
pres
or5.60
−0.57(6.18)
0.02
0.14
SS
0.74
061-Sug
arandho
ney
11.12
−1.03(7.80)
3.59
5.59
SS
0.68
062-Sug
arconfy,
sugarpreps.ex
chocol
4.29
−0.34(5.67)
0.04
6.77
SS
0.85
071-Coffee
2.11
−0.25(4.07)
0.42
0.11
SS
0.75
073-Cho
colate
&otherfood
preptnscont
3.95
−0.20(5.26)
0.00
0.58
SS
0.80
074-Teaandmate
5.01
−0.79(5.84)
3.70
1.04
SS
0.70
075-Spices
5.55
−0.81(6.45)
10.00
0.01
SS
0.90
099-
Foodpreparations,nes
2.61
−0.08(4.34)
6.99
0.85
SS
0.74
111-Non-alcoholic
beverages,nes
3.31
−0.70(4.75)
1.30
0.66
SS
0.79
112-Alcoholic
beverages
4.78
−0.19(5.99)
1.53
0.48
SS
0.93
121-To
bacco,
unmanufactured
6.08
−0.64(6.31)
0.25
0.14
SS
0.71
122-To
baccomanufactures
17.35
−1.08(10.86)
1.64
1.13
SS
0.91
568 J Econ Finan (2012) 36:555–586

Tab
le3
(contin
ued)
Industry
Diagnostics
FECM
t−1
LM
RESE
TCUSU
MCUSU
MSQ
Adj.R2
212-Fur
skins,un
dressed
3.40
−0.98(4.53)
1.27
.8658E
-4S
S0.57
221-Oil-seeds,oilnutsandoilkernels
62.33
−1.67(20.89)
0.13
0.84
SS
0.97
261-Silk
20.40
−1.59(11.79)
3.67
0.70
SS
0.90
262-
Woo
landotheranim
alhair
5.23
−0.81(5.52)
1.03
0.30
SS
0.57
265-Vegetable
fibres,exceptcotto
nand
2.19
−0.64(3.73)
1.55
3.02
SU
0.79
276–Other
crudeminerals
7.28
−0.44(7.08)
3.19
0.30
SS
0.80
283-
Ores&
concentrates
ofno
n-ferrou
s5.61
−0.07(6.27)
1.81
0.06
SS
0.83
291-Crude
anim
almaterials,nes
2.48
−0.34(4.17)
2.37
1.41
SS
0.78
292-Crude
vegetablematerials,nes
3.96
−0.26(5.27)
2.89
1.26
SS
0.68
332-
Petroleum
prod
ucts
9.62
−0.68(8.50)
0.50
1.15
SS
0.88
422-Other
fixedvegetableoils
2.73
−0.82(4.43)
0.87
6.25
SS
0.76
512-Organic
chem
icals
2.03
−0.15(3.90)
11.26
5.99
SS
0.81
513-Inorg.chem
icals-elem
s.,oxides,halog
3.96
−0.69(5.20)
3.13
0.06
SS
0.80
514-Other
inorganicchem
icals
5.06
−0.72(6.05)
11.58
3.83
SS
0.81
533-Pigments,paints,varnishes&
relat
3.46
−1.46(5.37)
0.07
4.85
SS
0.77
541-Medicinal
&ph
armaceutical
products
1.04
−0.26(2.53)
9.80
3.11
SS
0.42
551-Essentialoils,perfum
eandflavou
r9.42
−1.18(7.03)
0.09
2.06
SS
0.71
553-Perfumery,
cosm
etics,dentifrices,
22.62
−0.60(13.73)
0.77
0.23
SS
0.97
554-Soaps,cleansing
&polishing
prepara
15.86
−1.23(10.70)
2.30
7.26
SS
0.88
571-
Exp
losivesandpy
rotechnicprod
ucts
5.78
−0.12(6.46)
1.57
0.03
SS
0.82
599-Chemical
materialsandprod
ucts,nes
6.33
0.52
(7.05)
5.40
0.81
SS
0.91
611-Leather
1.88
−1.01(3.38)
2.49
0.01
SS
0.35
612-Manuf.ofleatheror
ofartif.orrec
3.88
−0.43(5.02)
5.97
1.37
SS
0.60
613-Fur
skins,tanned
ordressed,
inclu
8.94
−0.70(6.88)
0.10
0.50
SS
0.62
631-Veneers,plywoodboards
&otherwood
1.31
−0.67(3.07)
6.74
4.46
SU
0.64
632-Woodmanufactures,nes
8.43
−0.25(7.95)
8.52
11.45
SS
0.90
633-Corkmanufactures
4.24
−0.27(5.25)
7.11
0.42
SS
0.46
J Econ Finan (2012) 36:555–586 569

Tab
le3
(contin
ued)
Industry
Diagnostics
FECM
t−1
LM
RESE
TCUSU
MCUSU
MSQ
Adj.R2
641-Paper
andpaperboard
2.71
−0.14(4.21)
0.94
7.52
SS
0.60
642-Articlesof
paper,pulp,paperboard
2.52
−0.37(4.10)
4.02
0.29
SS
0.78
651-Textile
yarn
andthread
3.46
−0.50(5.00)
4.10
6.26
SS
0.69
652-Cottonfabrics,woven
ex.narrow
ors
3.91
−0.57(5.12)
2.80
4.10
SS
0.75
653-Text
fabricswov
enex
narrow
,spec,
37.16
−0.93(17.60)
10.19
2.26
SS
0.96
654-Tulle,lace,em
broidery,ribbon
s,t
4.74
−0.82(5.64)
0.22
0.41
SS
0.69
655-Special
textile
fabricsandrelated
9.00
−1.02(8.21)
2.45
1.97
SS
0.89
656-Made-up
articles,wholly
orchiefly
8.70
−0.48(8.08)
6.87
0.03
SS
0.90
657-Floor
coverings,tapestries,etc.
28.14
−1.24(13.44)
0.12
0.5766
E-3
SS
0.90
661-Lim
e,cement&
fabr.bldg.mat.-ex
gla
3.96
−0.50(5.16)
5.64
10.46
SS
0.67
663-Mineral
manufactures,nes
1.79
0.36(3.75)
0.65
0.06
SS
0.75
664-Glass
5.24
−0.58(5.90)
1.19
4.66
SS
0.77
665-Glassware
4.26
−0.42(5.65)
1.18
1.89
SS
0.85
666-Pottery
5.60
−0.13(6.36)
13.13
0.10
SS
0.92
667-Pearlsandprecious
andsemi-precio
15.83
0.14(11.49)
4.70
0.11
SS
0.94
687-Tin
8.18
−0.77(6.84)
2.00
4.42
SS
0.67
689-Miscell.non-ferrousbase
metals
10.93
−0.08(9.06)
1.98
0.47
SS
0.92
692-
Metal
containers
forstorageandtr
5.77
−0.25(6.44)
7.37
0.72
SS
0.74
694-Nails,screw
s,nuts,bolts,rivetsand
4.74
−0.14(5.54)
1.21
0.54
SS
0.55
695-To
olsforusein
thehand
orin
mac
4.06
−0.34(5.41)
0.05
0.08
SS
0.95
696-Cutlery
3.43
−0.28(5.07)
12.01
1.07
SS
0.72
697-Hou
seho
ldequipm
entof
base
metals
8.75
−0.35(7.95)
11.69
6.43
SS
0.84
570 J Econ Finan (2012) 36:555–586
Indu
stry
Diagn
ostics
FECM
t−1
LM
RESE
TCUSU
MCUSU
MSQ
Adj.R2
698-Manufacturesof
metal,nes
5.29
−0.35(6.18
)12
.37
2.42
SS
0.89
711-Pow
ergeneratin
gmachinery,othert
23.33
−1.16(13
.17)
0.18
1.39
SS
0.95
714-Officemachines
3.88
−0.36(5.21
)7.05
14.60
SS
0.74
715-Metalworking
machinery
3.13
−0.26(4.85
)0.03
0.00
SS
0.79
717-Textile
andleathermachinery
3.50
−0.35(4.95
)0.21
3.82
SS
0.73
719-Machinery
andappliances-non
electr
58.13
−0.87(21
.37)
1.67
0.31
SS
0.98
722-Electricpo
wer
machinery
andsw
itch
4.79
−0.61(5.50
)0.64
0.55
SS
0.60
724-
Telecommun
ications
apparatus
6.27
−0.22(6.51
)3.50
6.71
SU
0.75
725-Dom
estic
electrical
equipm
ent
6.12
−0.23(6.19
)0.27
14.76
SS
0.90
726-Elec.apparatusformedic.purp.,radi
7.03
−0.83(6.92
)0.04
0.00
SS
0.88
729-Other
electrical
machinery
andappa
5.97
−0.39(6.35
)3.08
1.06
SS
0.84
812-Sanitary,plumbing,heatin
g&
lightin
10.17
−0.39(8.73
)5.90
2.74
SS
0.89
821-Furniture
2.60
−0.00(4.20
)10
.78
6.93
SS
0.78
831-Travelgoods,handbags
andsimilar
35.75
−0.40(16
.02)
0.98
2.94
SS
0.99
841-Clothingexcept
furclothing
12.13
−0.44(9.21
)0.93
6.82
SS
0.82
842-Fur
clothing
andarticlesof
artifi
4.59
−1.13(5.74
)3.44
2.18
SS
0.59
851-Footwear
13.97
−0.22(10
.04)
3.26
4.73
SS
0.96
861-Scientific,m
edical,optical,m
eas./co
10.15
−0.40(8.73
)0.64
14.51
SS
0.86
862-Photographicandcinematographic
su9.96
−0.72(8.33
)2.36
7.26
SS
0.81
864-Watches
andclocks
5.39
−0.86(6.36
)0.01
5.26
SS
0.82
891-Musical
instruments,sound
recorders
8.36
−0.61(7.41
)1.98
9.59
SS
0.81
892-Printed
matter
11.84
−0.45(8.86
)7.86
0.11
SS
0.87
893-Articlesof
artificialplastic
mate
5.56
−0.54(6.61
)0.86
10.15
SS
0.91
894-Peram
bulators,to
ys,gam
esandsporti
11.82
−0.66(9.24
)0.13
8.57
SS
0.93
895-Officeandstationery
supplies,nes
6.84
−0.25(6.87
)3.92
8.50
SS
0.71
896-Works
ofart,collectorspieces
and
5.09
−0.75(6.32
)0.64
5.56
SS
0.86
897-Jewellery
andgold/silv
er-smith
swa
19.14
−0.54(11.76)
3.92
0.68
SS
0.92
J Econ Finan (2012) 36:555–586 571

Tab
le3
(contin
ued)
Industry
Diagnostics
FECM
t−1
LM
RESE
TCUSU
MCUSU
MSQ
Adj.R2
899-Manufacturedarticles,nes
10.05
−0.30(8.17)
0.59
4.34
SS
0.79
941-Animals,nes-incl.zoo
anim
als,do
gs5.89
−0.31(6.65)
1.99
0.42
SS
0.84
951-Firearm
sof
war
andam
mun
ition
ther
3.96
−0.23(5.19)
3.42
2.10
SS
0.73
Atthe
10%
levelo
fsignificance
theupperboundcriticalv
alue
ofthebounds
testwhentherearefour
regressorsin
thelong-run
equatio
nis3.52.Itcom
esfrom
TableCI(iii)Case
III(Pesaran
etal.20
01,p.
300).
Num
bers
inside
parenthesesareabsolute
valueof
thet-ratio
s.
LM
=Lagrangemultip
liertestof
residual
serial
correlation.
Itisdistributedas
χ2(1).The
criticalvalueis3.84.
RESET=Ram
sey’stestforfunctio
nform
.Itisdistributedas
χ2(1).The
criticalvalueis3.84.
572 J Econ Finan (2012) 36:555–586

(clothing except fur clothing) and 894 (Perambulators, toys, games,…), each littleover 7% market share. Furthermore, introducing the third country effect does notseem to change the results of Bahmani-Oskooee and Wang (2007) when theyexcluded the third-country effect from their model.5
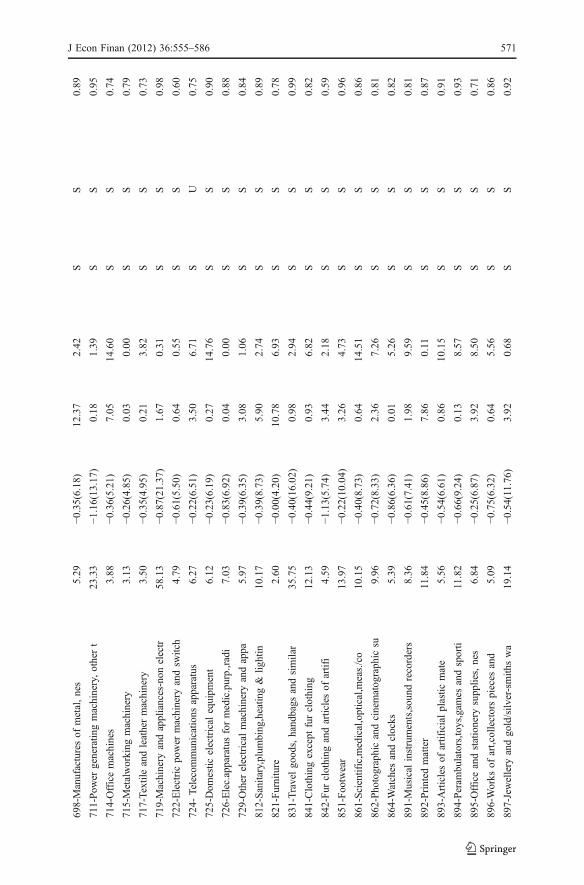
In order for the long-run results and our analysis to be meaningful, we mustestablish cointegration among the variables. To this end, we move to Table 3 whichnot only reports the results of the F test, but also additional diagnostic statistics foreach optimum model. The F test results clearly reveal that at the 10% level ofsignificance, the calculated statistic is greater than its critical value of 3.52 in 79industries supporint cointegration and validating our long-run analysis. Furthermore,following Pesaran et al. (2001) the long-run coefficient estimates from Table 2 areused to form an error-correction term, say, ECM. Then in each model, the linearcombination of the lagged level variables is replaced by ECMt−1 and the model isestimated one more time by impositing the optimum number of lags. A significantlynegative coefficient obtained for ECMt−1 in every industry reflects the fact that theshort-run adjustment is toward long-run equilibrium.6 For each model, we alsoreport the Lagrange Multiplier (LM) statistic for serial correlation and Ramsey’sRESET statistic for functional misspecification. Both are distributed as χ2 with onedegree of freedom. As can be seen, in 70% of the models both statistics are less thantheir critical value of 3.84, indicationg auto-correlation free residuals in the majorityof the correctly specified models. Correct specification of each model is furthersupported by the size of adjusted R2 in almost all the models.7 Finally, once the well-known CUSUM and CUSUMSQ tests are applied to the residuals of each optimummodel, Table 3 reveals that all short-run as well as long-run coefficient estimates arestable as reflected by “S” for stable coefficients and “U” for unstable models.
We now shift to estimates of error-correction model (4) for each of the U.S.exporting industries. Here, countinous data over the period 1978–2006 were onlyavailable for 75 industries which all together have 77% of the market share.8 Onceagain model (4) is estimated using the same procedure as model (3) and the resultsfrom each optimum model are reported in Tables 4, 5 and 6.
Consider first the short-run coefficient estimates of the two volatility measuresreported in Table 4. At the 10% level of significance, the volatility of the real U.S.dollar-yuan exchange rate has significant impact on the U.S. exports to China of 66industries. At the same significance level the third-country effect is present in almostthe same number of industries (63 of the 75 industries). Unlike Cushman (1986) who
5 From the long-run coefficient estimates we also conclude that the U.S. income carries its expectedpositive sign in majority of the models, impying that economic growth in the U.S. is major determinant ofU.S. imports from China. The real U.S. dollar-Chinese yuan rate also carries a significant coefficient in 51cases. Furtheremore, the coefficient is expectedly positive in 31 industries and negative in 20 industries.6 Note that there are three industries coded 599, 663, and 667 in which ECMt−1 carries a positivecoefficient, implying adjustment away from equilibrium. Business cycles and shocks to exchange rate thatiduces severe volatility could cause trade flows of these industries not to adjust.7 Note that in 20 out of 29 models that are misspecified (due to significant RESET statistic), the third-country effect is insignificant, leaving our long-run analysis almost unchanged.8 Once again for each industry, its market share is defined as that industry’s export as a % of total U.S.exports to China. These shares are reported inside the parenthesis next to the name of each industry inTable 5. Sum of all these shares add up to 77.25, implying that about 23% of the U.S. exports to China areby other industries for which data were not available.
J Econ Finan (2012) 36:555–586 573

Tab
le4
Short-run
coefficientestim
ates
ofexportdemand(t-ratiosinside
parentheses)
Industry
Short-run
coefficientestim
ates
ΔLnV
CH
tΔLnV
CH
t�1
ΔLnV
CH
t�2
ΔLnV
CAN
tΔLnV
CAN
t�1
ΔLnV
CAN
t�2
001-Liveanim
als
−0.34(1.76)
−1.20(4.34)
−0.48(2.35)
0.82(3.33)
−0.58(2.23)
–
041-Wheat
-includingspelt-andmesli
1.22(3.99)
1.19(3.45)
–−0
.11(0.31)
−2.41(6.46)
−2.00(7.72)
051–Fruit,
fresh,
andnuts-excl.oil
−0.13(0.66)
––
1.05(5.05)
––
211-Hides
&skins,-exc.fur
skins-
undre
0.17(1.25)
0.85(6.33)
–−0
.42(2.83)
−0.56(3.96)
−0.46(3.50)
231-Crude
rubber-incl.synthetic
&recla
0.30(4.67)
––
−0.24(3.15)
−0.21(2.79)
–
251-Pulp&
waste
paper
−0.36(6.84)
−0.25(4.11)
−0.27(4.80)
0.25(3.63)
−0.97(6.90)
−0.36(4.02)
263-Cotton
1.14(2.11)
1.58(2.89)
–−0
.34(0.48)
−4.86(4.90)
−2.09(2.57)
266-Synthetic
andregenerated-artificia
0.19(2.61)
––
0.07(0.64)
−0.64(5.73)
−0.40(4.11)
291-Crude
anim
almaterials,nes
−0.19(3.37)
−0.69(7.39)
−0.39(4.68)
0.16(2.61)
−0.01(0.09)
0.13(2.22)
292-Crude
vegetablematerials,nes
0.11(1.10)
−0.16(1.65)
−0.64(5.75)
−0.27(2.26)
––
332-
Petroleum
products
0.21(1.28)
−1.56(9.35)
−1.16(8.38)
−0.27(1.29)
1.41(6.79)
0.79(4.89)
512-Organic
chem
icals
0.37(5.02)
−0.24(1.78)
−0.44(4.56)
0.03(0.36)
−0.18(2.19)
–
513-Inorg.chem
icals-elem
s.,oxides,halog
0.91(5.59)
−1.39(5.23)
−1.26(6.13)
−0.41(2.79)
––
514-Other
inorganicchem
icals
0.08(1.29)
−0.77(5.91)
−0.73(6.84)
0.20(1.97)
−0.65(6.95)
–
515-Radioactiv
eandassociated
material
0.09(0.63)
––
0.18(0.97)
––
531-Synth.organic
dyestuffs,naturalin
0.49(3.52)
––
−0.04(0.25)
––
533-Pigments,paints,varnishes&
relat
0.44(4.82)
0.49(3.88)
0.18(1.89)
−0.24(2.13)
––
541-Medicinal
&pharmaceutical
products
−0.32(5.30)
−0.47(4.26)
−0.16(2.16)
0.45(5.36)
––
551-Essentialoils,perfum
eandflavour
0.31(1.40)
––
−0.08(0.29)
––
554-Soaps,cleansing
&polishing
prepara
0.36(3.15)
––
0.11(0.70)
––
581-
Plastic
materials,regenerd.cellu
los
0.24(2.91)
−0.79(4.81)
−0.42(3.67)
0.45(3.54)
−0.57(4.90)
−0.30(3.09)
599-Chemical
materialsandproducts,nes
0.04(3.23)
−0.17(11.85)
−0.03(2.27)
0.18(11.55)
−0.39(14.21)
−0.17(9.35)
611-Leather
−0.07(1.35)
−0.50(5.57)
−0.36(4.87)
0.40(6.08)
––
574 J Econ Finan (2012) 36:555–586

Industry
Short-run
coefficientestim
ates
ΔLnV
CH
tΔLnV
CH
t�1
ΔLnV
CH
t�2
ΔLnV
CAN
tΔLnV
CAN
t�1
ΔLnV
CAN
t�2
629-Articlesof
rubber,nes
0.48(6.02)
––
−0.09(0.90)
−0.42(3.86)
−0.32(3.12)
641-Paper
andpaperboard
−0.17(4.95)
−0.17(4.96)
−0.18(5.92)
0.27(6.51)
−0.19(4.13)
0.08(2.42)
642-Articlesof
paper,pulp,paperboard
−0.29(2.43)
––
−0.10(0.84)
0.22(1.80)
0.42(3.85)
651-Textileyarn
andthread
0.42(3.06)
−0.47(2.82)
–0.37(2.27)
––
652-Cottonfabrics,woven
ex.narrow
ors
0.37(2.50)
––
0.63(3.26)
−0.38(2.24)
–
653-Textfabricswoven
exnarrow
,spec,
−0.00(0.03)
−1.90(9.10)
−1.25(8.28)
0.80(4.36)
−1.35(7.07)
−0.64(4.53)
654-Tulle,lace,em
broidery,ribbons,t
0.10(0.11)
−0.25(2.25)
−0.56(5.51)
0.27(2.42)
−0.27(2.24)
–
655-Special
textile
fabricsandrelated
0.25(1.32)
––
−0.08(0.33)
––
656-Made-up
articles,wholly
orchiefly
−0.06(0.52)
0.38(2.77)
0.46(3.62)
0.49(3.27)
0.62(3.06)
0.45(2.71)
661-Lim
e,cement&
fabr.bldg.mat.-ex
gla
−0.80(3.30)
––
0.40(1.21)
––
662-Clayandrefractory
constructio
nma
1.85(5.75)
0.42(2.33)
–−1
.31(5.04)
2.14(5.36)
0.88(3.41)
663-Mineral
manufactures,nes
0.33(6.28)
−0.16(1.97)
−0.32(5.07)
−0.25(3.37)
−0.12(1.63)
–
673-Iron
andsteelbars,rods,angles,sha
−0.13(1.12)
0.49(3.49)
1.06(8.34)
−0.22(1.66)
0.77(5.13)
1.21(9.07)
674-Universals,plates
andsheetsof
iro
0.82(2.28)
−2.46(3.91)
−1.57(3.68)
0.78(2.30)
−1.61(3.31)
−0.56(1.46)
678-Tubes,pipes
andfittingsof
iron
or1.16(11.19)
0.01(0.10)
−0.47(4.60)
−0.63(5.57)
0.22(1.76)
–
682-Copper
0.71(2.89)
1.33(4.32)
0.73(2.25)
−0.29(0.96)
−0.85(2.93)
–
684-Aluminium
−0.75(2.67)
2.68(6.19)
1.28(3.94)
−2.02(7.68)
1.27(3.75)
–
689-Miscell.non-ferrousbase
metals
−0.65(4.21)
−3.86(7.92)
−1.91(6.32)
1.45(5.65)
−0.92(5.21)
–
691-Finishedstructural
partsandstruc
0.16(0.78)
––
−0.07(0.28)
0.10(0.40)
−0.54(2.25)
692-
Metal
containers
forstorageandtr
−0.20(1.77)
––
0.23(1.49)
––
694-Nails,screw
s,nuts,bolts,rivetsand
0.31(2.41)
−0.57(3.60)
−0.32(2.41)
−0.14(1.17)
––
695-Toolsforusein
thehand
orin
mac
0.12(1.49)
––
−0.41(4.39)
−0.08(0.89)
−0.23(2.65)
698-Manufacturesof
metal,nes
0.07(0.96)
––
−0.25(2.70)
––
711-Pow
ergeneratin
gmachinery,othert
−0.26(2.70)
−0.42(4.16)
–−0
.13(1.38)
0.36(3.21)
0.17(1.66)
712-Agriculturalmachinery
andim
plem
en0.23(1.67)
––
0.10(0.52)
––
714-Officemachines
−0.13(1.69)
––
0.21(2.19)
––
715-Metalworking
machinery
0.22(4.98)
−0.91(12.24)
−0.39(7.10)
−0.09(1.56)
0.25(4.32)
–
717-Textileandleathermachinery
0.35(3.23)
−0.59(4.08)
−0.21(2.31)
−0.33(2.89)
0.59(3.10)
0.45(3.04)
718-Machinesforspecialindustries
0.22(4.46)
––
−0.20(3.06)
0.22(3.66)
–
J Econ Finan (2012) 36:555–586 575

Tab
le4
(con
tinued)
Industry
Short-run
coefficientestim
ates
ΔLnV
CH
tΔLnV
CH
t�1
ΔLnV
CH
t�2
ΔLnV
CAN
tΔLnV
CAN
t�1
ΔLnV
CAN
t�2
719-Machinery
andappliances-non
electr
0.14(3.73)
−0.39(5.75)
−0.18(4.34)
0.13(2.78)
––
722-Electricpower
machinery
andsw
itch
0.03(0.53)
0.14(2.30)
0.19(3.69)
−0.10(1.60)
0.52(4.77)
0.13(1.79)
723-Equipmentfordistributin
gelectric
−0.08(0.98)
0.28(3.11)
0.18(2.07)
−0.22(2.19)
0.39(2.65)
0.22(1.84)
724-
Telecom
munications
apparatus
−0.14(2.08)
––
0.07(0.78)
––
725-Dom
estic
electrical
equipm
ent
0.26(3.45)
0.46(4.33)
0.27(2.71)
−0.27(2.86)
––
726-Elec.apparatusformedic.purp.,radi
0.15(2.90)
––
−0.17(2.27)
0.35(3.87)
0.18(2.64)
729-Other
electrical
machinery
andappa
−0.09(2.49)
0.22(4.59)
0.31(8.47)
−0.11(2.65)
0.29(5.68)
0.06(1.46)
732-Roadmotor
vehicles
0.31(3.58)
––
−0.32(2.51)
0.82(4.61)
0.44(3.24)
733-Roadvehicles
otherthan
motor
vehi
−0.05(0.48)
−0.39(4.13)
–0.26(2.44)
––
734-Aircraft
−0.31(4.14)
––
−0.31(3.10)
1.06(8.81)
0.43(4.36)
735-Ships
andboats
−0.27(0.93)
––
0.88(2.50)
−2.29(4.69)
−1.78(5.05)
812-Sanitary,plumbing,heatin
g&
lightin
−0.38(4.33)
0.47(4.44)
0.64(6.83)
0.37(3.84)
−0.42(4.07)
−0.30(3.46)
861-Scientific,m
edical,optical,m
eas./co
0.23(8.64)
−0.04(1.13)
−0.14(4.72)
−0.27(8.28)
0.39(5.64)
0.10(2.48)
862-Photographicandcinematographic
su−0
.32(4.15)
––
0.12(1.03)
0.49(4.72)
0.37(3.64)
863-Developed
cinematographic
film
0.36(1.61)
−1.74(7.29)
−1.32(6.02)
0.07(0.32)
1.52(5.25)
–
864-Watches
andclocks
0.45(1.99)
1.08(3.09)
0.67(2.44)
−0.92(3.72)
––
891-Musical
instruments,sound
recorders
−0.03(0.49)
0.43(5.89)
0.28(4.79)
−0.17(2.46)
−0.24(3.01)
−0.29(4.50)
892-Printed
matter
−0.42(6.58)
−0.47(6.36)
−0.18(2.89)
0.39(5.41)
0.32(4.53)
0.28(3.87)
893-Articlesof
artificialplastic
mate
0.22(4.87)
0.35(6.00)
–−0
.29(4.88)
––
894-Peram
bulators,to
ys,gam
esandsporti
0.18(2.00)
0.71(6.72)
0.44(5.40)
−0.03(0.29)
––
895-Officeandstationery
supplies,nes
−0.30(2.14)
−0.06(0.40)
−0.34(2.46)
0.42(2.72)
−0.68(3.64)
−0.52(3.64)
897-Jewellery
andgold/silv
er-smith
swa
0.41(1.57)
––
0.20(0.57)
––
899-Manufacturedarticles,nes
0.10(1.04)
−0.59(5.71)
−0.55(5.93)
−0.24(2.15)
––
576 J Econ Finan (2012) 36:555–586

found inclusion of the third-country effect eliminated significance impact of the U.S.dollar-Canadian dollar volatility on the U.S. exports to Canada, we find that not onlythe third-country effect, i.e., the volatility of the real U.S. dollar-Canadian dollar hasiimplication on U.S. exports to China, so does the volatility of the U.S. dollar-Chinese yuan.
From the long-run coefficient estimates reported in Table 5, it is clear the theshort-run effects of VCH last into the long run in 39 industries and in most of theindustries, the estimated coefficient is positive, results similar to those of Bahmani-Oskooee and Wang (2007). Once again, these long-run significant effects do notdisappear by including the third-country effect, VCAN, in Bahmani-Oskooee andWang’s specification. Indeed, VCAN carries a significant coefficient in 26 industries.Furthermore, in industries coded 001, 266, 514, 541, 581, 599, 611, 641, 653, 661,674, 689, 719, 735, and 895 the estimated effect is positive, implying that increasedrisk due to the volatility of the U.S. dollar-Canadian dollar increases U.S. exports toChina in these 16 industries. This increased risk, however, reduces U.S. exports toChina in 11 industries coded 533, 662, 673, 684, 718, 722, 726, 734, 861, and 893.All in all, while volatility of the U.S. dollar-Canadian dollar has short-run effects onthe U.S. exports to China in the majority of the industries, the short-run effectstranslate into the long run in one-third of the industries, a unique finding absent fromthe literature. Once again, most of the affected industries are small. Turning to thelong-run effects of Chinese income on the U.S. exports we gather that it carries itssignificantly positive coefficient in the majority of the industries, implying thateconomic growth in China stimulates their imports of American made goods. Thiseffect is negative in four industries coded 001, 041, 652, and 735, implying that asChina’s economy grows they produce more goods that are a close substitute to thesefour industries helping to reduce their imports (or U.S. exports).9 The real exchangerate itself carries a significant coefficient in 36 industries and the estimatedcoefficient is expectedly negative in 13 industries and unexpectedly positive in 23.
Finally, we report all diagnostic statistics in Table 6. To validate the above long-run analysis, we see that cointegration is supported either by a significant F statisticor a significantly negative ECMt−1.
10 The LM test shows lack of autocorrelationamong the residuals of most of the models and the RESET statistic indicatescorrectly specified models in most cases. The estimated short-run and long-runcoefficients are stable as reflected by CUSUM and CUSUMSQ tests and almostevery error-correction model enjoys a nice size of adjusted R2 or goodness of fit.11
4 Summary and conclusion
The impact of exchange rate uncertainty on the trade flows still continues todominate international finance literature. The most recent review article reveals thatmajority of the studies in the literature have looked at the issue without considering
9 For more on this effect see Bahmani-Oskooee (1986).10 Note that there are three exporting industries coded 251, 654, and 812 in which ECMt−1 carries apositive coefficient, implying that in these three models adjustment is not toward long-run equilibrium.11 It is possible that finding for certain industries might be sensitive to the choice of third country. Futureresearch should explore this point.
J Econ Finan (2012) 36:555–586 577

Tab
le5
Long-runcoefficientestim
ates
ofexportdemand(t-ratiosinside
parentheses)
Industry
(trade
share%)
Long-runcoefficientestim
ates
Constant
LnV
CH
LnV
CAN
LnY
CH
LnR
E
001-Liveanim
als(0.027)
4.07(1.28)
0.42(1.69)
0.79(1.79)
−1.53(3.88)
6.29(12.50)
041-Wheat
-includingspelt-andmesli(0.045)
63.65(1.80)
0.95(0.59)
6.83(1.19)
−9.80(1.67)
8.82(1.17)
051–
Fruit,
fresh,
andnuts-excl.oil(0.220)
−1.92(0.65)
0.83(2.25)
0.31(0.66)
3.28(6.64)
−2.17(2.52)
211-Hides
&skins,-exc.fur
skins-
undre(1.443)
−17.62(1.93)
−1.49(2.13)
−0.53(0.47)
4.53(4.59)
−2.15(1.05)
231-Crude
rubber-incl.synthetic
&recla(0.661)
−7.14(1.61)
0.77(2.74)
−0.90(1.26)
5.12(5.41)
−5.21(3.73)
251-Pulp&
waste
paper(2.854)
−9.96(1.04)
0.82(2.18)
−3.43(1.57)
3.66(2.96)
−5.20(2.25)
263-Cotton(4.033)
31.08(0.62)
−3.55(0.72)
10.49(0.81)
−8.28(0.67)
24.01(0.92)
266-Synthetic
andregenerated-artificia
(0.423)
11.96(5.46)
0.17(1.47)
0.80(2.01)
−0.41(1.14)
0.01(0.01)
291-Crude
anim
almaterials,nes
(0.120)
−1.83(0.60)
0.32(1.96)
0.35(0.98)
1.28(5.42)
2.66(5.19)
292-Crude
vegetablematerials,nes
(0.131)
−10.08(2.17)
0.10(0.16)
−0.48(1.10)
3.99(5.95)
−2.56(2.55)
332-
Petroleum
products(0.421)
−57.68(0.82)
9.27(0.84)
−12.02(0.80)
12.66(0.85)
−6.35(0.46)
512-Organic
chem
icals(2.750)
34.91(0.26)
5.43(0.25)
4.34(0.21)
3.89(0.22)
−6.94(0.17)
513-Inorg.chem
icals-elem
s.,oxides,halog(1.055)
4.12(0.83)
2.58(3.36)
0.01(0.01)
3.46(3.14)
−4.12(2.59)
514-Other
inorganicchem
icals(0.258)
15.39(3.65)
1.47(3.13)
2.25(3.07)
0.36(0.69)
0.95(1.03)
515-Radioactiv
eandassociated
material(0.011)
−0.65(0.48)
0.10(0.66)
0.15(0.75)
1.05(4.25)
−0.06(0.08)
531-Synth.organic
dyestuffs,naturalin
(0.032)
−6.27(2.88)
0.15(0.54)
−0.02(0.09)
2.51(6.68)
−0.30(0.40)
533-Pigments,paints,varnishes&
relat(0.374)
−11.26(4.56)
−0.05(0.13)
−0.91(2.79)
1.34(4.75)
4.33(7.91)
541-Medicinal
&pharmaceutical
products(0.497)
6.91(1.61)
0.34(0.95)
1.41(2.33)
0.86(2.13)
1.02(1.67)
551-Essentialoils,perfum
eandflavour(0.121)
−8.48(5.67)
0.34(1.68)
−0.10(0.41)
1.23(3.61)
4.07(5.09)
554-Soaps,cleansing
&polishing
prepara(0.209)
−2.49(1.89)
0.33(2.01)
0.19(0.92)
1.75(6.33)
1.12(1.74)
581-
Plastic
materials,regenerd.cellu
los(4.716)
18.17(4.26)
1.10(3.04)
1.79(2.36)
0.78(1.46)
−1.73(1.64)
599-Chemical
materialsandproducts,nes
(1.473)
11.25(7.84)
− 0.01(0.12)
1.51(5.55)
1.23(6.06)
−1.66(5.91)
611-Leather
(0.251)
6.96(3.40)
0.30(1.31)
0.80(3.39)
2.80(11.19)
−5.98(16.04)
629-Articlesof
rubber,nes
(0.101)
1.87(0.44)
0.90(1.78)
0.58(0.79)
1.37(2.80)
0.19(0.23)
578 J Econ Finan (2012) 36:555–586

Tab
le5
(con
tinued)
Industry
(trade
share%)
Long-runcoefficientestim
ates
Constant
LnV
CH
LnV
CAN
LnY
CH
LnR
E
641-Paper
andpaperboard
(0.735)
6.17(10.25)
−0.04(0.86)
0.35(3.66)
0.80(10.65)
0.06(0.51)
642-Articlesof
paper,pulp,paperboard
(0.112)
−9.69(3.67)
−0.75(3.63)
−0.37(0.77)
2.31(5.24)
1.23(1.74)
651-Textileyarn
andthread
(0.173)
8.51(4.03)
0.60(2.39)
0.27(1.17)
2.32(7.23)
−5.57(8.78)
652-Cottonfabrics,woven
ex.narrow
ors(0.011)
4.95(1.22)
0.39(1.49)
0.84(1.29)
−1.72(2.67)
6.28(6.20)
653-Textfabricswoven
exnarrow
,spec,(0.090)
21.48(6.76)
1.12(4.05)
2.48(4.78)
−0.54(1.31)
0.15(0.21)
654-Tulle,lace,em
broidery,ribbons,t(0.047)
−103.67(0.17)
−0.17(0.02)
−19.52(0.16)
10.32(0.22)
−18.39(0.17)
655-Special
textile
fabricsandrelated(0.529)
−2.19(0.52)
0.60(1.74)
−0.26(0.59)
2.78(4.53)
−2.19(1.25)
656-Made-up
articles,wholly
orchiefly(0.023)
−8.72(1.40)
0.38(0.34)
−1.63(1.39)
1.67(1.92)
−0.92(0.56)
661-Lim
e,cement&
fabr.bldg.mat.-ex
gla(0.023)
−7.06(2.85)
−0.78(3.24)
1.03(2.42)
4.20(8.82)
−2.67(2.86)
662-Clayandrefractory
constructio
nma(0.034)
−17.81(5.50)
0.94(3.93)
−2.47(4.63)
2.10(4.70)
2.33(3.00)
663-Mineral
manufactures,nes(0.213)
−6.40(4.67)
0.15(1.02)
−0.16(0.82)
2.09(13.56)
1.53(5.96)
673-Iron
andsteelbars,rods,angles,sha
(0.052)
−15.08(2.73)
−0.45(0.89)
−2.77(3.13)
2.02(2.75)
−0.68(0.60)
674-Universals,plates
andsheetsof
iro(0.206)
17.79(3.71)
2.25(4.70)
1.98(2.52)
0.08(0.12)
1.00(0.88)
678-Tubes,pipes
andfittingsof
iron
or(0.340)
−11.45(0.72)
6.51(0.90)
−4.94(0.99)
5.52(1.11)
−6.44(0.88)
682-Copper(0.376)
3.48(0.40)
0.25(0.36)
0.06(0.05)
−0.14(0.12)
2.99(2.15)
684-Aluminium
(0.392)
−19.84(6.10)
−1.62(4.48)
−2.35(4.72)
2.81(7.51)
−0.03(0.05)
689-Miscell.non-ferrou
sbase
metals(1.310)
15.64(4.97)
2.27(6.83)
2.05(4.59)
2.10(5.24)
−3.37(5.28)
691-Finishedstructural
partsandstruc(0.037)
−3.62(0.66)
−0.27(0.68)
−0.08(0.07)
1.28(1.40)
−0.34(0.21)
692-
Metal
containers
forstorageandtr(0.034)
−1.07(1.44)
−0.16(1.71)
0.18(1.52)
1.60(10.12)
−0.12(0.31)
694-Nails,screw
s,nuts,bolts,rivetsand(0.110)
−2.91(1.60)
0.96(3.10)
−0.09(0.50)
2.29(11.18)
−0.00(0.00)
695-Toolsforusein
thehand
orin
mac
(0.184)
−0.85(0.45)
0.11(1.18)
−0.35(1.05)
1.84(5.86)
−1.88(3.84)
698-Manufacturesof
metal,nes(0.345)
−2.02(0.29)
0.44(0.48)
−0.05(0.05)
0.03(0.01)
4.86(0.64)
711-Pow
ergeneratin
gmachinery,othert(1.640)
1.70(0.99)
0.14(0.97)
−0.16(0.57)
0.55(2.14)
2.30(5.34)
712-Agriculturalmachinery
andim
plem
ent(0.108)
2.03(1.83)
0.27(1.80)
0.14(0.78)
0.27(1.08)
1.85(3.23)
714-Officemachines(3.084)
−0.32(0.05)
−0.64(0.92)
0.26(0.31)
2.94(1.81)
−3.19(0.90)
715-Metalworking
machinery
(0.999)
1.43(1.47)
0.79(7.54)
−0.04(0.24)
0.56(5.04)
2.33(11.95)
717-Textileandleathermachinery
(0.214)
1.53(0.75)
0.64(4.40)
−0.36(1.16)
−0.02(0.08)
2.54(8.52)
718-Machinesforspecialindustries
(1.385)
−1.39(1.44)
0.28(2.97)
−0.85(5.29)
1.42(9.30)
−0.28(1.11)
719-Machinery
andappliances-non
electr(5.970)
3.59(10.07)
0.35(6.43)
0.08(2.09)
0.94(21.05)
1.43(15.36)
J Econ Finan (2012) 36:555–586 579

Tab
le5
(con
tinued)
Industry
(trade
share%)
Long-runcoefficientestim
ates
Constant
LnV
CH
LnV
CAN
LnY
CH
LnR
E
722-Electricpower
machinery
andsw
itch(1.998)
−8.59(5.97)
0.20(1.28)
−1.16(4.71)
2.47(12.20)
0.76(2.07)
723-Equipmentfordistributin
gelectric
(0.289)
−9.71(1.53)
−0.29(0.74)
−1.28(1.02)
2.11(2.40)
0.08(0.04)
724-
Telecommunications
apparatus(1.834)
0.11(0.06)
−0.41(1.83)
0.19(0.70)
0.58(1.21)
2.93(2.79)
725-Dom
estic
electrical
equipm
ent(0.078)
−4.29(3.10)
−0.31(1.45)
−0.24(1.52)
1.75(8.33)
0.00(0.01)
726-Elec.apparatusformedic.purp.,radi(0.686)
−6.14(1.93)
0.24(1.97)
−1.15(1.94)
2.58(4.66)
−1.11(1.40)
729-Other
electrical
machinery
andappa
(11.670)
−97.17(0.61)
−8.50(0.60)
−13.55(0.63)
17.83(0.74)
−23.55(0.72)
732-Roadmotor
vehicles
(2.282)
−8.13(1.86)
0.52(2.02)
−1.68(1.94)
2.49(3.51)
−1.21(1.11)
733-Roadvehicles
otherthan
motor
vehi
(0.103)
−4.44(1.18)
1.49(1.80)
0.51(1.20)
1.67(3.29)
2.68(1.24)
734-Aircraft(11.713)
−5.59(3.81)
−0.15(2.38)
−0.97(3.50)
1.28(6.20)
2.72(8.22)
735-Ships
andboats(0.009)
25.00(3.12)
0.19(0.33)
4.30(2.97)
−2.92(2.24)
4.22(1.97)
812-Sanitary,plumbing,heatin
g&
lightin
(0.060)
−34.77(0.49)
5.85(0.46)
−5.78(0.45)
9.59(0.55)
−1.38(0.18)
861-Scientific,m
edical,optical,m
eas./co(3.613)
−5.53(1.57)
0.61(4.60)
−1.17(1.82)
2.33(4.50)
0.29(0.48)
862-Photographicandcinematographic
su(0.272)
−14.49(1.48)
−0.84(1.62)
−0.76(0.48)
4.39(2.74)
−1.85(0.91)
863-Developed
cinematographic
film
(0.001)
−34.21(0.68)
3.76(2.06)
−5.25(0.71)
11.49(1.13)
−16.23(1.26)
864-Watches
andclocks
(0.005)
−11.30(1.58)
−1.30(1.45)
−1.46(1.51)
2.60(3.45)
−2.69(1.46)
891-Musical
instruments,sound
recorders(0.770)
−4.59(1.75)
−0.63(1.92)
0.07(0.19)
1.98(5.71)
0.72(1.15)
892-Printed
matter(0.368)
1.70(0.35)
−0.17(0.43)
0.56(0.65)
2.67(3.57)
−2.93(2.57)
893-Articlesof
artificialplastic
mate(0.303)
−7.01(7.54)
−0.17(2.36)
−0.33(3.04)
2.42(24.48)
0.82(4.80)
894-Peram
bulators,to
ys,gam
esandsporti(0.101)
−14.87(1.70)
−1.58(1.65)
−0.64(0.65)
0.55(0.46)
6.12(1.76)
895-Officeandstationery
supplies,nes(0.030)
−5.40(2.11)
−0.27(1.02)
0.79(1.99)
2.53(7.11)
0.39(0.67)
897-Jewellery
andgold/silv
er-smith
swa(0.014)
−2.05(0.38)
0.53(0.90)
0.42(0.53)
0.26(0.24)
4.42(1.87)
899-Manufacturedarticles,nes(0.188)
−1.73(0.96)
0.34(1.73)
0.23(1.11)
1.70(9.92)
0.62(1.35)
580 J Econ Finan (2012) 36:555–586

Tab
le6
Diagnostic
statisticsfortheU.S.Exportdemandmodel
Industry
Diagnostics
FECM
t−1
LM
RESE
TCUSU
MCUSU
MSQ
Adj.R2
001-Liveanim
als
2.60
−2.61(4.52)
0.17
0.35
SS
0.82
041-Wheat
-includingspelt-andmesli
6.72
−0.53(7.10)
4.84
1.47
SS
0.88
051–Fruit,
fresh,
andnuts-excl.oil
3.07
−1.19(4.64)
0.01
0.91
SS
0.73
211-Hides
&skins,-exc.fur
skins-
undre
4.53
−0.65(5.96)
3.19
0.07
SS
0.82
231-Crude
rubber-incl.synthetic
&recla
5.94
−0.38(6.54)
3.80
0.45
SS
0.80
251-Pulp&
waste
paper
8.77
0.53(8.30)
0.02
1.75
SS
0.88
263-Cotton
3.10
−0.38(4.49)
4.23
0.70
SS
0.53
266-Synthetic
andregenerated-artificia
9.35
−1.14(8.08)
2.21
10.20
SS
0.77
291-Crude
anim
almaterials,nes
7.78
−1.11(7.64)
3.49
2.78
SS
0.87
292-Crude
vegetablematerials,nes
2.84
−0.52(4.52)
8.64
0.06
SS
0.74
332-
Petroleum
products
13.10
−0.20(10.15)
3.96
1.01
SS
0.89
512-Organic
chem
icals
1.46
−0.09(3.39)
3.01
3.52
SS
0.66
513-Inorg.chem
icals-elem
s.,oxides,halog
4.86
−0.84(6.04)
0.46
8.32
SS
0.83
514-Other
inorganicchem
icals
9.14
−0.50(7.90)
0.31
0.34
SS
0.79
515-Radioactiv
eandassociated
material
2.86
−0.29(4.09)
0.08
0.08
SU
0.42
531-Synth.organic
dyestuffs,naturalin
5.77
−1.04(6.20)
0.66
3.47
US
0.74
533-Pigments,paints,varnishes&
relat
10.41
−0.90(8.42)
1.18
0.88
SS
0.82
541-Medicinal
&pharmaceutical
products
5.64
−0.56(6.18)
0.59
1.61
SS
0.83
551-Essentialoils,perfum
eandflavour
2.50
−0.85(3.14)
2.46
3.13
UU
0.21
554-Soaps,cleansing
&polishing
prepara
9.79
−1.13(7.52)
2.15
3.50
SS
0.75
581-
Plastic
materials,regenerd.cellu
los
5.51
−0.80(6.43)
3.82
2.14
SS
0.71
599-Chemical
materialsandproducts,nes
52.41
−0.56(19.46)
0.65
4.19
SS
0.99
611-Leather
6.99
−0.81(7.00)
3.68
9.92
SS
0.88
629-Articlesof
rubber,nes
2.94
−0.55(4.42)
2.73
1.09
SS
0.69
J Econ Finan (2012) 36:555–586 581

Tab
le6
(con
tinued)
Industry
Diagnostics
FECM
t−1
LM
RESE
TCUSU
MCUSU
MSQ
Adj.R2
641-Paper
andpaperboard
18.95
−2.20(12.20)
1.64
0.62
SS
0.95
642-Articlesof
paper,pulp,paperboard
4.64
−0.91(5.57)
0.06
5.12
SS
0.71
651-Textileyarn
andthread
6.29
−1.35(6.63)
0.00
0.39
SS
0.83
652-Cottonfabrics,woven
ex.narrow
ors
14.65
−0.95(9.99)
3.30
0.01
SS
0.85
653-Textfabricswoven
exnarrow
,spec,
10.45
−1.38(9.06)
3.64
9.14
SS
0.85
654-Tulle,lace,em
broidery,ribbons,t
4.29
0.06(5.68)
2.75
2.85
SS
0.85
655-Special
textile
fabricsandrelated
4.12
−0.47(2.91)
2.96
0.90
SU
0.30
656-Made-up
articles,wholly
orchiefly
3.17
−0.64(4.88)
4.37
0.40
SS
0.79
661-Lim
e,cement&
fabr.bldg.mat.-ex
gla
7.39
−1.11(5.42)
0.60
0.16
SS
0.69
662-Clayandrefractory
constructio
nma
12.82
−2.12(9.62)
4.04
6.07
SS
0.85
663-Mineral
manufactures,nes
4.71
−1.38(5.83)
0.64
6.17
SU
0.82
673-Iron
andsteelbars,rods,angles,sha
30.37
−0.80(15.45)
7.08
2.09
SS
0.97
674-Universals,plates
andsheetsof
iro
2.85
−1.70(4.53)
0.03
5.04
SS
0.74
678-Tubes,pipes
andfittingsof
iron
or9.29
−0.26(8.35)
0.19
0.00
SS
0.96
682-Copper
4.11
−1.36(5.68)
1.12
2.57
SS
0.81
684-Aluminium
11.02
−2.01(8.67)
0.15
0.01
SS
0.87
689-Miscell.non-ferrousbase
metals
11.03
−1.69(8.92)
3.10
0.10
SS
0.88
691-Finishedstructural
partsandstruc
5.13
−1.21(5.84)
7.39
10.82
SS
0.70
692-
Metal
containers
forstorageandtr
7.03
−1.82(6.54)
6.18
0.17
SS
0.63
694-Nails,screw
s,nuts,bolts,rivetsand
2.72
−1.00(4.20)
0.10
8.21
SU
0.47
695-Toolsforusein
thehand
orin
mac
8.85
−1.24(7.84)
2.78
0.00
SS
0.91
698-Manufacturesof
metal,nes
2.18
−0.20(3.80)
5.70
3.39
SU
0.81
711-Pow
ergeneratin
gmachinery,othert
4.19
−1.79(5.74)
1.78
7.04
SS
0.80
712-Agriculturalmachinery
andim
plem
en3.69
−0.65(3.48)
1.06
6.36
SS
0.33
582 J Econ Finan (2012) 36:555–586

()
Industry
Diagnostics
FECM
t−1
LM
RESE
TCUSU
MCUSU
MSQ
Adj.R2
714-Officemachines
1.77
−0.24(3.36)
0.18
1.94
SS
0.43
715-Metalworking
machinery
48.66
−1.53(18.22)
3.89
2.90
SS
0.95
717-Textileandleathermachinery
3.37
−2.48(5.30)
1.99
0.61
SS
0.76
718-Machinesforspecialindustries
16.17
−0.81(9.59)
2.46
7.83
SS
0.82
719-Machinery
andappliances-non
electr
7.67
−1.87(7.23)
7.51
16.28
SU
0.89
722-Electricpower
machinery
andsw
itch
11.26
−1.00(8.76)
1.28
1.60
SS
0.86
723-Equipmentfordistributin
gelectric
1.87
−0.61(3.66)
1.73
0.07
SS
0.85
724-
Telecom
munications
apparatus
1.63
−0.43(3.01)
0.13
2.02
SU
0.46
725-Dom
estic
electrical
equipm
ent
9.47
−0.96(7.78)
7.35
0.05
SS
0.83
726-Elec.apparatusformedic.purp.,radi
5.81
−0.63(6.21)
6.25
0.23
SS
0.65
729-Other
electrical
machinery
andappa
9.23
−0.04(7.95)
0.08
3.98
SS
0.85
732-Roadmotor
vehicles
8.73
−0.98(7.62)
1.42
0.01
SS
0.80
733-Roadvehicles
otherthan
motor
vehi
15.36
−0.50(10.23)
1.03
2.03
SS
0.91
734-Aircraft
27.03
−1.69(13.14)
1.88
1.18
SS
0.93
735-Ships
andboats
6.84
−1.03(6.83)
2.28
5.38
SS
0.82
812-Sanitary,plumbing,heatin
g&
lightin
5.03
0.11(6.28)
1.07
1.36
SS
0.81
861-Scientific,m
edical,optical,m
eas./co
14.62
−0.82(10.72)
13.45
2.43
SS
0.97
862-Photographicandcinematographic
su3.67
−0.33(4.86)
0.34
2.70
SS
0.70
863-Developed
cinematographic
film
7.78
−0.47(7.64)
0.03
0.02
SS
0.90
864-Watches
andclocks
1.52
−0.62(3.11)
1.21
8.04
SU
0.62
891-Musical
instruments,sound
recorders
8.23
−0.75(7.71)
12.17
0.06
SS
0.84
892-Printed
matter
10.40
−0.66(9.04)
6.23
5.99
SS
0.86
893-Articlesof
artificialplastic
mate
13.20
−1.63(9.61)
0.16
0.06
SS
0.91
894-Peram
bulators,to
ys,gam
esandsporti
5.42
−0.32(6.38)
3.62
6.23
SS
0.87
895-Officeandstationery
supplies,nes
4.04
−1.84(5.64)
1.98
3.71
SS
0.84
897-Jewellery
andgold/silv
er-smith
swa
2.88
−0.73(4.14)
0.2717E-3
8.16
SS
0.35
899-Manufacturedarticles,nes
12.55
−1.64(9.52)
4.78
0.53
SS
0.91
See
theno
testo
Table3.
J Econ Finan (2012) 36:555–586 583

the so called third-country effect. The trade between two countries not only couldreact to volatility of the bilateral exchange rate between those countries, but also tothe volatility of the currency of either of the two countries with respect to currencyof a third country. This third-country effect has been ignored by many studies in theliterature.
A previous study investigated the impact of volatility of the U.S. dollar-Chineseyuan real exchange rate on the trade flows between the two countries at thecommodity level. That study showed that out of 88 industries considered, exports of38 Chinese industries were affected significantly in the short run and 36 industries inthe long run. The number of affected Chinese importing industries was 38 in theshort run and 33 in the long run. In this paper we wonder if there is third-countryeffect in the trade between U.S. and China. More precisely, we wonder if thevolatility of the U.S. dollar againt currency of her largest trading partner has anyimplication on the commodity trade between the U.S. and China.
Over the period 1978–2006 continous time-series annual data were available for101 U.S. importing industries and 75 U.S. exporting industries. Using the samespecification as the previous work and the same methodology of bounds testingapproach to cointegration and error-correction modeling we find much strongerresults than the previous study. Our results reveal that when the third-country effectis included in the models, 87 of 101 Chinese exporting industries (or U.S. importingindustries) and 66 of 75 Chinese importing industries (or U.S. exporting industries)are affected by the volatility of the U.S. dollar-Chinese yuan real exchange rate inthe short run. The number of affected industries in the long run, however, is 44 and39 respectively. Considering the third-country effect, i.e., the impact of volatility ofthe real U.S. dollar-Canadian dollar on the same industries we found that 88 of 101U.S. importing industries and 63 of 75 U.S. exporting industries are affected by thisvolatility measure. In the long run, however, the affected industries are 27 and 26respectively. In sum, the third-country effect seems to be very important and shouldnot be ignored, though most of its effects seem to be short run.
Appendix
Data Definition and Sources
Annual data over 1978–2006 period are used d to carry out the empirical analysis.They come form the following sources:
a. World Bank.b. International Financial Statistics of IMF (CD-ROM).c. Chinese Statistical Yearbook.
Variables
Mi = Volume of imports of commodity i by the U.S. from China. Import value datafor each commodity comes from source a. In the absence of price level for eachcommodity, as a second best deflator we followed Bahmani-Oskooee and Ardalani
584 J Econ Finan (2012) 36:555–586

(2006) and Bahmani-Oskooee and Wang (2007) and used aggregate import priceindex for the U.S. to deflate the nominal imports of each commodity. The aggregateimport price index comes from source b.
Xi = Volume of exports of commodity ii by the U.S. to China. Export value datafor each commodity come from source a. Again since no price level was availablefor each commodity, we used aggregate export price index for the U.S. to deflate thenominal exports of each commodity. The aggregate export price index comes fromsource b.
YUS = Measure of the United States income. It is proxied by the real GDP. Thedata come from source b.
YC = China’s real GDP. Nominal GDP is deflated by CPI, the only price indexavailable (1995=100). All data come from source c.
RE = Real bilateral exchange rate between U.S. dollar and yuan defined as (PUS.EX /PC) where, EX is nominal exchange rate defined as number of yuan per dollar; PUS isthe price level in the U.S. measured by CPI and PC, the price level in China, againmeasured by CPI. The data for all three variables involved come from source b.
VCH = Variability measure of real bilateral yuan-dollar rate (RE). For each yearwe following Bahmani-Oskooee and Wang (2007) and many other recent studies(e.g. De Vita and Abbott 2004) and define it as the standard deviation of 12 monthlyreal bilateral rate (RE) within that year. Monthly CPI data and nominal exchange ratedata come from source b.
VCAN = Variability measure of real bilateral U.S. dollar-Canadian dollar rate.Again, for each year we define it as the standard deviation of 12 monthly real U.S.dollar-Canadian dollar rate. Monthly CPI data and nominal exchange rate data toconstruct the real exchange rate come from source b.
References
Bahmani-Oskooee M (1986) Determinants of international trade flows: the case of developing countries. JDev Econ 20:107–123
Bahmani-Oskooee M, Ardalani Z (2006) Exchange rate sensitivity of U.S. Trade flows: evidence fromindustry data. South Econ J 72:542–559
Bahmani-Oskooee M, Hegerty S (2007) Exchange rate volatility and trade flows: a review article. J EconStud 34:211–255
Bahmani-Oskooee M, Wang Y (2007) Impact of exchange rate volatility on commodity trade between U.S. and China. Econ Issues 12:31–54
Bahmani-Oskooee M, Bolhasani M (2008) The J-curve: evidence from commodity trade between Canadaand the U.S. J Econ Financ 32:207–225
Bahmani-Oskooee M, Economidou C, Goswami GG (2005) How sensitive are Britain’s inpayments andoutpayments to the value of the British Pound. J Econ Stud 32:455–467
Boyd D, Caporale GM, Smith R (2001) Real exchange rate effects on the balance of trade: cointegrationand the marshall-lerner condition. Int J Financ Econ 6:187–200
Cushman DO (1983) The effects of real exchange rate risk on international trade. J Int Econ 15:45–63Cushman DO (1986) Has exchange risk depressed international trade: the impact of third country
exchange risk. J Int Money Financ 5:361–379De Vita G, Abbott A (2004) Real exchange rate volatility and US exports: an ARDL bounds testing
approach. Economic Issues 9:69–78Halicioglu F (2007) The J-curve dynamics of turkish bilateral trade: a cointegration approach. J Econ Stud
34:103–119
J Econ Finan (2012) 36:555–586 585

Mohammadi H, Cak M, Cak D (2008) Wagner’s hypothesis: new evidence from turkey using the boundstesting approach. J Econ Stud 35:94–106
Pesaran M, Shin Y, Smith R (2001) Bound testing approaches to the analysis of level relationships. J ApplEcon 16:289–326
Siddiki JU (2000) Demand for money in Bangladesh: a cointegration analysis. Appl Econ 32:1977–1984Tang TC (2007) Money demand function for Southeast Asian countries: an empirical view from
expenditure components. J Econ Stud 34:476–496Zhang Z (1999) China’s exchange rate reform and its impact on the balance of trade and domestic
inflation. Asia Pac J Econ Bus 3:4–22
586 J Econ Finan (2012) 36:555–586