impact of immigration: disruptive or helpful? · unemployment rate near nairu 4 5 6 7 8 9 10 11 ......
TRANSCRIPT

DABE September Meeting
Denver, CO
September 21, 2016
Pia Orrenius, Ph.D.
Federal Reserve Bank of Dallas
Disclaimer: The views expressed herein are those of the presenter; they do not necessarily reflect the views of the
Federal Reserve Bank of Dallas or the Federal Reserve System.
Impact of Immigration:
Disruptive or Helpful?

Road map
Recent trends
Steady economic growth, tightening labor
markets, but slowing immigration
Forces of international migration
Push and pull factors
Economic and fiscal effects of immigration
Winners and losers
Short run versus long run
Implications for policy
ECONOMY’S GROWING
BUT IMMIGRATION IS
SLOWING
Recent Trends

U.S. employment well past its
pre-recession peak
126
128
130
132
134
136
138
140
142
144
146
2003 2004 2005 2006 2007 2008 2009 2010 2011 2012 2013 2014 2015 2016
Millions, SA
138.4
144.6
SOURCE: Bureau of Labor Statistics.

7 years into expansion, U.S. GDP
plods along…
13
14
15
16
17
18
19
2003 2004 2005 2005 2007 2008 2009 2010 2011 2012 2013 2014 2015 2016
Trillions 2015 Dollars,
SAAR
16.5
18.4
SOURCE: Bureau of Economic Analysis.

Hiring has accelerated;
unemployment rate near NAIRU
4
5
6
7
8
9
10
11
2003 2004 2005 2006 2007 2008 2009 2010 2011 2012 2013 2014 2015 2016
Percent, SA
10.0
4.9
SOURCE: Bureau of Labor Statistics.

0
0.2
0.4
0.6
0.8
1
1992 1994 1996 1998 2000 2002 2004 2006 2008 2010 2012 2014
Inflows as %
of working-age population
NOTE: Working age population is 16 to 64.
SOURCES: U.S. Department of State, Report of the Visa Office; U.S. Department of Homeland security, Yearbook of
Immigration Statistics; U.S. Customs and Border Protection; U.S. Census Bureau.
Legal permanent
residents (new arrivals)
Temporary worker visas
Apprehensions
(Southwest border)
Despite steady growth, immigration
inflows are falling or flat
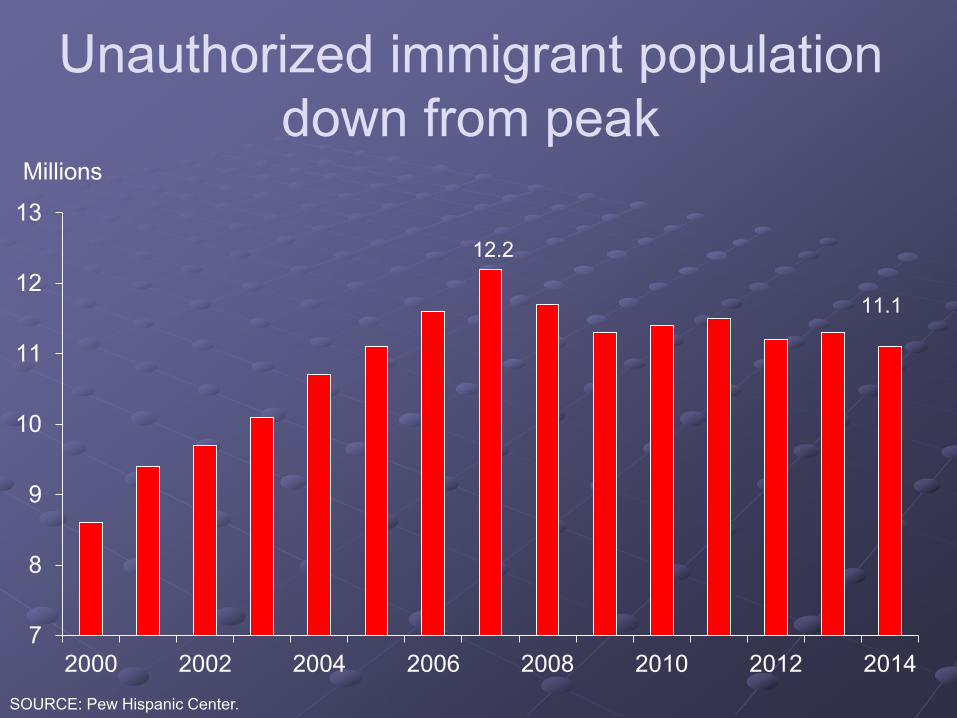
Unauthorized immigrant population
down from peak
SOURCE: Pew Hispanic Center.
7
8
9
10
11
12
13
2000 2002 2004 2006 2008 2010 2012 2014
Millions
12.2
11.1

Foreign-born population
42.4 million in 2014
0
5
10
15
20
25
30
35
40
45
1850 1870 1890 1910 1930 1950 1970 '00 '10 '14
Millions
Share of
Population
Number
SOURCE: U.S. Census Bureau.
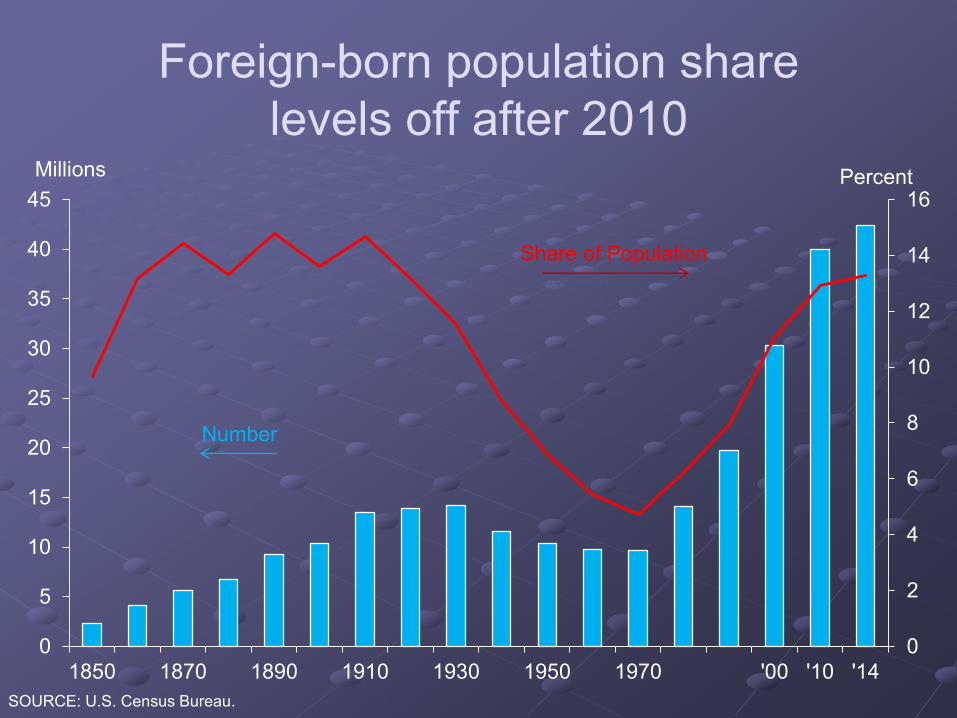
Foreign-born population share
levels off after 2010
0
2
4
6
8
10
12
14
16
0
5
10
15
20
25
30
35
40
45
1850 1870 1890 1910 1930 1950 1970 '00 '10 '14
Millions Percent
Share of
Population
Number
Share of Population
SOURCE: U.S. Census Bureau.

MIGRANTS GAIN
THE MOST FROM
MIGRATION
Forces of Migration: Push Factors
0
5
10
15
20
25
30
35
1820 1840 1860 1880 1900 1920 1940 1960 1980 2000
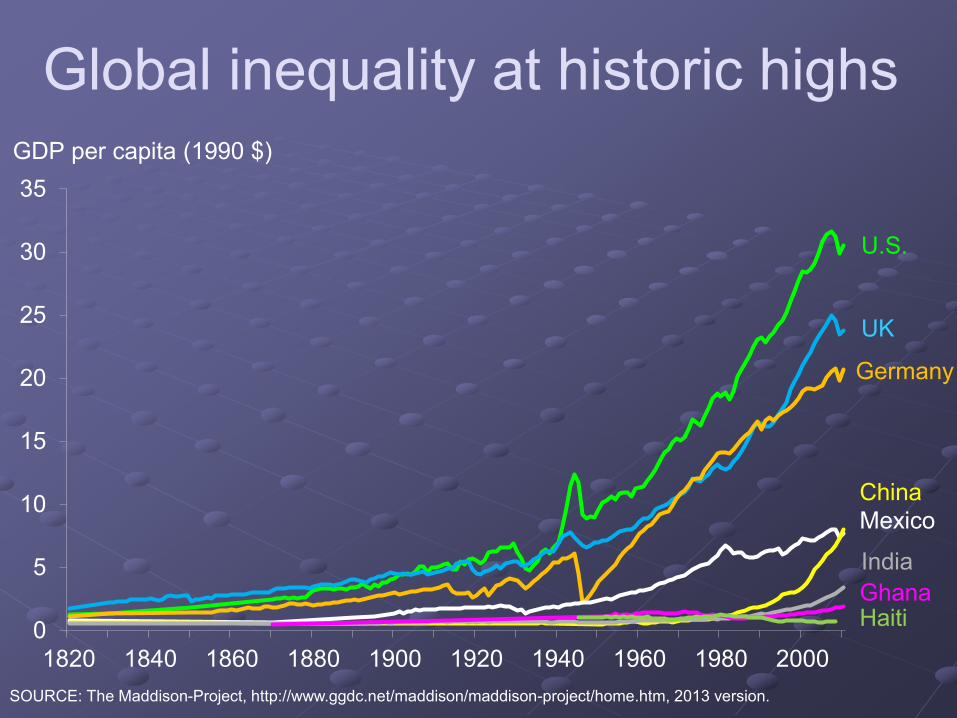
GDP per capita (1990 $)
Global inequality at historic highs
U.S.
Germany
Mexico
China
India
GhanaHaiti
UK
SOURCE: The Maddison-Project, http://www.ggdc.net/maddison/maddison-project/home.htm, 2013 version.
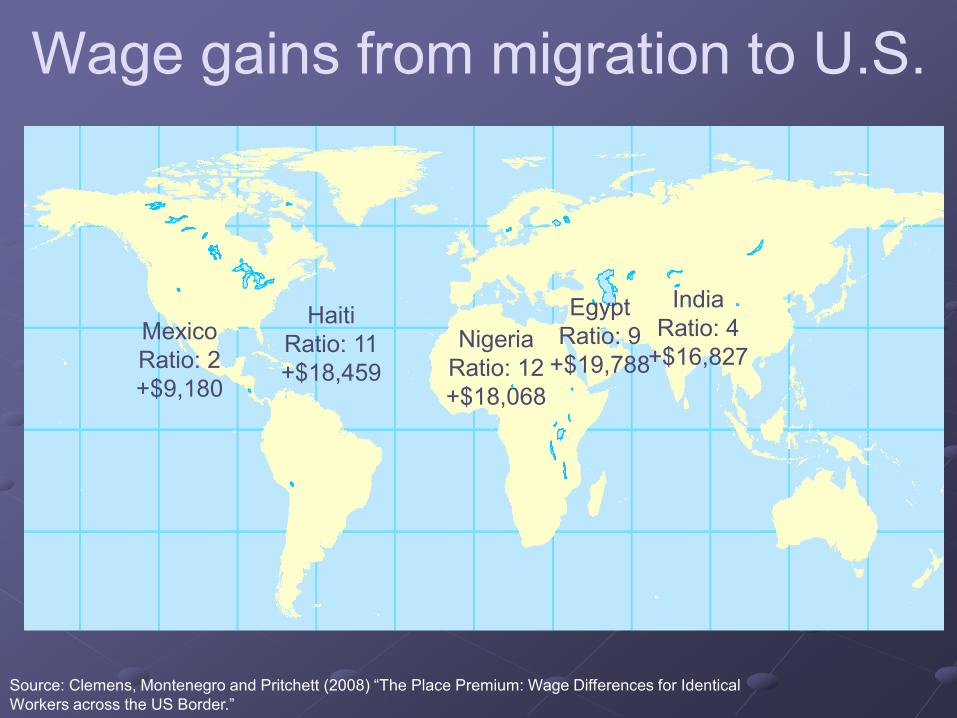
Wage gains from migration to U.S.
Nigeria
Ratio: 12
+$18,068
Haiti
Ratio: 11
+$18,459
Egypt
Ratio: 9
+$19,788
India
Ratio: 4
+$16,827Mexico
Ratio: 2
+$9,180
Source: Clemens, Montenegro and Pritchett (2008) “The Place Premium: Wage Differences for Identical
Workers across the US Border.”

Other factors in world mobility
Costs of moving at historic lows
Transportation
Information
Government-imposed barriers are
increasing

New sections of border fence
Source: Wayne Cornelius (2009) “Evaluating US Immigration Control Policy”

MIGRANTS READILY
FIND WORK
Forces of Migration: Pull Factors

Immigrants in the U.S. labor market
Immigrants are more likely than natives to
move to where the jobs are
Immigrants also
Complement native workers at high, low ends
of skill distribution
Fill jobs natives shun
Innovate/patent more than natives
Start businesses at a higher rate

AL
AK
AZ
AR
CA
CO
CT
DE
FL
GA
HI
ID
IL
IN
IA
KS
KY
LA
ME
MD
MA
MI
MN
MSMO
MT
NE
NV
NHNJ
NM
NY
NC
ND
OH
OK
OR
PA
RI
SC
SD
TN
TX
UT
VT
VA
WA
WV
WIWY
-0.4
-0.3
-0.2
-0.1
0
0.1
0.2
0.3
0.4
-0.15 -0.1 -0.05 0 0.05 0.1 0.15 0.2
In US, immigrants go where the jobs are
NOTE: Coordinates indicate deviation from median foreign born population growth (vertical axis) and from median state nonfarm
payroll growth (horizontal axis) from 1990 to 2014.
SOURCES: U.S. Census Bureau; 2014 American Community Survey; Bureau of Labor Statistics.
Fore
ign b
orn
popula
tion g
row
th
State employment growth

Sometimes they go to where others
are leaving from
NOTE: Population change by Hispanic ethnicity from 2000 to 2010.
SOURCE: U.S. Census Bureau, Census 2000, 2010
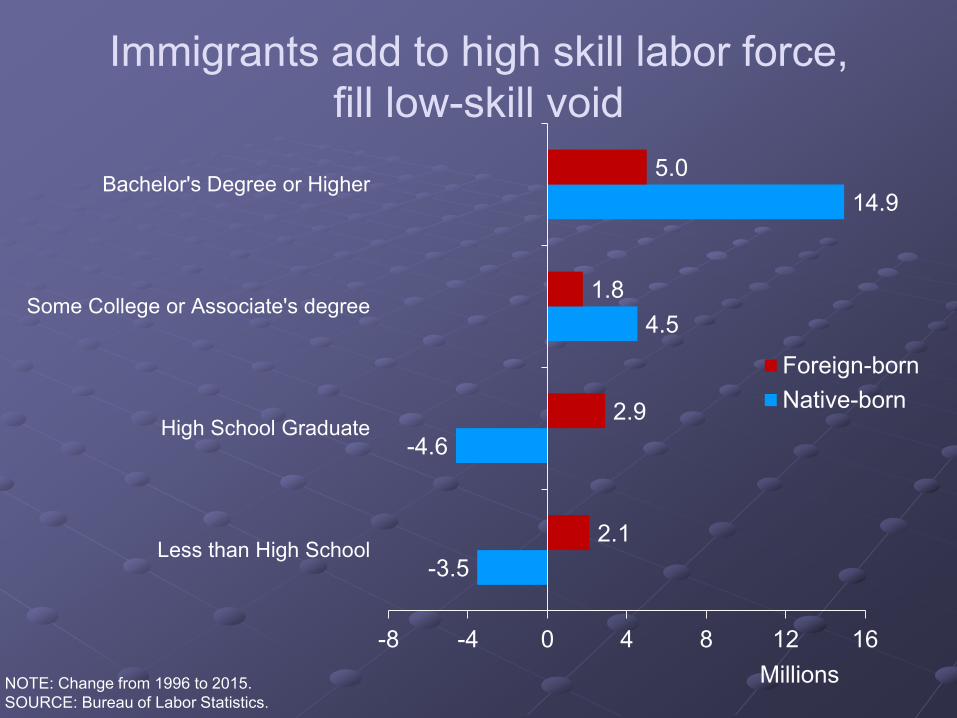
NOTE: Change from 1996 to 2015.
SOURCE: Bureau of Labor Statistics.
Immigrants add to high skill labor force,
fill low-skill void
-3.5
-4.6
4.5
14.9
2.1
2.9
1.8
5.0
-8 -4 0 4 8 12 16
Less than High School
High School Graduate
Some College or Associate's degree
Bachelor's Degree or Higher
Foreign-born
Native-born
Millions

Immigrant workers overrepresented at
extremes of the education distribution
0
10
20
30
40
50
60
Less thanhigh schoolgraduate
High schoolgraduate,
some college
Bachelor'sdegree
Master'sdegree
Professionaldegree
Doctoraldegree
Percent
Foreign born share of
labor force
NOTE: Percent of foreign workers age 25 and over in the U.S. labor force by education.
SOURCE: 2014 American Community Survey

Foreign students drive the rise
in PhDs awarded since 2000
SOURCE: National Science Foundation.
0
10
20
30
40
50
60
1966 1972 1978 1984 1990 1996 2002 2008 2014
Thousands of PhDs
Total
Citizen or perm resident
Temporary resident

STEM, health care occupations rely on
high-skilled foreign workers
NOTE: Percent of workers age 25 and over, with bachelor's degree or higher who are foreign born for selected occupations.
SOURCE: 2014 American Community Survey.
0 10 20 30 40 50
Lawyers/Judges
Veterinarians
Actors, directors, producers
Chief executives and public administrators
Sales Related
Economists, market researchers, survey…
Financial managers
Managers and administrators
Accountants and auditors
Architects
Biological scientists
Biological technicians
Registered nurses
Pharmacists
Mechanical engineers
High school and college instructors
Dentists
Chemical engineers
Computer systems analysts and…
Mathematicians
Physicians
Chemists
Computer software developers
Medical scientists
Foreign-born as a
percentage of college
graduate labor force
16.7

IMMIGRATION
CREATES WINNERS
AND LOSERS
Economic Impact of Immigration

Economic impact of immigration
Labor force grows, GDP rises
Immigrants account for nearly one-half labor
force growth since 1996
Some of the GDP increase accrues to natives;
the “Immigration surplus”
But the immigration surplus is not shared
equally
Wages fall; Return to capital, land rises
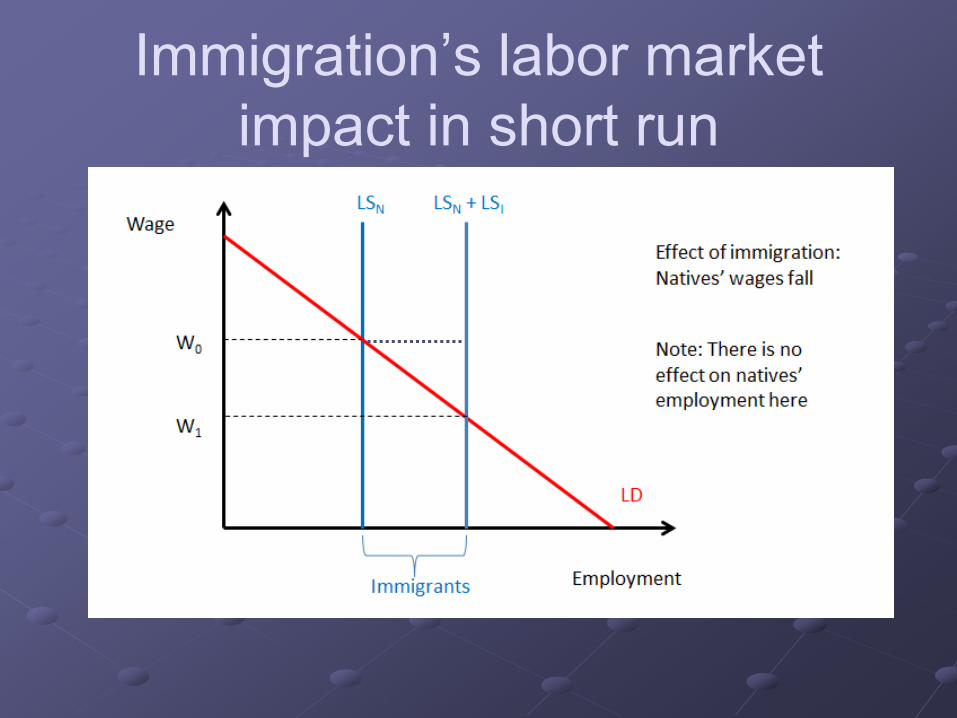
Immigration’s labor market
impact in short run

Immigration’s labor market
impact in long run

Simulated wage impact of 1990-2010
immigrant influx on the preexisting workforce
HS
dropouts
HS
graduates
Some
college
College
graduates
Post-
college
All
workers
Percent supply
shift25.9 8.4 6.1 10.9 15.0 10.6
Percent wage effects
Short run -6.2 -2.7 -2.3 -3.2 -4.1 -3.2
Long run -3.1 0.4 0.9 -0.1 -0.9 0.0
SOURCE: Immigration Economics, George Borjas, table 5.2, page 114.

Simulated long-run wage impact of 1990-
2010 immigrant influx, allowing for within-
group complementarities
Percent wage
effects
HS
dropouts
HS
graduates
Some
college
College
graduates
Post-
college
All
workers
Native-born -1.7 0.9 1.2 0.5 -0.1 0.6
Foreign-born -5.3 -3.4 -2.7 -4.9 -5.3 -4.4
All workers -3.1 0.4 0.9 -0.1 -0.9 0.0
SOURCE: Immigration Economics, George Borjas, table 5.4, page 120.
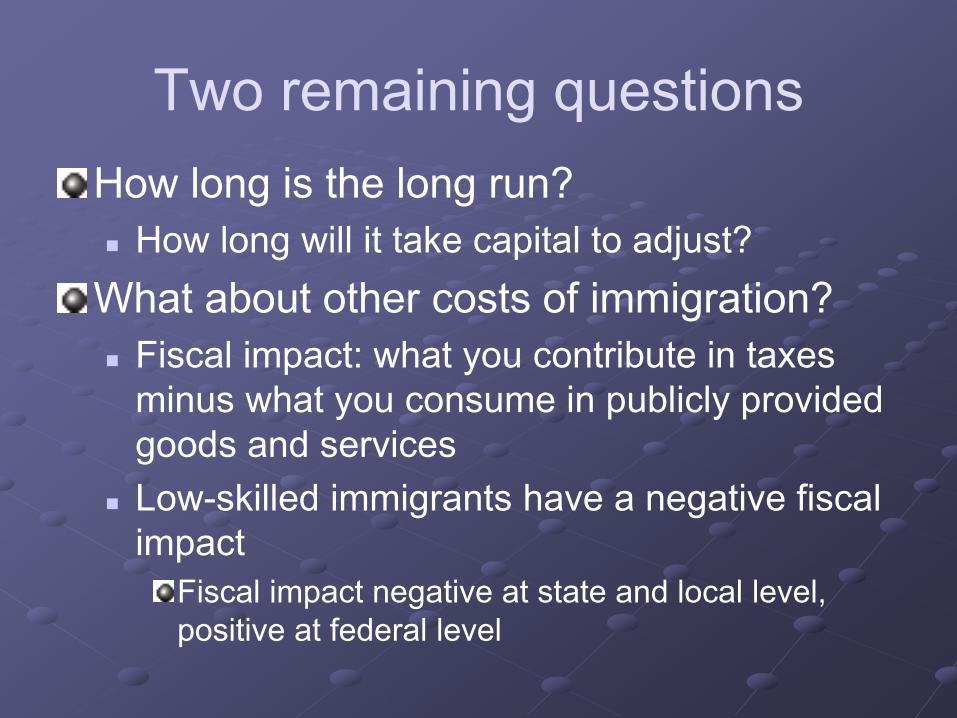
Two remaining questions
How long is the long run?
How long will it take capital to adjust?
What about other costs of immigration?
Fiscal impact: what you contribute in taxes
minus what you consume in publicly provided
goods and services
Low-skilled immigrants have a negative fiscal
impact
Fiscal impact negative at state and local level,
positive at federal level

WHO SHOULD
COME?
Implications for Policy

Summary & policy implications
Net economic benefits to immigration
So we should have immigration
But immigration appears to be slowing
Need better immigration policy
Some natives lose from immigration in short
run
Get to the long run faster by speeding
adjustment; making immigration predictable

Summary & policy implications -2-
Migrants are the biggest winners
Policy doesn’t need to confer additional
benefits
Low-skilled immigration has negative fiscal
impact
Transfer funds from federal to state & local
Admit more high-skilled immigrants
Consider temporary worker program
Bottom line
Immigration is disruptive AND helpful


Low-skilled: H-2B visa applications
outstrip number availableThousands
Applications
Available visas
SOURCE: Office of Foreign Labor Certification, Annual Reports for various years.
0
50
100
150
200
250
300
350
400
2000 2002 2004 2006 2008 2010 2012 2014

Naturalized citizens
Legal permanent residents
Temporary legal residents
Unauthorized immigrants
Unauthorized population almost as large
as permanent resident population
SOURCE: Pew Research Center estimates for 2012 based on augmented American Community Survey data from IPUMS.

High-Skilled: Not enough temporary visas,
H-1B cap reached before year-end since 2004
0
50
100
150
200
250
300
350
2004 2005 2006 2007 2008 2009 2010 2011 2012 2013 2014 2015 2016
Number of days until cap reached
SOURCE: U.S. Citizenship and Immigration Services.

In the U.S., green cards go to
family, not work-based immigrants
NOTE: Averages for years 2010-2014.
SOURCE: U.S. Department of Homeland Security, Yearbook of Immigration Statistics.
Family65%
Employment14%
Refugees and asylees
14%
Diversity5%
Others2%
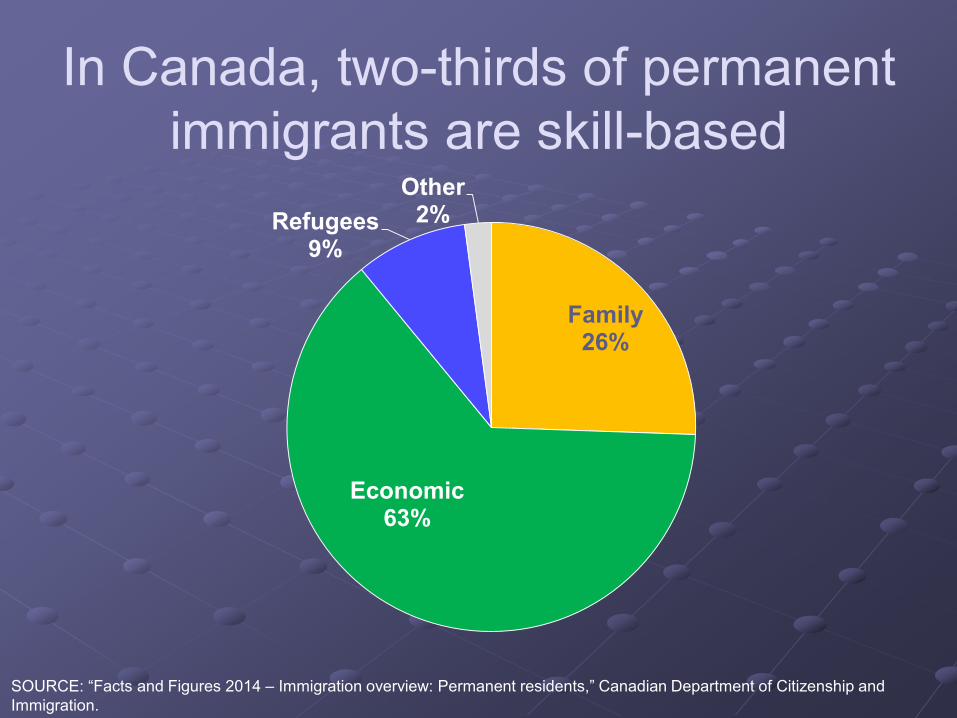
In Canada, two-thirds of permanent
immigrants are skill-based
Family26%
Economic63%
Refugees9%
Other2%
SOURCE: “Facts and Figures 2014 – Immigration overview: Permanent residents,” Canadian Department of Citizenship and
Immigration.
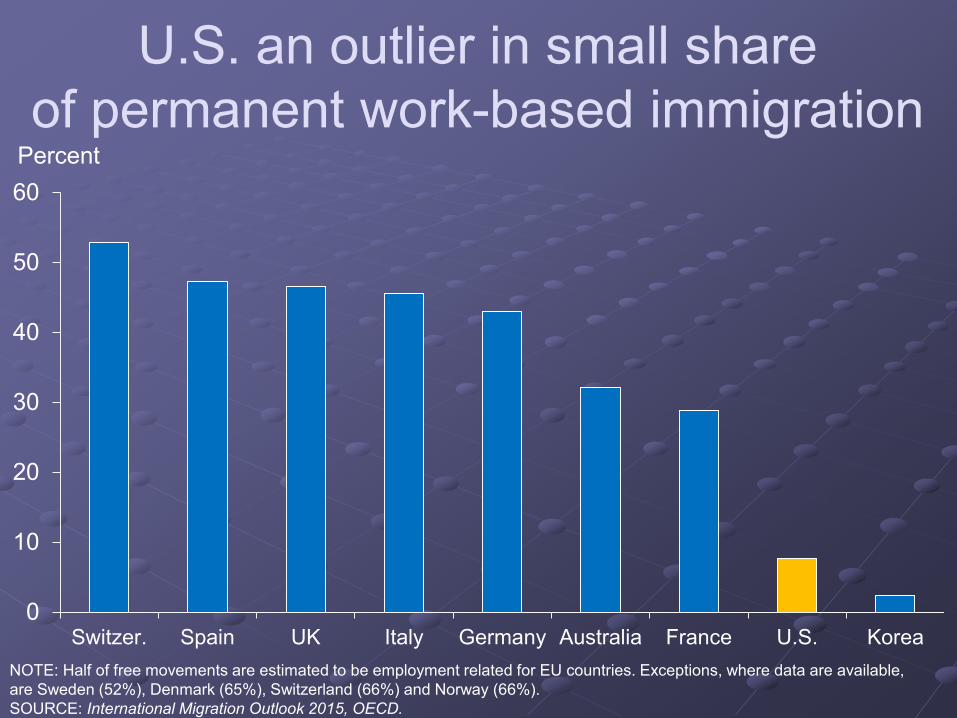
0
10
20
30
40
50
60
Switzer. Spain UK Italy Germany Australia France U.S. Korea
U.S. an outlier in small share
of permanent work-based immigration
NOTE: Half of free movements are estimated to be employment related for EU countries. Exceptions, where data are available,
are Sweden (52%), Denmark (65%), Switzerland (66%) and Norway (66%).
SOURCE: International Migration Outlook 2015, OECD.
Percent

Problems with current U.S. policy
Priority is family, not work or skills
No alternative for unauthorized
immigration
Work-based visa quotas insufficient, fixed;
temporary inconsistent with permanent
Skilled workers face long queues if want to
stay permanently
Country quotas penalize populous nations
Visa allocation nonsensical: first come,
first served or a lottery