impact of infill design on mechanical strength and
TRANSCRIPT

Impact of Infill Design on Mechanical Strength and Production Cost in
Material Extrusion Based Additive Manufacturing
by
Liseli Baich
Submitted in Partial Fulfillment of the Requirements for the degree of
Master of Science in Engineering
in the
Industrial and Systems Engineering Program
YOUNGSTOWN STATE UNIVERSITY
December, 2016

Impact of Infill Design on Mechanical Strength and Production Cost in Material Extrusion Based Additive Manufacturing
Liseli Baich
I hereby release this thesis to the public. I understand that this thesis will be made available from the OhioLINK ETD Center and the Maag Library Circulation Desk for public access. I also authorize the University or other individuals to make copies of this thesis as needed for scholarly research.
Signature:_______________________________________________________________Liseli Baich, Student Date
Approvals:_______________________________________________________________Dr. Guha Manogharan, Thesis Advisor Date
_______________________________________________________________Dr. Hazel Marie, Committee Member Date
_______________________________________________________________Dr. Jae Joong Ryu, Committee Member Date
_______________________________________________________________Dr. Salvatore A. Sanders, Dean of Graduate Studies Date

©Copyright
Liseli J Baich
2016

iv
Abstract
The widespread adoption of Additive Manufacturing (AM) can be greatly
attributed to the lowering prices of entry-level extrusion-based 3D printers. It has enabled
the use of AM for prototypes, STEM education and often, to produce complex custom
commercial products. With increased access to material extrusion-based 3D printers and
newer materials, the influence of print parameters such as infill patterns on resulting
mechanical strength and print costs, need to be investigated. This research investigates
the relationship among (1) infill designs, (2) selection of printer (entry-level vs.
production grade), (3) mechanical properties (e.g. tensile, compressive and flexural) and
(4) production cost (print time and material). Finite Element Analysis (FEA) simulation
using ANSYS software was conducted on the 4-point bending specimens to develop an
FEA model that was correlated with the experimental data (±8% accuracy). Relevant
infill designs are evaluated and recommended based on the loading conditions and
savings in production cost when compared to solid infill design. In the case of tension, a
larger air gap in the infill design was the most cost effective. In the case of compression,
low density and high density infills were more cost effective when compared to solid
samples. In the case of the flexural loading, low density infill was also the most cost
effective infill design. It was found that print time had a greater effect on total cost and
hence, influence of print time is analyzed using both entry-level and production grade
printers. The findings from this study will help formulate criteria for selection of optimal
infill design based on loading conditions and cost of printing. In summary, it was found
that in the case of entry-level printers, solid infill design is preferred due to minimal cost
savings when compared to other infill designs. On the contrary, it was found that low

v
density infill is more cost efficient than solid infill design while using production-grade
printers.

vi
Table of Contents
Abstract .............................................................................................................................. iv Table of Contents............................................................................................................... vi List of Tables ................................................................................................................... viii List of Figures .................................................................................................................... ix List of Symbols .................................................................................................................. xi Acknowledgements........................................................................................................... xii Chapter 1. Introduction ....................................................................................................... 1
1.1 – Categories of AM................................................................................................... 2 1.2 - Material Extrusion AM........................................................................................... 4 1.3 – Problem Statement ................................................................................................. 8
Chapter 2. Background ....................................................................................................... 9 2.1 - Material Extrusion AM........................................................................................... 9 2.1.1 - Process Parameters ............................................................................................ 10 2.2 - Infill Design.......................................................................................................... 11 2.3 - Finite Element Analysis........................................................................................ 18 2.4 - Cost Analysis ........................................................................................................ 19 2.5 - Summary............................................................................................................... 20
Chapter 3. Methodology ................................................................................................... 22 3.1 - Material and Experimental Methodology............................................................. 22 3.1.1 - ASTM Standards ............................................................................................... 23 3.1.2 - Process Planning Software ................................................................................ 24 3.1.3 - Preliminary Study.............................................................................................. 25 3.1.4 - Custom Infill Design ......................................................................................... 27 3.2 - Mechanical Testing............................................................................................... 29 3.3 - Finite Element Analysis........................................................................................ 33 3.4 - Cost Analysis ........................................................................................................ 37 3.5 - Summary............................................................................................................... 38
Chapter 4. Results and Analysis ....................................................................................... 39 4.1 - Preliminary Study................................................................................................. 39 4.1.1 - Tensile Testing .................................................................................................. 41 4.1.2 - Compression Testing ......................................................................................... 42 4.1.3 - 3-Point Bending Testing.................................................................................... 44 4.1.4 - Cost vs. Strength of Preliminary Study ............................................................. 45 4.2 - Custom Infill Parameters ...................................................................................... 48 4.2.1 - Custom Infill Parameters on Tensile Specimens............................................... 48 4.2.2 - Cost vs. Strength of Tensile Air Gap Specimens .............................................. 50 4.2.3 - 4-Point Bending with Custom Infill Parameters................................................ 52 4.2.4 - 4-Point Bending Mechanical Properties ............................................................ 54 4.2.5 - Cost Analysis for 4-Point Bending.................................................................... 59 4.3 - FEA Analysis of 4-Point Bending Specimens...................................................... 64 4.4 - Validation Modeling............................................................................................. 69 4.5 - Summary............................................................................................................... 72
Chapter 5: Conclusion....................................................................................................... 76

vii
5.1 - Future Work.......................................................................................................... 78 References:........................................................................................................................ 79

viii
List of Tables
Table 1. 1 Entry-Level 3D Printers under $5,000 (Source: Wohlers Report 2015)......................... 7
Table 2. 1 Relationship between Print Raster Angles, Filament Thickness, and Air Gaps (Bagsik et al., 2011)............................................................................................................................ 15
Table 2. 2 Relationship between Build Orientation, Raster Angles, Contour Width, Raster Width, and Raster to Raster Air Gaps (Hossain et al., 2013)............................................................ 15
Table 2. 3 Relationship between Layer Thickness, Deposition Angle, and Infill Percentage (Luzanin et al, 2014). ............................................................................................................ 16
Table 2. 4 Relationship between Air Gaps, Wall Thickness, Cap Layer Thickness, and Infill Patterns (Lyibilgin et al, 2014).............................................................................................. 17
Table 3. 1 Strength Data for Fortus and MakerBot ABS Material ................................................ 23
Table 3. 2 Nominal Dimensions for ASTM Standard Specimen- Tensile, Compression, 3-Point Bending, and 4- Point Bending (ASTM D638, 2014; ASTM D695, 2010; ASTM D790, 2010; ASTM D6272, 2010). ................................................................................................. 23
Table 3. 3 Design of Experiments.................................................................................................. 38
Table 4. 1 Average Print Time (min) and Material Volume (mm3) for Default Print Parameters D1, D2, D3, D4. .................................................................................................................... 40
Table 4. 2 Strengths and E-Equivalent for Tensile, Bending and Compression for Default Parameters ............................................................................................................................. 43
Table 4. 3 Print Time (min), Volume (mm3), UTS (MPa), and E-Equivalent (MPa).................... 49
Table 4. 4 Flexural Strength (MPa) and Modulus of Elasticity (MPa) for Fortus and MakerBot Specimens ............................................................................................................................. 53
Table 4. 5 Print Time (min) and Volume (mm3) for Fortus and MakerBot- 4-Point Bending...... 60
Table 4. 6 Percent Error of Simulations in Comparison to Experimental Data for 4-Point Bending Testing................................................................................................................................... 66
Table 4. 7 ANSYS Stress vs. Experimental Stress at 0.3 mm Deflection ..................................... 66
Table 4. 8 Percent Error of ANSYS Simulated Specimens for Comparison of Validation Specimens ............................................................................................................................. 69
Table 4. 9 ANSYS Stress vs. Experimental Stress at 0.3 mm Deflection for Validation .............. 69

ix
List of Figures
Figure 2. 1 Material Extrusion Process (Bagsik and SchÖppner, 2011) ......................................... 9
Figure 2. 2 (a) Applications for Tensile (Buckle), (b) Compression (Laptop Wedge), and (c) 3-Point Bending (Mounting Plate) Conditions [Thingiverse] .................................................. 11
Figure 2. 3 Slic3r Infill Patterns (a) Line, (b) Concentric, (c) Hilbert Chords, (d) Honeycomb, (e) Archimedean Chords............................................................................................................. 13
Figure 3. 1 Insight® Build Parameters (Hossain, 2013)............................................................... 25
Figure 3. 2 FDM Build Styles (a) solid-build (D4), (b) sparse-build (D1 and D2), (c) sparse-double-dense build (D3) (Iyibilgin, 2014). ........................................................................... 25
Figure 3. 3 Cross Sections of Tensile Specimens With Different Infill Parameters (a) Low Density, (b) High Density, (c) Double Dense Density.......................................................... 26
Figure 3. 4 Build Orientations (a) XY direction, (b) YZ direction, (c) XZ direction .................... 27
Figure 3. 5 4-Point Bending Specimens from Left to Right Air Gap 1 mm, 3 mm, 6 mm, 9 mm, 12 mm.................................................................................................................................... 27
Figure 3. 6 Insight® Toolpath Parameters..................................................................................... 29
Figure 3. 7 From Left to Right Tensile, Compression, 3-Point Bending, and 4-Point Bending.... 30
Figure 3. 8 Example Import Geometry on ANSYS Workbench 16.1 ........................................... 34
Figure 3. 9 4-Point Bending Loading Conditions .......................................................................... 35
Figure 3. 10 ANSYS Stress Analysis Process ............................................................................... 36
Figure 4. 1 Total Cost ($) for Default Infill Designs ..................................................................... 41
Figure 4. 2 Test - Stress vs. Strain for Default Parameter.............................................................. 42
Figure 4. 3 Compression Test- Stress vs. Strain Default Parameters............................................. 43
Figure 4. 4 3-Point Bending Test Stress vs. Strain Default Parameters......................................... 45
Figure 4. 5 (a) % in Cost Savings; (b) % Average Loss in Strength When Compared to Solid .... 47
Figure 4. 6 Stress vs. Strain Tensile Air Gap................................................................................. 50
Figure 4. 7 Total Cost of Tensile Air Gap Specimens ................................................................... 51
x
Figure 4. 8 (a) Cost Savings (%) of Air Gap Tensile Specimens (b) Loss in Strength (%) of Air Gap Tensile Specimens ......................................................................................................... 52
Figure 4. 9 Flexural Strength Graphs for Solid and Air Gap Fortus and MakerBot...................... 54
Figure 4. 10 Stress vs. Strain for Fortus Air Gap Specimens – 4-Point Bending .......................... 55
Figure 4. 11 Stress vs. Strain for Fortus Solid Specimens- 4-Point Bending ................................ 56
Figure 4. 12 Stress vs. Strain for MakerBot Air Gap Specimens- 4-Point Bending...................... 57
Figure 4. 13 Stress vs. Strain for Solid printed MakerBot Specimens- 4-Point Bending .............. 58
Figure 4. 14 Modulus of Elasticity (MPa) for Specimens Printed on Fortus and MakerBot......... 59
Figure 4. 15 Specimen Weight for Fortus and MakerBot.............................................................. 60
Figure 4. 16 Total Cost ($) of 4-Point Bending Specimens Printed on MakerBot and Fortus ...... 61
Figure 4. 17 Material Cost and Production Cost for Fortus and MakerBot Specimens................. 62
Figure 4. 18 (a) Cost Savings (%) for Air Gap Specimens (b) Reduction in Strength (%) for Air Gap Specimens, Both Printed on Fortus and MakerBot ....................................................... 64
Figure 4. 19 Simulated Load (N) at 0.3 mm Deflection for all Fortus Printed Specimens............ 65
Figure 4. 20 ANSYS Section Views of Solid XY, 1 mm, 3 mm, 4 mm, 6 mm, 9 mm, 10 mm, and 12 mm Specimens ................................................................................................................. 67
Figure 4. 21 Top View of ANSYS Stress Von- Mises Tests ......................................................... 68
Figure 4. 22 Flexural Strength of Previous Specimens with Added Validation Specimens .......... 70
Figure 4. 23 Modulus of Elasticity for Validation Specimens and Previous Specimens............... 71
Figure 4. 24 (a): Cost Savings (%) for Validation Specimens; (b): Reduction in Strength (%) for Validation Specimens............................................................................................................ 72

xi
List of Symbols
A - Area, mm2
F - Force, Nl - Length, mmσ - Stress, MPaε - Strain, mm/mmE - Modulus of Elasticity, MPaI - Moment of Inertia, mm4
C - Cost, $h - Height, mmb - Width, mmd - deflection, mmM - Moment, N-mmy – half the thickness, mmMC - Material Cost, $V - Volume, mm3
PC - Production Cost, $t - Time, min

xii
Acknowledgements
I would like to thank my advisor and mentor Guha Manogharan for helping and
pushing me while writing this thesis; he continually had visions of what the future work
of this thesis would bring and kept pushing for greatness. Without his constant
encouragement and persistent guidance this thesis would not have been possible.
I would also like to thank my committee member, Dr. Hazel Marie and Dr. Jae
Joong Ryu for the patience and encouragement. I also thank, my friends and colleagues
who helped me design, 3D print, and conduct research while writing my thesis.
In addition, I would like to thank the Youngstown State University for the
invaluable education and the Cushwa Fellowship for the financial support while
completing my graduate degree.
Lastly, I would like to thank my family and husband for all the encouragement
and support throughout my undergraduate and graduate career.

1
Chapter 1. Introduction
Additive Manufacturing (AM), often referred as 3D printing, uses a Computer-
Aided Design (CAD) model of the desired part to selectively join materials layer by layer
using a variety of technologies. This approach provides unique advantages over
traditional manufacturing by: (1) eliminating need for custom fixtures and jigs for every
part design, (2) offering unparalleled capability to produce multiple custom designs
within a single build and (3) efficient material utilization due to lack of scrap/chips
among others (Guo and Leu, 2013). Recent advancements in AM also enable fabrication
of custom parts with multi-material and multi-colors for an ever-growing range of
applications from custom orthotics and implants to consumer products. Multiple colors
and materials allow for product realization and the ability to add stronger material during
the print allows for a higher strength and versatility in the end products. Multi-material
3D printing has the potential to accelerate innovation and allows for more complex
structures, appearances and enhanced mechanical properties (Sitthi-Amorn et al., 2016).
The future of 3D printing in the medical field ranges from creating 3D models of medical
scans to aid in diagnosis and reduction in surgery complications. AM is also expected to
revolutionize prosthetics, bionics, orthotics, and make the options more cost effective.
For example, a 6-year-old boy was born without a lower right arm. Limitless Solutions
designed a low cost bionic lower arm and hand with sensors to react with the muscles for
the boy. The total cost of the design was $350, compared to a cost of $40,000 for a
traditional prosthetic solution. This process is especially useful in children as they grow,
the cost does not limit the child’s options (Stratasys, 2008). The improvements in AM

2
technologies provide new insights in the unique capabilities of the technologies as well as
opportunities to widely improve product manufacturing (Gibson et al., 2010). An
example includes Align Technology Inc., which uses stereolithography to produce molds
for clear braces (Invisalign®). This is beneficial because the ease of customizability.
There are three kinds of complexity: shape, material and hierarchical. Shape complexity
is the ability to build any shape which can be customized geometrically (Gibson et al,
2010). The material complexity is the ability to have a complex material be
manufactured traditionally. The hierarchical complexity involves the fabrication of parts
with features of ranging scales: microstructure through a geometric mesostructure
(Gibson et al., 2010).
1.1 – Categories of AM
According to ASTM F2792, AM processes can be categorized into seven
categories based on the principle of operation: vat photo-polymerization, material jetting,
binder jetting, material extrusion, powder bed fusion, sheet lamination and directed
energy deposition (ASTM F2792, 2012). (1) Vat photo polymerization uses liquid
photopolymer in a vat that is selectively cured using light based on CAD data for every
layer. An early example of this AM category is the stereolithography (SLA) process
which employs an ultraviolet laser and scanning mirrors to cure the liquid photopolymer
in the vat (Wohlers, 2015). (2) In the case of material jetting, photo-curable liquid is
selectively deposited on a platform using inkjet print nozzles, followed by activation
using a high-intensity light source. This technique has multi-material and multi-color
capabilities, where different ratios of photo-curable liquids can produce specimens with
locally varied mechanical properties, such as shore hardness. For example, Objet Connex

3
500 is a high-end multi material 3D printer that uses photopolymer technology which
allows for two different colors to be printed simultaneously (Vidimče et al., 2013).
This process is also used to make wax patterns that are used in investment casting
processes (Winker, 2008). (3) Binder jetting is similar to material jetting in using ink jet
nozzle heads to disperse liquid binders that are selectively deposited on a spread layer of
powder. This is followed by curing of the binders in an oven and depending on
applications (e.g. metals), subsequent sintering and infiltration are required (Wohlers,
2015). In other applications, such as 3D sand-printing, the secondary steps are not
required (Almaghariz, 2015). (4) Powder bed fusion uses a thermal energy source (e.g.
laser or electron beam) to selective fuse powders (e,g, metals, polymers) in a spread layer
of powder. This AM process allows for phase transformation where the solid powder is
melted and cooled down into the desired part geometry and are used to produce parts for
aerospace and biomedical applications (Wohlers, 2015). (5) Sheet lamination bonds
sheets of materials along with selective machining to produce a part. (6) Directed energy
deposition uses an energy source (e.g. laser or electron beam) melts and fuses materials
together as the material is being deposited (Wohlers, 2015).
Among the different AM categories defined by ASTM, material extrusion in
particular has been gaining tremendous popularity for a range of applications, such as
DIY projects, STEM education, prototyping and part production (ASTM F2792, 2012;
Bak, 2003; Conner et al 2014; Petrick & Simpson, 2013). (7) Material extrusion is an
“AM process in which material is selectively dispensed through a nozzle or orifice”
(ASTM F2792, 2012). Since AM is relatively more affordable since its earlier days
(Jauhar et al., 2012), STEM programs and small and medium-sized enterprises (SME)

4
throughout the nation are adopting additive manufacturing in their curriculums (Conner
et al, 2014). Idea 2 Product (I2P) labs are education research labs that began in 2011 and
uses material extrusion-AM. The labs first opened in South Africa to provide hands on
learning, experimentation, invention, and new product development. By 2015, more than
a dozen I2P labs have opened in other countries including the U.S. (Wohlers, 2015).
Material extrusion is also known as Fused Deposition Modelling (FDM) and compared to
other AM processes is relatively cheaper and easier to set up with lower consumable and
maintenance cost (Solid Concepts, 2015). With growing access and lower costs of AM,
there are challenges in the aspect of intellectual property (IP).
It is important to address the ease of counterfeit goods and issues of utility and
design patents, copyrights, trademarks, trade secrets and IP agreements. Since AM has
the ability to take a concept to prototype and subsequently, produce a commercial
product, protection of IP assets must be secured quickly (Simons, 2013). Lawyer fees
should also be considered because the protection of AM IP will become a problem over
time as new designs and products are circulated and identical products are produced by
printers (Campbell et al, 2011). Personal 3D printers provide an even bigger challenge
because of its ease of use and ability to print its own repair parts. Consumers have the
ability to print almost any product if they can produce or have access to desired CAD
files.
1.2 - Material Extrusion AM
The history of 3D printers started with the founding of 3D Systems and the patent
of a stereolithography (STL) machine in 1986 by Charles Hull (Matias and Rao, 2015).
STL is currently the default file format that contains part information in the form of

5
tessellated surface (Bechtold, 2015). FDM was later invented by Scott and Lisa Crump
in 1988. During this time, they received two patents: U.S. Patent 5,121,329, issued in
June, 1992; and U.S. Patent no. 5,340,433, issued in August, 1994 (Bechtold, 2015).
Later, FDM became the foundation to their creation of the company called Stratasys
(Gibson, 2010). In 1991, Stratasys introduced the first material extrusion- based FDM
system (Wohlers, 2015). Companies in the 1990s began using 3D printing for
prototyping purposes. In 1993, MIT patented (U.S. Patent no. 5,204,055 issued April,
1993; and, U.S. Patent no. 5,387,380 issued February, 1995) inkjet inspired 3D
technologies (Bechtold, 2015). The expiration of key 3D printing patents has helped the
market and innovation in AM dramatically (Bechtold, 2015). The expiration of patents
has a huge influence on the open source 3D printing community along with CAD
software with simpler user interface and ever-growing accessibility to CAD through
online platforms. Collaboration within the open source 3D printing community has
significantly impacted the innovation of AM technology (Bechtold, 2015).
Almost all CAD Software, such as Solidworks, Siemens NX, AutoCAD, and
Inventor, along with free software, such as AutoCAD 123D, can create part designs in an
STL format. After the design process, a slicing software must be used to develop
toolpath based on the STL file. Currently, there are open source software (e.g. Slic3r)
and proprietary software provided by AM manufacturers (e.g. Makerbot and Stratasys
Fortus).
The market for 3D printed products is rapidly increasing as the technology
continues to improve (Turner et al, 2014). Other materials, such as ceramics, gels, and
CNT-infused composites have also been explored (Bhandari, 2014).

6
Although, the quality of material extrusion parts depends on layer thickness and
printer selection, overall quality of entry-level printers has increased significantly since
2011 (Wohlers, 2015). The mechanical properties are influenced by process variables,
such as layer thicknesses, raster angle (angle of infill pattern within the part), wall
thicknesses, air gap (spacing between infill pattern lines), print orientation, material
selection, infill pattern. . Table 1.1 summarizes entry-level material extrusion AM
available under $5,000 according to Wohlers’ (2015) report The printers are considered
entry-level because of relatively lower machine cost and smaller build envelope.

7
Table 1. 1 Entry-Level 3D Printers under $5,000 (Source: Wohlers Report 2015) Company Model Build Envelope (mm) Approx. Price
Airwolf 3D Airwolf3d.com
AW3D HD AW3D HD 2X
305 x 203 x 305 280 x 203 x 305
$2,995 $3,995
Aleph Objects Lulzbot.com
Lulzbot Taz Lulzbot Mini
298 x 275 x 250 152 x 152 x 158
$1,995 $1,350
Beijing Tiertime Pp3dp.com
UP! Plus 2 UP! Mini
140 x 140 x 135 120 x 120 x 120
$1,649 $899
CEL Cel-robox.com
Robox 210 x 150 x 100 $1,499
Deezmaker Deezmaker.com
Bukobot 8 v2 Duo Dual Extruders Bukito Portable
200 x 200 x 200 140 x 150 x 125
$1,499 kit $899 kit
DeltaMaker Deltamaker.com
Delta Maker 240 dia. X 260 $2,399
Deltaprintr Deltaprintr.com
Deltaprintr 178 dia. X 254 $685 $499 kit
Felix Printers Felixprinters.com
Felix 3.0 255 x 205 x 235 $1,680
German Rep Rap GmbH Germanreprap.com/en/
Protos X400 Neo
400 x 400 x 350 150 x 150 x 150
$2,870 kit $758
Hyrel 3D Hyrel3d.com
System 30 225 x 200 x 200 $4,000
Leapfrog Lpfrg.com
Creatr Creatr HS Creatr XL
230 x 270 x 200 290 x 270 x 180 230 x 270 x 600
$1,354 $2,167 $4,336
MakerBot Industries Makerbot.com
Replicator Replicator 2X Replicator Mini
252 x 199 x 150 246 x 152 x 155 100 x 100 x 125
$2,899 $2,499 $1,375
PowerWasp Wasproject.it
Power WASP Evo Delta WASP 20 40
260 x 200 x 210 200 dia. X 400
$1,832 $2,570
Printrbot Printrbot.com
Printrbot Simple Metal Printrbot Simple Printrbot Metal Plus
150 x 150 x 150 100 x 100 x 100 254 x 254 x 254
$599/$539 kit $349 kit $999/$929 kit
Qualup SAS Spiderbot.eu
Spiderbot v2.0 Pro 180 dia. X 200 $1,430
Robo3D Robo3dprinter.com
Robo R1 ABS + PLA 254 x 229 x 203 $799
SeeMeCNC Soliddoodle.com
Solidoodle 4 Workbench Apprentice Workbench Press
203 x 203 x 203 152 x 152 x 203 305 x 305 x 305 203 x 203 x 203
$599 $799 $1,299 $599
Type A Machines Typeamachines.com
Series 1 305 x 305 x 305 $2,749
Ultimaker B.V. Ultimaker.com
Ultimaker 2 230 x 225 x 205 $2, 054
XYZprinting Xyzprinting.com
Da Vinci 1.0 Da Vinci 2.0 Da Vinci 1.0 AiO
210 x 210 x 210 150 x 200 x 200 200 x 200 x 190
$499 $649 $799
3D Systems Cubify.com
Cube Ekocycle CubePro CubePro Duo CubePro Tri
152 x 152 x 152 152 x 152 x 152 285 x 230 x 270 285 x 230 x 270 285 x 230 x 270
$999 $1,199 $2,799 $3,399 $4,399
3D Technology Co LTD Ff3dp.com
Flashforge Dreamer Creator Pro
230 x 150 x 140 225 x 145 x 150
$1,299 $1,349

8
1.3 – Problem Statement
The focus of this research is to develop a framework related to material extrusion
AM, specifically ‘infill pattern,’ which is an integral and often an overlooked aspect with
respect to resulting production cost and mechanical performance. Relevant background
for this motivation and methodology are presented in this work. Experimental results
from tensile, compression, and bending tests are analyzed in comparison to material
consumption and print costs for both entry-level and production grade printers. Finite
element analysis is also conducted to compare experimental data of 4-point bending
testing with simulated values for validation. Experimental tests were conducted on solid
infill specimens as well as custom air gap specimens to compare optimal costs and
strengths. Trend analysis based on material cost-print volume and print time-cost is
presented to analyze the impact of varied costs of entry-level and production-grade
printers.
The organization of this thesis includes:
Chapter 2 provides a detailed background on material extrusion-AM (FDM), print
and process parameters, mechanical properties, finite element analysis (FEA), and a cost
analysis based on mechanical properties and cost analysis.
Chapter 3 presents the experimental methodology including infill design, printing
conditions, and ASTM testing for mechanical performance.
Chapter 4 details the results and analysis of all the data compiled throughout the
experimentation. This section also presents the calculations pertaining to mechanical
properties, FEA, and cost analysis. Finally, Chapter 5 summarizes this research and
highlights the findings as well as future work.

9
Chapter 2. Background
This chapter presents a detailed literature review in five areas: material extrusion,
effect of process parameters on mechanical loading, infill design, finite element analysis,
and cost analysis with work most relevant to the research goals of this thesis.
2.1 - Material Extrusion AM
Typical feedstock in material extrusion AM is amorphous polymer filaments that
are usually rolled into a loose coil held by a canister, but in production grade printers, the
coil is typically enclosed in a cartridge (Turner et al, 2014). The feedstock is generally
pushed through the print head using a pinch roller mechanism. The material is fed
through the rollers where it is heated and exits the print nozzle as shown in Figure 2.1.
Figure 2. 1 Material Extrusion Process (Bagsik and SchÖppner, 2011)
Along with traditional polymers, such as Polyactic Acid (PLA) and Acrylonitrile
Butadiene Styrene (ABS), there are growing efforts to develop new thermoplastic
composites for material extrusion AM.

10
A study conducted by Belter and Dollar (2015) utilizes a fill compositing
technique in which hollow voids and channels are printed internally, followed by
injection of epoxy resin into the void for reinforcement. Three resin compositions,
including smooth-cast 305 urethane resin, IE-3076 urethane resin, and West Marine 105-
206 resin, were compared using 3-point bending tests. The overall yield strength of
epoxy injected specimens resulted in increased strength of 24 % over solid printed
specimens. The testing resulted in a 19% improvement in failure load (Belter & Dollar,
2015).
2.1.1 - Process Parameters
There is an increasing interest in exploring material extrusion AM due to the
growth in open-access CAD and STL repositories, such as Thingiverse and PinShape to
name a few. It is important to note that several process parameters influence the final
part strength, quality, cost and production time including, but not limited to: (1) material
and support selection (Fischer, 2015); (2) part design (Kumar & Regalla, 2014); (3) layer
thickness (Sood et al, 2010; Boschetto & Bottini, 2014); (4) print design – wall thickness,
infill pattern (Sood et al, 2010; Iyibilgin et al., 2014); (5) print conditions uniformity of
extruder and/or build-bed temperature (Kumar & Regalla, 2014), and (6) print orientation
(Phatak & Pande, 2012). It is important to note that the CAD model (STL file) contains
no information on loading conditions on the part during application, which can vary
widely in different parts and therefore require different material properties. For example,
the mechanical loading conditions of the snap buckle as shown in Figure 2.2 (a) would be
mostly tensile when compared to the laptop wedge shown in Figure 2.2 (b) and the

11
mounting plate shown in Figure 2.2 (c) where primary loading would be compressive and
bending, respectively.
Figure 2. 2 (a) Applications for Tensile (Buckle), (b) Compression (Laptop Wedge), and (c) 3-Point Bending (Mounting Plate) Conditions [Thingiverse]
In addition to specimen material, support material needs to be considered in
material extrusion AM for compatibility in print conditions and ease of removal (Fischer,
2015). ABS is one of the most commonly used thermoplastics in material extrusion AM.
Since its development, Stratasys has developed four versions of ABS with slightly
varying mechanical properties. In this study, ABSplus is the part material used in
production-grade printers. However, it should be noted that the developed infill design
framework can be extended to other materials using the FEA model with relevant
material properties.
2.2 - Infill Design
Among multiple process parameters that could impact the mechanical
performance, infill design is often an overlooked aspect. This is important because
similar to other AM processes (including material extrusion), the water-tight knit 3D
surfaces in a STL CAD model does not contain any information on the infill pattern. In
most cases, software used in material extrusion 3D printers has ‘default’ settings based on

12
conflicting parameters, such as fine resolution vs max build speed vs minimal supports.
Although this approach could be convenient due to ease of use, it does not take into
account material properties and intended mechanical application of the AM part.
Selection of infill dimensions and layer thickness independent of loading conditions can
significantly impact the mechanical properties, material and production cost (Sood et al,
2010 and Baich et al, 2016).
Infill design is also known as the internal structure (Type A Machines, 2016).
Depending on the software used, infill can vary from custom designs to standards, such
as hexagon, triangles, linear, diamonds, cats, and sharks. Typically, an infill density is
selected as a percentage of cross-sectional area or categorical default settings, such as low
and high density. Both open-source and proprietary software are available that convert a
CAD file (parametric data or STL) into build files and/or G-code for process control in
the AM machine. For example, Figure 2.3 shows the different infill parameters that
Slic3r, a free slicing software, offers such as (a) line, (b) concentric, (c) Hilbert chords,
(d) honeycomb, (e) and Archimedean chords. Open source hardware in material extrusion
AM can be attributed to the extensive use of Arduino microcontroller (Pearce, 2012).

13
Open source 3D printing allows for the printing of different materials on most
low-cost AM equipment (Pearce, 2012). Although, open source 3D printing has
tremendous potential, it is still in its infancy and continues to be more expensive than
buying products but could be a great tool for research (Pearce, 2012).
There are other software options that are specific to printers, such as Insight® or
Makerware, which correspond to production-grade Fortus 250mc and entry-level
MakerBots, respectively. For example, infill patterns in Makerware include catfill,
sharks, linear, hexagonal, and morroccan-star. Infill design can be varied as a percentage
of infill cross-section along with other design parameters, such as wall thickness, layer
height, infill angle, roof and floor thickness.
Figure 2. 3 Slic3r Infill Patterns (a) Line, (b) Concentric, (c) Hilbert Chords, (d) Honeycomb, (e) Archimedean Chords
(a) (b) (c)
(e)(d)
(a) (b) (c)
(e)(d)

14
The Fortus software, Insight,® has similar infill design settings but a smaller
selection of infill patterns and relatively limited freedom to edit build files prepared for
processing. Insight® allows only linear patterns, which include: (1-2) low and high
density with different air gaps, (3) solid pattern with negative air gap, and (4) double-
dense density which is an alternating linear pattern in each layer. The other default
settings allow the infill to change directions on alternating layers. Other customizable
infill parameters include air gaps, cap thickness, raster angles, wall thickness, layer
thickness (by varying nozzle), and raster (spacing between wall and infill).
There have been several prior studies on the effect of infill on mechanical
properties. A study by Bagsik et al., analyzed tensile properties of Polytherimide (PEI) in
material extrusion AM for different build orientations (xy, yz, and xz), raster angles,
raster widths, and air gaps along the perimeter of the part as shown in Table 2.2. The
thicker raster width for xy printed specimens had the highest tensile strength when
printed at a normal and negative air gap with a raster angle of 0º. The thinner raster
width had the highest results with negative air gaps at raster angles of 30º and 45º
(Bagsik et al., 2011). It was observed that there was no change in tensile strength
between the two raster widths for positive air gaps and raster angles of 45º, 40º and 90º
among specimens printed in the yz direction. Overall, the smaller raster width had a
higher tensile strength than the larger raster width. As expected, the highest tensile
strength was observed at a negative air gap and 0º raster angle. In the case of specimens
printed in xz direction, the raster widths had no impact on tensile strengths at a default air
gap and raster angle of 0º another point where the results overlapped was when there was
15
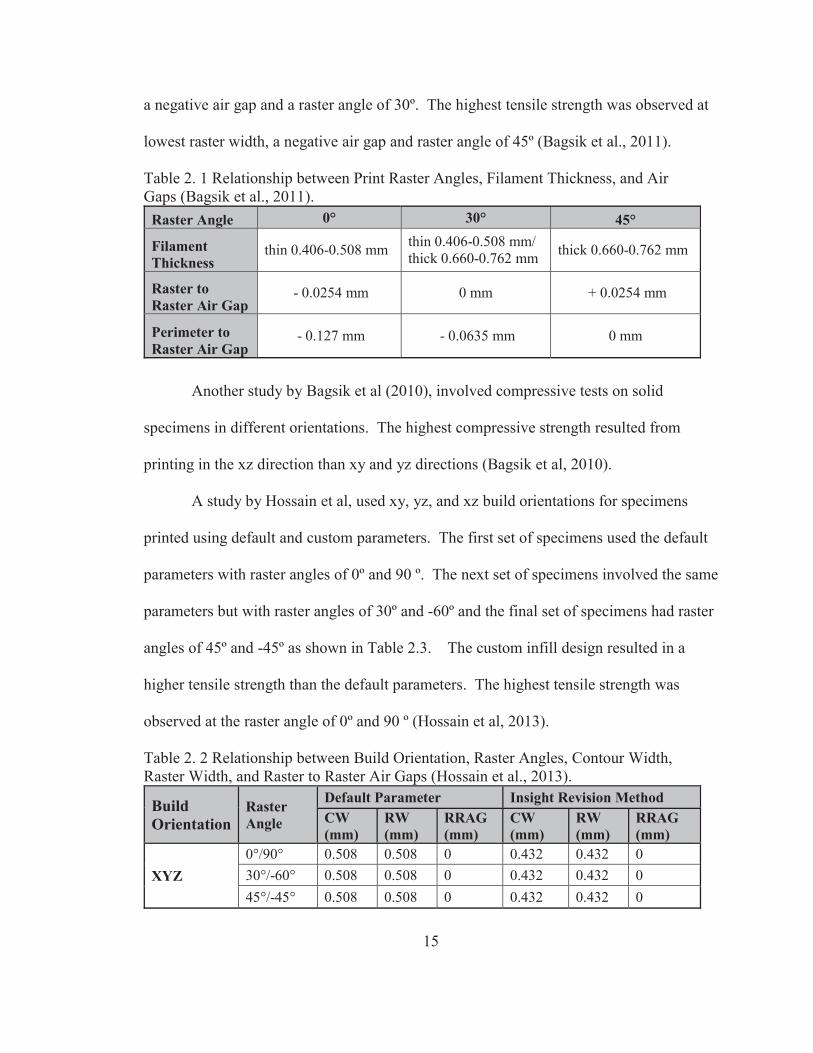
a negative air gap and a raster angle of 30º. The highest tensile strength was observed at
lowest raster width, a negative air gap and raster angle of 45º (Bagsik et al., 2011).
Another study by Bagsik et al (2010), involved compressive tests on solid
specimens in different orientations. The highest compressive strength resulted from
printing in the xz direction than xy and yz directions (Bagsik et al, 2010).
A study by Hossain et al, used xy, yz, and xz build orientations for specimens
printed using default and custom parameters. The first set of specimens used the default
parameters with raster angles of 0º and 90 º. The next set of specimens involved the same
parameters but with raster angles of 30º and -60º and the final set of specimens had raster
angles of 45º and -45º as shown in Table 2.3. The custom infill design resulted in a
higher tensile strength than the default parameters. The highest tensile strength was
observed at the raster angle of 0º and 90 º (Hossain et al, 2013).
Table 2. 1 Relationship between Print Raster Angles, Filament Thickness, and Air Gaps (Bagsik et al., 2011).
Raster Angle 0° 30° 45°
Filament Thickness
thin 0.406-0.508 mm thin 0.406-0.508 mm/ thick 0.660-0.762 mm thick 0.660-0.762 mm
Raster to Raster Air Gap
- 0.0254 mm 0 mm + 0.0254 mm
Perimeter to Raster Air Gap
- 0.127 mm - 0.0635 mm 0 mm
Table 2. 2 Relationship between Build Orientation, Raster Angles, Contour Width, Raster Width, and Raster to Raster Air Gaps (Hossain et al., 2013).
Build Orientation
Raster Angle
Default Parameter Insight Revision Method CW (mm)
RW (mm)
RRAG (mm)
CW (mm)
RW (mm)
RRAG (mm)
XYZ 0°/90° 0.508 0.508 0 0.432 0.432 0 30°/-60° 0.508 0.508 0 0.432 0.432 0 45°/-45° 0.508 0.508 0 0.432 0.432 0

16
Study by Luzanin et al (2014) analyzed the influence of layer thickness, raster
angle and infill percentage on flexural and compressive strengths as shown in Table 2.4.
A layer thickness of 0.3mm resulted in the lowest strength and a 0.1mm layer thickness
resulted in the highest strengths. An infill density of 30 % at 0.1mm layer thickness and
a deposition angle of 0 º resulted in the highest strength. The second highest strength was
observed at an infill percentage of 10, a deposition 60 º and a 0.1-layer thickness
(Luzanin et al, 2014).
Another study by Lyibilgin et al. studied on infill designs with: (1) air gap of
2.54mm, 3.81mm, and 5.08mm and (2) wall thickness of 1.02 mm, 1.52 mm, and 2.03
mm with corresponding cap thicknesses of 1.02 mm, 1.27 mm, and 1.52 mm in in sparse
and double-dense density infill specimens as shown in Table 2.5 (Lyibilgin et al, 2014).
Table 2. 3 Relationship between Layer Thickness, Deposition Angle, and Infill Percentage (Luzanin et al, 2014). Factor Unit Low Level Center Level Upper Level Layer Thickness mm 0.1 0.2 0.3 Deposition Angle ° 0 30 60 Infill % 10 20 30

17
Another study by Sood et al (2010) studied the effects of layer thickness, build
orientation, raster angle, raster width, and air gap on tensile and 3-point bending
specimens. The results of the tensile tests indicate that the strength increases as layer
thickness increases. Higher build temperature caused distortion in the interlayer bonding,
which causes a decrease in strength. It was noted that higher layer thickness resulted in
less distortion of layers and improved overall strength. There was also a strength gain as
the raster angle increased. It was also noted that smaller air gaps resulted in higher
Table 2. 4 Relationship between Air Gaps, Wall Thickness, Cap Layer Thickness, and Infill Patterns (Lyibilgin et al, 2014).
Sparse Air Gap
(mm)
Wall Thickness
(mm)
Cap Layer Thickness
(mm)
Flexure Test Compression Test Strength (MPa/g) Strength (MPa/g)
Sparse Sdd Sparse Sdd Solid - - 2.69 2.69 2.61* 2.61*
2.54
1.02 1.02 3.13 3.89 0.75 1.64 1.27 3.25 3.93 0.72 1.64 1.52 3.30* 4.06 0.71 1.62
1.52 1.02 3.19 3.99 0.89 1.69 1.27 3.26 3.96 0.88 1.65 1.52 3.25 3.98 0.85 1.64
2.03 1.02 3.16 4.02 1.04 1.68 1.27 3.20 4.12 1.01 1.66 1.52 3.18 4.19 0.98 1.65
3.81
1.02 1.02 3.01 4.17 0.78 1.41 1.27 3.07 4.40 0.72 1.39 1.52 2.98 4.58 0.70 1.36
1.52 1.02 3.10 4.07 0.97 1.42 1.27 3.22 4.45 0.93 1.41 1.52 3.08 4.59* 0.88 1.39
2.03 1.02 3.12 3.99 1.06 1.49 1.27 3.14 4.29 1.02 1.47 1.52 3.05 4.42 0.99 1.44
5.08
1.02 1.02 -- 4.43 - 1.36 1.27 -- 4.48 -- 1.34 1.52 -- 4.33 -- 1.33
1.52 1.02 -- 4.58 -- 1.40 1.27 -- 4.38 -- 1.36 1.52 -- 4.38 -- 1.34
2.03 1.02 -- 4.3 -- 1.53 1.27 -- 4.31 -- 1.49 1.52 -- 4.31 -- 1.47
*Denotes the strongest test values for flexural and compression tests with sparse and sparse double dense infill patterns

18
strength. In the case of flexural strength, lower raster angle values resulted in increased
flexural strength. A larger air gap and layer thickness also caused an increase flexural
strength. This study also emphasized that the number of layers changed with different
orientations, which would drastically affect mechanical properties (Sood et al., 2010).
Another study by Iyibiligin and Yigit (2013), compared the compressive strength
in samples with lattice structures as infills and default infill densities. The results
overwhelmingly favored lattice infill structures. The yield stress for the honeycomb was
217% and 253% higher than the double dense and sparse, respectively, and compressive
modulus of honeycomb structure was 286% and 579% stronger than double dense and
sparse, respectively (Iyibilgin & Yigit, 2013).
2.3 - Finite Element Analysis
Finite Element Analysis (FEA) is an important tool to simulate experimental
testing results in order to minimize experimentation on every combination of infill design
parameters, which would be expensive and time consuming. In this study, FEA is used to
predict a variety of stresses on specimens depending on the infill design. In this study,
Von Mises stress will be calculated. Finite Element Method (FEM) is an extension of
earlier work in mechanics. FEM is one of the convenient techniques in FEA by using
computer simulation software to solve complex differential equation problems that
describe different physical processes (Barkanov, 2001; Zhang & Chou, 2006).
Material extrusion AM parts are influenced by the axis of extrusion that fabricates
components with anisotropic characteristics associated with layering. A material that has
elastic properties depends on the print orientation of the specimen and would result in
anisotropic behavior (Ahn et al, 2002).

19
In a AM study by Rosen et. Al (2006), used FEA-like approaches using an Octet-
truss for complex geometries to determine stiffness of lattice structures. Results from the
octet-truss structure showed that the number of cells increased with lowering stiffness in
fixed material densities (Rosen et al., 2006).
2.4 - Cost Analysis
Cost has a large impact on the ability for a company to incorporate rapid
manufacturing. 3D printing is mainly limited to prototyping; although, 3D printing
technology is quickly advancingand some processes can be used instead of traditional
manufacturing. Rapid prototyping (RP) is mainly used in small-volume manufacturing
specifically designs that cannot easily be achieved by injection molding (Hopkinson &
Dickens, 2003). Potential advantages are gained from the use of RP in order to
implement rapid manufacturing includes
Rapid prototyping has a large influence on quality and total cost of the product.
RP has advantages over injection molding and machining in several ways. RP allows for
the use of zero drafts and different wall thickness as well as fine details, which are not
possible using injection molding. Machining can also be avoided by using RP to create a
part. By choosing an orientation that does not require support, a part can be designed as-
is without needing to machine for finishes. Tooling for machining purposes are costly
and consume a significant amount of time in the production timeline (Hopkinson &
Dickens, 2003). Another benefit to RP is the ability to cut down on shipping and
distribution costs and time consumption by eliminating several processes needed in
traditional manufacturing versus one piece of equipment producing the end-use part.

20
The study conducted by Hopkins and Dickens (2003), considered a small lever
and cover with complex geometry. The lever resulted in higher costs with injection
molding for production volumes of 1 to about 5,500 parts. Once 5,500 is achieved
Injection molding becomes more favorable than (SLA), at 6,500 parts injection molding
is favored over Fused Deposition Modeling, and at 13,500 parts injection molding is
favored over selective laser sintering (SLS) (Hopkins & Dickens, 2003).
3D printing has been used successfully in low-volume production for sectors,
such as aerospace and prosthetics (Petrick & Simpson, 2013). 3D printing in aerospace
seems to be the most competitive because of the reduced lead times in complicated parts.
Weight is also a very important component in aerospace design and 3D printing allows
for quick production of parts with lattice structures and lessened density in order to save
on weight (Petrick & Simpson, 2013).
A study by Jauhar et al (2012), compared the costs of using RP to make ABS
casting patterns for a rotor and inlet manifold with the costs of making a traditional wax
pattern. The lead time for the ABS pattern was 9.41 hours for the inlet and 12.45 hours
for the rotor while the lead times for wax patterns were 16 hours for the inlet and 23
hours for the rotor. The patterns made with RP showed a 58% reduction in lead time for
the inlet manifold and 54% reduction in lead time for the rotor when compared to the wax
pattern. The total cost for the RP pattern for the inlet manifold was 5,497 Rs versus a
cost of 8,498 Rs for the wax pattern. The costs for the RP rotor pattern was 9,254 Rs in
comparison to 14,513 Rs for the wax pattern (Jauhar et al., 2012).
2.5 - Summary
In summary, this chapter presented a literature review on additive manufacturing,

21
specifically material extrusion. Material extrusion is the use of process parameters,
which were also reviewed as well as previous studies with data on infill design in
correlation to strength. In addition, some brief studies on the relevance of using finite
element analysis for simulation purposes and several studies on cost analysis were
reviewed. It was observed that current studies mostly focused on infill design and
strength. There is a need to combine infill pattern, mechanical properties, and a cost and
time analysis to narrow optimal infill patterns. Then FEA validation can be used as a
simulation tool to decrease the amount of time and money spent on prototyping.

22
Chapter 3. Methodology
This chapter details the experimental methodology including infill designs and
AM processing, mechanical testing and design of experiments, Finite Element Analysis
(FEA), and finally, cost models employed in this study to evaluate the role of AM
machine selection.
3.1 - Material and Experimental Methodology
The mechanical performance and production cost of a manufactured part depend
on the material selection, design, production volume and selection of processing
equipment. As detailed in Chapter 2, access to AM has rapidly expanded due to lowering
equipment and operating costs but at relatively lower quality when compared to
production-grade printers. Hence, in this study, two categories of AM machines are used:
(a) Production grade and (b) Entry-level (typically defined as less than $20,000).
The production grade material extrusion AM machine used in this study is
Stratasys Fortus 250mc using ABSplus-P430 (Acrylonitrile Butadiene Styrene) with a
T14 nozzle tip and a corresponding layer thickness of 0.254 mm. The build envelope for
the printer is 254 mm x 254 mm x 305 mm. Mechanical properties using ASTM D638
standards for ABSplus-P430 (provided by Stratasys) is specified as: Ultimate Tensile
Strength (UTS) of 33 MPa, tensile modulus of 2,200 MPa and an elongation percentage
of 6% at failure. The material data sheet also includes Flexural properties using ASTM
D790 as flexural strength of 58 MPa.
The entry-level AM machine used in this study is a MakerBot Replicator 2X. The
printer utilizes ABS filament spool with a diameter of 1.75 mm. The nozzle has a

23
diameter of 0.4 mm and has a layer resolution of 100 microns as well as a position
precision of 11 microns in the xy and yz direction and 2.5 microns in the xz direction.
The build envelope has the dimensions of 24.6 mm x 12 mm x 155 mm. MakerBot ABS
filament has a maximum compressive strength of 49 MPa, an Ultimate Strength of 38
MPa, and a Flexural Strength of 59 MPa.
A comparison of material properties of “filament material” ABSplus-P430 and
ABS for Fortus and MakerBot printers is summarized in Table 3.1 (Fortus, MakerBot,
Stratasys).
Table 3. 1 Strength Data for Fortus and MakerBot ABS Material Manufacturer-specified Mechanical Properties
ABSplus-P430 (Fortus/Stratasys)
ABS (MakerBot/3D Stratasys)
UTS (MPa) 33 38 Tensile Modulus (MPa) 2,200 2,320 Elongation (%) 6 7 Flexural Strength (MPa) 58 59 Compressive Strength (MPa) 49 49
3.1.1 - ASTM Standards
In this study four ASTM standards for polymers were employed: ASTM D638
(tensile testing), ASTM D695 (compression testing), ASTM D790 (3-point flexural
testing and ASTM D6272 (4-point flexural testing) as shown in Table 3.2.
Table 3. 2 Nominal Dimensions for ASTM Standard Specimen- Tensile, Compression, 3-Point Bending, and 4- Point Bending (ASTM D638, 2014; ASTM D695, 2010; ASTM D790, 2010; ASTM D6272, 2010).
Specimen Type Length (mm)
Width (mm)
Thickness (mm)
ASTM Standard
Strain Rate (mm/mm/min)
Tensile Type I 165 13 3.2 D638 5.0 Compression 12.7 12.7 25.4 D695 1.3
3-Point Bending 127 12.7 3.2 D790 0.5 4-Point Bending 120 25 6.5 D6272 2.96

24
3.1.2 - Process Planning Software
The STL files of the ASTM specimens were created for processing in slicing
software. In the case of Fortus 250mc, Stratasys process planning software Insight® was
used. It provides recommended default print parameters as well as options to customize
print parameters. In the case of MakerBot printers, Makerware is to create G-code based
on STL files. Makerware allows for varying the infill parameters, orientation, support
options and layer thickness based on surface finish requirements. For the purposes of this
study, the layer thickness was set at 0.25 mm, standard surface enhancement without any
supports and orientations for the custom infill patterns were printed in xy direction. In
order to ensure similarity, the same set of print parameters was employed in Insight
software for Fortus 3D printer. Figure 3.1 describes terms related to infill print design in
material extrusion AM. Raster angle is defined as the angle in which the the rasters are
printed with respect to the contour in a single layer. Contour width is the outer perimeter
thickness. Slice height is also known as layer thickness. Raster width is defined as the
thickness of raster infill layer. Raster to Raster air gap is the spacing distance between
rasters.

25
3.1.3 - Preliminary Study
A preliminary study was conducted to understand the basic effects of different
infill designs on resulting mechanical performance. Specifically, tensile, 3-point bending
and compression testing were performed for four different infill parameters as shown in
Figure 3.2. They are labeled as D1 (low), D2 (high), D3 (double-dense) and D4 (solid)
shown in Figure 3.2.
Figure 3. 2 FDM Build Styles (a) solid-build (D4), (b) sparse-build (D1 and D2), (c) sparse-double-dense build (D3) (Iyibilgin, 2014).
Figure 3. 1 Insight® Build Parameters (Hossain, 2013)

26
The solid design (D4) has a negative air gap of -0.03 mm to ensure 100% density.
The low density design (D1) has an air gap of 2.03 mm and the high density parameter
has an air gap of 0.0 mm. The raster angle in D1 and D2 is deposited at a 45° angle and
is alternated by 90° in between each layer. The double-dense design has an air gap of
2.03 mm but each layer includes both directions of pattern. Figure 3.3 shows the cross
section of the printed specimens, (a) low density, (b) high density, (c) double dense. Infill
design parameters for all densities are uniform with a cap thickness of 1.16 mm (top and
bottom solid layers) and a contour width of 0.508 mm.
Figure 3. 3 Cross Sections of Tensile Specimens With Different Infill Parameters (a) Low Density, (b) High Density, (c) Double Dense Density
In this experiment, the tensile and 3-point bending specimens were printed in the
xy direction to eliminate the need for print support material. The compression specimens
were printed in the yz direction because it reflects the typical compressive loading
direction with respect to the layers. Figure 3.4 shows the different build orientations that
were used in this thesis.

27
Figure 3. 4 Build Orientations (a) XY direction, (b) YZ direction, (c) XZ direction
3.1.4 - Custom Infill Design
In this study, the raster angle was set at a default value of 45º, contour width at
0.508 mm and cap thickness was set at 3 layers on the bottom and top of the specimen,
which is equal to 0.762 mm each. The air gaps were changed from the default parameters
to 1 mm, 3 mm, 6 mm, 9 mm, and 12 mm, which is the maximum air gap currently
feasible using Insight software as shown in Figure 3.5. The tensile specimens were
printed in xy direction as previously referred to in Figure 3.4 and the four-point bending
specimens were printed in all three orientations (xy, yz, xz as seen in Figure 3.4).
Figure 3. 5 4-Point Bending Specimens from Left to Right Air Gap 1 mm, 3 mm, 6 mm, 9 mm, 12 mm.
(a) (b)
(c)

28
The following infill design parameters can be modified by the user in Insight
software: contour widths, air gaps between contours, raster widths, raster angles, air gaps,
number of solid layers and number of contours on each layer as shown in Figure 3.6.
After the preliminary experiments, the final design of experiments used ASTM D6272-
4-point bending and ASTM D638 for tensile testing. 4-point bending was used as the
final project because it is comprised of both compressive and tensile loading. There were
limitations on the minimal cap thickness, which could have resulted in 5 infill layers in
the previous designs. The 4-point bending specimen provided the freedom of 19 sparse
layers’ total if printed in the xy direction. The amount of layers in the specimen allows to
better capture the effects of infill design while minimizing the effects of solid layers in
the top and bottom of the specimens. The specimens were printed at a 45º raster angle,
cap thickness of 0.762 mm, and air gaps of 1 mm, 3 mm, 6 mm, 9 mm, and 12 mm
respectively as shown in Figure 3.6. The analysis also involved changing the print
orientation of the 4-point bending specimens, which were printed with a solid infill in the

29
xy, yz, and xz direction as referred to in Figure 3.4. Similar infill design and solid (cap)
print parameters were followed in the case of entry-level printer, i.e. MakerBot.
Figure 3. 6 Insight® Toolpath Parameters 3.2 - Mechanical Testing
Mechanical testing was conducted using Instron Model 5967 with 30 kN
maximum load capacity and an accuracy of ± 0.25% of full load based on ASTM Tensile
D638, Compression D695, 3-Point Bending D790, and 4-Point Bending D6272 test
requirements. Test speeds varied as follows: Tensile: 5 mm/min; Compression: 1.3
mm/min; 3-Point Bending: 0.5 mm/min; 4-Point Bending: 2.96 mm/min (ASTM D638,

30
2014; ASTM D695, 2010; ASTM D790, 2010; ASTM D6272, 2010). The dimensions of
specimen were measured three times and averaged using a digital caliper with an
accuracy of ± 0.01 mm prior to testing. Three specimens per infill design were tested for
each loading condition. Figure 3.6 shows the specimens in the Instron testing machine for
all the loading conditions.
Figure 3. 7 From Left to Right Tensile, Compression, 3-Point Bending, and 4-Point Bending
Raw data was compiled from all of the tests for each loading condition and stress-
strain curves were computed using the experimental specimen dimensions for each
condition. Ultimate, Compressive, Flexural Strengths, Modulus of Elasticity Equivalent
(MPa) and E-Equivalent were calculated using Equations 1-11 below. The rationale
behind determining the E-Equivalent is to capture the effects of layers in 3DP and
resulting anisotropy based on build direction when compared the solid material Modulus
of Elasticity (shown in Table 3.1). The calculated E-Equivalent will be used in FEA
studies. Equation 1 is used to calculate the stress, σ, for tensile specimens. Equation 2 is
used to calculate the strain, ε.
Equation 1

31
where F is the applied load at the given moment (N) and A is the cross-sectional
area of the specimen (mm2).
Equation 2 where ΔL is the extension (mm) of the part at the given moment and Lₒ is the
original gage length (mm). The ultimate tensile strength (UTS) is calculated at the
highest loading conditions for each specimen and average UTS (N) was calculated from
every specimen of each infill design. The E-Equivalent equivalent (MPa) of tensile
specimen was determined using the slopes of the stress-strain curves for each infill design
(average of three specimens).
The raw data from the 3-point bending specimens was used to calculate stress and
strain from the stress-strain curves using Equations 3 and 4. Equation 3 is used to
calculate stress (MPa), σ, for 3-point bending specimens and Equation 4 is used to
calculate strain, ε:
Equation 3
Where F is the load (N) at a given moment, L is the support span (mm), B is the
width (mm) of the specimen, and H is the thickness (mm) of the specimen.
Equation 4
Where d is the deflection (mm) at a given moment, H is the thickness (mm) of the
specimen, and L is the support span (mm).
In order to calculate E-Equivalent (MPa), E, Equation 5 was used;
Equation 5

32
Where F is the breaking load (N), L is the support span, d is the deflection (mm)
at the breaking point, B is the width (mm) of the specimen, and H is the thickness (mm)
of the specimen.
In the case of 4-point bending, Equations 6 is used to calculate the stress (MPa),
σ, and Equation 7 is used to calculate the strain, ε:
Equation 6
Where F is the load (N) at a given moment, L is the support span (mm), B is the
width (mm) of the specimen, and H is specimen thickness (mm).
Equation 7
Where d is the deflection (mm) at a given moment, H is the thickness (mm) of the
specimen, and L is the support span (mm).
To calculate the E-Equivalent (MPa), E, for the 4-point bending specimens
Equation 8 is used:
Equation 8
Where F is the breaking load (N), l is loading span (L/3) (mm), L is the support
span (mm), d is the deflection (mm) at the breaking point, and I is the moment of inertia
(mm4), Equation 9.
Equation 9
Where B is the width (mm) of the specimen and H is the thickness (mm) of the
specimen.
To calculate flexural strength (MPa), the equation for both 3-point bending and 4-
point Equation 10 is used.
Equation 10

33
Where M is the moment (N-mm), Equation 11, y is half the thickness (H/2) (mm),
and I is the moment of inertia (mm4) (Equation 9).
Equation 11
Where F is the breaking load (N), l is the loading span (L/3) (mm), and L is the
support span (mm).
3.3 - Finite Element Analysis
Finite element analysis (FEA) was used in this study to model and simulate
mechanical loading conditions for 4-point bending tests. This is important to
reduce/eliminate the number of experiments required to test specific part/infill design
followed by mechanical testing. Experimentation would require significant design time,
print and testing, along with labor, machine, and material cost.
The software used in this study was ANSYS Workbench 16.1 for static structural
analysis using CAD files with specific infill designs corresponding to Insight build plans,
including wall thickness, air gap dimensions, cap thickness, and raster angle. The
material was specified with an isotropic E-Equivalent value based on solid tensile
samples in XY, YZ and XZ directions and the Poisson’s ratio was specified to be 0.35,
per ABS material specifications. The Young’s modulus was specified according to the
modulus value calculated in the experimental test data using the equations above. The E-
Equivalent for the solid specimen was used in the analysis instead of the material
modulus of elasticity value to factor in the any error that can be caused by the extrusion

34
process. The E-Equivalent modulus value used in this experiment was 2.24 GPa while
the value for ABS material was 2.2 GPa.
Figure 3. 8 Example Import Geometry on ANSYS Workbench 16.1
The next step was to optimize the mesh size and starting mesh sizes of 0.5 mm,
0.75 mm, 1.0 mm, 1.5 mm, and 2.0 mm were used to conduct a mesh convergence
analysis. The mesh size of 1.0 mm resulted in the optimal mesh. Nodes were chosen
along where the load and supports make contact with the specimen as per ASTM D6272,
2010 standards. The nodes were assigned to a named selection, which is then applied to
corresponding nodal displacement. Since the load was applied in the yz direction, the
following settings were applied: The nodal displacements for the left support had xy, yz,
and xz component values of 0 mm and the nodal displacement for the right support had a
yz and xz component of 0 mm and the xy component was not constrained. The nodal

35
displacements for the left and right load included xy and xz components of 0 mm and a
yz component of 0.3 mm. The simulation in this study calculated the reaction forces
when a specific deflection is specified, which will be compared with experimental results.
Equation 12 is used for calculating deflection between two loads (Roylance, 2000).
Equation 12
Where F is the load (N), d is the deflection (mm) at a given point (in this study,
0.3 mm), E is E-Equivalent (MPa), I is moment of inertia (mm4), a is the distance
between the support and the loading point (mm), l is half the support span (mm), and L is
the support span (mm). Figure 3.8 shows schematic of the 4-point bending loading
conditions.
Figure 3. 9 4-Point Bending Loading Conditions
The simulation was run three times for each infill condition along with X, Y, and
Z print orientations to determine the average load required for the specified deflection
0.3mm). Along with the load deflection analysis on ANSYS, Von Mises stress was
calculated. The Von Mises stress was calculated by selecting the surfaces that were in

36
contact with the loading bar as shown in Figure 3.9. The green line represents where one
of the loads was placed. Upon compiling Von Mises stress from ANSYS, the values were
compared to the experimental data.
Figure 3. 10 ANSYS Stress Analysis Process
A validation study was then conducted by simulating 4-point loading conditions
for specimens with 4 mm and 10 mm air gaps using CAD models with infill parameters
that were specified in the Insight software. Interpolations of E-Equivalent graphs from
testing of samples with infill air gaps of 1, 3, 6, 9 and 12 mm were used to predict an E-
Equivalent value for 4 mm and 10 mm specimens. The predicted E-Equivalent values
were used as input in the FEA analysis as the modulus values. The specimens are then
printed on the Fortus and MakerBot using the infill air gap of 4 mm and 10 mm’s and
tested on the Instron equipment. The results were then compiled and compared to the
simulated data to validate the FEA analysis using E-Equivalent values.

37
3.4 - Cost Analysis
In addition, cost per specimen was determined for each ASTM specimen.
Equation 13 demonstrates that the total cost per specimen included the material cost (feed
stock cost × material volume) and the production cost (print cost × print time).
Equation 13
Where C is total cost per part ($), MC is material cost ($/mm3), V is material
volume per part (mm3), PC is print cost ($/min), and T is print time per part (min).
Since set-up and part retrieval times are uniform for all print specimens, they were
not included in the print time and hence, not considered in the production cost. The feed
stock cost was uniform at $0.00028/mm3, based on a standard spool price of $260 for a
volume of 922,600 mm3. For the Stratasys Fortus 250mc equipment, the usage cost was
determined to be $0.50/min. The MakerBot had a feed stock cost of $0.000045/mm3
based on a spool cost of $43 and a volume of 961,538 mm3. The MakerBot equipment
usage cost was determined to be $ 0.17/min. Therefore, total cost variation in the
different ASTM and infill design specimens was owing to the material volume used and
the necessary print time.
Finally, in addition to the comparative infill study, a preliminary cost sensitivity
analysis was conducted with respect to usage costs and specimen volume. The specimen
was scaled to a range of 10–550% of the original ASTM tensile specimen. The total cost,
as a function of specimen volume and usage cost, was determined.
A summary of the design of experiments is presented in Table 3.3 below, which
includes printer selection, corresponding infill designs, build orientations and FEA
studies that were used in the study.

38
Table 3. 3 Design of Experiments
Printer Selection
Infill Design
Build Orientation
ASTM Testing Conditions
Cost Analysis
FEA Studies
Production-grade Fortus 250mc
Preliminary: D1, D2, D3, D4
XY D638 D790 D695
Production Cost ($/min) Material Cost ($/mm3)
N/A
Custom Infill: 1, 3, 6, 9, 12 mm, and Solid
XY D638 D6272
Load Deflection And Stress Von- Mises
Validation Study: 4 and 10 mm
XY D6272 Load Deflection And Stress Von- Mises
Entry-level MakerBot
Custom Infill: 1, 3, 6, 9, 12 mm, and Solid
Solid XY Solid YZ Solid XZ Air Gaps XY
D6272 Load Deflection
3.5 - Summary
This chapter presented the experimental methodology of this study including the
design of experiments for the preliminary study using default settings in tensile,
compression, and 3-point bending specimens, custom infill parameters for the tensile
specimen study as well as the final study using 4-point bending specimens. This chapter
also detailed the infill design, printing conditions and mechanical testing conditions. The
procedure for FEA studies using ANSYS Workbench 16.1 and finally, the cost analysis
procedure was also summarized.

39
Chapter 4. Results and Analysis
This chapter presents the results of the three studies outlined in Chapter 3 and
analyzes the effects of infill design on mechanical strength and production costs. The
preliminary study involved tensile, 3-point bending and compression testing of AM
specimens fabricated using the production grade Fortus 250mc printer with default infill
settings. The second study involved tensile testing specimens using custom infill settings
to evaluate E-Equivalent for each infill, strength, and analysis of corresponding total cost
using metrics outlined in section 3.4. The third study using same infill densities from the
second study involved 4-point bending specimens since most applications of material
extrusion AM will be subjected to flexural loading. The 4-point flexural testing involved
specimens fabricated with custom infill using both production-grade Fortus and entry-
level printers using MakerBot Replicator 2 along with Finite Element Analysis (FEA)
using ANSYS software to simulate loading conditions. In addition, results from FEA
validation studies conducted on 4 mm and 10 mm air gap specimens and corresponding
experimental results are presented. Finally, results and analysis of production cost is
detailed to study the reduction in strength (%) with cost savings (%) when compared to
solid specimens.
4.1 - Preliminary Study
The preliminary study used default print parameters detailed in section 3.1.3.
Tensile, compression, and 3-point bending tests were conducted in this study based on
the methodology noted in section 3.2. Cost analysis was performed to compare different
infill patterns and resulting mechanical strength during experimentation as outlined in

40
section 3.4. The average print time (min) and material volume (mm3) for different infill
designs are shown in Table 4.1. It should be noted that in general the double-dense infill
(D3) had the longest print time and the high-density infill (D2) required the most material
other than the solid (D4). The double-dense infill had a higher print time because of the
excess time it takes to print in two directions of raster on each layer. The high density
had similar print time to that of solid specimens, which can be attributed to finer air gaps
and alternating print directions within each layer. Although, the print times are equal,
high density specimens had a lower volume than the solid specimens.
Based on values observed in Table 4.1, the total unit cost for each infill design per
ASTM specimen was determined and is presented in Figure 4.1. It can be observed that
double-dense (D3) is the most expensive infill design since print cost (Fortus 250mc) is
more significant than material cost. It is also noted that double-dense (D3) and solid (D4)
infill costs were similar in the case of tensile specimens and the costs of high density
(D2) and double-dense (D3) infills were similar in 3-point bending specimens. Overall
low density (D1) had the lowest cost, which is expected because of the larger porosity.
The print time is significantly reduced because of shorter toolpath and lower material
Table 4. 1 Average Print Time (min) and Material Volume (mm3) for Default Print Parameters D1, D2, D3, D4.
Tensile Compression Bending
Density Symbol Print Time (min)
Volume (mm
3)
Print Time (min)
Volume (mm
3)
Print Time (min)
Volume (mm
3)
Low D1 24 6882.57 16 2458.06 17 4424.51 High D2 25 8029.66 17 3277.41 18 4916.12
Double Dense D3 26 7374.18 19 2949.67 18 4916.12
Solid D4 25 9012.89 18 4260.64 17 5571.60

41
volume when compared to other infill designs. Double-dense infill design had the
highest cost overall because of longer toolpath in each layer since the pattern crosses on
each layer instead of alternating from layer to layer.
4.1.1 - Tensile Testing
The stress- strain characteristics for tensile specimens with different infill patterns
are shown in Figure 4.2. The plot shows that the solid (D4) infill specimens had the
highest E-Equivalent and UTS, as expected because of the theoretical 0 % porosity. It is
interesting to note that double-dense (D3) infill design has lower UTS than both low
density and high density infills, although double-dense has more material volume and is
more expensive than low and high density specimens. Double-dense was expected to
outperform the other infill patterns because of the higher print time and the infill
reinforcement in two directions on each layer. It should also be noted that the specimens
were highly repeatable from the stress-strain curves of each specimen.
Figure 4. 1 Total Cost ($) for Default Infill Designs

42
Figure 4. 2 Test - Stress vs. Strain for Default Parameter
4.1.2 - Compression Testing
The stress versus strain behavior of compression specimens is shown in Figure
4.3 with the average mechanical properties summarized in Table 4.2. It was observed that
high density and double-dense specimens had a very similar E-Equivalent. The results for
this test had relatively more variation than the tensile testing, which can be attributed to
compressive loading perpendicular to the build directions. When compared to isotropic
bulk compression specimens, the specimens used in this study were manufactured in
layers with inherent anisotropy. Further, since the actual volume of the ASTM specimens
was lower when compared to tensile testing, it is postulated that solid material (cap and
wall thickness) could have significantly affected the results (when compared to infill
volume). The compressive strength results were based on material volume, as expected ,
i.e. as sum of infill + solid volume increased, the compressive strength increased.

43
Figure 4. 3 Compression Test- Stress vs. Strain Default Parameters
Table 4.2 shows the ultimate tensile strength, compressive strength, and 3-point
flexural strength along with modulus values for all three mechanical tests. This table is
specifically for the default parameters of low, high, and double-dense infill designs and
corresponding standard deviations for the strength and modulus values. The UTS,
compressive strength, and flexural strength had lower standard deviations than the E-
Equivalent values for all three testing conditions. The standard deviations for the E-
Equivalents in 3-point bending tests had higher standard deviation than compressive and
tensile standard deviations, which could be due to the lack of repeatability in the
specimens seen in Figure 4.4. The compression E-Equivalent for the solid specimens
was 12.80 MPa, which is demonstrated by the large gap in solid lines in Figure 4.3.

44
Table 4. 2 Strengths and E-Equivalent for Tensile, Bending and Compression for Default Parameters
Tensile Compression 3-Point Bending
Density UTS (MPa)/
Ave. Standard Deviation
Modulus, E (MPa)/
Ave. Standard Deviation
Comp. Strength (MPa)/
Ave. Standard Deviation
Modulus, E (MPa)
Ave. Standard Deviation
Flexural Strength (MPa) Ave. Standard
Deviation
Modulus, E (MPa)
Ave. Standard Deviation
Low (D1) 21.64 0.628 445.03 9.49 23.79 0.129 624.55 5.01 32.85 0.26 456.68 30.34
High (D2) 21.71 0.812 542.04 3.19 27.77 1.587 824.28 7.13 34.42 0.71 459.83 31.73
Double Dense (D3)
20.00 0.197 521.84 8.21 31.09 0.209 850.52 6.56 36.90 0.78 554.41 13.43
Solid (D4) 27.27 1.059 653.64 2.25 56.76 1.344 1191.9 12.80 43.75 0.65 573.06 28.45
4.1.3 - 3-Point Bending Testing
The stress -strain behavior of the 3-point bending specimens is shown in Figure
4.4 with the average mechanical properties summarized in Table 4.3. It is evident that
specimens exhibited highly repeatable mechanical properties within each infill design.
The flexural strength results were as expected with respect to material volume in each
infill design, with solid (D4) and low density (D1) infill having the highest and lowest
UTS, respectively. It was also observed that low-density (D1) and high-density (D2) infill
flexural strengths were very similar; the implication of this is discussed in the cost
analysis.

45
Figure 4. 4 3-Point Bending Test Stress vs. Strain Default Parameters
4.1.4 - Cost vs. Strength of Preliminary Study
Figures 4.5 (a) and 4.5 (b) show the cost savings (%) and reduction in strength
(%), for respective infill designs in the preliminary tensile, 3-point bending, and
compression when compared to solid infill specimens. A higher reduction in cost (%) is
equivalent to greater cost savings and higher reduction in strength (%) indicates greater
loss in mechanical strength when compared to corresponding solid infill specimens.
In the case of compression, the cost savings are very high for low density
specimens and there is a decreasing trend in the case of high density and double-dense
specimens. The loss in compressive strength shown in Figure 4.5 (b) follows a similar
negative linear trend but has a smaller slope indicating that there is not much gain in
strength between low density, high density, and double-dense specimens. This could be
due to lowering material volume and build orientation with respect to the loading
direction. Since the load was applied parallel to the build orientation, the layers collapsed
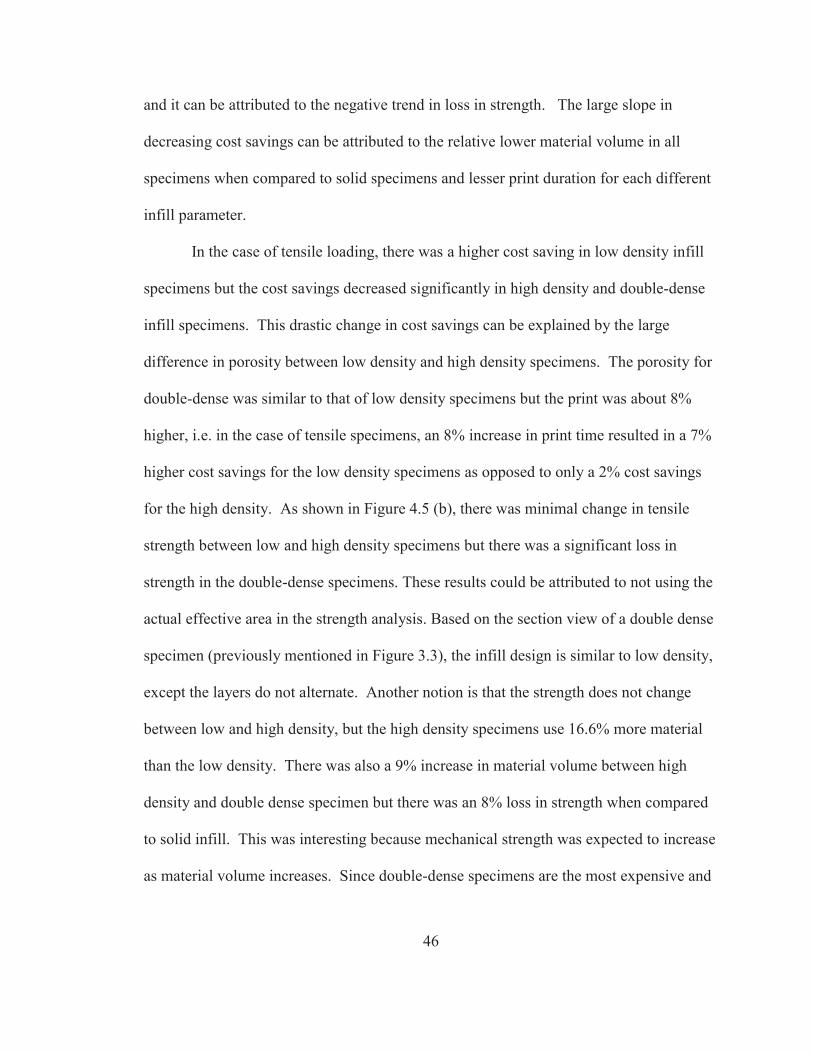
46
and it can be attributed to the negative trend in loss in strength. The large slope in
decreasing cost savings can be attributed to the relative lower material volume in all
specimens when compared to solid specimens and lesser print duration for each different
infill parameter.
In the case of tensile loading, there was a higher cost saving in low density infill
specimens but the cost savings decreased significantly in high density and double-dense
infill specimens. This drastic change in cost savings can be explained by the large
difference in porosity between low density and high density specimens. The porosity for
double-dense was similar to that of low density specimens but the print was about 8%
higher, i.e. in the case of tensile specimens, an 8% increase in print time resulted in a 7%
higher cost savings for the low density specimens as opposed to only a 2% cost savings
for the high density. As shown in Figure 4.5 (b), there was minimal change in tensile
strength between low and high density specimens but there was a significant loss in
strength in the double-dense specimens. These results could be attributed to not using the
actual effective area in the strength analysis. Based on the section view of a double dense
specimen (previously mentioned in Figure 3.3), the infill design is similar to low density,
except the layers do not alternate. Another notion is that the strength does not change
between low and high density, but the high density specimens use 16.6% more material
than the low density. There was also a 9% increase in material volume between high
density and double dense specimen but there was an 8% loss in strength when compared
to solid infill. This was interesting because mechanical strength was expected to increase
as material volume increases. Since double-dense specimens are the most expensive and

47
the densest, it was expected to gain strength in comparison to low density and high
density.
In the case of 3-point bending, Figure 4.5 (a) shows a larger cost savings in low
density infill specimens and significantly lower cost savings in high density and double-
dense infill specimens. The high density and double dense specimens were more
expensive than the solid specimens. This is due to the print time for the high density and
double-dense density being 5.5% higher than solid specimens. The volume of the solid
specimen is 13% greater than double dense specimen, and this is interesting because it
did not have any effect on the cost when compared to print time. Figure 4.5 (b) for 3-
point bending specimens shows a 3% gain in strength demonstrated by a smaller slope
between low density and high density infill specimens. There was a 5 % gain in strength
between double-dense density and high density with no change in cost but when
compared to solid, solid is more cost effective and stronger.
Figure 4. 5 (a) % in Cost Savings; (b) % Average Loss in Strength When Compared to Solid

48
It should also be noted that the cost savings for compression, tensile and 3-point
bending specimens for the double-dense infill parameter were all negative since solid
infill specimens are more economical than the double-dense infill specimen.
When considering the applications in section 2.1.1, specifically Figure 2.2, based
on the tensile loading conditions that the part would be subjected to, a low density infill
would be the strongest and most cost effective option. In the case of the laptop wedge,
which would be subjected to compressive loading, the ideal infill patterns would be low
density and high density, depending on maximum loading conditions. Both are cost
effective, but the low density is 8 % weaker than the high density infill. For the
mounting plate, which is subject to flexural loading, the ideal infill would be solid
because there is only a cost savings of 3% while the strength gain is around 25% when
compared to low density infill. Any other infill results in negative cost.
4.2 - Custom Infill Parameters
The following sections include all the studies conducted using custom infill
parameters. The studies include both tensile and 4-point bending specimens, which
involve calculating stress vs. strain curves, flexural strength, and E-Equivalent for both
Fortus and MakerBot, as explained previously in Section 3.4, specifically Table 3.3. The
mechanical testing data of custom infill specimens was used to calculate E-equivalent for
both Fortus and MakerBot.
4.2.1 - Custom Infill Parameters on Tensile Specimens
In this study, tensile specimens were printed using custom infill parameters in
Fortus and MakerBot. The parameters that were chosen were: air gaps of 1 mm, 3 mm, 6

49
mm, 9 mm, and 12 mm; as well as the raster angle of 45º and cap thickness of 3 layers
(0.762 mm) as described in Section 3.2. Table 4.3 notes the different air gaps, along
with print time (min), volume (cm3), Ultimate Tensile Strength (MPa), and E-Equivalent
(MPa). The print time did not change between the 6 mm, 9 mm, and 12 mm air gap
specimens. Standard deviations were calculated for UTS and modulus and the results
demonstrated that there was very little variation, meaning that the specimens were
consistent and had high repeatability. When referenced and compared to previous Table
4.2, it is noticed that the UTS values are very similar but the volumes are drastically
different as shown in Table 4.1. The specimen volumes in Table 4.3 are lower than
preliminary testing specimens, yet the strength does not change drastically. The UTS for
1 mm air gap is lower than the UTS of the low density (air gap of 2.03 mm) UTS in
Table 4.2. This could be due to the difference in cap thickness.
Table 4. 3 Print Time (min), Volume (mm3), UTS (MPa), and E-Equivalent (MPa) Tensile
Density Print Time (min)
Volume (mm3)
UTS (MPa)
Ave. Standard Deviation
Modulus, E (MPa)
Ave. Standard Deviation
1 mm 25 7184 20.96 0.361 570.864 7.902
3 mm 24 6742 20.17 0.319 578.629 2.665
6 mm 23 6591 19.88 0.372 567.004 9.532
9 mm 23 6540 19.90 0.809 560.422 1.868
12 mm 23 6507 19.60 0.275 560.220 0.816
Figure 4.6 shows the stress versus strain for the tensile specimens with custom air
gaps. The specimens are very consistent because of the small standard deviations. There
is only a 7 % difference in UTS between 1 mm and 12 mm air gaps. This could be
because of similar material volumes in each specimen. This explains why UTS is

50
significantly affected by material volume. The difference between the highest and lowest
E-Equivalents for the air gap specimens is 3% but it is important to notice that the 3 mm
modulus is the highest value instead of the 1 mm specimen. As expected, 1 mm
specimens were the strongest and 12 mm gaps were the weakest, but 9 mm had a higher
UTS than the 6 mm specimen, which is interesting because of the lower material volume.
Since the values did not differ significantly from the previous study in Section 4.1,
changing the air gap to a higher value will result in higher cost savings, lower material
consumption, and similar strength values.
4.2.2 - Cost vs. Strength of Tensile Air Gap Specimens
Figure 4.7 shows the difference in total cost between each of the specimens. The
total cost is the combination of the material cost and the production cost ($/min). When
compared to the 1 mm specimen total cost, the 6 mm, 9 mm, and 12 mm specimens were
much more affordable at over $1 cheaper than the 1 mm. The cost for the 6 mm, 9 mm,
Figure 4. 6 Stress vs. Strain Tensile Air Gap

51
and 12 mm specimens were very similar because the print times for all three specimens
were the same (min) and material volumes were similar. This is not as beneficial as the
price difference between 1 mm and 6 mm specimens but could be beneficial if a part was
to be produced in high production. When compared to the previous study in 4.1, the air
gap study is over 4 % cheaper between the solid specimens and the 1 mm specimen.
Figure 4. 7 Total Cost of Tensile Air Gap Specimens
Figure 4.8 (a) is the cost savings (%) between the different air gap specimens and
4.8 (b) shows the reduction in strength (%) between the specimens. Both are in
comparison to solid specimens. Figure 4.8 (b) shows that there is very little loss in
strength between all the specimens, specifically between 3 mm, 6 mm, 9 mm, and 12 mm
specimens. There is a slightly higher loss in strength between 1 mm and 3 mm
specimens. This could be due to the difference in material volume. The difference in
material volume between the 1 mm and 3 mm is almost three times larger than the
difference between the material volumes between the 3 mm and 6 mm specimens. A
valid conclusion from this observation would be that even though the air gap spacing is

52
increased at linear intervals, the specimen volume does not vary at the same rate due to
uniform wall and cap thickness. If the cost savings are taken into account, the 6 mm
airgap is the optimal choice under tensile loading based on % cost saving and % loss in
mechanical strength. The 9 mm and 12 mm air gap specimen are could also be considered
because of the relatively similar strength results but a significantly higher cost savings.
4.2.3 - 4-Point Bending with Custom Infill Parameters
In this study, specimens were printed on a Fortus 250mc and a MakerBot
Replicator 2x. The specimens were printed using 4-point bending ASTM standards for
dimensions. The infill parameters were similar to the previous study where the air gaps
varied from 1 mm, 3 mm, 6 mm, 9 mm, and 12 mm, raster angle of 45º and a cap
thickness of 3 layers (0.762 mm). Solid specimens were also printed with three different
orientations of xy, yz, and xz. Table 4.4 shows the average 4-point flexural strength
(MPa) and the E-Equivalent (MPa) of the Fortus printed specimens and the MakerBot
printed specimens. Table 4.4 shows that the flexural strength values decrease as the air
gap value increases. There was an anomaly in the strength values between 6 mm and 9
Figure 4. 8 (a) Cost Savings (%) of Air Gap Tensile Specimens (b) Loss in Strength (%) of Air Gap Tensile Specimens

53
mm specimens for the Fortus printed specimens. This error happened 5 out of 6 times the
specimen was tested but the standard deviation was only 0.39, making the error
consistent. There was also an anomaly in the E-Equivalent results for the 9 mm specimen.
There was a 13% rise in E-Equivalent for the Fortus specimens between 9mm and 1 mm
specimens but the modulus drops at 12 mm by 30%. The MakerBot flexural strength
values were also lower than that of the Fortus, which is expected because of the better
quality and repeatability produced by the Fortus. Both printers produced expected results
in the solid xy, yz, and xz printed specimens. The solid specimen printed in the yz
direction resulted in higher strengths than the specimens printed in the xy direction. This
is due to the load being applied perpendicular to build direction versus the specimens
printed in the xy direction are loaded perpendicular to the print surface. The standard
deviations for the Fortus specimens were lower than that of the MakerBot specimens,
which can be explained by the quality of the Fortus specimens. The accuracy of the
Fortus is significantly better resulting in higher repeatability.
Table 4. 4 Flexural Strength (MPa) and Modulus of Elasticity (MPa) for Fortus and MakerBot Specimens
Fortus MakerBot
Infill Flexural Strength
(MPa)
Ave. Standard Deviation
Modulus (MPa)
Ave. Standard Deviation
Flexural Strength
(MPa)
Ave. Standard Deviation
Modulus (MPa)
Ave. Standard Deviation
1 mm 50.19 1.52 1214.77 21.51 45.63 3.00 1258.21 151.6
3 mm 45.54 1.25 1285.87 46.10 35.72 5.64 1311.76 282.2
6 mm 37.00 1.63 1276.39 110.0 27.52 1.42 1250.00 60.70
9 mm 37.82 0.39 1408.69 83.40 14.64 0.74 734.89 41.36
12 mm 28.98 3.41 978.80 163.9 14.33 2.92 615.03 110.6
Solid XY 88.24 0.78 2240.39 81.19 95.41 2.24 2163.65 84.84
Solid YZ 109.73 1.24 2906.82 46.86 98.72 1.27 2743.27 195.2
Solid XZ 77.76 1.73 3497.32 94.54 53.04 6.95 3385.62 208.4

54
4.2.4 - 4-Point Bending Mechanical Properties
Figure 4.9 shows the flexural strengths of the solid specimens and the air gap
specimens. The Fortus specimens had better flexural strengths in every infill except for
the solid specimens printed in the xy direction. Flexural strengths for the 9 mm and 12
mm air gap were significantly larger for the Fortus specimens than the MakerBot
specimens and that is due to the sagging in the top layers of the MakerBot specimens.
This was observed in the larger air gap specimens printed on the MakerBots resulting in a
higher percentage of error.
Figure 4.10 shows the stress versus strain of the Fortus printed air gap specimens.
Three specimens were printed for each infill parameter and the specimen results were
very consistent with each other. The graph shows the expected trend from 1 mm through
12 mm, although there is an overlap between the 6 mm and 9 mm specimens. The 9 mm
air gap specimen was different, as is seen in the red graphed line. The 9 mm specimen
resulted in a higher slope in the stress-strain graph than the 6 mm specimen. Since the 9
Figure 4. 9 Flexural Strength Graphs for Solid and Air Gap Fortus and MakerBot

55
mm specimen was an anomaly, the sample was printed 3 more times to compare the
findings and the values still resulted in an anomaly. The 12 mm specimen also had some
inconsistency in its results but it was very minimal.
Figure 4.11 shows the stress versus strain of the Fortus printed solid specimens.
The specimens were printed in three orientations of xy, yz, and xz directions. The
specimens were very consistent and there was very little change between the slopes of the
xy and xz direction specimens. As expected and shown in Table 4.4, the yz specimen
was the strongest in flexural strength. The three orientations seemed to have very similar
E-Equivalent values but the xz printed specimen did not have an elastic region, which is
shown by the xz specimen graph abruptly stopping at a strain around 0.025 mm/mm. The
xz specimen did not have a long elastic region because of the loading relative to the build
direction. The specimen was loaded parallel to the build causing to the layers to
Figure 4. 10 Stress vs. Strain for Fortus Air Gap Specimens – 4-Point Bending

56
delaminate. The graph shows that the specimen began to bend before it fractured, as
reflected in the curve at the end of the graph.
Figure 4.12 shows the stress versus strain curves for the MakerBot printed air gap
specimens. The specimens are less consistent than the Fortus specimens, which is
expected since the MakerBot is an entry-level printer and does not have the same print
accuracy that the Fortus. The Fortus also has an enclosed build area, which is kept at a
consistent temperature while the MakerBots are not enclosed and only have a heated
build plate, which does not always result in uniform specimens. Although there are many
challenges in printing with the MakerBots, the overall general trend of the specimens was
as expected. The stress decreased as the air gap became larger. There was some overlap
in the 9 mm and 12 mm air gap samples but otherwise the specimens followed the
expected trend. It is also noted that the larger the air gap, the shorter the plastic region is
as well as the lower the slope used to calculate the E-Equivalent. This could be due to
Figure 4. 11 Stress vs. Strain for Fortus Solid Specimens- 4-Point Bending
0
10
20
30
40
50
60
0 0.01 0.02 0.03 0.04 0.05
Stre
ss (
MP
a)
Strain (mm/mm)
Fortus Solid Air Gap - 4 Point Bending Test - Stress vs. Strain
XZ Solid
YZ Solid
XY Solid

57
the large air gaps causing the top solid layer to sag in the air gaps making the surface
weaker during the test.
Figure 4.13 shows the stress versus strain curve of the MakerBot solid printed
parts. The specimens were printed the same as they were in the Fortus. They were
printed in the xy, yz, and xz directions. The results for the MakerBot showed a different
result than it did with the Fortus printed specimens. The specimens printed in the yz
direction were still the strongest but there was a larger difference in slopes between the
xy and xz printed specimens. The yz specimen for the Fortus had a larger difference
between the yz and the xy specimens when compared to MakerBot specimens. The xz
specimen did not have any elastic region, as opposed to the Fortus printed samples which
had a small amount of elastic region. This demonstrates the specimen failure under load
without any bending.
Figure 4. 12 Stress vs. Strain for MakerBot Air Gap Specimens- 4-Point Bending

58
Figure 4.14 shows the E-Equivalent of the solid and air gap for the Fortus and
MakerBot printed specimens. The Fortus specimens had larger modulus of elasticity than
MakerBot specimens for the solid printed parts. The E-Equivalents for the 1 mm and 3
mm air gap specimens were higher for MakerBot than Fortus but Fortus specimens for 6
mm, 9 mm, and 12 mm air gaps were higher than MakerBot printed specimens. As
shown in the flexural strength results in Figure 4.9, the air gaps of 9 mm and 12 mm had
significantly higher E-Equivalent values in Fortus specimens than MakerBot specimens.
The 9 mm Fortus specimen is also noticeable in this graph because of the 48% difference
between the Fortus and MakerBot E-Equivalent values. In the case of 12 mm air gap
specimens, a 37% gap is also noticeable.
Figure 4. 13 Stress vs. Strain for Solid printed MakerBot Specimens- 4-Point Bending

59
4.2.5 - Cost Analysis for 4-Point Bending
The cost analysis for the 4-point bending Specimens is similar to the previous
studies. The print time (min) and print volumes are gathered from the software to
calculate total cost. The print volume (mm3) was calculated using the mass of the
specimens and converting to mm3 by dividing the mass by a factor of 1.03
(MakerBot.com, 2016). The calculations were conducted for both the Fortus and
MakerBot so that an accurate comparison of entry-level and production-grade cost
analysis can be made. Table 4.5 shows the corresponding print times and volumes for the
different specimen densities printed on the Fortus and MakerBot. It is noted that the print
time for Fortus is lower than MakerBot for the air gap specimens. Fortus print time does
not change between 9 mm and 12 mm air gaps while the MakerBot print time continues
to decrease. Another interesting observation is that the Fortus print time rose
significantly when printing in yz and xz directions this is due to the extra layers in the
selected orientations but the MakerBot print times had minimal changes when printing
solids, making the yz and xz directions in the MakerBot more affordable.
Figure 4. 14 Modulus of Elasticity (MPa) for Specimens Printed on Fortus and MakerBot

60
Figure 4.15 shows the difference in weight of the specimens for both Fortus and
MakerBot as discussed in Table 4.5.
Figure 4. 15 Specimen Weight for Fortus and MakerBot
Figure 4.16 shows the total cost comparison between Fortus and MakerBot
specimens. The total cost is the summation of the production cost and material cost.
Overall the total cost was higher for Fortus specimens because of the higher machine cost
0.00 5.00 10.00 15.00 20.00 25.00 30.00 35.00 40.00
1 mm3 mm6 mm9 mm
12 mmSolid XYSolid YZSolid YZ
Mass (g)
Infil
l
Mass of Fortus vs MakerBot Specimens
Fortus
MakerBot
Table 4. 5 Print Time (min) and Volume (mm3) for Fortus and MakerBot- 4-Point Bending
Fortus MakerBot
Density Print Time
(min) Volume (mm3)
Print Time (min)
Volume (mm3)
1 mm 36 10090 68 10020
3 mm 30 8070 51 7350
6 mm 28 7360 45 6330
9 mm 27 7180 43 4960
12 mm 27 7020 38 4840
Solid XY 46 18240 76 17840
Solid YZ 83 18540 76 18010
Solid XZ 94 18420 74 18750

61
and material cost. The material volumes and print times were almost always larger for
Fortus specimens than MakerBot specimens. MakerBot results in a lower total overall
cost but Fortus provided better quality and accurate parts. Fortus is about twice the cost
of MakerBot, except when printing solid specimens in the yz and xz directions, Fortus
was significantly more expensive than MakerBot. Fortus Solid XZ specimen was 46%
more expensive than the Solid XY specimen because of the print time but there was only
a 1% difference in the Solid XZ and Solid XY specimen printed on the MakerBot.
Figure 4. 16 Total Cost ($) of 4-Point Bending Specimens Printed on MakerBot and Fortus
Figure 4.17 shows the breakdown of total cost into Material Cost ($/mm3) and
Production Cost ($/min) for both Fortus and MakerBot specimens. The production cost
for the Fortus specimens was on average 86% of the total cost. The production cost for
the MakerBot specimens was on average 95% of the total cost, leaving the material cost
at only 5% of the total cost, thus making production cost as the most influential variable
in the total cost.
0.00
10.00
20.00
30.00
40.00
50.00
60.00
1mm 3mm 6mm 9mm 12mm Solid XY
Solid YZ
Solid XZ
Cos
t ($)
Infill
Total Cost
MakerBot Fortus

62
Figure 4. 17 Material Cost and Production Cost for Fortus and MakerBot Specimens
Figure 4.18 (a) shows the cost savings (%) and Figure 4.18 (b) shows the
reduction in strength (%) of Fortus and MakerBot 4-point bending specimens. The cost
savings for Fortus printed parts are shown by the solid line and MakerBot is shown by the
dashed line. The graph shows that there is a larger cost savings for 1 mm, 3 mm, and 6
mm specimens printed on Fortus in comparison to MakerBot. Even though MakerBot
specimens are cheaper than Fortus parts, there is a larger cost savings for those densities.
There is a breakeven point at the 9 mm air gap specimen because it is equally cost
effective to print on either printer for that specimen. For the 12 mm air gap specimen,
MakerBot has the higher cost savings. The graph also shows that there is no change in
cost between 9 mm and 12 mm air gap for Fortus printed specimens. Figure 4.18 (b)
shows that Fortus specimens are stronger overall and there is no breakeven point or
overlap between the two printers in regards to strength. Interestingly, there is no loss in
strength between 9 mm and 12 mm air gap specimens printed on the MakerBot but there
is a cost savings; meaning that it is more cost effective to print a 12 mm air gap specimen
rather than a 9 mm air gap specimen on the MakerBot. Though the cost savings are

63
equal, the MakerBot specimen would not be favorable in the 9 mm due to the 27 % loss
in strength in comparison to the Fortus 9 mm specimen. The gap between 12 mm
specimens is also unfavorable at a 17% loss in strength in the MakerBot specimen. This
could be due to lack of quality in the MakerBot specimens at the higher air gaps.
Another observation is that there is no loss in strength between the 6 mm and 9 mm air
gap specimens printed on the Fortus but there is a 2% gain in cost savings in using 9 mm
air gap infill design. It is also important to note that 1 mm air gap specimens are not cost
effective but do provide a significant gain in strength. There is a 23 % increase in cost
savings from 1 mm to 3 mm MakerBot specimens, most likely due to the 26% drop in
volume between the two infill designs. Overall, the 6 mm and 9 mm specimens have
about the same cost savings for both entry-level and production-grade printers even
though the material cost for the Fortus is 86% more than material cost of the MakerBot.
MakerBot would be more favorable to be used in solid printed parts because of the
similarities in strength and while the cost is 53%lower than that of Fortus. It can be
concluded that the higher the air gap, the quality of the specimen is sacrificed when using
an entry-level printer.
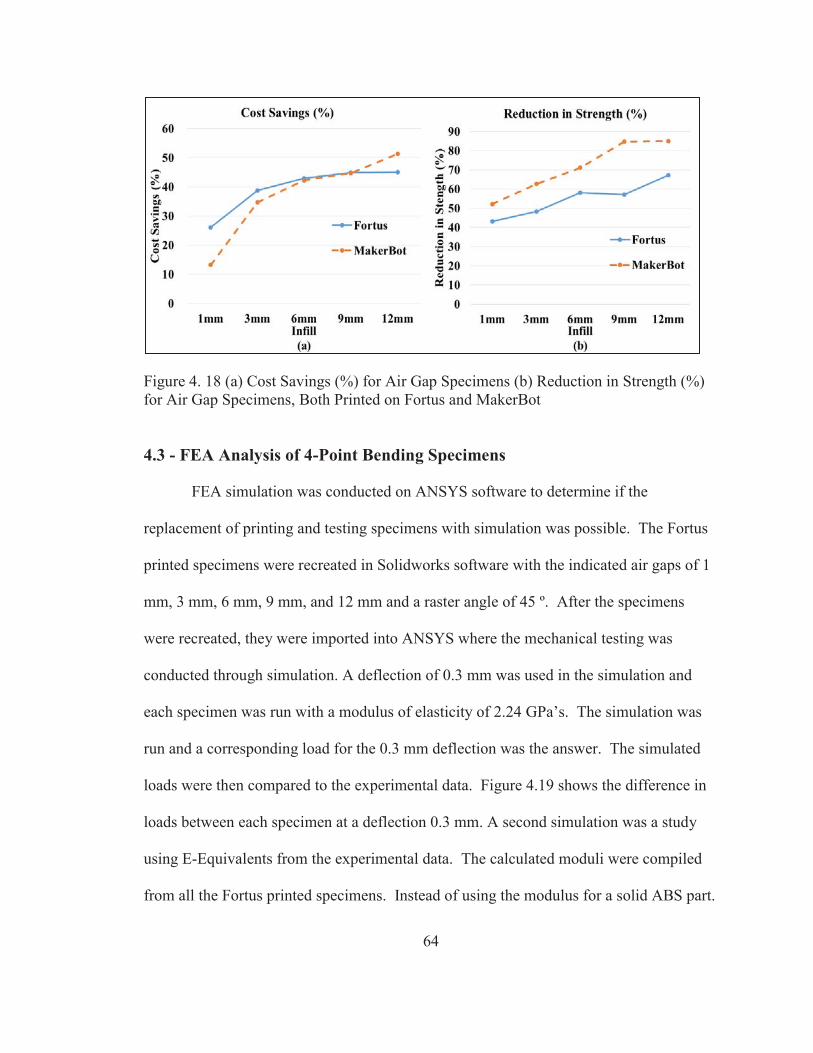
64
Figure 4. 18 (a) Cost Savings (%) for Air Gap Specimens (b) Reduction in Strength (%) for Air Gap Specimens, Both Printed on Fortus and MakerBot
4.3 - FEA Analysis of 4-Point Bending Specimens
FEA simulation was conducted on ANSYS software to determine if the
replacement of printing and testing specimens with simulation was possible. The Fortus
printed specimens were recreated in Solidworks software with the indicated air gaps of 1
mm, 3 mm, 6 mm, 9 mm, and 12 mm and a raster angle of 45 º. After the specimens
were recreated, they were imported into ANSYS where the mechanical testing was
conducted through simulation. A deflection of 0.3 mm was used in the simulation and
each specimen was run with a modulus of elasticity of 2.24 GPa’s. The simulation was
run and a corresponding load for the 0.3 mm deflection was the answer. The simulated
loads were then compared to the experimental data. Figure 4.19 shows the difference in
loads between each specimen at a deflection 0.3 mm. A second simulation was a study
using E-Equivalents from the experimental data. The calculated moduli were compiled
from all the Fortus printed specimens. Instead of using the modulus for a solid ABS part.

65
The E-Equivalent of each specimen was plugged in individually and simulated on a solid
block with the dimensions of the 4-point bending specimen. Figure 4.19 shows the
simulated E-Equivalent data using a deflection of 0.3 mm and the output is a load (N).
The E-Equivalent study allows for a quicker simulation as long as the corresponding
modulus of elasticity is known.
Figure 4. 19 Simulated Load (N) at 0.3 mm Deflection for all Fortus Printed Parts
Table 4.6 shows the percent error between the ANSYS simulated data and the
experimental data. All data was within 8 % error. The benefit of the E-Equivalent study
is to quickly simulate a specimen without having to draw the complex infill design
created by the software. By using the experimental calculated E-Equivalent, similar
results (within 8.6% error) was achieved.

66
Table 4. 6 Percent Error of Simulations in Comparison to Experimental Data for 4-Point Bending Testing 1 mm 3 mm 6 mm 9 mm 12 mm Solid XY
FEA (% Error) 6.8% 2.8% 4.7% -5.8% -1.1% 2.7%
E Equiv. (% Error) 0.9% 6.2% 8.5% 8.6% 3.3% 0.2%
Along with the load deflection study, stress analysis (Von Mises) was conducted.
The Von Mises stress values of each specimen was exported from the loading area as
previously explained in section 3.3. The stresses were averaged and compared to the
experimental stress at a 0.3 mm deflection. Table 4.7 shows the results of Von Mises
stress in ANSYS compared to the experimental stresses.
Table 4. 7 ANSYS Stress vs. Experimental Stress at 0.3 mm Deflection
1 mm 3 mm 6 mm 9 mm 12 mm Solid XY ANSYS Stress (MPa)
1.111 1.138 1.104 0.941 0.910 1.846
Exp. Stress (MPa)
1.199 1.196 1.051 0.949 0.901 2.014
% Error -7.4% -4.8% 5.1% -0.9% 1.0% -8.4%
Section views were taken at the 0.3 mm deflection marker in ANSYS simulation
software. The section views show what stresses are occurring on the inside of the
specimen after the 0.3 mm has been reached. Figure 4.20 shows section views of the
specimens from solid xy to 12 mm air gap. The section view is taken where the loading
bar is in contact with the specimen and the maximum stress occurs in the specimen. The
straight lines in the solid specimen could be due to the lack of infill at the center of the
specimen and therefore, the stress is more equally distributed throughout. In the sparser

67
specimens, there is significantly lower amount of stress in the center of the section view
as opposed to the outside shell of the specimen.
Figure 4. 20 ANSYS Section Views of Solid XY, 1 mm, 3 mm, 4 mm, 6 mm, 9 mm, 10 mm, and 12 mm Specimens.

68
Figure 4.21 shows a top view of the specimens cut where the loading bar touches
the specimen. The top view shows a clearer transition from the straight lines of the solid
infill to the curved stress lines of the sparse specimens.
Figure 4. 21 Top View of ANSYS Stress Von- Mises Tests

69
4.4 - Validation Modeling
In this section, the results of the validation study are presented. The validation
was conducted for both 4 mm air gap and a 10 mm airgap specimen. The experimental
process is explained in section 3.3. First, a Solidworks file is drawn corresponding to the
4 mm and 10 mm air gaps. The file is then imported into ANSYS. For the validation
study, the graph showing the E-Equivalent trend is used to interpolate E-Equivalent for 4
mm and 10 mm infill designs. The load reactions are then recorded, as well as the stress
(Von Mises) for comparison to experimental data. Table 4.8 shows the additions of 4 mm
and 10 mm error percentages between the simulated data versus the experimental data.
The 4 mm and 10 mm validation specimens had a higher percent error than the other
specimens at 9.4% for the 4 mm specimen and 11.5% for the 10 mm specimen.
With regard to the stress comparison between the experimental data and the
ANSYS simulation. Table 4.9 demonstrates the addition of the validation study. The 4
mm specimen had an error of 6.1% error and the 10 mm specimen had an air gap of 1.6
% error, which is a lot more accurate than the deflection study. This could be due to the
fact that the stress values are from the actual drawn specimen and not part of the E-
Equivalent study.
Table 4. 8 Percent Error of ANSYS Simulated Specimens for Comparison of Validation Specimens
1 mm 3 mm 4 mm 6 mm 9 mm 10 mm 12 mm Solid XY
FEA (% Error) 6.8% 2.8% -5.1% 4.7% -5.8% 0.3% -1.1% 2.7%
E Equiv. (% Error)
0.9% 6.2% -9.4% 8.5% 8.6% -11.5% 3.3% 0.2%

70
Table 4. 9 ANSYS Stress vs. Experimental Stress at 0.3 mm Deflection for Validation
1
mm 3
mm 4
mm 6
mm 9
mm 10
mm 12
mm Solid XY
ANSYS Stress 1.111 1.138 1.103 1.104 0.941 1.145 0.910 1.846
Exp. Stress 1.199 1.196 1.175 1.051 0.949 1.128 0.901 2.014
% Error -7.4% -4.8% -6.1% 5.1% -0.9% 1.6% 1.0% -8.4%
Figure 4.22 shows the strength changes between the Fortus and MakerBot
specimens for 4 mm and 10 mm air gap printed specimens in comparison to previous
results for other air gap specimens. As expected, the Fortus printed specimens had a
higher strength than that of the MakerBot printed specimens. The Fortus specimens
followed a more constant trend while the MakerBot specimens followed a downward
trend but weren’t as predictable as the Fortus printed specimens. It is interesting to note
that for the 9 mm and 12 mm air gaps, the MakerBot specimens had a 50% lower flexural
strength than the 10 mm air gap specimen.
Figure 4. 22 Flexural Strength of Previous Specimens with Added Validation Specimens
020406080
100120
Solid XY 1 mm 3 mm 4mm 6 mm 9 mm 10 mm 12 mm
Flex
ural
Str
engt
h (M
Pa)
Infill
Flexural Strength - Air Gap - Fortus vs. MakerBot- Validation
Fortus MakerBot
Flex
ural
Str
engt
h (M
Pa)

71
Figure 4.23 shows the E-Equivalent for the validation specimens in comparison to
previous data for both Fortus and MakerBot printed specimens. It is important to note
that the MakerBot specimens had a higher modulus of elasticity than the Fortus printed
specimens for both the 4 mm and 10 mm specimens. The 4 mm specimen had a lower E-
Equivalent that did not follow the trend of the graph, which would have affected the
results of the validation test. For the validation test, a best fit line was used to determine
the 4 mm and the 10 mm E-Equivalents for the FEA study. The E-Equivalent for the 4
mm specimen resulted in a 6.1% error and the 10 mm specimen resulted in a 1.6%
percent error, therefore resulting in satisfactory results to validate the study.
Figure 4.24 (a) is the graph corresponding to the cost savings (%) for the
specimens, including the validation specimens of 4 mm and 10 mm. Graph (b) shows the
reduction in strength (%) of the added validation specimens. It is interesting to note that
for 4 mm specimens the cost savings is higher for the Fortus specimen rather than the
MakerBot specimen which follows the previous trend between the 3 mm and 6 mm air
gap specimens. Graph (b) shows a 17% gain in strength between 9 mm and 10 mm for
Figure 4. 23 Modulus of Elasticity for Validation Specimens and Previous Specimens

72
MakerBot printed specimens, which is odd because the trend graph b was following
showed a continuous loss in strength. When looking at the graph (b), specifically the
Fortus specimens, the trend of the specimens getting weaker as the air gap becomes
larger is consistent throughout the data. Another important note is that for graph (a), the
MakerBot specimens for the 10 mm air gap specimens have a higher cost savings than
the Fortus, which follows the previous trend.
4.5 - Summary
This chapter explains the results of a preliminary study of mechanical properties
conducted on tensile, compression, and 3-point bending specimens printed using default
print parameters on a Fortus. The study concluded with interesting observations in
regards to cost savings in comparison to strength. It was concluded that low density (D1)
had the highest cost savings and the lowest loss in strength for tensile specimens, making
D1 the ideal infill to use in tensile situations. There was no loss in strength between D1
and high density (D2) specimens but there was a significant drop in cost savings further
Figure 4. 24 (a): Cost Savings (%) for Validation Specimens; (b): Reduction in Strength (%) for Validation Specimens
0102030405060708090
1mm 3mm 4mm 6mm 9mm 10 mm 12mm
Red
uct
ion
in S
tren
gth
(%
)
Infill
Reduction in Strength (%) - Validation
Fortus
MakerBot
0
10
20
30
40
50
60
1mm 3mm 4mm 6mm 9mm 10 mm 12mm
Cos
t S
avin
gs (
%)
Infill
Cost Savings (%) - Validation
Fortus
MakerBot

73
proving that D1 is optimal for tensile specimens. D1 had a UTS of 21.64 MPa, which was
the highest strength next to the solid specimen. Another observation was that there was
little difference in strength loss between all the specimens for the 3-point bending test.
The highest cost savings for the 3-point bending specimens was with D1 specimens but
there was no savings lost between D2 and D3 specimens, while there was a gain in
strength in D3 specimens. It is important to note that the cost savings for the bending
specimens of D2 and D3 were in the negatives meaning that solid (D4) is the ideal infill
to use in this situation as it is cheaper and stronger than both D2 and D3 infills. The
optimal specimen in the compression testing would be D2, as it was average between two
extremes. D1 had high cost savings but high strength loss and D3 had low cost savings
but high strength gains. D2 offers an average cost savings for an average strength. The
compressive strength for D2 was 27 MPa, which is not much different than D3 at 31.09
MPa, making D2 ideal for the cost.
A second study of tensile specimens printed usedcustom infill parameters on a
Fortus printer. In this study, the tensile specimens had air gaps of 1 mm, 3 mm, 6 mm, 9
mm, and 12 mm. An interesting detail from this study is that there was very little
variation in cost between the 6 mm, 9mm, and 12 mm specimens but there a very slight
strength gain in the 9 mm specimen. The optimal specimen would be the 9 mm air gap
because the cost savings were higher than the average loss in strength between all the
specimens. Another point to notice is that the cost savings improve as the air gap
becomes larger even though the gain is not as significant between the 6 mm, 9 mm, and
12 mm specimens. Another takeaway is that the UTS stays relatively constant when
compared to solid specimens.

74
The third study of 4-point bending specimens with the same custom infill as the
second study were printed on both a Fortus and a MakerBot printer. Cost analysis was
conducted on each study as well as FEA simulation on the 4-point bending specimens.
The cost analysis shows that Fortus had higher cost savings than the MakerBot until a
breakeven point at 9 mm air gap specimen. This is interesting because while Fortus
specimens are more expensive than MakerBot specimens, there is a point where it is
more beneficial to print on a production grade rather than the entry level printer. It is also
important to note that MakerBot continues to rise in cost savings as the specimens
become sparser. while the cost savings begin to level out in sparser specimens printed on
the Fortus. The MakerBot specimens also had a high loss in strength throughout the infill
air gaps but plateaued between the 9 mm and 12 mm air gap. The Fortus specimens also
hit a plateau between the 6 mm and the 9 mm air gap specimens. The ideal infill for this
study would be the 3 mm air gap specimen for the Fortus printed specimens and the 3
mm air gap specimen for the MakerBot printed specimens. The flexural strength of the 6
mm Fortus specimen was 37 MPa in comparison to 3 mm Fortus specimen had a flexural
strength of 45.54 MPa but the cost savings were not much different than 6 mm air gap
specimen, making the Fortus printed infill of 3 mm air gap the optimal choice. The
MakerBot had similar results in that the loss in strength was relatively lower than other
options, while the slope of the cost savings line was very high between the 1 mm and 3
mm air gap, making the cost savings significantly better for the 3 mm specimen.
Production grade printers, while more expensive than entry level printers, provide
a better quality part and are more reliable than the MakerBot specimens. The mechanical
testing results were more consistent when printed on the Fortus rather than when printed

75
on the MakerBot. There is a better surface finish and the overall strength is better. There
are large cost savings on time spent, which in turn saves money as well as less material
consumption. Even though there are different weights because of the higher initial
expense of a Fortus in comparison to a MakerBot and a higher material cost for the
Fortus as well, the cost savings are significantly higher while using Fortus.

76
Chapter 5: Conclusion
In summary, Chapter 1 presented an introduction of the research to be presented,
as well as a brief history of additive manufacturing and the emergence of fused
deposition modeling. Chapter 1 also discussed the importance of considering Intellectual
Property as technology advances. The rapid improvements in processes make it difficult
to maintain knowledge of all new technologies and patents. Lawyers must continuously
be aware of new technologies and protect the developers of technologies.
Chapter 2 discussed background research on all the sectors under additive
manufacturing but later focused on material extrusion specifically. Process Parameters
for 3D printing on FDM equipment were discussed in detail. Background on previous
studies using infill patterns and testing for mechanical properties were researched for
relevance to the study conducted in this thesis. Chapter 2 also went into detail in the
subjects of FEA, cost analysis examples, and relevant applications, and it was noted that
while there are many studies that focus on each section individually, there is the need to
combine infill pattern, mechanical properties, cost and time analysis, and FEA modeling.
Chapter 3 explained the procedure for three studies conducted in this thesis. First
was the preliminary experiments of using default parameters on the Fortus 250 mc. The
second study applied custom infill parameters on the Fortus Insight software to Tensile
specimens. The parameters that were exercised in the experiment were custom air gaps
of 1 mm, 3 mm, 6 mm, 9 mm, and 12 mm, a raster angle of 45 º, and a cap thickness of 3
layers (0.762 mm). Finally, the third study conducted the same infill parameters as the
second study on 4-point bending specimens. In addition to the air gap specimens, solid
specimens were printed in xy, yz, and xz orientations. Specimens for this study were

77
printed on both a Fortus 250 mc and a MakerBot Replicator2x for later cost analysis
comparison between entry-level printers and production grade printers. Finite Element
Analysis using ANSYS Workbench 16.1 was conducted by calculating the load
deflection of 0.3 mm as well as Stress Von-Mises at 0.3 mm deflection. The FEA
simulation was used to compare computer data to experimental data in the hopes to
validate the simulation and remove the need for experimental testing.
Chapter 4 discussed the results of each study. Ultimate strength, compressive
strength, and flexural strengths were calculated for the preliminary study. An E-
Equivalent Modulus was also calculated for every specimen. Stress- Strain curves were
graphed to demonstrate the results of each study and the effect of each infill parameter.
A cost analysis was conducted by graphing a reduction in strength (%) and cost savings
(%) compared to solid specimens printed in the xy direction. Finally, ANSYS was used
for FEA modeling of all the solidworks specimens as well as an E-Equivalent study,
which uses the E-Equivalent that was calculated for each infill parameter and is run on a
solid 4-point bending specimen instead of the drawn air gap specimens. Stress Von-
Mises results were also run on ANSYS.
Specifically, the findings from this study are that FEA simulation is accurate
(under 8% error) in comparison to raw data from testing. Both DOE for FEA modeling
resulted in satisfactory values for the E-Equivalent study conducted on solid printed
specimen. It is also important to note:
Tensile Specimens are most cost effective using low density infill
Compression Specimens are most cost effective using low and high density
infill.

78
3-Point Bending Specimens are most cost effective using low density and
solid infill because high density and double dense both result in a negative
cost savings.
In respect to the air gap studies, the tensile specimens using 6 mm air gap was
the most cost effective
The 4-Point bending study cost analysis had an anomaly at 9 mm and 12 mm
where there was a 27% reduction in strength but the cost savings was the same
between Fortus and MakerBot specimens. The 12 mm specimen resulted in a
17% difference in strength and a 6 % rise in cost savings. Fortus has a higher
cost savings than the MakerBot specimens at 12 mm air gap MakerBot
surpasses the cost savings over Fortus.
The FEA simulation was validated since the highest % error occurred at 8.6%
5.1 - Future Work
For future work it would be beneficial to conduct FEA modeling on tensile
specimens and validation of the model as well. In addition to tensile tests, a wider variety
of custom infill parameters should be printed and tested in order to note which infill has a
higher impact on cost and strength. It would also be beneficial to simulate the custom
parameters, since this study validated the use of the load deflection method in ANSYS,
and re-validate the specimens for different designs. It would also be helpful to conduct
more FEA trials with different deflections, stresses, and strain. The need to print and test
more specimens of each study could help reduce the higher values in standard deviation
in the E-Equivalent modulus.

79
References:
Advancing Health Care with 3D Printing- Applications and Guidance on Material Selection. Stratasys (2008). pp.1-35.
Ahn, S. H., Montero, M., Odell, D., Roundy, S., & Wright, P. K. (2002). Anisotropic
material properties of fused deposition modeling ABS. Rapid Prototyping Journal, Vol. 8, pp. 248-257.
Almaghariz, E. S. (2015). Determining When to Use 3D Sand Printing: Quantifying the
Role of Complexity (Doctoral dissertation, Youngstown State University). pp. 1-81.
ASTM D638 (2014) ASTM D638 - 14: Standard Test Method for Tensile Properties of
Plastics, ASTM International, West Conshohocken, PA. Available online at: http://www.astm.org/.
ASTM D695 (2010) ASTM D695 - 10: Standard Test Method for Compressive Properties
of Rigid Plastics, ASTM International, West Conshohocken, PA. Available online at: http://www.astm.org/.
ASTM D790-10 (2010) ASTM D790 - 10: Standard Test Methods for Flexural Properties
of Unreinforced and Reinforced Plastics and Electrical Insulating Materials, ASTM International, West Conshohocken, PA. Available online at: http://www.astm.org/.
ASTM F2792 (2012) ASTM F2792 - 12a: Standard Terminology for Additive
Manufacturing Technologies, ASTM International, West Conshohocken, PA. Available online at: www.astm.org.
Bagsik, A., Schöppner, V., & Klemp, E. (2010). FDM part quality manufactured with
Ultem* 9085. In 14th International Scientific Conference on Polymeric Materials Vol. 15. pp.1-8.
Bagsik, A. and Schöppner, V. (2011) ‘Mechanical properties of fused deposition
modeling parts pp.1-5. Baich, L., Manogharan, GP., and Marie, H. “Study of Infill Print Parameters on
Production Cost-Time of 3D Printed ABS parts”, International Journal of Rapid Manufacturing, (October 2015), DOI: 10.1504/IJRAPIDM.2015.074809
Bak, D. (2003) ‘Rapid prototyping or rapid production? 3D printing processes move
industry towards the latter’, Rapid Prototyping Journal, Vol. 23, pp.340–345.

80
Barkanov, E. (2001). Introduction to the finite element method. Institute of Materials and Structures Faculty of Civil Engineering Riga Technical University. pp.1-70.
Bechtold, Stefan., (2015) Economic Research Working Paper No. 28- 3D printing and
the intellectual property system, World Intellectual Property Organization, WIPO. pp. 1-28.
Belter, J. and Dollar, A. (2015) Strengthening of 3D Printed Fused Deposition
Manufactured Parts Using the Fill Compositing Technique. PLoS ONE. Pp.1-28. Bhandari, S., Regina, B. (2014) 3D Printing and Its Applications.Internation Journal of
Computer Science and Technology Research. Vol. 2, No. 2, pp. 378-380. Boschetto, A. and Bottini, L. (2014) ‘Accuracy prediction in fused deposition modeling’, International Journal of Advanced Manufacturing Technology, Vol. 73, pp.913–928. Buckle Replacement for Ortlieb Bike Panniers: Makerbot Thingiverse, 2015. Web. 14
July 2015. <http://www.thingiverse.com/thing:924975/#files>. Conner, B.P., Manogharan, G.P., Martof, A.N., Rodomsky, L.M., Rodomsky, C.M.,
Jordan, D.C. and Limperos, J.W. (2014) ‘Making sense of 3-D printing: creating a map of additive manufacturing products and services’, Additive Manufacturing, Vols. 1–4, pp.64–76.
Fischer, F. (2015) Thermoplastics: the best choice for 3D printing, Stratasys, pp.1–5.
Available online at: http://www.appliancedesign.com/ext/resources/AM/Home/Files/PDFs/ themoplastics.pdf (accessed on 14 June 2015).
Fortus 3D Production Systems (2016). ABSplus-P430 for Fortus 3D Production Systems,
pp.1-2. Available online at: https://engineering.case.edu/thinkbox/sites/engineering.case.edu.thinkbox/files/stratasys-absplus-p430-materialproperties.pdf
Gibson , I., D. W. Rosen, & B. Stucker. (2010). Additive Manufacturing Technologies -
Rapid Prototyping. New York, NY, 10013: Springer Science+Business Media. pp. 1-510.
Guo, N. and Leu, M.C. (2013) ‘Additive manufacturing: technology, applications and
research needs’, Frontiers of Mechanical Engineering, Vol. 8, pp.215–243. Hopkinson, N., & Dicknes, P. (2003). Analysis of rapid manufacturing—using layer
manufacturing processes for production. Proceedings of the Institution of Mechanical Engineers, Part C: Journal of Mechanical Engineering Science, Vol. 217, pp. 31-39.

81
Hossain, M.S., Ramos, J., Espalin, D., Perez, M. and Wicker, R. (2013) ‘Improving
tensile mechanical properties of FDM-manufactured specimens via modifying build parameters’, Proceedings of the 24th International Solid Freedom Fabrication Symposium on Additive Manufacturing, 12–14 August, Austin, TX, pp.380–392.
Iyibilgin, O., Leu, M.C., Taylor, G., Li, H. and Chandrashekhara, K. (2014)
‘Investigation of sparse-build rapid tooling by fused deposition modeling’, Proceedings of the 25thInternational Solid Freedom Fabrication Symposium on Additive Manufacturing, 4–6 August, Austin, TX, pp.542–556.
Iyibilgin, O., C. Yigit, and M. C. Leu. Experimental investigation of different cellular
lattice structures manufactured by fused deposition modeling. Proceedings of Solid Freeform Fabrication Symposium, Austin, TX, 2013, pp. 895-907
Jauhar, S., Asthankar, K.M. and Kuthe, A.M. (2012) ‘Cost benefit analysis of rapid
manufacturing in automotive industries’, Advances in Mechanical Engineering and Its Applications, Vol. 2, pp.181–188.
Jeyanthi, S. and Rani, J. (2012). Influence of Natural Long Fiber in Mechanical, Thermal,
and Recycling Properties of Thermoplastic Composites in Automotive Components. International Journal of Physical Sciences, Vol. 7, pp. 5765-5771.
Kumar, G.P. and Regalla, S.P. (2014) ‘DOE-based parametric study of volumetric
change of FDM parts’, Procedia Materials Science, Vol. 6, pp.354–360. Laptop Wedge: Makerbot Thingiverse, 2015. Web. 14 July 2015.
<http://www.thingiverse.com/thing:915525>. Lužanin, O., Movrin, D., & Plančak, M. (2014). Effect of layer thickness, deposition
angle, and infill on maximum flexural force in FDM-built specimens. Journal for Technology of Plasticity, Vol. 39 pp. 49-58.
MakerBot (2016). ABS Strength Data, pp.1-3. Available online at: Makerbot.com Matias, E. and Rao, B., (2015). 3D printing: On its historical evolution and the
implications for business. In Management of Engineering and Technology (PICMET), 2015 Portland International Conference on pp. 551-558
Multi- Material 3D Printing, (2016). http://www.stratasys.com/solutions/additive-
manufacturing/multi-material-3d-printing
82
N. Turner, B., Strong, R., & A. Gold, S. (2014). A review of melt extrusion additive manufacturing processes: I. Process design and modeling. Rapid Prototyping Journal, Vol. 20., 192-204.
Pearce, J. M., Blair, C. M., Laciak, K. J., Andrews, R., Nosrat, A., & Zelenika-Zovko, I.
(2010). 3-D printing of open source appropriate technologies for self-directed sustainable development. Journal of Sustainable Development, Vol.3, pp.17-29.
Pei, E., Campbell, R.I. and Beer, D. (2011) ‘Entry-level RP machines: how well can they
cope with geometric complexity?’ Assembly Automation, Vol. 31, pp.153–160. Petrick, I.J. and Simpson, T.W. (2013) ‘3D printing disrupts manufacturing: how
economies of one create new rules of competition’, Research-Technology Management, Vol. 56, pp.12–16.
Phatak, A. M., & Pande, S. S. (2012). Optimum part orientation in Rapid Prototyping
using genetic algorithm. Journal of manufacturing systems, Vol 31., 395-402. Roylance, D. (2000). Beam Displacements. Course Materials, Department of Materials
Science and Engineering, MIT, pp. 1-12. Shims, Mounting Plates, and Standoffs for 0824 Makeblock Beams: Makerbot
Thingiverse, 2015. Web. 14 July 2015. <http://www.thingiverse.com/thing:737972>.
Simons, William A. (2013) IP Issues with Additive Manufacturing. Connecticut:
Connecticut Law Tribute, pp. 1-2. Sitthi-Amorn, P., Ramos, J.E., Wang, Y., Kwan, J., Lan, J., Wang, W., Matusik, W.
(2016). MultiFab: A Machine Vision Assisted Platform for Multi-material 3D Printing, MIT CSAIL. pp.1-11.
Slic3r Manual: Infill Patterns and Density, Slic3r, 2016. Web. 9 May, 2016. <
http://manual.slic3r.org/expert-mode/infill>. Solid Concepts (2015) Fused deposition modelling, pp.1–8. Available online at:
https://www.solidconcepts.com/content/pdfs/brochures/fused-deposition-modeling-fdm-brochure.pdf (accessed on 16 June 2015).
Sood, R. K. Ohdar, and S. S. Mahapatra, (2010). “Parametric appraisal of mechanical
property of fused deposition modelling processed parts,” Materials and Design, vol. 31, no. 1, pp. 287– 295.
Stratasys (2015). ABSplus-P430, pp. 1-2. Available online at:
http://www.stratasys.com/materials/fdm/absplus

83
Type A Machines (2016) Beyond Infill: Defining Internal Structures Using Absolute
Dimensions, pp 1-10. Available online at: https://www.typeamachines.com/hubfs/product_pages/Cura/wp_beyond-infill.pdf
Vidimče, K., Wang, S. P., Ragan-Kelley, J., & Matusik, W. (2013). Openfab: A
programmable pipeline for multi-material fabrication. ACM Transactions on Graphics (TOG), pp.1-11.
Winker, R. (2008). Investment Casting. Stratasys Inc. pp. 1-4. Wohlers, T., & Caffery, T. (2015). Wohlers Report 2015: Additive Manufacturing and
3D Printing State of the Industry: Annual Worldwide Progress Report. pp. 1-315. Zhang, Y., & Chou, Y. K. (2006). A parametric study of part distortions in FDM using
3D FEA. In Proceedings of the 17th Solid Freeform Fabrication Symposium, Austin, TX, USA. pp. 410- 420.