impact of number of bidders on sale price of auctioned ... bidder on condo i… · impact of number...
TRANSCRIPT

1 Impact of Number of Bidders on Sale Price
INTERNATIONAL REAL ESTATE REVIEW
Impact of Number of Bidders on Sale Price of
Auctioned Condominium Apartments in
Stockholm
Rosane Hungria-Gunnelin Department of Real Estate and Construction Management, Royal Institute of Technology, Stockholm, Brinellvägen 1, 100 44, Stockholm, Sweden. Phone: +46 (8) 790 84 93, Fax: +46 (8) 411 74 36, e-mail: [email protected]. url: www.abe.kth.se
This paper empirically tests the effect of the number of bidders on the sale price of condominium apartments in Stockholm by using data gathered during 2010. The results show that the number of participants in a real estate auction plays a significant role in the final auctioned price. The average price per square meter paid by every extra bidder has an increasing but decelerating growth, starting with an approximate 4 percent increase when going from one to two bidders.
Keywords:
Real estate auction; Number of bidders; Price effect

Hungria-Gunnelin 2
1. Introduction
In most residential real estate markets, the sale of houses predominantly
occurs through private negotiations. Auctions are usually associated with the
sale of distressed properties that tend to be less attractive and located in less
favorable areas (Eklöf and Lunander, 2003). However, in Sweden, the number
of private negotiations has dramatically diminished during the past 15 years
with the advent of the internet (Kyhlstedt, 2010), and today, auctioning is the
dominant pricing mechanism for all types of sale, not only for distressed ones.
Internet-based marketing for homes gathered in a single portal1 made for and
used by the largest realtor agencies in the country has been one of the factors
that have triggered demand for auctions, and consequently their use. Today,
the number of residential properties privately sold corresponds to
approximately 10 percent2 of the entire residential market (Kyhlstedt, 2010).
Where demand exists, auctions have proven to be the best selling mechanism
when it comes to maximizing revenues. Milgrom (1987) argues that the
auction is a popular selling mechanism, as it leads to stable and efficient
allocation outcomes. According to him, the competitive auction specifically
enables a seller in a weak bargaining position to do as well as one in a strong
bargaining position. One explanation for this could be that potential buyers
who are simultaneously participating in a sale have less bargaining power and
are impelled to place their maximum bid (demonstrate their willingness to
pay) if they really want the asset. To emphasize this supposition, Bulow and
Klemperer (1996) have carried out a theoretical analysis of auctions versus
private negotiations for company sales. Their results show that a simple
competitive auction with a single extra bidder yields a seller more revenue
than s/he could expect to earn by restricting the number of buyers to N bidders
(as through private negotiations). In a follow-up study, Bulow and Klemperer
(2009) confirm this assertion and add that auctions only require a limited
number of potential bidders to generate higher revenues, when the values of
bidders have higher price dispersion. In a study that applies both theoretical
and empirical comparisons between auctions and negotiated sales of real
estate, Chow et al. (2011) find that the auction mechanism attains a higher
relative price when demand for the asset is strong. In other words, real estate
auction revenues are dependent on market conditions, where higher prices are
obtained in an up market, rather than in one that is flat or down. They also
find that auctions are more effective than negotiated sales when the asset is
more homogeneous and when auctions attract bidders with (high) independent
private valuations.
1 Hemnet.se 2 Private advertisement of home sales is found on internet portals, such as Blocket.se
and Booli.se.

3 Impact of Number of Bidders on Sale Price
In Sweden, the transition of the pricing mechanism from private negotiations
to auctions has changed the pricing strategy that brokers tend to use. An
ongoing debate in the Swedish media concerns the use of underpricing by
brokers (a list price significantly below the expected selling price/market
value) of dwellings, which mainly occurs in the larger cities. The Swedish
Board of Supervision of Estate Agents (FMN) considers the use of
underpricing a serious problem and not lawful, as it is believed to mislead
consumers (FMN, 2011)3. At the same time, it is very difficult to prove that
this pricing strategy has been used, as the true market value of a home is
imperfectly observable (Robins and West, 1977; Goodman and Ittner, 1992;
Geltner, 1993). Brokers defend the use of underpricing with the argument that
it attracts a high number of potential buyers to the exhibition of the dwelling
for sale and since “all other brokers do it”, they cannot be the only one who
does not (Hungria-Gunnelin and Lind, 2008). Hence, the attracting of many
visitors to a showing is presumed to increase the number of bidders, and as an
effect, increase the sales price4.
Besides the extensive use of auctions, there are a number of other features that
are specific to the Swedish housing market and the auction system. First, bids
in auctions are not binding. That is, a buyer can – without cost – back out of
the deal until it has been signed. Similarly, a seller is never obliged to sell
until the deal is signed. Furthermore, the seller is not obliged to sell to the
highest bidder.5 Sellers are also strictly forbidden to place bids on their own
property. Finally, by law, brokers not only represent the interests of the sellers,
but shall instead be a neutral party during the entire sales process, and hence,
equally protect the interests of the buyers.
So far, no attempts have been made to scientifically examine the underlying
rationale for the use of underpricing in terms of testing whether the stated
intent (among brokers) of attracting more potential buyers actually has a
positive effect on achieved selling price. The more common hypothesis in the
literature is, on the contrary, that list price acts as an upper limit for offers
from buyers, see for e.g., Horowitz (1992) and Haurin et al. (2010). This
hypothesis, however, is predominantly common in literature that studies
3 The media debate and attention from consumer organizations have triggered various
attempts to reduce the use of underpricing. The latest attempt is a voluntary agreement
by brokers organized by the Association of Swedish Real Estate Agents
(Mäklarsamfundet) to show average selling prices of dwellings in the neighborhood in
advertisements of apartments for sale. 4 One may argue that it might not be optimal for brokers to increase the number of
participants in auctions since it will take a longer time before a winner appears and
brokers may prefer shorter auctions in order to be able to sell more apartments.
However, in Stockholm, auctions are concluded with unusual speed, irrespective of the
number of bidders. The normal length of an auction is only a day or two. 5 One common reason for not accepting the highest bidder is that the broker, seller or
both are not convinced that the highest bidder will get financing for the purchase of the
apartment.

Hungria-Gunnelin 4
markets in which private sales form the dominant price mechanism. Stevenson
et al. (2010), who have studied the difference between auctioned sales and
private negotiations in Dublin, where English auctions are common, put
forward (but do not test) the hypothesis that the measured underpricing in
auctioned sales is at least partly due to the belief of the brokers that this
pricing strategy entices more people to apartment showings and thereby
increases the number of bidders.
The aim of this study is to empirically test whether the number of bidders in
English auctions has an effect on the sales price of residential real estate. A
hedonic pricing model is estimated, by using data from 512 condominium
apartments in Stockholm, Sweden, that were sold between January and
November 2010. The dataset includes selling price and the number of bidders
in each transaction, as well as other control variables such as spatial
information, condominium fee, apartment size, number of rooms and sale
date.
Auctions in a real estate context have been empirically analyzed in previous
literature and a number of studies confirm that the number of bidders
increases the probability of the success of the auction, i.e. that the property is
sold. However, very little empirical work has directly examined the effect of
the number of bidders on the sales price. This paper contributes to the
literature by empirically quantifying this effect in English auctions of
residential real estate. The results show that the number of bidders who
participate in an auction have both a statistically and an economically
significant effect on the transaction price. Even though the exact effect may be
specific to the Stockholm residential market, it is plausible to assume that
other residential markets would display similar effects. Hence, the results are
also of interest for markets in which private negotiation is the commonly used
pricing mechanism.6 For example, the average increase in sale price of
attracting an extra bidder in Stockholm would more than compensate for the
cost of extra marketing of a home for sale in most markets. Such a cost may
be, for example, home staging, or above-average advertising quality, e.g. by
improving the layout of the advertisement with high-quality photos taken by
professional photographers, together with a good description of the unit,
published in newspapers and on the internet. A broker or a private seller who
is successful in attracting simultaneous interest in a home for sale will be
likely to increase the selling price in any market, independent of the type of
sales mechanism.
6 It is interesting to notice that there is a fast-developing interest in selling non-
distressed commercial as well as residential properties through auctions arranged by
specialized property consultants in several European countries, including England,
Ireland, Germany, Spain and Sweden. For example, one of the biggest players in real
estate auctions in Great Britain, Allsop, arranges six auctions per year, offering
between 100-200 properties per auction (Engström, 2012).

5 Impact of Number of Bidders on Sale Price
2. Earlier Studies
A significant number of theoretical studies on auctions exists. In Vickrey’s
(1961) seminal work, the dynamics of auctions in imperfectly competitive
markets are analyzed. Vickrey derives both a number of auction equilibria and
a revenue equivalence theorem, which demonstrate that a particular pricing
rule entices bidders to reveal their true willingness to pay, maximizing
revenues for the seller. Riley and Samuelson (1981) show that the outcome
from different types of auction rules (e.g. English and Dutch auctions) are
equivalent if the seller announces that s/he will not accept bids under some
properly chosen minimum “reserve price”. Milgrom and Weber (1982) point
out that it is in the interest of the seller to reveal every piece of information
that s/he has on the good, including the identity and the number of participants
in the auction. McAfee and McMillan (1987) disagree with this
“transparency” of information, and assume that bidders are risk-averse and
have independent private values (IPVs). They test for the probability of the
selling price rising after information is released and conclude that the seller is
better off if s/he conceals information with regards to the number of bidders.
Early empirical papers focused on the IPV auction type. In the IPV model, the
good being auctioned has a different value for each participant, each of whom
knows the value of the object with certainty. In other words, bidders observe
their own valuation and the values of other bidders have no significance at all
(see for e.g., Myerson, 1981; Riley and Samuelson, 1981). In more recent
years, studies on common value auctions (CVA) have been carried out by
several researchers. Unlike the IPV, in the CVA model, the value of the
auctioned item is the same for all bidders.
Residential properties carry elements of both the IPV and CVA models. A
bidder may purchase a house with the purpose of increasing, for example,
his/her status (a private value element), at the same time as s/he is making an
investment in the case of resale (a common value element). Therefore, papers
with regards to both private and common value auctions have been considered
as starting references for this study. The usage of open-bid English auctions
applied to the sales of residential properties, in which bidders submit
successively higher bids, is common practice in Sweden (Azasu, 2006). We
can find similar price mechanisms in only a very few markets across the
globe, such as Australia, Scotland and Singapore (Lusht, 1996; Chow et al.,
2011) and in neighboring countries of Sweden, such as Denmark and Norway.
A number of papers have studied commercial real estate auctions, mainly on
land parcels (see Tse et al., 2011, for a recent study). In their paper, Tse et al.
examine the outcome of open-bid English auctions of rights to develop
residential real estate projects in Hong Kong. Auction data, such as the
number of bidders and the number of bids by each bidder, are included in the

Hungria-Gunnelin 6
regression. These are found to have a significant positive effect on the size of
the winning bid compared to three different measures of reference price.
Only a few papers have studied how auction data affect sale price in
residential markets. Ong et al. (2005) analyze the sales probability of
residential real estate in Singapore sold by auction. One of the explanatory
variables is the number of bidders; however, the effect on sale price is not
specifically analyzed. Instead, the dependent variable is binary: successful
auction or not. The number of bidders is found to positively affect the success
of an auction. Amidu and Agboola (2009) examine sale-price determinants as
well as their effect on the size of the auction premium in a first-price sealed
bid auction of 120 residential properties owned by the federal government in
Ikoyi, a neighborhood in Lagos, Nigeria, and observe that the number of
bidders is positively correlated with the auction winning bid and premiums7.
Chow et al. (2011) also analyze the residential real estate market in Singapore,
where they compare sales revenues from auctions to negotiated sales. The
authors conduct both a theoretical and an empirical study of these
relationships. They are able to observe with their theoretical simulations that
when demand in the market is stronger, i.e. when there are a large number of
bidders, the expected selling price is relatively higher under the auction
mechanism than the negotiated sales mechanism, taking into consideration the
different segments of buyer (private) valuations. For the empirical part of the
study, Chow et al. (2011) utilize a database that contains information on
attempted auction sales by sellers and the transaction price and sales
mechanism in cases where sales succeed. The dataset used in the empirical
model contains 3,022 successful sales for the period 1995Q3 to 2006Q4, of
which 777 observations are auction sales. Although the dataset does not
specifically contain the number of bidders for each transaction – and therefore
Chow et al. do not analyze the effect of the number of bidders on price – a
binary dummy variable is included, but only in the probit equation, adding to
it the information that concerns whether there were bidders in the previous
auction attempt, in order to model the choice of sales mechanism for the
property.
The introduction of internet auctions, such as eBay and Amazon8
, has
contributed significant data for auction studies. Some of those papers have,
one way or another, analyzed the effect of number of bidders on final auction
price. Lucking-Reiley et al. (2007) test the impact of specific online auction
data from eBay, such as feedback ratings from sellers, minimum bids, reserve
price, and time on market, on price. Although they did not directly analyze the
7 Auction premium is defined in Amidu and Agboola (2009) as the percentage
difference between the highest bid price and the reserve price of the property, divided
by the reserve price. 8 eBay and Amazon mostly offer independent private value auctions, with the
difference that eBay auctions have a fixed closing time, while Amazon auctions extend
the closing time automatically in response to late bids (Roth and Ockenfels, 2002).

7 Impact of Number of Bidders on Sale Price
effect of the number of bidders on price, they conclude that one of the
explanations that time on market has a positive correlation to price could be
that longer auctions allow for more accumulation of potential bidders. Bapna
et al. (2009), on the other hand, directly observe the impact of the number of
bidders (as a percentage of participants) on online auction price and their
results are consistent with the hypothesis that a higher proportion of
participators in an auction will lead to higher prices in that auction. The focus
of these studies has been mainly on how online auction rules influence the
behavior of bidders and bidding strategy. The implications that can be drawn
from this part of the literature must be further analyzed, however, as they are
based on auctions of items with much lower value than properties.
3. The Empirical Model
The standard approach of measuring the effect of a certain attribute on
property price is to model price by a hedonic equation, where attribute of
interest is one of the explanatory variables.
The hedonic model is generally represented by the following equation:
Price = f (Housing Attributes, Other Factors)
A substantial number of researchers have attempted to explain the value of
real property through empirical studies by using this approach. Contrary to
what many believe, Court (1939) was not the precursor of hedonic models
(with an application to the automobile industry). A study by Colwell and
Dillmore (1999) shows that, almost a century ago, Haas (1922) wrote a
monograph where he applied a hedonic model to estimate the value of
farmland. The authors also pinpoint that, a few years later, Wallace (1926)
analyzed the value of farmland in Iowa by using the same method, but it was
only in 1966 that the estimation of the value of utility-generating
characteristics was included in the model, with a natural application to
housing (Lancaster, 1966). Later, Rosen (1974) utilizes a hedonic model,
giving focus to price determination instead of utility.
Following Rosen’s model, Malpezzi et al. (1980) consider housing to be a
bundle of individual characteristics and assume that consumers derive utility
from them, and that the value of these utilities can be priced. The authors
price individual attributes of houses by using multiple regression analysis on a
pooled sample of many dwellings. Nevertheless, a problem may arise by using
this model, as the derived values tend to be not the same for all price ranges of
houses. For this reason, the hedonic model is usually estimated in a semi-log
form, with the natural log of price used as the dependent variable. In this
form, coefficient estimates represent the percentage change in price for a one-

Hungria-Gunnelin 8
unit change in the given variable. Moreover, a semi-log model helps to
minimize the problem of heteroscedasticity (Follain and Malpezzi, 1980).
A number of recent studies have given focus to the relationship between time
on market and selling price. These two variables have been interchangeably
used as explanatory variables. Usually, when time on market is included in a
selling price estimation model, this variable tends to be statistically significant
and negatively correlated to price. In other words, a longer time taken to sell a
house means a lower selling price (see for e.g., Haag et al., 2000; Johnson et
al., 2001; Knight, 2002). The opposite relationship between price and time on
market is not that straightforward: some studies show that a high selling price
leads to a longer selling time, while others show exactly the opposite (see for
e.g., Jud et al., 1996; Rutherford et al., 2001; Anglin et al., 2003; Björklund et
al. 2006; Wilhelmsson, 2008). It is important to mention that none of the
above-mentioned studies have analyzed time on market from a real estate
auction perspective. The present study does not, however, treat this
relationship, as the variable time on market is not available in the dataset.
Nonetheless, it would have been interesting to observe the relationship
between time on market, number of bidders and selling price in an auction
context.
By following the commonly used semi-log approach of assuming a semi-
logarithmic functional form, the natural log of the price of a condominium
apartment per square meter is modeled as follows:
2 2
1 2 3 4 5
2 2
6 7 8 9
2
10 11 12 13 14
15
ln _ _ _
_ _
_ _ _ _
_ _
p sqm fee sqm fee sqm size size room
room room size room size bidder
bidder d vasa d soder d kung dist hoet
d dist sture month
where:
fee_sqm = monthly condominium fee per square meter;
size = living area in square meters;
room = number of rooms9;
9 Note that, in Sweden, the number of rooms in an apartment includes the number of
bedrooms and living rooms. So, for example, a 1-room apartment is a studio, with
common space for the bedroom and living room, a small kitchen and a bathroom; a 2-
room apartment contains one separate bedroom and one living room, with a kitchen
and bathroom; a 3-room apartment has two bedrooms and one living room, and
depending on its size, may have a bathroom and separate lavatory, and so on. The
configuration of the apartments may vary in terms of number of bathrooms, depending
on the living area, but this figure is not available as a search criterion in Sweden. In
other words, the kitchen and the bathrooms are never included in the figure for number
of rooms. In the U.S., for example, the number of rooms is specifically divided into the
number of bedrooms and bathrooms.
(1)

9 Impact of Number of Bidders on Sale Price
room_size = average size of the rooms of the object, i.e. the living
area divided by the number of rooms;
bidder = number of bidders;
d_vasa = dummy variable for objects located in the Vasastaden
neighborhood;
d_soder = dummy variable for objects located in the Södermalm
neighborhood;
d_kung = dummy variable for objects located in the Kungsholmen
neighborhood;
dist_hoet = the distance, in meters (in a direct line), from all
objects in the sample to the city center, Hötorget;
d_dist_sture = the distance, in meters (in a direct line), from the
objects specifically located in the Östermalm district to
the sub-city center, Stureplan; and
monthλ = vector of parameters; 1 10,..., λ which represents
the coefficients on the time dummy variables (month) for
the months from February to November 2010.
A description of all the untransformed variables can be found in Table 1. The
quadratic term was calculated for each of the discrete variables, with the
exception of the average size of rooms10
.
In order for standard ordinary least squares (OLS) to yield unbiased
coefficient estimates, all attributes that affect price must be captured by the
explanatory variables. Alternatively, omitted explanatory variables must be
uncorrelated with both the included variables and the error term. These are
rather strong assumptions when estimating hedonic property price regressions
and it is not plausible to believe that they are completely fulfilled. The remedy
for an omitted variable problem is of course to add the omitted variable to the
model. However, due to data availability problems and lack of knowledge of
all relevant variables, a true model is seldom achieved. Potential omitted
variables in this research would be, for e.g., quality of the apartments.
Another potentially serious estimation problem is the so-called spatial
autocorrelation, that is, residuals (or prices) are spatially correlated due to
unobserved geographically related characteristics; see for e.g., Wilhelmsson
(2002) for a review of spatial models applied to real estate economics. He
stresses the importance of including a spatial structure when estimating
housing values through hedonic modeling. The author emphasizes that spatial
effects in the form of spatial dependency and spatial heterogeneity cause
coefficient parameters to become inefficient and inconsistent. The occurrence
of spatial correlation in the residuals is tested by the calculation of Moran’s I,
10 Most of the quadratic explanatory variables are not significant on conventional
levels. However, pairwise F-tests of the combined effect of the linear and the quadratic
terms, e.g. size + size2, show prob-values below 1% in all cases.

Hungria-Gunnelin 10
where the spatial weight matrix is defined as the inverse square distance
between apartments, given a specified distance band.
4. Data and Descriptive Analysis
Data in terms of transactions were gathered from the website e-bud11
, where
data on both ongoing and finished auctions of residential apartments and
houses in Sweden are available. The website works as a tool for brokers to
make sales more transparent. To be able to place bids on auctions at e-bud,
potential buyers must first register their interest with a responsible broker.
Such registration usually occurs during the showing of an apartment unit,
when all potential buyers have the opportunity to make a simultaneous
inspection of a unit. There are usually two showings of an apartment, with a
few days in between. The auction usually starts the day after the second
showing. A potential buyer does not have to be registered on e-bud to place a
bid. S/he can instead call the broker who registers his/her bid online. Hence,
e-bud does not work as other online auction sites such as eBay and Amazon
since one does not have to be directly registered with the auction site.
The empirical analysis is based on 512 closed transactions of condominium
apartment units in inner-city Stockholm during the period January–November
2010. The dataset includes price, property attributes, condominium fee,
geographical location, brokerage firm, and the actual number of bidders that
participated in the auction. Descriptive statistics are found in Table 1.
In order to control for geographical variation in condominium prices, dummy
variables have been created. These variables are based on the geographical
zones used by the Association of Swedish Real Estate Agents
(Mäklarsamfundet) in their publicly published price statistics12
: Södermalm,
Vasastaden, Kungsholmen and Östermalm (see Figure 1). A rationale for this
subdivision is that different types of households traditionally favor different
locations within the city center. For example, Östermalm, the most expensive
area, attracts above-average income, wealthy, “conservative” households,
while the Södermalm area attracts younger households with, on average,
lower incomes and less wealth.
As can be seen in Table 1, Östermalm (Location 1) is under-represented in the
sample, with only 10 percent of the total number of observations. Moreover,
approximately 70 percent of the sales in the sample are for small apartments
(1- and 2-rooms).
11 www.ebud.nu 12 The price statistics are based on monthly averages of price per square meter and can
be found on http://www.maklarstatistik.se/.

11 Impact of Number of Bidders on Sale Price
Changes in general price level during the time period under study are captured
through monthly time dummy variables.
Table 1 Descriptive Statistics
Abbreviation Unit Average Std. Dev.
Sale price s_price Swedish crown, SEK 3,141,543 1,463,051
Living area size Square meters 58.20 27.91
Rooms room Number of rooms 2.04 0.97
Bidder bidder Number of bidders 4.27 2.08
Location 1 d_oster Binary, 1
if located in Östermalm 0.10 0.29
Location 2 d_vasa Binary, 1
if located in Vasastaden 0.19 0.39
Location 3 d_soder Binary, 1
if located in Södermalm 0.37 0.48
Location 4 d_kung Binary, 1
if located in Kungsholmen 0.34 0.47
Note: The number of observations total 512.
Figure 1 Map of Inner-city Stockholm
Source: Google Maps, 2012.

Hungria-Gunnelin 12
5. Results
The regression results are presented in Table 2. Panel A shows the results for
the case in which the number of bidders is not included as an explanatory
variable, while Panel B shows the results when this explanatory variable is
included.13
The model in Panel A explains prices fairly well and the adjusted
R-squared is 0.54. All explanatory variables except for the squared variables
of condominium fee, living area and room size are significant at the 10 percent
level or less (time dummy variables are not reported). Inclusion of the squared
variables, however, increases the explanatory power of the model. As
expected, the coefficient for condominium fee is negative. An increase of the
monthly fee per square meter by 1 SEK (the average fee in the dataset is 47
SEK) decreases the price by approximately 100 SEK per square meter, which
is about 0.2 percent of the price per square meter of the average apartment14
.
The geographical dummy variables all show significant negative coefficients,
which confirm that the Östermalm area (the omitted dummy variable) is the
most expensive area in inner-city Stockholm. Furthermore, the distance to the
city center is also negatively significant, as is the local sub-center dummy
variable for Östermalm. Local sub-center dummy variables for the other areas
were tested, but not found to be significant, and therefore discarded.
The results in Panel A also indicate that small apartments, on average, are
priced higher per square meter than midsize and large apartments. The effect
is shown in Figure 2, which also illustrates an interesting relationship between
price per square meter, living area and number of rooms: as the living area
increases (holding the number of rooms constant), the willingness of
households to pay decreases. Furthermore, one can see the effect of the size of
the rooms becoming suboptimal. For example, 2-room apartments are more
highly priced per square meter than 1-room apartments when total living area
exceeds approximately 30 square meters.
13 The standard errors in Table 2 are heteroscedasticity-consistent. The regressions
were also run without applying White’s heteroscedasticity-consistent standard errors.
The results reveal that the robust standard errors are all similar to those in the non-
robust regressions. 14 A back-of-the-envelope calculation, which assumes that the long-term borrowing
cost (as of 2010) of a 4.5% interest rate (after tax) plus a risk adjustment of 2%, i.e.
6.5%, approximates to the true cost of capital yields that the condominium fee is
capitalized at approximately 35% of the price.
Assuming a perpetual constant fee in real terms and a long-term inflation rate of 2%, a
1 SEK increase in monthly fee (12 SEK per year) would reduce the price by 12/(6.5%-
2%) = 267 SEK per square meter if the fee was fully capitalized. According to the
regression model, the reduction in price of 100 SEK per square meter for an increase
of 1 SEK per square meter implies a capitalization of 100/267 = 37.5% of the change
in the fee in the price. This number is quite similar to the ones estimated by Jonsson
and Lundström (2004) and Gebro and Olsson (2011).

13 Impact of Number of Bidders on Sale Price
Table 2 Regression Results with Heteroscedasticity-consistent Standard Errors
Panel A
Panel B
Coefficient t-value Coefficient t-value
Property Attributes
Condominium fee per square meters
-0.00271 (-2.14)
-0.00222 (-1.95)
Condominium fee per square meters (squared)
9.87e-06 (0.84)
0.00001 (1.02)
Living area
0.00841 (1.71)
0.00735 (1.67)
Living area (squared)
0.00002 (-1.23)
0.00002 (-0.94)
Rooms
-0.37323 (-2.59)
-0.32470 (-2.52)
Rooms (squared)
0.03251 (2.16)
0.02453 (1.82)
Room size
-0.02197 (-1.61)
-0.01949 (-1.55)
Room size (squared)
0.00010 (0.65)
0.00008 (0.56)
Spatial Characteristics
Location 1 (Östermalm)
(omitted)
Location 2 (Vasastaden)
-0.18241 (-6.10)
-0.16895 (-5.66)
Location 3 (Södermalm)
-0.24332 (-7.47)
-0.22524 (-7.11)
Location 4 (Kungsholmen)
-0.21562 (-7.05)
-0.19949 (-6.65)
Distance to city center
-0.00005 (-7.89)
-0.00005 (-8.66)
Distance to sub-city center
-0.00012 (-4.48)
-0.00010 (-4.17)
Auction Information
Number of bidders
- -
0.03934 (5.39)
Number of bidders (squared)
- -
-0.00186 (-2.89)
Constant
12.09577 (44.67)
11.83133 (47.08)
Adjusted R-squared *
0.5415
0.6214
Note: * Obtained from the regression run without heteroscedasticity-consistent standard errors.
13
Imp
act of N
um
ber o
f Bid
ders o
n S
ale Price

Hungria-Gunnelin 14
Figure 2 Estimated Sale Price of an Apartment in the Östermalm
District as a Function of Number of Rooms and Size.15
Panel B shows the result when number of bidders are included as an
explanatory variable. Inclusion of such auction data significantly increases the
explanatory power of the model, with the adjusted R-squared increased to
0.62, which can be considered as a rather good fit for a model that explains
price per square meter. The coefficient estimates for variables other than
bidder are similar to those in the model that omits bidders.
Both the linear and the squared bidder terms are significant at the 1 percent
level with the expected signs. That is, the linear term is positive and the
quadratic term is negative, which indicate the declining marginal effect of
increasing the number of bidders. The effect of the number of bidders is also
strongly economically significant. Starting at one bidder, the increase in price
when adding one more bidder is 3.9 percent and the corresponding increase
when going from five to six bidders is 1.9 percent (the average number of
bidders in the data is 4.3, the minimum is 1 and the maximum is 12). As a
further illustration, increasing the number of bidders for an average apartment
from one to six, the expected selling price increases by 14 percent. This effect
is in line with the results obtained in Tse et al. (2011), who find that one extra
15 The same sale price estimation was done for the coefficients obtained in Panel B, but
this time, the number of bidders and its quadratic term were added as explanatory
variables. No significant changes were observed. The only differences are that the
estimated price per square meter slightly increases for smaller apartments and slightly
decreases for large apartments, in comparison to Panel A.
50,000
55,000
60,000
65,000
70,000
75,000
Pri
ce p
er s
qu
are
met
er (
in S
EK
)
Living area (in square meters)
1-room 2-room 3-room 4-room 5-room

15 Impact of REIT Ratings on Stock Price and Shareholder Wealth
bidder, on average, increases the ratio of the winning bid to the ex ante market
value by approximatelly 3 percent, measured by a linear bidder term only.
To test if the effect on price by the number of bidders varies with geographical
location, the regression in Panel B was also separately run for the four
neighborhoods. The results reported show that the effect is stable, i.e. price
significantly increases (at the 1 percent level or less) with the number of
bidders, and the coefficients are similar to those in the full model. For two of
the neighborhoods, however, the model shows a better fit when only including
the linear bidder term. 16
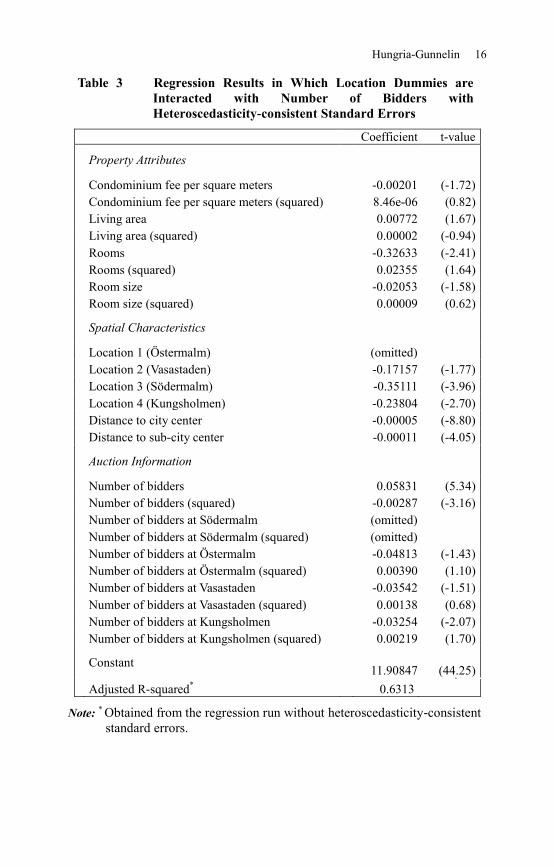
To control for differences on the effect of number of bidders on price per
square meter for each neighborhood, a regression was run (see Table 3), where
location dummies interact (are multiplied) with the number of bidders. The
results reveal an increase in goodness of fit of the model by 0.99 percent
compared to the adjusted R-squared in Panel B of Table 2, and show that the
effect of the number of bidders is more linear in Östermalm, Vasastaden and
Kungsholmen than in Södermalm, since they all have a negative coefficient
for the linear interaction term and a positive coefficient for the squared term
(although only the terms for Kungsholmen are significant at the 10 percent
level or lower).
In order to test for spatial autocorrelation, a row-standardized inverse distance
weight matrix was created by using a distance band of 800 meters. Moran’s I
was estimated and a statistic of 2.674 implies that the null hypothesis of no
spatial autocorrelation is rejected. Spatial regressions were run both as a
spatial error model (SEM) and a spatial autoregressive (SAR) lag model, since
spatial dependence can stem from both neighborhood spillover effects, i.e. the
price of a particular apartment can be affected by the attributes of neighboring
apartments, and omitted neighborhood attributes that make the error terms
spatially correlated.
The spatial regression results for the log-linear model are found in Table 4. As
evident, the coefficient estimates of the SEM and the SAR models are rather
similar, and they are, furthermore, similar to those of the non-spatial
regressions. Hence, the results of the model do not seem to be sensitive to the
occurrence of spatial dependency and choice of spatial model.
16 Similar regression models to the ones presented in Table 2, Panels A and B were run,
this time including dummy variables for the different brokerage firms in the dataset
(unreported), grouped by size of firm (small, medium and large). No statistically
significant difference between the groups was found, which implies that there are no
differences among the groups in terms of their performance in obtaining a higher sale
price per square meter.
Hungria-Gunnelin 16
Table 3 Regression Results in Which Location Dummies are
Interacted with Number of Bidders with
Heteroscedasticity-consistent Standard Errors
Coefficient t-value
Property Attributes
Condominium fee per square meters
-0.00201 (-1.72)
Condominium fee per square meters (squared)
8.46e-06 (0.82)
Living area
0.00772 (1.67)
Living area (squared)
0.00002 (-0.94)
Rooms
-0.32633 (-2.41)
Rooms (squared)
0.02355 (1.64)
Room size
-0.02053 (-1.58)
Room size (squared)
0.00009 (0.62)
Spatial Characteristics
Location 1 (Östermalm)
(omitted)
Location 2 (Vasastaden)
-0.17157 (-1.77)
Location 3 (Södermalm)
-0.35111 (-3.96)
Location 4 (Kungsholmen)
-0.23804 (-2.70)
Distance to city center
-0.00005 (-8.80)
Distance to sub-city center
-0.00011 (-4.05)
Auction Information
Number of bidders
0.05831 (5.34)
Number of bidders (squared)
-0.00287 (-3.16)
Number of bidders at Södermalm
(omitted)
Number of bidders at Södermalm (squared)
(omitted)
Number of bidders at Östermalm
-0.04813 (-1.43)
Number of bidders at Östermalm (squared)
0.00390 (1.10)
Number of bidders at Vasastaden
-0.03542 (-1.51)
Number of bidders at Vasastaden (squared)
0.00138 (0.68)
Number of bidders at Kungsholmen
-0.03254 (-2.07)
Number of bidders at Kungsholmen (squared)
0.00219 (1.70)
Constant
11.90847 (44.25)
Adjusted R-squared
*
0.6313
Note: * Obtained from the regression run without heteroscedasticity-consistent
standard errors.

17 Impact of REIT Ratings on Stock Price and Shareholder Wealth
Table 4 Spatial Regression, in Price per Square Meter as a Dependent
Variable (Spatial Error – SEM and Spatial Autoregressive
Lag Models – SAR)
SEM SAR
Coefficient z-value Coefficient z-value
Property Attributes
Condominium fee per
square meters -0.00201 (-1.52) -0.00195 (-1.49)
Condominium fee per
square meters (squared) 8.42e-06 (0.66) 8.86e-06 (0.70)
Living area 0.00671 (1.97) 0.00723 (2.14)
Living area (squared) -0.00001 (-1.10) -0.00002 (-1.26)
Rooms -0.30199 (-2.92) -0.31434 (-3.05)
Rooms (squared) 0.02230 (2.03) 0.02363 (2.16)
Room size -0.01804 (-1.93) -0.01841 (-1.98)
Room size (squared) 0.00007 (0.66) 0.00007 (0.65)
Spatial Characteristics
Location 1 (Östermalm) (omitted)
Location 2 (Vasastaden) -0.16711 (-5.05) -0.13763 (-4.43)
Location 3 (Södermalm) -0.22684 (-6.30) -0.18226 (-5.14)
Location 4 (Kungsholmen) -0.20063 (-5.98) -0.16366 (-5.06)
Distance to Hötorget -0.00005 (-7.29) -0.00004 (-4.97)
Distance to Stureplan -0.00010 (-4.08) -0.00009 (-3.78)
Auction Information
Number of bidders 0.03807 (5.27) 0.03921 (5.47)
Number of bidders (squared) 0.00176 (-2.62) -0.00185 (-2.77)
Constant 11.78912 (59.03) 9.53705 (9.55)
Moran's I 2.674
2.674
Lambda / rho 1.56
2.34
Although the results of the performed regressions indicate the robustness of
the explanatory variable number of bidders, it should be noted that the dataset
does not include variables that can be used to control for the quality of
buildings and apartments, such as the age of the building, level of
maintenance of buildings and refurbishment of apartments17
. As discussed in
17 One may argue that the size of the condominium fee is related to the quality of the
building/apartment. However, it would be difficult to disentangle the relationship that
one should expect. On the one hand, a low fee may indicate a wealthy condominium
that can afford an above- average level of maintenance, which results in above-average
quality of the building. On the other hand, a low fee might just be the effect of the

Hungria-Gunnelin 18
the model section, omitted variables may lead to biased coefficient estimates
if they are correlated with included variables. The focus of this study is the
effect of the number of bidders on sale price and hence any correlation
between the quality of the units for sale and number of bidders may bias the
conclusions that are drawn in this respect. It may be, for example, the case
that high-quality apartments on average attract more bidders. However, the
economic theory does not provide any guidance as to the sign or degree of
correlation that can be expected. It may equally well be the case that (less
expensive) low-quality apartments attract more bidders. Any correlation
between the number of bidders and quality is a feature of the particular
property market and the time period under study.
6. Conclusion
Condominium apartments in Sweden are normally sold by auction; therefore,
the unfolding of an auction can be expected to affect the selling price of
properties. According to a common view among Swedish brokers, a key
variable for the outcome of an auction is the number of bidders that
participate.
By using 512 transaction prices for condominium sales in inner-city
Stockholm, the effect of the number of bidders on final auctioned price has
been studied. The estimated hedonic equations show a significant positive
relationship between number of bidders and sale price. The result supports the
view among brokers that it is important to attract as many potential bidders as
possible to the showing of an apartment in order to increase the number of
bidders, which, in turn, increases the selling price. As a means of achieving a
high number of visitors to a showing, brokers use underpricing when setting
list prices, since this strategy supposedly increases the number of visitors.
The results of the study, however, cannot validate the arguments for using
underpricing – that underpricing attracts more potential buyers to a showing,
and this in turn, actually leads to more bidders. The study only provides
evidence that an increased number of bidders positively affect the sale price.
In order to more explicitly study underpricing, both an unbiased market value
estimate that can serve as a benchmark when determining the level of
under/overpricing and also a tally of the number of potential bidders at each
showing are required for each transaction.18
condominium neglecting maintenance in order to keep the fee low. The size of the fee
is furthermore related to the age of the condominium and hence how much of the
original debt is amortized. That is, the size of the fee is related to the amount of debt
carried by the condominium. 18 Ong et al. (2005) use turnout, i.e. the number of people who visit an auction, as
proxy for number of bidders and hence hypothesizes that the number of visitors is
positively correlated to the number of actual bidders.

19 Impact of REIT Ratings on Stock Price and Shareholder Wealth
Another interesting extension of this study would be to use more elaborate
auction data, such as those used by Svensson et al. (2010), who have analyzed
the sales of gift cards and concert tickets auctioned on eBay and Tradera,
controlling for auction length and its effect on price. For the analysis, they
even consider the number of bids by individual bidders and bid amount
intervals, among other auction variables. Such an empirical study that
considers bidder behavior and strategy in a residential property context would
be beneficial for the understanding of the price setting mechanism in the
private housing market.
References
Amidu, A.R. and A.O. Agboola (2009). Empirical Evidence Of The
Influences On First-Price Bid Auction Premiums, International Real Estate
Review, 12, 2, 157-169.
Anglin, P.M., R.Rutherford, and T.M. Springer (2003). The Trade-Off
Between the Selling Price of Residential Properties and Time-on-the-Market:
The Impact of Price Setting, Journal of Real Estate Finance and Economics,
26, 1, 95-111.
Azasu, S. (2006). Auctions in the Real Estate Market - A Review, Royal
Institute of Technology, Division of Building and Real Estate Economics,
Working Paper (#55), 1-14.
Bapna, R., S.A. Chang, P. Goes and A. Gupta (2009). Overlapping Online
Auctions: Empirical Characterization of Bidder Strategies and Auction Prices,
MIS Quarterly, 33, 4, 763-783.
Björklund, K., J.A. Dadzie, M. Wilhelmsson (2006). Offer Price, Transaction
Price and Time-on-market, Property Management, 24, 4, 415-426.
Bulow, J. and P. Klemperer (1996). Auctions Versus Negotiations, The
American Economic Review, 86, 1, 180-194.
Bulow, J. and P. Klemperer (2009). Why Do Sellers (Usually) Prefer
Auctions?, American Economic Review, 99, 4, 1544-1575.
Chow, Y.L., I. Hafalir and A. Yavas (2011). Auction Versus Negotiated Sales:
Evidence From Real Estate Sales, Working Paper, 1-49.
Colwell, P.F. and G. Dillmore (1999). Who Was First? An Examination of an
Early Hedonic Study, Land Economics, 75, 4, 620-626.

Hungria-Gunnelin 20
Court, A.T. (1939). Hedonic Price Indexes with Automotive Examples, The
Dynamics of Automobile Demand, New York: The General Motors
Corporation.
Eklöf, M. and A. Lunander (2003). Open Outcry Auctions with Secret
Reserve Prices: An Empirical Application to Executive Auctions of Tenant
Owner's Apartments in Sweden, Journal of Econometrics, 114, 243-260.
Engström, F. (2012). Dags för en tredje auktion - nu med stabila säljare,
Fastighetsvärlden, 4, 6.
Follain, J.R. and S. Malpezzi (1980). Dissecting Housing Value and Rent,
Washington, D.C.: The Urban Institute.
FMN (2011). Pressmeddelande – Lockpriser. [pdf] 14 February. Available at:
<http://www.fastighetsmaklarnamnden.se/Sve/Filer/fmn_pressmeddelande_lo
ckpriser_110214.pdf> [Accessed on May 30, 2011].
Gebro, P. and J. Olsson (2011). Bolånetaket och bostadsrättsköpares
rationalitet: Regressionsstudie utav kapitaliseringen av årsavgiften i Uppsala.
B. Sc. Uppsala University.
Geltner, D. (1993). Estimating Market Values from Appraised Values without
Assuming an Efficient Market, The Journal of Real Estate Research, 8, 3,
325-345.
Goodman, J.L. and J.B. Ittner (1992). The Accuracy of Home Owners’
Estimates of House Value, Journal of Housing Economics, 2, 339-357.
Haag, J.T., R.C. Rutherford, and T.A. Thomson (2000). Real Estate Agent
Remarks: Help or Hype?, Journal of Real Estate Research, 20, 1/2, 205-215.
Haas, G.C. (1922). A Statistical Analysis of Farm Sales in Blue Earth County,
Minnesota, as a Basis for Farm Land Appraisal. Minnesota: University of
Minnesota.
Haurin, D.R., J.L. Haurin, T. Nadauld, and A. Sanders (2010). List Prices,
Sale Prices and Marketing Time: An Application to U.S. Housing Markets,
Real Estate Economics, 38, 659-685.
Horowitz, J.L. (1992). The Role of the List Price in Housing Markets: Theory
and An Economteric Model, Journal of Applied Econometrics, 7, 115-129.
Hungria-Gunnelin, R. and H. Lind (2008). Utgångspris och slutpris: En studie
av "lockpriser" vid försäljning av bostadsrätter. Stockholm: Royal Institute of
Technology.

21 Impact of REIT Ratings on Stock Price and Shareholder Wealth
Johnson, K.H., S.P. Salter, L.V. Zumpano and R.I. Anderson (2001). Exterior
Insulation and Finish Systems: The Effect on Residential Housing Prices and
Marketing Time, Journal of Real Estate Research, 22, 3, 289-312.
Jonsson, P. and P. Lundström (2004). Årsavgiftens kapitalisering i
bostadsrättspriser. M.Sc. Royal Institute of Technology.
Jud, G.D., T.G. Seaks, and D.T. Winkler (1996). Time-on-the-market: The
Impact of Residential Brokerage, Journal of Real Estate Research, 12, 3, 447-
458.
Knight, J.R. (2002). List Price, Time on Market, and Ultimate Selling Price:
Causes and Effects of Listing Price Changes, Real Estate Economics, 30, 2,
213-237.
Kyhlstedt, A. (2010). Privata bostadsförsäljningar ger 10% större
bostadsmarknad. Webfinanser, [online] 12 October. Available at:
<http://www.webfinanser.com/nyheter/1925127/privata-bostadsforsaljningar-
ger-10-storre-bostadsmarknad> [Accessed on April 28, 2011].
Lancaster, K.J. (1966). A New Approach to Consumer Theory, Journal of
Political Economy, 74, 132-157.
Lucking-Reiley, D., D. Bryan, N. Prasad, and D. Reeves (2007). Pennies
from eBay: The Determinants of Price in Online Auctions, The Journal of
Industrial Economics, LV, 2, 223-233.
Lusht, K.M. (1996). A Comparison of Prices Brought by English Auctions
and Private Negotiations, Real Estate Economics, 24, 4, 517-530.
Malpezzi, S., L. Ozanne, and T. Thibodeau (1980). Characteristic Prices of
Housing in Fifty-Nine Metropolitan Areas. Washington, D.C.: The Urban
Institute.
McAfee, P.R. and J. McMillan (1987). Auctions with a Stochastic Number of
Bidders, Journal of Economic Theory, 43, 1, 1-19.
Milgrom, P.R. (1987). Auction Theory. In B. Truman (Ed.), Advances in
Economic Theory (pp. 1-32). London: Cambridge University Press.
Milgrom, P.R. and R.J. Weber (1982). A Theory of Auctions and Competitive
Bidding, Econometrica, 50, 1089-1122.
Myerson, E. (1981). Optimal Auction Design, Mathematics of Operations
Research, 6, 58-73.

Hungria-Gunnelin 22
Ong, S.E., K. Lusht, and C.Y. Mak (2005). Factors Influencing Auction
Outcomes: Bidder Turnout, Auction Houses and Market Conditions, Journal
of Real Estate Research, 27, 2, 177-191.
Riley, J.G. and W.F. Samuelson (1981). Optimal Auctions, American
Economic Review, 71, 381-392.
Robins, P.K. and R.W. West (1977). Errors in the Estimation of Home
Values, Journal of the American Statistical Association, 72, 358, 290-294.
Rosen, S. (1974). Hedonic Prices and Implicit Markets: Product
Differentiation in Pure Competition, Journal of Political Economy, 82, 1, 34-
55.
Roth, A.E. and A. Ockenfels (2002). Last-Minute Bidding and the Rules for
Ending Second-Price Auctions: Evidence from eBay and Amazon Auctions on
the Internet, American Economic Review, 92, 4, 1093-1103.
Rutherford, R.C., T.M. Springer, and A. Yavas (2001). The Impacts of
Contract Type on Broker Performance. Real Estate Economics, 29, 3, 389-
410.
Stevenson, S., J. Young, and C. Gurdgiev (2010). A Comparison of the
Appraisal Process for Auction and Private Treaty Residential Sales, Journal of
Housing Economics, 19, 145-154.
Svensson, M., S. Hellmer, and I. Robson (2010). Är det ditt slutgiltiga bud?
Temporala effekter på pris i internetauktioner, Ekonomisk Debatt, 38, 7, 5-15.
Tse, M.K., F.I. Pretorius, and K.W. Chau (2011). Market Sentiments, Winner's
Curse and Bidding Outcome in Land Auctions, Journal of Real Estate
Finance and Economics, 42, 247-274.
Vickrey, W. (1961). Counterspeculation, Auctions and Competitive Sealed
Tenders, The Journal of Finance, 16, 1, 8-37.
Wallace, H.A. (1926). Comparative Farmland Values in Iowa, Journal of Land
and Public Utility Economics, 2, 385-392.
Wilhelmsson, M. (2002). Spatial Models in Real Estate Economics, Housing,
Theory and Society, 19, 92-101.
Wilhelmsson, M. (2008). Evidence of Buyer Bargaining Power in the
Stockholm Residential Real Estate Market, Journal of Real Estate Research,
30, 4, 475-499.