impact of oil price in offshore wind
TRANSCRIPT
1 ore.catapult.org.uk [email protected] @ORECatapult
|
Angeliki Spyroudi September 2020
Impact of oil price in offshore wind
EXECUTIVE SUMMARY
Offshore wind is at the centre of the UK decarbonisation strategy with lower cost than many other
forms of electricity generation, including new nuclear, and aspires to limit the traditional role oil and
gas plays in energy system balance. Oil is a commodity characterised by high volatility in price and
has a significant direct and indirect impact on global economic growth. There are a number of visible
and less visible relationships and areas of competition between the two industries, but it appears that
the influence of oil price on offshore wind costs is, and will continue to be, in decline.
• Competition for vessels – High oil prices lead to increased offshore activity, meaning high
demand for vessels which has traditionally increased costs of offshore wind installation. This
remains true to some extent, but the growing scale of offshore wind turbines and foundations
means installation cost is increasingly driven by the pace of construction of bespoke vessels.
• Fuel and commodity prices – Oil price is a key driver of transport fuel price and of steel and
copper; fuel and commodities comprise a relatively low share of offshore wind cost but low oil
prices can contribute to the reduction of overall cost.
• Competitiveness in the energy mix – only a small percentage of electricity supplied (<0.5%) in
the UK currently comes from oil and other by-products, meaning that fluctuations in the oil price
have negligible direct impact on overall costs of electricity generation and so have little impact
on the relative attractiveness of renewable energy as low-cost forms of generation.
• Competition for investment – oil majors’ propensity to invest in offshore wind is driven as much
by shareholder drive and national decarbonisation targets as by oil price. Higher oil price can
encourage more investment in oil projects at the expense of offshore wind; oil price too low
however can mean no investments are sanctioned in either industry by oil majors. Continued
entry of oil majors into offshore wind could be key to unlocking the levels of investment required.

2 ore.catapult.org.uk [email protected] @ORECatapult // @CatapultBlyth
|
INTRODUCTION
Background The purpose of this report is to investigate the impact that oil price may have on the cost of offshore
wind in the UK. These impacts are driven by the global and national macroeconomic effects of oil
price as well as competition between the two sectors for the same sets of vessels, facilities,
investment sources and workforce skills. After an overview of oil price trajectory, the following areas
are discussed:
• offshore wind vessel supply cost in installation and O&M;
• commodity prices affecting offshore wind (e.g. steel and copper);
• fuel prices affecting offshore wind;
• development, project management and operations and maintenance services crossing over
between oil and gas and offshore wind; and
• investment in electricity generation from renewables compared to conventional fuel.
Why oil? Oil is the commodity which attracts the most attention as the volatility of its price creates instabilities
in the economy in exporting and importing countries. Although crude oil is the dominant energy
source in the world, renewable energy technology has shown dramatic growth in recent years and is
a significant part of the energy mix in many countries. The climate change and environmental
concerns arising from the high greenhouse gas (GHG) emissions associated with crude oil as well as
the depletion of natural resources which risk the security of energy supply are some of the reasons
that have led to the expansion of renewable energy. The UK government has a commitment to
combat climate change and promote the transition to a greener economy. Last year the UK became
the first major economy to pass net zero emissions law. The target will require the UK to bring all
greenhouse gas emissions to net zero by 2050, compared with the previous target of at least 80%
reduction from 1990 levels.i
Why offshore wind? Renewable energy is reaching its milestone year with a pledge to hit 15% share of UK energy
consumption by 2020 – 30% of electricity, 12% of heat and 10% of transport. In 2019 the electricity
generated from renewable energy exceeded 37% so this sub-target has been exceeded.ii However,
the transport and heating sectors are transforming much more slowly, with little progress made
towards these targets. Offshore wind is a major contributor in the power mix and the cost of
technology has shown a rapid reduction, increasing its competitiveness and reducing its reliance on
government subsidies. To reach the 2050 net zero target, more than 75GW of offshore wind will be
needed, accounting for ~50% of UK electricity generation by 2050.iii
3 ore.catapult.org.uk [email protected] @ORECatapult // @CatapultBlyth
|
UK oil & gas Oil and gas is an industry with a long history in the UK. In 2015 the sector celebrated 50 years of
exploration for oil and gas on the UK continental shelf and over 40 years of production. In 2018 oil
and gas provided 75 % of the UK’s primary energy, a trend that its estimated to continue at least until
2035 according to the UK’s Department for Business, Energy and Industrial Strategy (BEIS).iv About
65% of UK primary energy demand was met from indigenous production, making an estimated
contribution of £20 billion to the UK’s balance of trade.v Most of the UK's large offshore oil fields are
in the Northern and Central North Sea Basin where offshore wind is also developed.
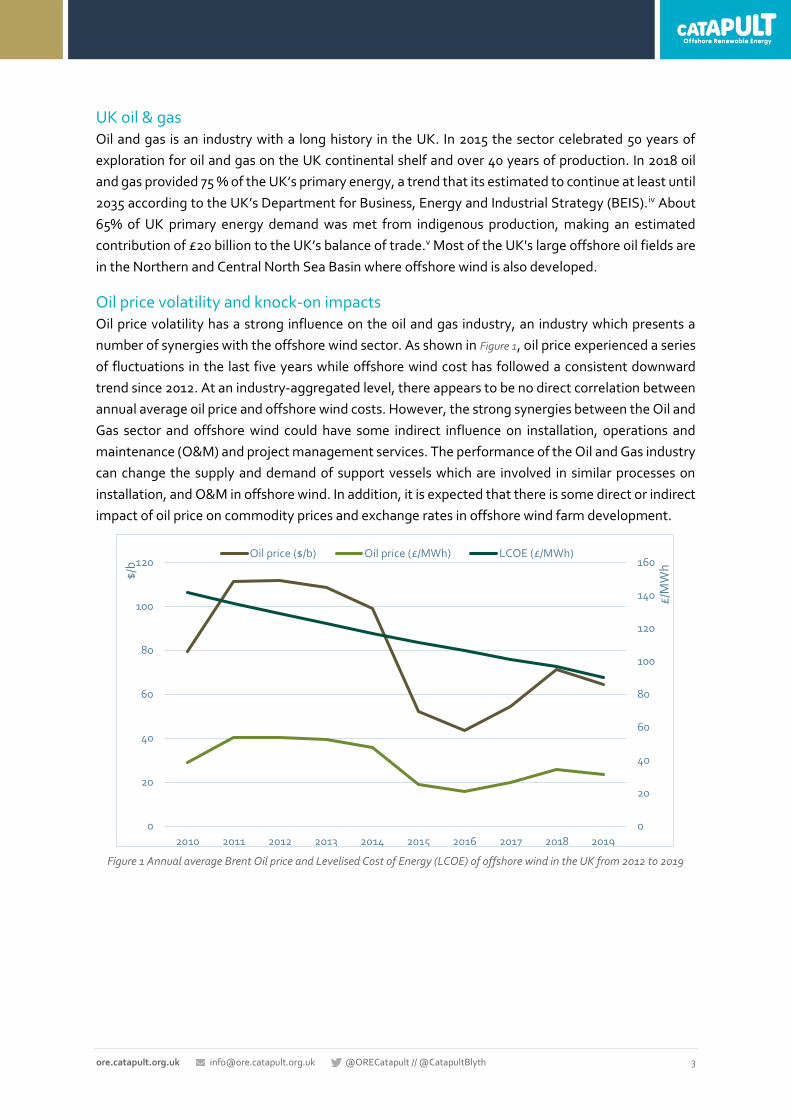
Oil price volatility and knock-on impacts Oil price volatility has a strong influence on the oil and gas industry, an industry which presents a
number of synergies with the offshore wind sector. As shown in Figure 1, oil price experienced a series
of fluctuations in the last five years while offshore wind cost has followed a consistent downward
trend since 2012. At an industry-aggregated level, there appears to be no direct correlation between
annual average oil price and offshore wind costs. However, the strong synergies between the Oil and
Gas sector and offshore wind could have some indirect influence on installation, operations and
maintenance (O&M) and project management services. The performance of the Oil and Gas industry
can change the supply and demand of support vessels which are involved in similar processes on
installation, and O&M in offshore wind. In addition, it is expected that there is some direct or indirect
impact of oil price on commodity prices and exchange rates in offshore wind farm development.
Figure 1 Annual average Brent Oil price and Levelised Cost of Energy (LCOE) of offshore wind in the UK from 2012 to 2019
0
20
40
60
80
100
120
140
160
0
20
40
60
80
100
120
2010 2011 2012 2013 2014 2015 2016 2017 2018 2019
£/M
Wh
$/b
Oil price ($/b) Oil price (£/MWh) LCOE (£/MWh)
4 ore.catapult.org.uk [email protected] @ORECatapult // @CatapultBlyth
|
OIL PRICE AND OFFSHORE WIND OUTLOOKS
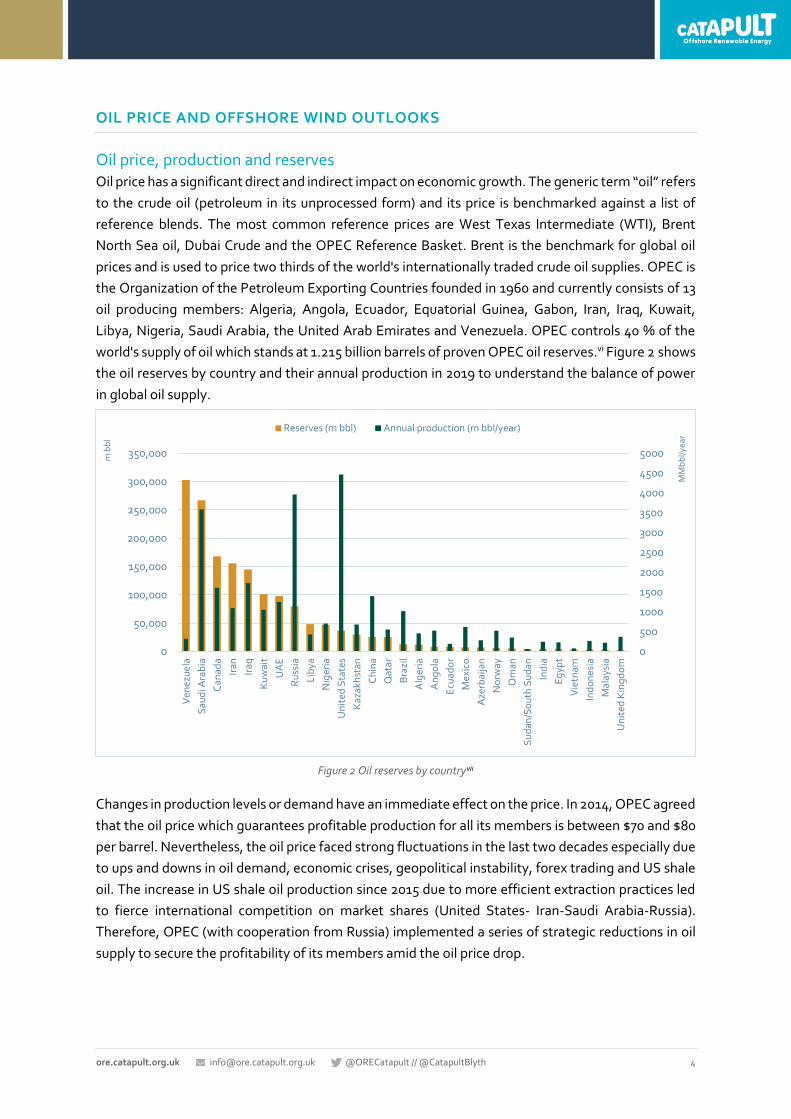
Oil price, production and reserves Oil price has a significant direct and indirect impact on economic growth. The generic term “oil” refers
to the crude oil (petroleum in its unprocessed form) and its price is benchmarked against a list of
reference blends. The most common reference prices are West Texas Intermediate (WTI), Brent
North Sea oil, Dubai Crude and the OPEC Reference Basket. Brent is the benchmark for global oil
prices and is used to price two thirds of the world's internationally traded crude oil supplies. OPEC is
the Organization of the Petroleum Exporting Countries founded in 1960 and currently consists of 13
oil producing members: Algeria, Angola, Ecuador, Equatorial Guinea, Gabon, Iran, Iraq, Kuwait,
Libya, Nigeria, Saudi Arabia, the United Arab Emirates and Venezuela. OPEC controls 40 % of the
world's supply of oil which stands at 1.215 billion barrels of proven OPEC oil reserves.vi Figure 2 shows
the oil reserves by country and their annual production in 2019 to understand the balance of power
in global oil supply.
Figure 2 Oil reserves by countryvii
Changes in production levels or demand have an immediate effect on the price. In 2014, OPEC agreed
that the oil price which guarantees profitable production for all its members is between $70 and $80
per barrel. Nevertheless, the oil price faced strong fluctuations in the last two decades especially due
to ups and downs in oil demand, economic crises, geopolitical instability, forex trading and US shale
oil. The increase in US shale oil production since 2015 due to more efficient extraction practices led
to fierce international competition on market shares (United States- Iran-Saudi Arabia-Russia).
Therefore, OPEC (with cooperation from Russia) implemented a series of strategic reductions in oil
supply to secure the profitability of its members amid the oil price drop.
0
500
1000
1500
2000
2500
3000
3500
4000
4500
5000
0
50,000
100,000
150,000
200,000
250,000
300,000
350,000
Ven
ezu
ela
Sau
di A
rab
ia
Can
ada
Iran
Iraq
Ku
wai
t
UA
E
Ru
ssia
Lib
ya
Nig
eria
Un
ited
Sta
tes
Kaz
akh
stan
Ch
ina
Qat
ar
Bra
zil
Alg
eria
An
go
la
Ecu
ado
r
Mex
ico
Aze
rbai
jan
No
rway
Om
an
Su
dan
/So
uth
Su
dan
Ind
ia
Eg
ypt
Vie
tnam
Ind
on
esia
Mal
aysi
a
Un
ited
Kin
gd
om
MM
bb
l/yea
r
m b
bl
Reserves (m bbl) Annual production (m bbl/year)
5 ore.catapult.org.uk [email protected] @ORECatapult // @CatapultBlyth
|
Oil price shocks In November 2018, the Brent oil price dropped 30 % in one month to $59.36 per barrel after concerns
for a glut of crude oil supply and economic growth slowdown. The price recovered t0 $72 per barrel
in April 2019 supported by the steady growth of the Chinese economy and the reduction of US crude
oil inventories.viii However, the US was the world’s largest oil producer in 2019 continuing to produce
cheap shale oil so the price started to fall again after a series of fluctuations sparked by the rise in
Middle East tensions. In December 2019, OPEC and its allies agreed to cut an extra 500,000 barrels
of global oil a day in 2020 to support oil prices amid fears of an economic downturn. The outbreak of
COVID19 slowed down economic growth and oil demand, and a decision by OPEC to lift production
restraints lead to a drop in Brent oil price below $30 per barrel in March 2020. In April, OPEC producers
and allies agreed to a historic cut in oil production by 10%, the largest cut in history.
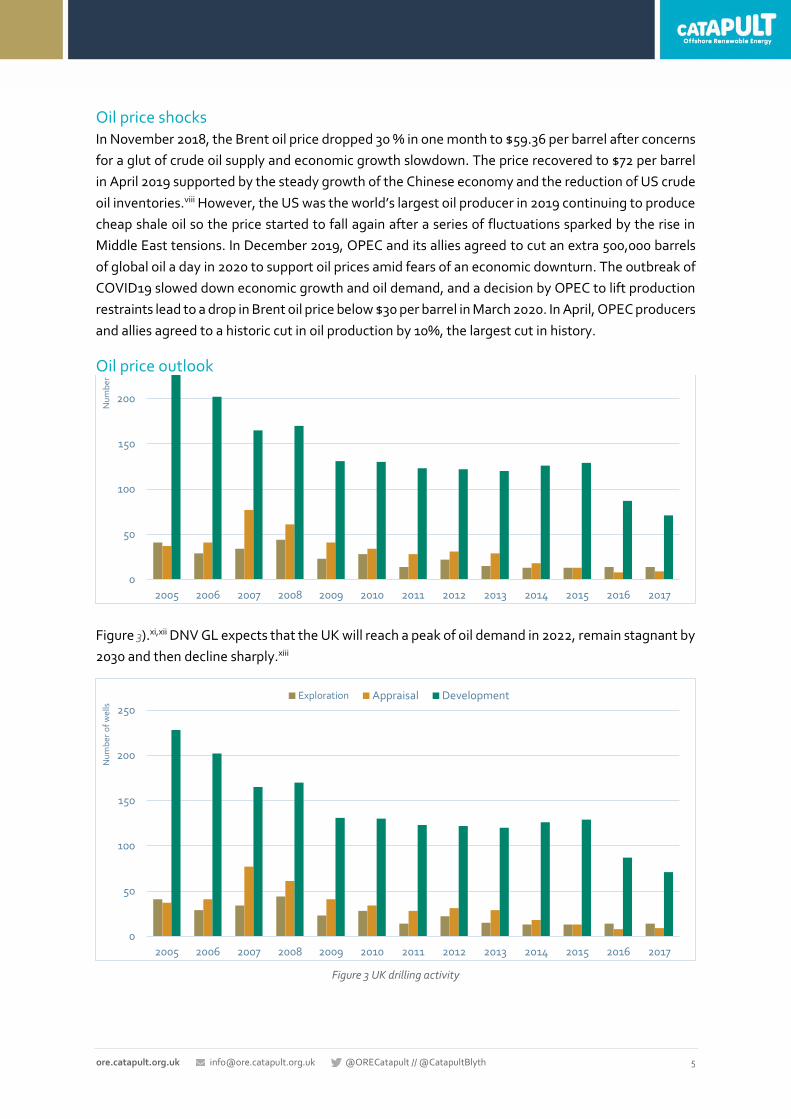
Oil price outlook Despite demand for oil decreasing, the next decade will see higher prices according to the U.S.
Energy Information Administration (EIA) which estimates an average Brent crude oil price of $81.70
per barrel by 2025 gradually reaching $105 per barrel by 2050 (in 2018 real).ix The reason for this
upward trend lies in the fact that the cheap oil resources will start to become exhausted, rendering
oil extraction more expensive. McKinsey&Company analysis shows that by 2030, more than 35
million barrels per day of new crude oil production from projects yet to be sanctioned will be needed
to meet demand including 12.7 million barrels from expensive deepwater wells.x According to
Barclay’s report Oil in 3D: the demand outlook to 2050, the reliance on oil is expected to start to drop
by 2030 and remain stagnant until 2050 driven by the decarbonisation policies which will lead to a
lower rate of discoveries and natural decline of mature fields such as in the North Sea (
Figure 3).xi,xii DNV GL expects that the UK will reach a peak of oil demand in 2022, remain stagnant by
2030 and then decline sharply.xiii
Figure 3 UK drilling activity
0
50
100
150
200
2005 2006 2007 2008 2009 2010 2011 2012 2013 2014 2015 2016 2017
Nu
mb
er o
f w
ells
0
50
100
150
200
250
2005 2006 2007 2008 2009 2010 2011 2012 2013 2014 2015 2016 2017
Nu
mb
er o
f w
ells
Exploration Appraisal Development

6 ore.catapult.org.uk [email protected] @ORECatapult // @CatapultBlyth
|
UK offshore wind In contrast, the contribution of renewable energy in the global energy mix is following an upward
trend driven by the need for a sustainable, clean energy source as an alternative to conventional fuels.
Strategies to combat climate change are becoming part of government plans in an increasing number
of countries. These include cutting fossil fuel subsidies and introducing carbon taxes to help the
transition to renewables, boost decarbonisation and secure energy supply. In 2019, 37 % of UK
electricity came from renewables of which 53 % from wind energy (27 % offshore and 27 % onshore
wind).ii The offshore wind industry has been active less than 20 years at commercial scale and the UK
is the global leader with about 9.5 GW operational in its waters. There is a need for at least 75 GW by
2050 to reach net-zero GHGs fed mostly by the abundance of wind resources and the rapid cost
reduction of the technology. The recent announcement of strike prices for Contracts for Difference
(CFD) Allocation Round 3 (AR3) auction saw prices as low as £40/MWh (2012 real) for projects
commissioning after 2023, a drop of 72% in 15 years pushing costs even lower ( Figure 4). Other
countries such as Germany have already accepted subsidy-free bids from offshore wind farm
developers (although grid connection is secured and publicly funded by the government in contrast
to the UK where the offshore generation developers pay for the connection to the mainland). The
pace of innovation, volume of commercial scale projects, learning through experience and economies
of scale will drive cost reduction even further.
Figure 4 UK installed offshore wind capacity and LCOE projections
0
20
40
60
80
100
120
140
160
0
5,000
10,000
15,000
20,000
25,000
30,000
35,000
40,000
45,000
£/M
Wh
MW
Installed Capacity (MW) LCOE (£/MWh)
7 ore.catapult.org.uk [email protected] @ORECatapult // @CatapultBlyth
|
IMPACT OF OIL PRICE ON OFFSHORE WIND COSTS
This section provides brief analysis on areas where oil price does, or could be expected to, have an
impact on the cost of offshore wind.
Turbine and foundation installation vessels Turbine and foundation installation costs currently account for roughly 10% of total capex and 7% of
LCOE. This is therefore a significant cost centre in any offshore wind project.
Offshore wind developers from 2003 to 2009 were hiring existing general-purpose jack-ups or
modified vessels for turbine installation, and (heavy lift) crane vessels for the installation of
foundation structures usually from the oil and gas industry, creating competition between the
sectors. This led to a lack of availability of suitable vessels and costly delays especially in the
installation phase. There was clear evidence at that time that increased oil and gas activity, driven by
high oil prices, had a direct impact on the cost of offshore wind projects. However, with the rapid
deployment of offshore wind, the industry and its evolving supply chain started to manufacture
purpose-built offshore wind vessels with more deck space and capable of operating in longer weather
windows. In 2003, the first dedicated wind turbine installation vessel designed specifically for the
installation of both foundations and turbines entered service.
As the number of bespoke offshore wind installation vessels increased, the direct competition with
the oil and gas sector for vessels decreased, loosening the tie between oil and gas activity and
offshore wind costs. However, offshore project developers face a limited supply of vessels capable of
installing new higher-capacity turbines in deeper waters. In 2015, the European offshore wind
industry had a fleet of 75 vessels but almost half of the jack-up vessels in use were not capable of
installing the 8-MW turbines planned in deeper waters and more frequent adverse weather
conditions.xiv,xv Shipbuilders are responding to the demand for purpose-built installation vessels with
a new generation of ships designed specifically for offshore wind. The demand for 3rd generation
offshore wind vessels will continue to rise after 2020 when the existing fleet will not be sufficient to
service the continuous upscaling of wind turbines and foundations. ORE Catapult’s internal analysis
forecasts that the global offshore wind turbine installed capacity will be further expanded with a
compound annual growth rate (CAGR) of 17% from 2019 to 2030. The extent of the relationship
between oil and gas activity and offshore wind costs will depend largely on the extent and rate
of development of next generation offshore wind installation vessels. The introduction of more
new installation vessels will increase supply competition and is likely to reduce the charter rate
of vessels for the offshore wind industry, but offshore wind installation costs may well increase
if there is insufficient investment in new bespoke vessels able to serve the industry when this is
required. xvi The demand for bespoke vessels is expected to increase rapidly so some shipbuilders will
struggle to upscale their fleet size at the rate required to address the needs of the market.
Shipbuilders, OEMs and developers should be in close contact to find the right balance between
meeting market needs and funding high capital investments in new vessels.

8 ore.catapult.org.uk [email protected] @ORECatapult // @CatapultBlyth
|
Other installation - offshore support vessels (OSV) Offshore wind project construction also requires the use of several types of OSV used commonly in
the oil and gas industry. These include cable-laying vessels, crew transfer vessels (CTV’s), crew
accommodation vessels and subsea operating equipment.
The maturing North Sea oil and gas sector will require a large programme of oil platform
decommissioning, presenting a significant opportunity for OSV’s. Nearly 150 oil platforms in the UK
North Sea are expected to be scrapped over the next 10 years, with over 80 decommissioning projects
in Northwest Europe in either the working, tendering, possible, or planned stages according to IHS
Markit.xv The vast majority of projects are located in the UK (68%) and in Norway (18%).xvii This will
increase the demand for vessels, which will then be unavailable to serve offshore wind, making the
development of bespoke vessels an imperative.
In the last decade (until 2014), the oil price was rising and the need for fleet replacement encouraged
high offshore vessel building activity. In 2015 and 2016 reserve numbers fell in oil and gas due to few
discoveries while the production from in-fill drilling in mature fields showed a steady increase.xviii The
oil price did not exceed £55 per barrel on average from 2015 to 2017. According to Oil & Gas UK’s
(OGUK) Business Outlook 2019, 2018 had the lowest number of wells spudded in the UK since 1965,
with 8 exploratory, 9 appraisal and 85 development.iv A similar trend was observed for total offshore
exploration drilling wells in 2018 which was slightly lower than 2017 reaching 237.xix The low oil price
decreases drilling rig utilisation, freezes the renewal of contracts and decreases the delivery and day
rates of offshore vessels usually with at least two years lag.xx This means that the impact of oil price
changes are not instantly visible and are passed on with a delay into the OSV market making it
difficult to observe the direct impact of shifts in the oil price or market. Figure 5 shows the global
utilisation level in terms of OSV/rigs ratio of platform support vessels (PSV’s) and anchor handling
tug supply (AHTS) vessels between 2013 and summer of 2019.
Figure 5 Global OSV fleet xxi

9 ore.catapult.org.uk [email protected] @ORECatapult // @CatapultBlyth
|
In 2018, the low oil price and the oversupply of vessel building activity in shipyards across Asia kept
global utilisation weak especially in North America, Asia Pacific, and West Africa. Although there was
some improvement in demand in 2019 mostly driven by a slight drop in the size of the active OSV
fleet, debt restructurings, improved cost management and emergence of massive new supplies of
shale oil in the last decade, the OSV industry seems unlikely to recover any time soon.xxi In the North
Sea, the steadily rising rate of utilisation is not expected to change the current status in the short
term. An example of this trend can be seen in Figure 6 showing the global OSV supply, demand and
fleet utilisation. After 2018 the rising expenditure on offshore oil exploration drives the global OSVs
market which is anticipated to grow at a CAGR of 6.5% by 2025.xxii Some of the heavy lift jack-up
vessels used in offshore wind are serving the oil and gas industry as well so the demand will be
increased when the oil price starts to recover, leaving less space for offshore wind projects. Both
oil and gas and offshore wind will help provide profitable returns on investment for vessel owners. As
oil demand falls gradually and the offshore wind pipeline grows, shipbuilders will have an
opportunity to shift production towards purpose-built vessels for the offshore wind sector.
Figure 6 Global offshore supply vessels market by region xxiii
The increasing deployment of floating wind could also trigger a new competition for vessels with oil
and gas as both types of floating platforms can be similar in design. In general, the vessels used to
install floating wind platforms are expected to be more akin to offshore support vessels (particularly
AHTS and tugs) and so the impact on the cost of floating wind installation costs is likely to be in line
with the points addressed in this section. The upside of this is that as offshore oil activity declines,
floating wind provides a natural market for existing SOV’s to continue to operate profitably.
10 ore.catapult.org.uk [email protected] @ORECatapult // @CatapultBlyth
|
O&M vessels Demand from offshore wind will also rise for CTV’s and service operation vessels (SOV’s) used for
O&M. In the early days of the sector, fishing boats and survey ships were used to transport
technicians to offshore wind sites. Larger turbines, larger and more complex turbine arrays and
deeper waters require an established O&M supply chain able to offer innovative technological
solutions which can maximise long term turbine performance. Some vessels traditionally used in oil
and gas like PSVs and multipurpose support vessels (MSVs) were converted into accommodation
vessels for technicians in the past, but this practice does not look set to continue as offshore wind
requires specific vessel sea-keeping characteristics that suit the walk-to-work system. As more
dedicated wind-specific vessels are being built, the sector will rely less on oil and gas and the
impact of oil price volatility will be reduced.
Transport fuel Oil is the primary fuel used in transportation accounting for 5% of total oil demand according to the
IEA so the fluctuations in its price can immediately be reflected in charter rates in both installation
and O&M vessels. Fuel cost accounts for in the region of 1% of total offshore installation costs and up
to 2% of total O&M costs of an offshore windfarm.xxiv So, while fuel costs are significant in absolute
terms, they are a relatively small proportion of overall project costs.
Bunker fuel is any type of fuel oil used in the shipping industry and is the biggest component of the
operational cost of a ship, being the main reason for concern by ship owners. What happens in the
crude oil market has direct correlation in bunker fuel oil. The maritime industry usually follows
hedging strategies such as fixed-price swap which allows organisations to fix fuel prices at a
predefined level, independent of future market movements.
However, the recent International Maritime Organisation (IMO) 2020 rule added an extra challenge
having a big impact on the bunker market. Aiming to reduce air pollution, the new regulation bans
ships from using fuels with a sulphur content above 0.5%, compared with 3.5% High Sulphur Fuel Oil
(HSFO) most ships have been using.xxv Shippers either need to use fuels with a sulphur content not
exceeding 0.5% or install scrubbers that can clean higher-sulphur fuels to reduce emissions. The
decarbonisation pathway of the sector will also lead to the adaption of alternative fuels like LNG,
methanol or hydrogen which can be produced either from natural gas or renewable sources. In the
short term, the correlation between charter rates and fuel oil is unstable. Compliant fuel, low and very
low-sulphur fuel oil (V)LSFO and marine gasoil (MGO), currently have low availability which increases
their price, although the supply is expected to improve when refineries are reconfigured to produce
more low sulphur fuel oil.
11 ore.catapult.org.uk [email protected] @ORECatapult // @CatapultBlyth
|
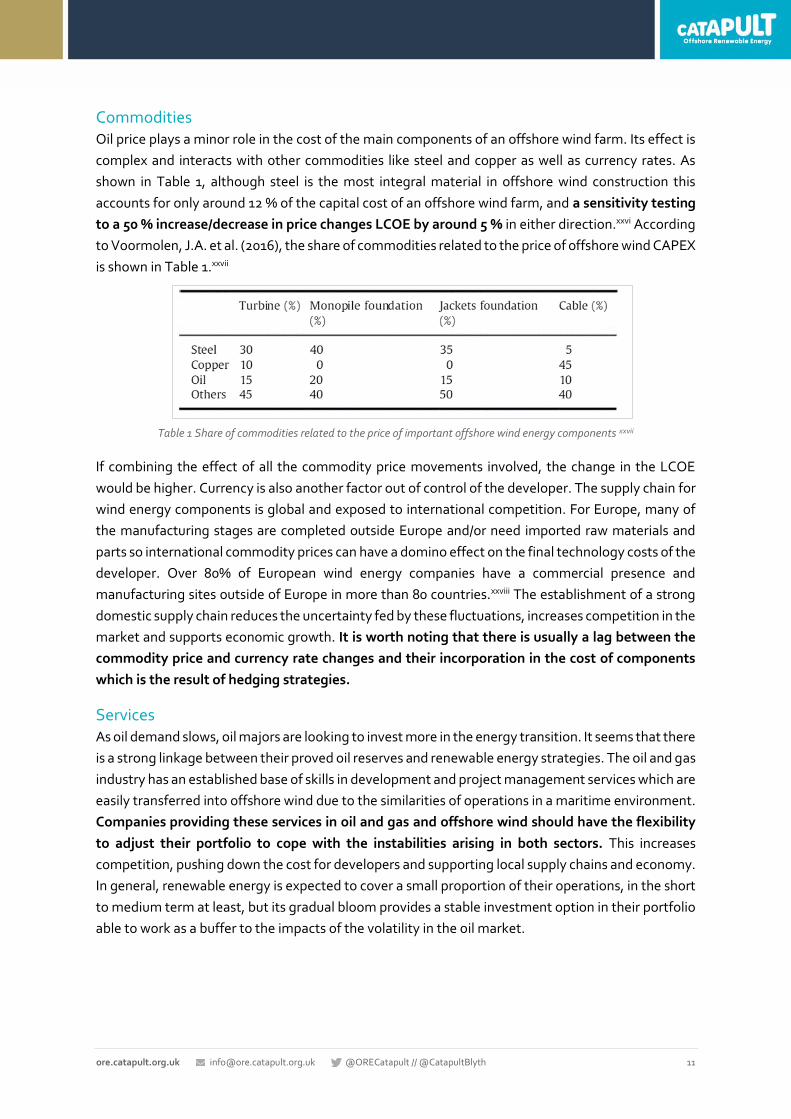
Commodities Oil price plays a minor role in the cost of the main components of an offshore wind farm. Its effect is
complex and interacts with other commodities like steel and copper as well as currency rates. As
shown in Table 1, although steel is the most integral material in offshore wind construction this
accounts for only around 12 % of the capital cost of an offshore wind farm, and a sensitivity testing
to a 50 % increase/decrease in price changes LCOE by around 5 % in either direction.xxvi According
to Voormolen, J.A. et al. (2016), the share of commodities related to the price of offshore wind CAPEX
is shown in Table 1.xxvii
Table 1 Share of commodities related to the price of important offshore wind energy components xxvii
If combining the effect of all the commodity price movements involved, the change in the LCOE
would be higher. Currency is also another factor out of control of the developer. The supply chain for
wind energy components is global and exposed to international competition. For Europe, many of
the manufacturing stages are completed outside Europe and/or need imported raw materials and
parts so international commodity prices can have a domino effect on the final technology costs of the
developer. Over 80% of European wind energy companies have a commercial presence and
manufacturing sites outside of Europe in more than 80 countries.xxviii The establishment of a strong
domestic supply chain reduces the uncertainty fed by these fluctuations, increases competition in the
market and supports economic growth. It is worth noting that there is usually a lag between the
commodity price and currency rate changes and their incorporation in the cost of components
which is the result of hedging strategies.
Services As oil demand slows, oil majors are looking to invest more in the energy transition. It seems that there
is a strong linkage between their proved oil reserves and renewable energy strategies. The oil and gas
industry has an established base of skills in development and project management services which are
easily transferred into offshore wind due to the similarities of operations in a maritime environment.
Companies providing these services in oil and gas and offshore wind should have the flexibility
to adjust their portfolio to cope with the instabilities arising in both sectors. This increases
competition, pushing down the cost for developers and supporting local supply chains and economy.
In general, renewable energy is expected to cover a small proportion of their operations, in the short
to medium term at least, but its gradual bloom provides a stable investment option in their portfolio
able to work as a buffer to the impacts of the volatility in the oil market.

12 ore.catapult.org.uk [email protected] @ORECatapult // @CatapultBlyth
|
INVESTMENT IN ELECTRICITY GENERATION
Fossil fuels in the energy mix While oil extraction becomes more expensive, energy from renewable energy shows rapid cost
reduction, attracting more investment than ever before. The analysis of correlation between the oil
price and renewable energy cost is complex. In general, a low oil price has a direct effect on the
electricity price as the incremental generation cost from oil-fired plants drops. However, the world’s
electricity generation does not rely on oil resources as much as it did back in the 1970s where 19% of
total electricity was generated from oil.xxix The figure in 2018 was 3%, although there are broad
differences depending on geography.xxx In the UK only 0.3 % of electricity came from oil in 2019 while
renewables generated 37%.xxxi This means that fluctuations in the oil price currently have
negligible direct impact on overall costs of electricity generation and so have little impact on the
relative attractiveness of renewable energy such as wind and solar as low-cost forms of
generation. Oil is mostly used in the transport sector so drops in oil price can mainly restrain the
development in electric vehicles and biofuels. This may have an indirect impact on the pace of
renewables build-out as a slower roll-out of electric vehicles, for example, will slow down the pace of
overall energy system electrification including demand for renewable energy.
Natural gas dominates the electricity market as a lower-carbon alternative to coal-fired power
stations and emits 50 to 60 percent less carbon dioxide (CO2) when combusted in a new, efficient
natural gas power plant compared with the emissions from a typical new coal plant. Gas generated
about 41% of UK electricity in 2019. The cost of gas-fired electricity generation is a more appropriate
benchmark to assess renewables’ competitiveness. In the past, gas showed a closer correlation with
oil especially during price peaks but since 2008 the prices have decoupled.
The International Energy Agency (IEA) Sustainable Development Scenario projects that almost 50%
of global energy demand will still be covered by oil and gas in 2040 although both will show a gradual
decline.xxxii Due to the variable nature of renewable energy sources, their increasing integration in the
energy system requires the presence in the near-term of a strong oil and gas sector to maintain a
balanced energy mix and secure supply. However, the oil and gas industry will continue to face strong
pressure to limit GHG emissions with direct contribution from oil and gas operations of 9% of all
human-made GHG emissions and 33% from the related value chain.xxxiii In the longer term, batteries
and hydrogen energy storage can help decarbonise the energy sector and give an effective
alternative environmentally friendly solution.
Oil majors and offshore wind
Almost all the oil majors have announced in recent years their ambitions to decarbonise activities
while adapting to the reality of energy transition. This will require a 90% reduction on current
emissions accounting for at least 3.4 GtCo2e per year by 2050. Achieving this goal will require the
shift to low carbon operations or/and carbon offsetting mechanisms. However, a recent analysis from
Rystad Energy indicates that oil majors show a modest to low appetite to invest in renewable energy
projects in near term. Investment in renewables from the oil and gas sector currently accounts for
less than 2% of global solar and wind capacity. In spite of this, green investments are expected to

13 ore.catapult.org.uk [email protected] @ORECatapult // @CatapultBlyth
|
grow to 25% of all energy spending and surpass traditional fuel sources like oil and gas for the first
time in 2021 as clean technologies are now more mature, cost of capital is falling and regulatory
framework is adjusted.xxxiv During the next five years, Big Oil is expected to pump $166bn (£134bn)1
into new oil and gas ventures, while the currently specified outlay for solar and wind energy projects
will total just $18bn (14.5bn).xxxv This means that only 1 dollar out of 10 will be invested in renewables
with a large part of spending referring to offshore wind projects by Equinor. Although Equinor’s
current annual capital expenditure in renewables is low, the company plans to invest in new energy
solutions and raise its capital expenditure share up to 20% by 2030.xxxvi Apart from this investment
portfolio, other companies show a decline in renewable investment by 2023. After 2025 only Royal
Dutch Shell has announced plans to increase its future low carbon investments to be in line with the
company’s shift to the energy transition. Orsted is a striking example of a company’s transformation
from oil and gas to renewables. For decades, DONG (now Orsted) managed the gas and oil resources
in the Danish sector of the North Sea before entering the electricity market and then expanding its
operations in offshore wind in the 2000’s. It is the largest offshore wind farm company in the world
with 7 GW offshore wind installed capacity and has a vision to reach 15 GW by 2025 and 30 GW by
2030.xxxvii
Figure 7 Project-specific near-term future investments among oil majors2
Oil and renewable energy investments are based on different business models; although both require
high capital up-front investment, electricity price volatility is low for renewable energy (especially if
support mechanisms like CfDs are considered), while oil price fluctuations impose a higher risk on oil
extraction. The factors which influence the decisions on low carbon investment strategies are fossil
fuel prices, geography, asset mix (offshore versus onshore, gas versus oil, upstream versus
downstream), proved oil reserves (low levels of reserves encourage a faster transition to renewables)
1 FOREX USD:GBP (19/06/2020) = 0.81 2 The recent stake acquisition of Total in the Seagreen 1 offshore wind project is not included in the graph.
14 ore.catapult.org.uk [email protected] @ORECatapult // @CatapultBlyth
|
and local policies and practices (regulations, carbon pricing, the availability of renewables, and the
central grid’s reliability and proximity).xxxiii
Offshore wind is currently in the spotlight of the decarbonisation plan due to rapid cost reduction and
high energy potential. Few oil majors have currently invested or have immediate plans to invest in
offshore wind. Equinor has already been involved in offshore wind for a decade and has placed a
leading position in floating wind after installing the 30MW Hywind Scotland, the first floating wind
pilot park in the world. Royal Dutch Shell is a member of The Carbon Trust’s Offshore Wind
Accelerator (OWA) scheme looking to reduce the cost of offshore wind and has recently agreed to
buy the French floating wind developer Eolfi SA. In the last three months, Total acquired the majority
stake in the 1.1 GW Seagreen 1 offshore wind project and signed an agreement with the developer
Simply Blue Energy to acquire an 80% stake in the 96 MW floating wind project Erebus located in the
Celtic Sea.xxxviii Eni, the Italian oil and gas major, has shown its intention to grow its offshore wind
capacity and formed partnerships with Mainstream Renewable Power (MRP), GE Renewable Energy
and Equinor to collaborate on clean energy projects.xxxix,xl
These offshore wind projects are generally financed through a mix of debt and equity, with the
amount of non-recourse debt financing in European projects having increased significantly from
€1.5bn in 2010 to €16.5bn by 2018.xli The 2018 figure is comprised €8bn new asset debt and €8.5bn
refinance debt. While there are challenges in mobilising and co-ordinating the large sums required
for increasing numbers of multi-billion-pound offshore wind projects, project developers, investors
and lenders are becoming increasingly comfortable with offshore wind as a relatively low-risk asset
class. These existing and expanding sources of funding are not at risk from potential competition
from the oil and gas sector.
It is possible that a sustained upturn in oil price which encourages increased oil and gas
investment will reduce the pace at which oil and gas companies enter, or increase their activity
in, offshore wind. Some increase in oil price could, however, be beneficial for renewables as
current extreme low prices reduce the confidence in large oil and gas companies to make any
kind of major investment and increase the need to cut spending. Low-carbon investments by oil
majors have slowed amid the oil price shock, with clean energy deals closed in 1Q 2020 down 82%
year-on-year and 25% cut in planned capex for 2020.xlii In general, as oil demand slows down and
extraction cost increases without the adequate revenue return, the oil industry starts to consider
other resources to diversify and direct their capital.
European offshore wind capacity today is 22GW, representing investment in the order of €60bn over
the last (approximately) 10 years. Reaching an expected ~100GW offshore wind in Europe by 2030
and upwards of 300GW by 2050 is likely to require investment in excess of €180bn over the next 10
years and a further €400bn over the following 20 years. The average annual investment required over
the next 30 years will be around triple the already significant annual average over the previous 10
years. Large oil and gas players are ideally placed to play a crucial role in offshore wind, with decades
of offshore experience, access to large cash balances and influential investors. Unlocking these as a
source of investment for the next stages of the exponential growth of the global offshore wind
market could be crucial given the vast sums of money required.
15 ore.catapult.org.uk [email protected] @ORECatapult // @CatapultBlyth
|
CONCLUSIONS
• Upscaling of offshore wind turbines (turbine and foundation size and mass) means offshore wind
requirements are fast becoming more than many oil and gas vessels can handle so competition
between the industries is diminishing and availability of bespoke vessels is a greater cost driver.
• Some of the heavy lift jack-up vessels and OSVs used in offshore wind are also serving the oil and
gas industry so the demand will be increased when the oil price starts to recover leaving less space
for offshore wind projects – causing a potential increase in offshore wind costs.
• In the long term, increase in supply of new bespoke offshore wind installation and O&M vessels
will limit the competition between offshore wind and oil and gas and will reduce their charter rate
for the offshore wind industry – causing a potential decrease in offshore wind costs.
• As well as oil price, fuel price is impacted significantly by the IMO 2020 rule which is reflected in
charter rates both in installation and O&M vessels serving offshore wind – this could potentially
cause a small increase in the cost of offshore wind compared to current levels, but also
accelerates the need for vessels using cleaner fuel (e.g. electric, hydrogen, etc).
• Oil price interacts with prices of steel and copper but has a low impact on offshore wind
component costs.
• The oil and gas industry and services have an established base of skills in development and project
management to serve both the oil and gas and offshore wind sectors. More oil and gas service
providers entering the offshore wind market will increase competition, reducing offshore wind
cost and supporting local supply chains.
• Natural gas is now the main source of the world’s electricity generation, which does not rely on
oil resources as much as in the past. Fluctuation in the oil price has negligible to no impact on
renewable energy investments such as wind and solar as they do not compete directly with each
other but may have high impact in electrification pathways especially in the transport sector and
transition to electric vehicles.
• Short-term and long-term changes in oil price have different impacts on renewable energy
investments as oil price is one factor among many in companies’ investment strategies.
Shareholder drive and national decarbonisation targets provide more emphasis for oil majors to
diversify into low carbon activities in the next decade.
• Prolonged periods of low oil prices, leading to low investment returns, can also drive up the entry
of oil and gas majors into offshore wind and so unlock crucial, new sources of funding. Conversely,
some increase in oil price could be beneficial for renewables as current extreme low oil prices
reduce the confidence in large oil and gas companies to make any major investments at all.
• Large oil and gas players are ideally placed to play a crucial role in offshore wind, with decades of
offshore experience, access to large cash balances and influential investors. Unlocking these as a
source of investment for the next stages of the exponential growth of the global offshore wind
market could be crucial given the vast sums of money required.

16 ore.catapult.org.uk [email protected] @ORECatapult // @CatapultBlyth
|
Appendices
RECOMMENDED READING
OIL&GAS UK, BUSINESS OUTLOOK 2019
OGUK, ECONOMIC REPORT 2019
Barclays, 7 May 2019, Oil in 3D: the demand outlook to 2050
BP, 2019, BP Statistical Review of World Energy
Wind Europe, April 2019, Financing and investment trends - The European wind industry in 2018
AUTHOR PROFILE
Angeliki Spyroudi is Senior Strategy Analyst at Offshore Renewable Energy Catapult. She has a background in economics, regional development, environmental management and renewable energy technology. She investigates and analyses industry trends to give strategic insights of the offshore renewable energy market. In addition to this work, she conducts financial modelling on a variety of renewable energy projects identifying cost reduction potential and explores the commercial viability of innovative technologies to support SMEs.
CONTACT
GLASGOW
Inovo 121 George Street Glasgow G1 1RD
+44 (0)333 004 1400
BLYTH
National Renewable Energy Centre Albert Street, Blyth NE21 1LZ
+44 (0)1670 359 555
LEVENMOUTH
Fife Renewables Innovation Centre Ajax Way, Leven KY8 3RS
+44 (0)1670 357 64
GRIMSBY
O&M Centre of Excellence Port Office Cleethorpe Road
Grimsby DN31 3LL
ABERDEEN
Subsea UK 30 Ambercrombie Court Prospect Road, Westhill Aberdeenshire AB32 6FE
CORNWALL
Hayle Marine Renewab;es Business Park, North Quay, Hayle, Cornwall TR27 4DD
PEMBROKESHIRE
Pembroke Dock, Pembrokeshire SA72 6TD
CHINA
11th Floor, Lan Se Zhi Gu No.5 Ke Ji Avenue, Hi-Tech Zone Yantai City Shandong Province China
LOWESTOFT
Orbis Energy Wilde Street Lowestoft, Suffolk NR31 1XH
Disclaimer
While the information contained in this report has been prepared and collated in good faith, ORE Catapult makes no representation or warranty (express or implied) as to the accuracy or completeness of the information contained herein nor shall be liable for any loss or damage resultant from reliance on same.
17 ore.catapult.org.uk [email protected] @ORECatapult // @CatapultBlyth
|
i ‘UK becomes first major economy to pass net zero emissions law’, Press release, Department for Business, Energy & Industrial Strategy and The Rt Hon Chris Skidmore MP, 27 June 2019, available online at: https://www.gov.uk/government/news/uk-becomes-first-major-economy-to-pass-net-zero-emissions-law, accessed June 2020. ii ‘UK Energy Statistics, 2019 & Q4 2019’, Press release, Department for Business, Energy & Industrial Strategy, 26 March 2020, available online at: https://assets.publishing.service.gov.uk/government/uploads/system/uploads/attachment_data/file/877047/Press_Notice_March_2020.pdf , accessed June 2020. iii Net Zero The UK’s contribution to stopping global warming, Committee on Climate Change, May 2019, available online at: https://www.theccc.org.uk/wp-content/uploads/2019/05/Net-Zero-The-UKs-contribution-to-stopping-global-warming.pdf, accessed June 2020. iv BUSINESS OUTLOOK 2019, OIL&GAS UK, 2019, available online at: https://oilandgasuk.co.uk/wp-content/uploads/2019/03/OGUK-Business-Outlook-Report-2019.pdf, accessed June 2020. v ECONOMIC REPORT 2019, OGUK, available online at: https://oilandgasuk.co.uk/wp-content/uploads/2019/09/Economic-Report-2019-OGUK.pdf, accessed June 2020. vi BP, ‘Statistical Review of World Energy – all data, 1965-2019’, 2020, available online at: https://www.bp.com/en/global/corporate/energy-economics/statistical-review-of-world-energy.html, accessed June 2020. viiPetroleum and Other Liquids, U.S. Energy Information Administration, available online at: https://www.eia.gov/international/data/world, accessed June 2020 viii Tom DiChristopher, ‘Oil prices slip, but settle near 2019 highs on China growth, lower US crude stockpiles’, CNBC, 17 April2019, available online at: https://www.cnbc.com/2019/04/16/oil-markets-russia-opec-output-in-focus.html, accessed June 2020. ix EIA - Annual Energy Outlook 2019, Eia.gov, January 2019, available online at: https://www.eia.gov/outlooks/aeo/pdf/aeo2019.pdf, accessed June 2020. x Kassia Yanosek and Matt Rogers, ‘Unlocking future growth for deepwater in the Gulf of Mexico’, McKinsey & Company, July 2018, available online at: https://www.mckinsey.com/industries/oil-and-gas/our-insights/unlocking-future-growth-for-deepwater-in-the-gulf-of-mexico, accessed June 2020. xi Tsvetana Paraskova, ‘The Oil Industry Needs Large New Discoveries, Very Soon’, OilPrice.com, 1 October 2018, available online at: https://oilprice.com/Energy/Crude-Oil/The-Oil-Industry-Needs-Large-New-Discoveries-Very-Soon.html, accessed June 2020. xii Oil in 3D: the demand outlook to 2050, Barclays, 7 May 2019, available online at: https://www.investmentbank.barclays.com/content/dam/barclaysmicrosites/ibpublic/documents/our-insights/oil/oil-in-3d.pdf, accessed June 2020. xiii Nerijus Adomaitis, ‘Oil demand to peak in three years, says energy adviser’, Reuters, 11 September 2019, available online at: https://uk.reuters.com/article/uk-oil-demand-dnv-gl/oil-demand-to-peak-in-three-years-says-energy-adviser-dnv-gl-idUKKCN1VV2UT, accessed June 2020. xiv Jason Deign, ‘Offshore projects face vessel shortage for large turbines until 2018’, New Energy Update, 24 September 2015, available online at: http://newenergyupdate.com/wind-energy-update/offshore-projects-face-vessel-shortage-large-turbines-until-2018, accessed June 2020. xv ‘Healthy competition: demand grows for specialised offshore vessels’, Offshore Technology, 17 August 2012, available online at: https://www.offshore-technology.com/features/featureoperation-maintenance-offshore-wind-oil-gas-hydrocarbons-installed-capacity-wind-farm-specialised-resources-ship-boat-vessel-installation/, accessed June 2020. xvi Douglas Fraser, ‘North Sea could lose 150 platforms’, BBC News, 7 February 2016, available online at: https://www.bbc.co.uk/news/uk-scotland-scotland-business-35512217, accessed June 2020. xvii ‘Area report: North Sea – road to recovery blocked by oversupply’, Riviera Maritime Media, 19 September 2018,available online at: https://www.rivieramm.com/opinion/area-report-north-sea--road-to-recovery-blocked-by-oversupply-23324, accessed June 2020. xviii Ron Patterson, ‘UK Oil And Gas May Struggle Without New Discoveries’, OilPrice.com, 07 April 2018, available online at: https://oilprice.com/Energy/Crude-Oil/UK-Oil-And-Gas-May-Struggle-Without-New-Discoveries.html, accessed June 2020. xix Global Oil & Gas Exploration Situation and Implication, Research Institute of Petroleum Exploration & Development (RIPED) of the China National Petroleum Corporation (CNPC), Presentation made at the International Energy Forum (IEF) Lecture: Chinese Perspectives on Global Energy Security, Riyadh, Saudi Arabia, 15 December 2019, available online at: https://www.ief.org/_resources/files/events/ief-lecture-chinese-perspectives-on-global-energy-security-by-the-research-institute-of-petroleum-e/global-2018-oil-and-gas-exploration-situation-and-implication.pdf, accessed June 2020. xx ‘North Sea E&P: Onwards, Faithful Steed!’, Clarksons Research, 30 June 2015, available online at: https://clarksonsresearch.wordpress.com/tag/north-sea/, accessed June 2020. xxi Zachary Chandis, Esben Christensen, Jeff Drake, Peter Oppitzhauser, ‘This rising tide won’t float all boats’, AlixPartners, 18 December 2019, available online at: https://www.alixpartners.com/insights-impact/insights/rising-tide-offshore-supply-vessel-2019/, accessed June 2020. xxii Offshore Support Vessels Market - Growth, Trends, and Forecast (2020 - 2025) (Sample), Mordor intelligence, 2019, available online at: https://www.mordorintelligence.com/industry-reports/global-offshore-support-vessels-market-industry, accessed June 2020.

18 ore.catapult.org.uk [email protected] @ORECatapult // @CatapultBlyth
|
xxiii Alternate Applications of Surplus Offshore Support Vessels, Technology Associates, Inc (TAI), Presentation made at the International Workboat Show, New Orleans, LA, 2017, available online at: https://iwbs-static.s3.amazonaws.com/uploads/2016/12/445-ALTERNATE-APPLICATIONS-OF-SURPLUS-OSVs-11-30-16-DW.pdf, accessed June 2020. xxiv Yalcin Dalgic, Iraklis Lazakis, Osman Turan and Sol Judah, ‘Investigation of optimum jack-up vessel chartering strategy for offshore wind farm O&M activities’, Ocean Engineering, 95, (2015), 106–115, available online at: https://www.sciencedirect.com/science/article/abs/pii/S0029801814004685, accessed June 2020. xxv ‘Sulphur 2020 – cutting sulphur oxide emissions’, International Maritime Organisation (IMO), 2019, available online at: http://www.imo.org/en/mediacentre/hottopics/pages/sulphur-2020.aspx, accessed June 2020. xxvi Great Expectations: The cost of offshore wind in UK waters – understanding the past and projecting the future, UK Energy Research Centre (UKERC), September 2010, available online at: http://www.ukerc.ac.uk/publications/great-expectations-the-cost-of-offshore-wind-in-uk-waters-understanding-the-past-and-projecting-the-future.html, accessed June 2020. xxvii J.A. Voormolen, H.M. Junginger and W.G.J.H.M. van Sark, ‘Unravelling historical cost developments of offshore wind energy in Europe’, Energy Policy, 88, (2016), 435–444, available online at: https://www.sciencedirect.com/science/article/abs/pii/S0301421515301749, accessed June 2020. xxviii Local impact, global leadership - The impact of wind energy on jobs and the EU economy, Deloitte on behalf of Wind Europe, November 2017, available online at: https://windeurope.org/wp-content/uploads/files/about-wind/reports/WindEurope-Local-impact-global-leadership.pdf, accessed June 2020. xxix The World Bank, ‘Electricity production from oil sources (% of total)’, (OECD/IEA: 2014), available online at: https://data.worldbank.org/indicator/EG.ELC.PETR.ZS?view=chart, accessed June 2020. xxx BP Statistical Review of World Energy, BP, 2019, available online at: https://www.bp.com/content/dam/bp/business-sites/en/global/corporate/pdfs/energy-economics/statistical-review/bp-stats-review-2019-full-report.pdf, accessed June 2020. xxxi ‘UK Energy Statistics, 2018 & Q4 2018’, Press release, Department for Business, Energy & Industrial Strategy, 28 March 2019, available online at: https://assets.publishing.service.gov.uk/government/uploads/system/uploads/attachment_data/file/791297/Press_Notice_March_2019.pdf, accessed June 2020. xxxii Sustainable Development Scenario – World Energy Model – Analysis, IEA, November 2019, available online at: http://www.iea.org/weo/weomodel/sds/, accessed June 2020. xxxiii Chantal Beck, Sahar Rashidbeigi, Occo Roelofsen, and Eveline Speelman, ‘The future is now: How oil and gas companies can decarbonize’, McKinsey & Company, 7 January 2020, available online at: https://www.mckinsey.com/industries/oil-and-gas/our-insights/the-future-is-now-how-oil-and-gas-companies-can-decarbonize#, accessed June 2020 xxxiv Ben Winck, ‘Goldman Sachs says renewable-energy spending will surpass oil and gas for the first time ever in 2021 — and sees total investment spiking to $16 trillion over the next decade’, Markets Insider, 17 June 2020, available online at: https://markets-businessinsider-com.cdn.ampproject.org/c/s/markets.businessinsider.com/amp/news/renewable-energy-trillion-investment-opportunity-surpass-oil-first-time-goldman-2020-6-1029318482, accessed June 2020 xxxv Andrew Fawthrop, ‘Big Oil’s near-term clean energy spending plans fail to impress’, NS Energy, 5 June 2020, available online at: https://www.nsenergybusiness.com/features/renewables-spending-oil-companies/, accessed June 2020 xxxvi ‘Equinor buys Danske Commodities in shift to broad energy company’, Reutrers, 6 July 2018, available online at: https://www.reuters.com/article/equinor-energy/equinor-buys-danske-commodities-in-shift-to-broad-energy-company-idUSL8N1U216J#:~:text=Equinor%20buys%20Danske%20Commodities%20in%20shift%20to%20broad%20energy%20company,-3%20Min%20Read&text=OSLO%2C%20July%206%20(Reuters),)%2C%20it%20said%20on%20Friday, accessed June 2020. xxxvii Sarah George, ‘ How are big oil and gas firms approaching the low-carbon transition?’, edie, 1 April 2019, available online at: https://www.edie.net/news/6/Are-oil-and-gas-firms-helping-or-hindering-the-low-carbon-transition-/, accessed June 2020 xxxviii ‘Renewables: Total Enters Floating Offshore Wind with a First Project in the UK’, Press Release, Total , 20 March 2020, available online at: https://www.total.uk/renewables-total-enters-floating-offshore-wind-first-project-uk, accessed June 2020 xxxix David McPhee, ‘Eni and Mainstream Renewable Power join forces for UK offshore wind campaign’, Energy Voice, 25 September 2019, available online at: https://www.energyvoice.com/otherenergy/208472/eni-and-mainstream-renewable-power-join-forces-for-uk-offshore-wind-campaign/, accessed June 2020 xl James Murray, ‘How the six major oil companies have invested in renewable energy projects’, NS Energy, 16 January 2020, available online at: https://www.nsenergybusiness.com/features/oil-companies-renewable-energy/, accessed June 2020

19 ore.catapult.org.uk [email protected] @ORECatapult // @CatapultBlyth
|
xli Financing and investment trends - The European wind industry in 2018, Wind Europe, April 2019, available online at: https://windeurope.org/wp-content/uploads/files/about-wind/reports/Financing-and-Investment-Trends-2018.pdf, accessed June 2020. xlii ‘Oil Price Shock Hits Green Investments by Oil Majors’, BloombergNEF, 13 May 2020, available online at:
https://about.bnef.com/blog/oil-price-shock-hits-green-investments-by-oil-majors/, accessed June 2020