impact of precision agriculture - terry griffin - 5
TRANSCRIPT

The Profitability of Precision Ag in Times of Increased Financial Vulnerability
Terry Griffin, PhD, CCACropping Systems Economist
Department of Agricultural Economics
@SpacePlowboy#PrecisionAg #farmData
#EOCC17
Eastern Ontario Crop ConferenceKemptville, ON February 14, 2017

Farmer’s Use of Precision Ag
0
25
50
75
100
1995 1997 1999 2001 2003 2005 2007 2009 2011 2013 2015
Per
cent of
Far
ms
Automated Guidance Lightbar Automated Section Control Precision Soil Sampling
Yield Monitor Yield Monitor with GPS Variable Rate Fert. Variable Rate Seed
N=348

Proportion of Farms' Adoption of Precision
Probability of Adopting…
Given…
Soil
Sampling
VR
Fertility VR Seed
GPS Yield
Monitor
Automated
Guidance
Soil Sampling - 59% 30% 65% 87%
VR Fertility 92% - 37% 68% 92%
VR Seed 75% 60% - 86% 98%
GPS Yield Monitor 69% 46% 36% - 97%
Automated Guidance 55% 37% 24% 58% -
N=358

Adopting, upgrading, and abandoning
Number of Farms
%
abandonedTechnology adopt abandon upgrading
abandon
(adjusted)**
Yield Monitor 147 60 54 6 4
Lightbar 202 57 45 12 6
Precision Soil
Sampling149 6 NA 6 4
Variable Rate
Fertility94 3 NA 3 3
Yield Monitor
w/GPS142 2 NA 2 1
N=358

Tale of Two Technologies
Information-intensive
• Field level data to
make decisions
• Requires additional
data and skill
• IPM
Embodied-knowledge
• Information purchased
in the form of an input
• Requires minimal
additional data/skill
• Round-up Ready or Bt
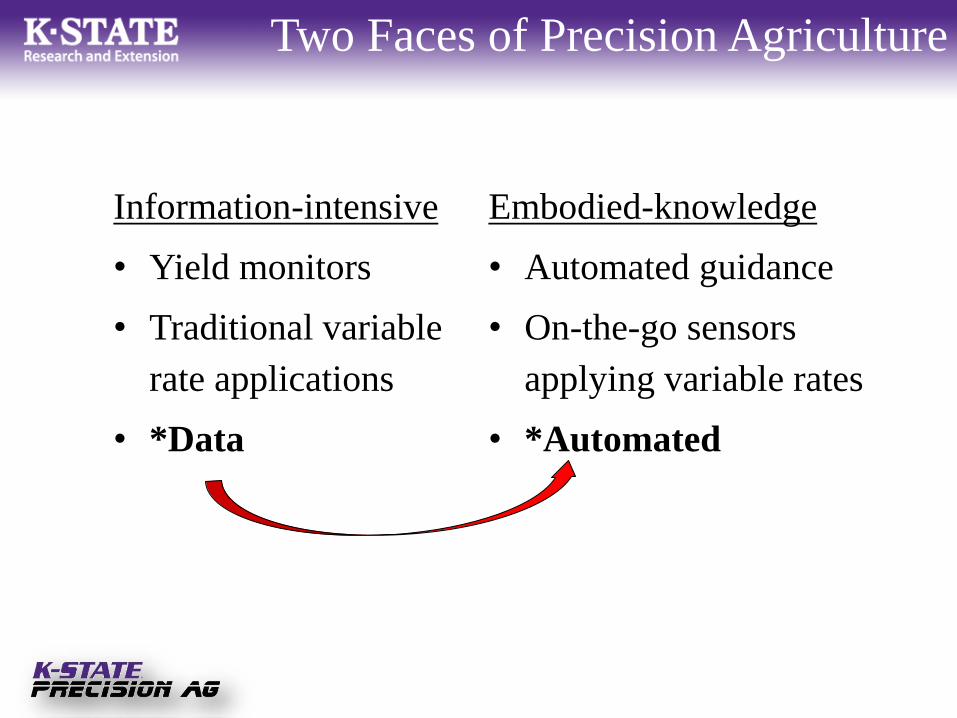
Two Faces of Precision Agriculture
Information-intensive
• Yield monitors
• Traditional variable
rate applications
• *Data
Embodied-knowledge
• Automated guidance
• On-the-go sensors
applying variable rates
• *Automated

Precision ag bundles
0%
20%
40%
60%
80%
100%
2000 2001 2002 2003 2004 2005 2006 2007 2008 2009 2010 2011 2012 2013 2014 2015 2016
% o
f U
sers
YM, PSS, & VR PSS & VR
YM & VR YM & PSS
Variable Rate (VR) Precision Soil Sampling (PSS)
Yield Monitor (YM) None

Probability of transitioning
none PSS
PSS
VR VR YM
YM
PSS
YM
PSS
VR
YM
VR
none 0.94 0.01 0.01 0.01 0.04 0.01 0.01 0.01
PSS 0.01 0.82 0.04 0 0 0.12 0.01 0
PSS VR 0.01 0 0.94 0 0 0 0.05 0
VR 0 0 0 0.53 0 0 0 0.47
YM 0.01 0 0 0 0.90 0.04 0.03 0.03
YM PSS 0 0 0.01 0 0.01 0.89 0.11 0
YM PSS VR 0 0 0 0 0 0.01 0.99 0.01
YM VR 0.12 0 0 0 0.01 0 0.10 0.77
YM = Yield monitor
VR = Variable rate
PSS = Precision soil sampling
Fro
m
To

Current precision ag utilization
• 20% use telematics in 2015
– Up from 15% in 2013
• Most common (72%) soil grid size = 2.5 ac
– Smaller grid sizes used only 13% of time
• 16% of service providers use UAVs
Erickson & Widmar, 2015

Profitability over time
34%
42%42%
40%36%
44% 44% 45%
44%
62%
35% 33% 39%
42%
34%
47% 50%
51%
60%
74%
41%
33%
43% 44% 45%
49%51%
58%63%
75%
26%27%
20%
30%
25% 25%22%
20%21%
20%18%
22%13%
21%19%
15%19%
26%
11%
14%
31%
37% 39%
38%
44%43% 43% 42%
51%
60%
0%
10%
20%
30%
40%
50%
60%
70%
80%
2003 2004 2005 2006 2007 2008 2009 2011 2013 2015
% o
f re
spondents
off
eri
ng p
recis
ion s
erv
ices
makin
g
a p
rofi
t
Soil Sampling
Single Variable Rate Application
Multi Variable Rate Application
Satellite Imagery
Yield Monitor Data Analysis
Total Precision Package
2015 Base: 261
Erickson & Widmar, 2015

Farm Data Quality & Value
• Yield monitor data is great, but…
– Sensor calibration crucial
– Yield cleaning necessary
– Data ≠ truth

USDA ARS Yield Editor
Raw data from combine yield monitor

Default cleaning algorithm

Advanced data cleaning algorithm

Unprocessed yield data

Filtered yield data

Farm Data Quality Litmus Test #1
Flow delay set correctly: not jagged edges. “field in focus”

Summary
• UAVs and drones
• Automated equipment
• Data and information technologies

Terry Griffin
Cropping Systems Economist
501.249.6360
@SpacePlowboy
Would love to hear from
you about your thoughts!