impact of quality inconsistency on brand loyalty … · · 2014-02-18marketing in a dynamic...
TRANSCRIPT

23rd CROMAR Congress, Congress Proceedings
Marketing in a Dynamic Envinronment – Academic and Practical Insights, 2013
491
IMPACT OF QUALITY INCONSISTENCY ON BRAND LOYALTY
Martina Ferenčić
Ana Wölfling
Scientific paper
Abstract Thanks to the fast spread of information via different digital media, today more than ever we are
able to witness quality inconsistencies in various products or services. Maintaining product
quality levels that consumers are expecting, or to be more precise, maintaining product quality
perception is one of key elements in brand loyalty building process. Consumers express their
loyalty by recurrently buying and consuming certain product brands and brand owners want to
keep their customers' trust. Sometimes when major quality inconsistency occurs in a product,
consumers may feel that their trust was betrayed and question their loyalty to that particular
branded product. In such a case, brand owners are faced with a difficult decision making process
which ultimately aims at regaining consumers' trust. Food, due to its direct impact on human
health, is particularly in the spotlight and consumers are more likely to remember negative
publicity or “affairs” related to specific food products or food brands. Food industry has
relatively thick dossier of different affairs, from GMO use, high levels of histamine or mercury
in tuna cans, to the latest problems with aflatoxin in milk from Croatian milk producers, or
products that have horse meat mixed with beef in what are supposed to be solely beef products.
This paper researches how quality inconsistency of food brands can affect brand loyalty.
Keywords Product quality, Brand perception, Brand loyalty, Crises brand management, Food
industry
1. WHAT DOES BRAND LOYALTY STAND FOR?
In the process of investigating how quality inconsistency of a certain branded product
can affect brand loyalty the first step is to define:
- What does brand loyalty stand for?
- Can we measure brand loyalty?
- How is product quality connected to brand loyalty?
1.1. Defining brand loyalty
Building and maintaining brand loyalty has always been one of central themes for
researches in marketing theory, as well as in practice. Simply described, loyalty to a
certain brand can be seen through repetition of purchases that a consumer is willing to
do for one or more product/services under the same brand. But brand loyalty has much
more layers than that. It is directly linked to consumer psychology so it has to be
described in more details. One of the definitions says: brand loyalty is a deeply held
commitment to rebuy or repatronize a preferred product/service consistently in the
future, there by causing repetitive same-brand or same brand-set purchasing, despite
situational influences and marketing efforts having the potential to cause switching
behaviour (Oliver, 1999, 34). Also, brand loyalty can be divided in two dimensions:
attitudinal and behavioural. Where the attitudinal brand loyalty includes cognitive and

23rd CROMAR Congress, Congress Proceedings
Marketing in a Dynamic Envinronment – Academic and Practical Insights, 2013
492
affective dimension and behavioural intent dimension is an intermediary between
attitude and behaviour, representing the intention to act in the buying decision process.
Behavioural intent appears in various forms such as a predisposition to buy a brand for
the first time or a commitment to repurchase a current brand. Conventional brand
loyalty development efforts have relied substantially on brand image building through
mass media communications, however in e-marketing process, database technology
makes it possible to put more emphasis on the cognitive dimension by offering
customized information (Gommans, Krishnan and Scheffold, 2001).
Generally speaking, loyalty implies satisfaction, but satisfaction does not necessarily
lead to loyalty. Consequently, there is an asymmetric relationship between loyalty and
satisfaction (Oliver, 1999). To show difference between satisfaction and loyalty we can
also refer to Kotler who explains that on the one side we have brands on the market that
are unknown to consumers and on the other side we have:
• brands with high level of brand awareness (measured with consumer remembering
or recognition),
• brands with high level of acceptance (which most consumers will not refuse to
buy),
• brands with high level of advantages (those which consumers will choose before
others in one store, but if they are not available they will just choose second best)
• and finally, brands with high level of loyalty (Kotler, 2001).
Brands with high level of advantages are satisfactory for consumers, but consumers are
really loyal to a brand when they are ready to take extra cost, time and effort (for
example drive to another store if necessary) to buy that specific brand.
From a consumer’s point of view, in the buying process one is faced with a multiple
choice of products that can satisfy his specific need and there is a possibility of making
bad purchasing choice. In other words, a consumer wants to reduce the risk of making a
mistake when choosing a product. One of the ways to reduce this risk is to buy the
specific branded product which was satisfactory in the past and the consumer had a
good experience with it and to become loyal to it. We can say that the greater the
perceived risk is, the more loyal the consumer is. Most loyal consumers strongly
believe that “their” brand of a product has significantly better characteristics then other
products (Kesić, 1999, 129).
The following have been identified as the most common benefits that brand owners can
get from brand loyalty (Moolla, 2010.):
• Higher sales volume
• Premium pricing ability
• Retain rather than seek – brand loyalist are willing to search for their favourite
brand and are less sensitive to competitive promotion (Moolla, 2010, 89)
• Creating perception – premium pricing creates the perception of premium quality
• Increased usage and spending
• Contributions to Return on Investment (ROI)
• Financial benefits
• Customer acquisition

Marketing in a Dynamic Envinronment
• Enhanced return
• Strategy for reducing ongoing expense
• Lower price elasticity
• Referrals
1.2. Brand loyalty measuring scope
Brand loyalty has a lot of layers an
have to see through all of its layers and investigate one by one.
Research agencies offer different tools which can help in brand management
measuring brand awareness,
distribution, etc. Information gathered in market and consumer research
combined with internal company data (like sales growth, gross margin
give brand managers a significant insight
Different researchers in past decades
brand loyalty from several point
came to life in practice.
measurement in FMCG
theoretical models for measuring brand loyalty proposed from differ
fifty years. He concludes:
well and possess merits
never select one model as the most significant.
Moolla has identified twenty six
and concluded that they
shown in figure 1.
Figure 1: Influences on
Source: adopted from Moolla (2010, 145)
23rd CROMAR Congress, Congress Proceedings
Marketing in a Dynamic Envinronment – Academic and Practical Insights, 2013
Strategy for reducing ongoing expense
Lower price elasticity
Brand loyalty measuring scope
Brand loyalty has a lot of layers and when we talk about measuring brand loyalty we
have to see through all of its layers and investigate one by one.
Research agencies offer different tools which can help in brand management
measuring brand awareness, buying willingness, price sensitivity, market shares, retail
stribution, etc. Information gathered in market and consumer research
combined with internal company data (like sales growth, gross margin growth
give brand managers a significant insight into their company’s brand.
in past decades were trying to give a unified model for measuring
brand loyalty from several points of view but none of these theoretical models really
tice. In preparations to propose his own model for brand loyalty
measurement in FMCG, Moolla listed and gave a short description of more than fifteen
theoretical models for measuring brand loyalty proposed from different authors in past
e concludes: Most brand loyalty models presented have been research
rits, although the differences between models are vast. One can
never select one model as the most significant. (Moolla, 2010, 137) Nevert
Moolla has identified twenty six influences on brand loyalty from previous concepts
d that they can be filtered to twelve influences relevant for FMCG as
Influences on Brand loyalty in FMCG
Source: adopted from Moolla (2010, 145)
493
brand loyalty we
Research agencies offer different tools which can help in brand management, like
, price sensitivity, market shares, retail
stribution, etc. Information gathered in market and consumer researches when
growth) can
ve a unified model for measuring
theoretical models really
model for brand loyalty
short description of more than fifteen
ent authors in past
been researched
the differences between models are vast. One can
Nevertheless,
influences on brand loyalty from previous concepts
influences relevant for FMCG as

23rd CROMAR Congress, Congress Proceedings
Marketing in a Dynamic Envinronment – Academic and Practical Insights, 2013
494
Moolla and Bisscoff put Moalla’s model for measuring brand loyalty in FMCG on the
test to prove if the model can be operationalized as managerial tool. They concluded it
can, but it should be subjected to further evaluation to ensure that the model measures
loyalty in a wide range of FMCG products similarly (Moolla and Bisscoff, 2012).
1.3. Connecting product quality and brand loyalty concept
The last question stated at the beginning of this paper regards the connection between
product quality and brand loyalty.
In its basic, simplified meaning, a brand is mostly perceived like a quality warranty
recognizable on the market (Vranešević, 2007). When talking about quality, the market
perceived quality needs to be taken in consideration regarding product’s ability to
(Vranešavić, Vignali and Vrontis, 2004, 239):
• be functional in it its basic purpose,
• liability to perform its basic purpose,
• be long-lasting and easy to maintain,
• be simple and safe to use
• be well designed and styled
• have good company reputation and brand image
• lead to total satisfaction during continuous use of the product.
If all of the seven above mentioned points are on satisfactory level for
customers/consumers, we can say that the perceived quality of the product is high.
In general, satisfaction can be defined as a feeling of comfort or disappointment that
comes from comparing expected and received values or performances of the product. If
performance is not on the expected level, the consumer is not satisfied; if it is, the
consumer is satisfied. And if the product performance is over the expected level, the
consumer is very satisfied or even overwhelmed (Kotler, 2001, 40).
Customer satisfaction is directly linked with brand loyalty building process and product
quality is a base for customer satisfaction. It is clearly obvious that in long term,
creating brand loyalty is not possible if the product quality is not on the expected level.
2. RESEARCH GOALS OF THE PAPER
Recently, consumers in Croatia ware frequently (or at least more than usual) faced with
different kinds of food products withdrawal from the market caused by different kinds
of quality mistakes. For example, Konzum’s private label Rial tuna cans had to be
removed from the market because of high level of histamine and the latest and the
biggest food affair occurred when in short period of time even three milk producers
(Dukat, Vindija and Meggle) had to withdraw several production series of their milk
due to containing high level of aflatoxin. All of these quality inconsistencies of the
mentioned food products affect their consumers. Consumers can be afraid that those

23rd CROMAR Congress, Congress Proceedings
Marketing in a Dynamic Envinronment – Academic and Practical Insights, 2013
495
products may seriously affect their health. Food is directly connected to human health,
so those fears are understandable and normal.
Food industry is one of the most important pillars of Croatian economy (largest
industry in terms of sales values according to Statistical Yearbook of the Republic of
Croatia for 2012 (Croatian Bureau of Statistics, 2012)) and managing product quality in
this sector, the image of its brands and building loyalty is a very important issue for
Croatian economy in total, especially now when Croatia is entering the European
Union. Croatian market will represent just a small part of total EU market where big
multinational companies like Unilever or Kraft are leaders among branded products
and big international retail chains like Tesco or Aucan dominate the private label
segment.
The first chapter describes brand loyalty and what affects brand loyalty. Based on
previous researches we can conclude that customer satisfaction directly affects brand
loyalty. We can also conclude that customer satisfaction is based on perceived product
quality. Research goal of this paper is to find out how problems with quality
inconsistency in food products can affect customer satisfaction and if ultimately they
have a negative impact on food brands loyalty in the long run.
3. RESEARCH METHODOLOGY
Empirical research Impacts of quality inconsistency on customer satisfaction of food
brands in Croatia was conducted on the sample of Coolinarika.com users.
Coolinarika.com is in top ten Croatian web portals with the reach of 22.34%,or more
than 0.5 million visitors on a monthly base (geminusAudince.com.hr, 2013) and with
more than 97.000 registered users (Coolinarika.com, 2013).Coolinarika.com is
considered leading cooking web site, not only in Croatia, but also in the region of
South Eastern Europe, for all food and cooking related topics as well as for exchanging
and sharing recipes. The most important thing when constructing a research sample of
users of Coolinarika.com is that these users are considered opinion makers in segment
of food related topics so we can say that they can be also considered the relevant
sample for the research.
Questionnaire for the research was constructed, besides from opening demographic
questions, from series of closed-ended(some with multiple choice) and open-ended
questions. Questions were positioned in a specific order to lead the participants
gradually from more general questions about their food shopping process to more
specific ones about how they experience the problems with quality of the food products
of their choice.
Data collecting process was organized by sending invitations to 5.123 randomly
selected Coolinarika.com users from Croatia to take part in the survey and answer the
listed questions with a goal to collect a minimum of 500 filled questionnaires.
The collected data was processed with the Statistical Package for the Social Sciences or
SPSS software.
23rd CROMAR Congress, Congress Proceedings
Marketing in a Dynamic Envinronment – Academic and Practical Insights, 2013
496
4. INTERPRETATION OF THE RESULTS
4.1. Sample characteristics
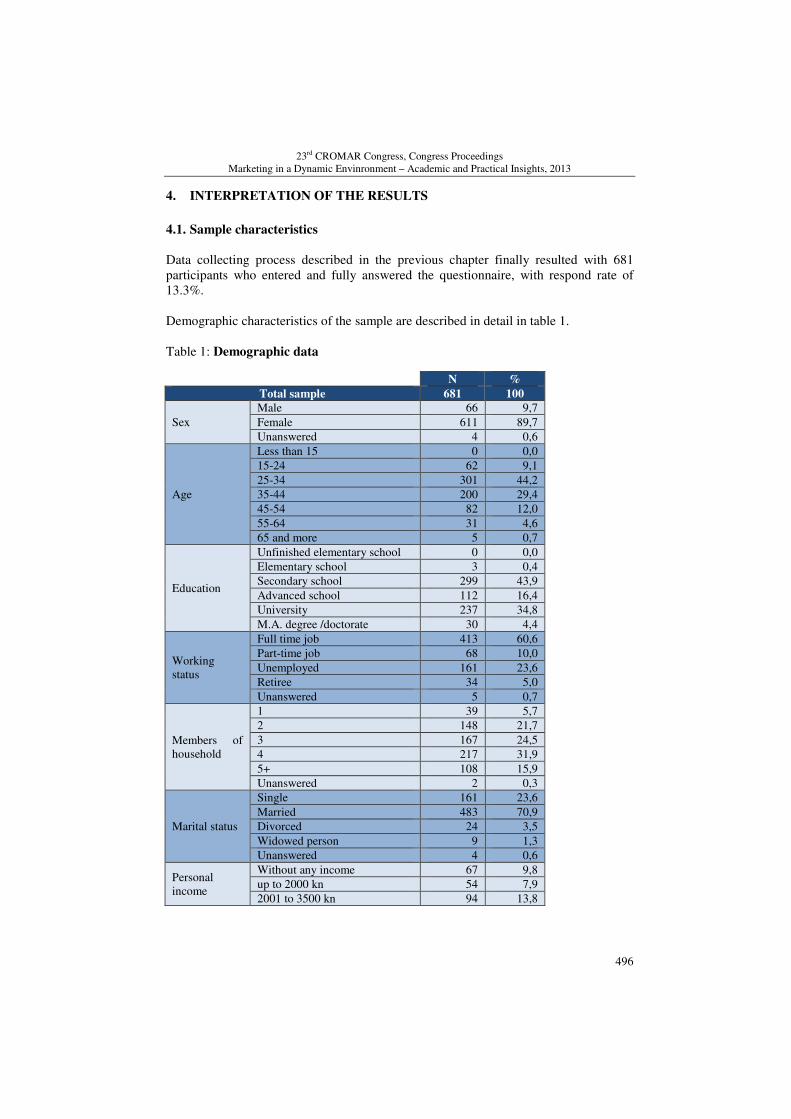
Data collecting process described in the previous chapter finally resulted with 681
participants who entered and fully answered the questionnaire, with respond rate of
13.3%.
Demographic characteristics of the sample are described in detail in table 1.
Table 1: Demographic data
N %
Total sample 681 100
Sex
Male 66 9,7
Female 611 89,7
Unanswered 4 0,6
Age
Less than 15 0 0,0
15-24 62 9,1
25-34 301 44,2
35-44 200 29,4
45-54 82 12,0
55-64 31 4,6
65 and more 5 0,7
Education
Unfinished elementary school 0 0,0
Elementary school 3 0,4
Secondary school 299 43,9
Advanced school 112 16,4
University 237 34,8
M.A. degree /doctorate 30 4,4
Working
status
Full time job 413 60,6
Part-time job 68 10,0
Unemployed 161 23,6
Retiree 34 5,0
Unanswered 5 0,7
Members of
household
1 39 5,7
2 148 21,7
3 167 24,5
4 217 31,9
5+ 108 15,9
Unanswered 2 0,3
Marital status
Single 161 23,6
Married 483 70,9
Divorced 24 3,5
Widowed person 9 1,3
Unanswered 4 0,6
Personal
income
Without any income 67 9,8
up to 2000 kn 54 7,9
2001 to 3500 kn 94 13,8

23rd CROMAR Congress, Congress Proceedings
Marketing in a Dynamic Envinronment – Academic and Practical Insights, 2013
497
N %
Total sample 681 100
Personal
income
3501 to 6000 kn 235 34,5
6001 to 8500 kn 73 10,7
up to 8500 kn 54 7,9
I do not want to answer 104 15,3
Settlement
size
up to 2000 citizens 73 10,7
2000 to 10000 citizens 152 22,3
10000 do 100000 citizens 202 29,7
more than 100000 citizens 254 37,3
4.2. Major findings
The majority of the research participants (65%) says that they equally buy food
products branded with producers owned brands and from retailers owned brands
(private labels). Others buy solely producers’ brands (30%), or solely private labels
(5%).
Research also shows that there are some differences between different food categories
in preferring producers’ brands or private labels, for example categories in which
producers’ brands are preferred are milk and dairy products, meet products, coffee and
tea, products for cake baking, spices; and categories in which private labels are
preferred are snack, pasta and rice, chocolate and cookies, tomato products, flour.
An interesting finding in those data is the fact that two categories with the least chance
to be preferred as a private label are baby food and honey; only 23 respondents said
that they prefer private label when choosing baby food and only 26 when choosing
honey. Table 2 shows preferences in choosing brands or private labels by category.
Table 2: Top five categories for producers’ brands vs. top five categories for
private labels (multiple choice answers)
Top five categories where consumers
prefer producers’ brand over PL
Top five categories where consumers prefer
PL over producers’ brand
Food category
Respond
frequency
(sample 681)
Food category
Respond
frequency
(sample 681)
Milk and dairy 475 Snack (chips, flips etc.) 361
Meet and meet products 458 Pasta, rice 307
Coffee and tea 405 Chocolate, cookies 266
Cake baking products 370 Tomato products 248
Spices 343 Flour 239
To the question “Is there a particular brand among the food products to which you are
totally loyal?” 80% of participants said YES. Research participants named 154
different brands from the top of their mind. Table 3shows sixteen of them with highest
response frequency.

Marketing in a Dynamic Envinronment
Table 3: Food brands that
Brand Frequency
Podravka
Vindija
Ledo
Kraš
Vegeta
Franck
Dukat
Gavrilović
An interesting observation
the listed brands to whom consumers are totally loyal are only
Croatian origin and that the first of them
only one vote more than Zvijezda.
Figure 2: Reasons for being loyal to food brands
(multiple choice answers
23rd CROMAR Congress, Congress Proceedings
Marketing in a Dynamic Envinronment – Academic and Practical Insights, 2013
Food brands that have totally loyal consumers (N=681)
Frequency % Brand Frequency %
304 20,3 Barilla 36
107 7,1 Zvijezda 35
98 6,5 Pik 33
85 5,7 Nescafe 21
81 5,4 Jamnica 18
63 4,2 Nutella 18
56 3,7 Z begot 15
48 3,2 Dr.Oetker 15
nteresting observation that can be drown from the results in table 2 is that among
the listed brands to whom consumers are totally loyal are only three that do not
Croatian origin and that the first of them, Barilla is barely on the ninth position with
only one vote more than Zvijezda.
Reasons for being loyal to food brands
(multiple choice answers, N=681)
498
%
2,4
2,3
2,2
1,4
1,2
1,2
1,0
1,0
the results in table 2 is that among
do not have
ninth position with

Marketing in a Dynamic Envinronment
When asked why they are loyal to the
reasons(frequency in answers above 400) participants single out: 1) positive brand
experience, 2) high, stabile
of reasons with still significantly high freq
answers) are: it meets all of my expectations, it is available in most stores, it has the
best quality vs. price ratio, purchasing habits; as shown in figure 2.
Figure 2 also shows that c
design, long-term presence in the market, innovation
which in Marketing theory are believed to be basics for marketing strategy and brand
building processes, are not significant reasons for the
loyal to their brand of choice
The factors (and their relevance) that can a
shown in figure 3.
Figure 3: Reasons for reduction of brand loyalty
(multiple choice answers
The main factor in brand loyalty reduction is connected
coverage in the market. The second and third reasons are connected with the product
quality problems (noticed lacks during last consumption of the product, specific
production series of the product was withdrawn from the market), both with
significantly high frequency in responses.
connected to price and promoti
23rd CROMAR Congress, Congress Proceedings
Marketing in a Dynamic Envinronment – Academic and Practical Insights, 2013
When asked why they are loyal to the particular brand, as the main group of
(frequency in answers above 400) participants single out: 1) positive brand
experience, 2) high, stabile product quality and 3) recognizable taste. The second group
of reasons with still significantly high frequency in answers (between 150 and 400
answers) are: it meets all of my expectations, it is available in most stores, it has the
best quality vs. price ratio, purchasing habits; as shown in figure 2.
Figure 2 also shows that characteristics like manufacturing tradition, top packaging
term presence in the market, innovation or positive image in
which in Marketing theory are believed to be basics for marketing strategy and brand
building processes, are not significant reasons for the research participants for being
choice (frequency in answers less than 150).
(and their relevance) that can affect the reduction of brand loyalty are
Reasons for reduction of brand loyalty
(multiple choice answers, N=681)
The main factor in brand loyalty reduction is connected with product distribution
coverage in the market. The second and third reasons are connected with the product
problems (noticed lacks during last consumption of the product, specific
production series of the product was withdrawn from the market), both with
significantly high frequency in responses. The following reasons are the ones
connected to price and promotional activities, which are not in focus of this research.
499
particular brand, as the main group of
(frequency in answers above 400) participants single out: 1) positive brand
taste. The second group
uency in answers (between 150 and 400
answers) are: it meets all of my expectations, it is available in most stores, it has the
ing tradition, top packaging
positive image in the public,
which in Marketing theory are believed to be basics for marketing strategy and brand
research participants for being
reduction of brand loyalty are
with product distribution
coverage in the market. The second and third reasons are connected with the product
problems (noticed lacks during last consumption of the product, specific
production series of the product was withdrawn from the market), both with
The following reasons are the ones
onal activities, which are not in focus of this research.

Marketing in a Dynamic Envinronment
Research participants were also asked to define
product with low or pour qua
Figure 4: What is a product with low or pour q
(multiple choice answers
Other than organoleptic characteristics (taste, smell, visual appearance) which are for
obvious reasons the most important characteristics in terms of food, research
participants are mainly concerned about pr
health if it contains some substances that are not allowed in food products or they are
over permitted limits). At the end, they also pay attention
labelling but those factors are not of
Research participants (66%) can name products that have been recently withdrawn
from the market. Milk
Table 4: Products withdrawn from the market (N=672)
Product
Milk
Tuna, canned fish
Baby food
Crust, dough, strudel pastry
Meet, meet products
All other answers
Following to naming products that have been withdrawn from the market
participants can also
brands, Dukat, Vindija (Z bregov) and Meggle
answers. K plus, Rial and Konzum
connected to secondly
23rd CROMAR Congress, Congress Proceedings
Marketing in a Dynamic Envinronment – Academic and Practical Insights, 2013
Research participants were also asked to define what (from their point of view) a
product with low or pour quality is; answers are shown in figure 4.
What is a product with low or pour quality?
(multiple choice answers, N=681)
Other than organoleptic characteristics (taste, smell, visual appearance) which are for
obvious reasons the most important characteristics in terms of food, research
participants are mainly concerned about product safety (can some product a
contains some substances that are not allowed in food products or they are
. At the end, they also pay attention to product packaging and
labelling but those factors are not of top concern.
Research participants (66%) can name products that have been recently withdrawn
ilk stands out from the list with high frequency in answers (47%).
Products withdrawn from the market (N=672)
Product Frequency %
318 47
133 20
81 12
Crust, dough, strudel pastry 45 7
25 4
70 10
Following to naming products that have been withdrawn from the market
also name the specific brands involved in withdrawal. Th
Dukat, Vindija (Z bregov) and Meggle, have the highest percentages in
. K plus, Rial and Konzum are also high on the list in table 5, which can be
named products from table 4(tuna/canned fish).
500
(from their point of view) a
Other than organoleptic characteristics (taste, smell, visual appearance) which are for
obvious reasons the most important characteristics in terms of food, research
oduct safety (can some product affect their
contains some substances that are not allowed in food products or they are
product packaging and
Research participants (66%) can name products that have been recently withdrawn
from the list with high frequency in answers (47%).
Following to naming products that have been withdrawn from the market, research
Three milk
, have the highest percentages in
which can be

23rd CROMAR Congress, Congress Proceedings
Marketing in a Dynamic Envinronment – Academic and Practical Insights, 2013
501
Table 5: Brands withdrawn from the market (N=715)
Brand Frequency %
Dukat 232 32
Vindija (Z bregov) 180 25
K plus 62 9
Meggle 56 8
Clarum 32 5
Rial 23 3
Hipp 19 2
Konzum 14 2
Alnatura 12 2
Nestle 8 1
Dm 8 1
All other answers 69 10
53% of research participants stated that they remembered exactly what the reason for
market withdrawal had been.
If we take a look at table 6 we can also notice that research participants can (63%),
with relatively high accuracy, name the quality inconsistency or the quality defect of
the product they name as a product that was withdrawn from the market.
Table 6: Quality defect that was the reason for market withdrawal of food
products (N=427)
Quality defect that was reason for market withdrawal Frequency %
Too high level of aflatoxin 157 37
Product contains unauthorized substances 40 9
To high level of some substances 37 9
Histamine 32 8
Harmful substances 24 6
Pieces of glass in baby food jars 22 5
Unauthorized preservative / additives 17 4
Too much of something 14 3
Some poison 11 3
Bacteria 10 2
Presence of metal / mercury / lead 10 2
Carcinogenic ingredients 8 2
Products are not safe for health 8 2
GMO ingredients 7 2
All other answers 30 7
Marketing in a Dynamic Envinronment
From the results in answers
we can identify the following
than a year before the research was conducted according to Croatian Ministry of
Agriculture through Croatian Rapid Alert System for Food and Feed (HR RASFF)
1. In February 2013 there
different producers or brands: Dukat and
Meggle, Mercator and
the listed cases was increased level of aflatoxin.
2. Also in February there was a notice about tuna can withdrawal under brand name
Rial that is a private label of
an increased level of histamine.
3. In March the Ministry issued
distributed by retail chain DM.
of glass pieces in the content of the product
4. Last year, in October 2012
producer Clarum was issued.
additive in product content. (Ministry of Agriculture, 2013)
Those four cases can be easily recognized within the answers gathered
research since most of the participants described them very accurately.
The participants were also asked what they
the decision for market withdrawal and answers are illustrated in
Figure 5: Opinions about the producer that made the decision for
withdrawal (N=681)
More than one third or 38% have
undertaken the measures of withdrawing
cannot understand why a
market.
Table 7 shows how market withdrawal
the following purchase of this kind of product.
23rd CROMAR Congress, Congress Proceedings
Marketing in a Dynamic Envinronment – Academic and Practical Insights, 2013
From the results in answers to questions about product type, brand and quality defect
the following cases of product withdrawal that had happened in less
than a year before the research was conducted according to Croatian Ministry of
Croatian Rapid Alert System for Food and Feed (HR RASFF)
In February 2013 there were several notices about milk product withdrawal
rent producers or brands: Dukat and Vindija – on 8th
February, Dukat,
Meggle, Mercator and Lidl – on 19th
Ferbruary. The reason for withdrawal in all of
the listed cases was increased level of aflatoxin. (Ministry of Agriculture, 2013)
Also in February there was a notice about tuna can withdrawal under brand name
private label of Konzum retail chain. The reason for withdrawal was
level of histamine. (Ministry of Agriculture, 2013)
In March the Ministry issued a notice for baby food in jar from Alnatura
distributed by retail chain DM. The reason for withdrawal was possible
of glass pieces in the content of the product. (Ministry of Agriculture, 2013)
in October 2012 a notice for withdrawal of fresh strudel dough
producer Clarum was issued. The reason for withdrawal was usage of unauthorized
dditive in product content. (Ministry of Agriculture, 2013)
Those four cases can be easily recognized within the answers gathered through the
most of the participants described them very accurately.
articipants were also asked what they thought about the producer that
the decision for market withdrawal and answers are illustrated in figure5.
Opinions about the producer that made the decision for product
withdrawal (N=681)
More than one third or 38% have a negative opinion about producers that have
undertaken the measures of withdrawing a product from food market, because they
why a product with some quality problems is even available
ow market withdrawal will influence the decision making process in
the following purchase of this kind of product.
502
quality defect
happened in less
than a year before the research was conducted according to Croatian Ministry of
Croatian Rapid Alert System for Food and Feed (HR RASFF):
milk product withdrawal from
February, Dukat,
eason for withdrawal in all of
(Ministry of Agriculture, 2013)
Also in February there was a notice about tuna can withdrawal under brand name
eason for withdrawal was
notice for baby food in jar from Alnatura
ble presence
. (Ministry of Agriculture, 2013)
notice for withdrawal of fresh strudel dough from the
eason for withdrawal was usage of unauthorized
through the
about the producer that had made
product
negative opinion about producers that have
m food market, because they
available on the
the decision making process in

23rd CROMAR Congress, Congress Proceedings
Marketing in a Dynamic Envinronment – Academic and Practical Insights, 2013
503
Table 7: Future decision making process for the products that were withdrawn
from the food market (N=681)
Frequency %
I would proceed to buy the same product from my favourite brand –
no influence 40 6
I would temporarily stop buying the product from my favourite brand
but as soon as I were certain that the inconsistency or defect were
removed, I would return to my normal shopping behaviour–
temporary influence
420 62
I would permanently stop buying the product from my favourite
brand – significant influence 63 9
I would start buying the same product from different brand 135 20
I would stop buying this sort of product entirely 23 3
Producers or brand owners might find comfort in the fact that 62% of their loyal
consumers would gradually come back to buying their product after a short brake or
after the market withdrawal was finished. But they should also be aware of the fact that
more than 20% of consumers, according to these research findings, can be lost.
If we take a closer look at the collected data and we further look into the difference in
answers between the participants that stated they were loyal to a certain brand (80%),
with their attitude (positive, negative or neutral) towards brand owners decision about
product withdrawal (shown in the figure 5) and its influence to further decision making
process of purchasing products that have been withdrawn from the market (shown in
table 7), we can see that there is no noticeable difference in stating the negative opinion
between the research participants who said they were loyal to some brand and those
who said they were not.
Table 8: Difference in opinions and purchasing decision making process between
loyal and disloyal consumers (N=681)
Future decision making process for the products that
were withdrawn from the food market
Total
freq.
No
influence
Temporary
influence
Significant
influence
Would
buy
another
brand
Would
stop
buying the
product in
total
Opinions about the
producer that made the
decision for product
withdrawal
Loyal Positive 20 115 11 21 3 170
Negative 6 113 28 55 6 208
Neutral 5 117 12 29 4 167
Total freq. 31 345 51 105 13 545
Not loyal Positive 3 27 4 9 0 43
Negative 2 25 6 9 7 49
Neutral 4 23 2 12 3 44
Total freq. 9 75 12 30 10 136
Total
freq.
Positive 23 142 15 30 3 213
Negative 8 138 34 64 13 257
Neutral 9 140 14 41 7 211

23rd CROMAR Congress, Congress Proceedings
Marketing in a Dynamic Envinronment – Academic and Practical Insights, 2013
504
Future decision making process for the products that
were withdrawn from the food market
Total
freq.
No
influence
Temporary
influence
Significant
influence
Would
buy
another
brand
Would
stop
buying the
product in
total
Opinions about the
producer that made the
decision for product
withdrawal
Loyal Positive 20 115 11 21 3 170
Negative 6 113 28 55 6 208
Neutral 5 117 12 29 4 167
Total freq. 31 345 51 105 13 545
Not loyal Positive 3 27 4 9 0 43
Negative 2 25 6 9 7 49
Neutral 4 23 2 12 3 44
Total freq. 9 75 12 30 10 136
Total
freq.
Positive 23 142 15 30 3 213
Negative 8 138 34 64 13 257
Neutral 9 140 14 41 7 211
Total freq. 40 420 63 135 23 681
From table 8 we can also see that, although product market withdrawal has temporarily
influence with most of the research participants, the research participants who said they
were loyal to some brand and had a negative opinion of market withdrawal of their
brand will be the most likely candidates for changing their purchasing habits and
switching to another brand.
If we extract the data for the example of milk withdrawal (research participants that
named Dukat, Vindija and Meggle as the example of a product withdrawal), we can see
consistency in the previously shown data, see table 9.
Table 9: Difference in opinions and purchasing decision making process between
loyal and disloyal consumers of milk (N=266)
Future decision making process for the milk products that
were withdrawn from the market
Total
freq.
No
influence
Temporary
influence
Significant
influence
Would
buy
another
brand
Would stop
buying the
product in
total
Opinions about the milk
producer that made the
decision for product
withdrawal
Loyal Positive 5 44 3 8 2 62
Negative 2 44 13 21 2 82
Neutral 0 53 6 13 2 74
Total freq. 7 141 22 42 6 218
Not loyal Positive 0 12 1 4 0 17
Negative 1 6 1 4 2 14
Neutral 1 11 1 3 1 17
Total freq. 2 29 3 11 3 48
Total freq. Positive 5 56 4 12 2 79
Negative 3 50 14 25 4 96
Neutral 1 64 7 16 3 91
Total freq. 9 170 25 53 9 266

23rd CROMAR Congress, Congress Proceedings
Marketing in a Dynamic Envinronment – Academic and Practical Insights, 2013
505
5. CONCLUSION
Today's consumers are very sophisticated and aware of the importance of product
quality as one of the main factors in building brand loyalty. For years, branded
products in FMCG became a synonym for higher level of quality and consumers have
higher expectations, than for example, from private labels or unknown products.
Previous researches show that perceived quality is closely related to product's ability to
satisfy certain consumer needs or expectations like to be functional in its basic purpose,
to be liable to perform its basic purpose, to be long-lasting and easy to maintain, to be
simple and safe to use, to be well designed and styled, to have good company
reputation and brand image and to lead to total satisfaction during continuous using of
the product, even above the expected level. Also, premium level of price positioning
has an influence on the perception of product quality as a higher one.
The main goal of this work was to confirm product quality as one of the most important
factors in brand loyalty process and to investigate if and how quality inconsistency of a
product influences brand loyalty. The research which was conducted to prove and
explain the connection between product quality and brand loyalty shows that the main
reasons for being loyal to certain brand or product are related mostly to positive brand
experience, high, stabile product quality and recognizable taste.
When it comes to product quality issue, consumers emphasised disadvantages like
unusal taste, smell and visual appearance. Also, they mentioned doubtful product safety
and unreliable product packaging and labelling.
One of the most interesting findings was that more than a half of the research
participants could name products, categories and brands that have been recently
withdrawn from Croatian market becuse of a quality problem. It is important to notice
that 63% of research participants could, with relatively high accuracy, clearly indicate
the quality inconsistency or the quality defect of the product they specified as a product
that was withdrawn from the market.
This research showed that withdrawal from the market has a huge negative impact on
buying willingnessin execution phase and a certain period after it. Despite that fact,
producers or brand owners might be calm because 62% of their loyal consumers would
gradually come back to their favourite brand or product after they were sure that
inconsistency or defect had been totally removed. But also they must be aware that
there is a huge risk of loosing a certain percentage of loyal consumers who could not
find an excuse for such failure.
According to above mentioned, customer/consumer satisfaction as a factor in food
brand loyalty process, in the long term depends on product quality issue. Food brand
owners should manage every product quality inconsistency with great care and through
total quality management prevent or minimize possibilities for future quality issues.

23rd CROMAR Congress, Congress Proceedings
Marketing in a Dynamic Envinronment – Academic and Practical Insights, 2013
506
REFERENCES
Coolinarika.com (2013), [Internet], Available at: http://www.coolinarika.com/ [accessed on 06.05.2013].
GeminusAudince – the most reliable source of knowledge about the Internet and its users (2013), [Internet],
Available at: http://www.audience.com.hr/ [accessed on 06.05.2013].
Gommans, M, Krishnan, K, S. and Scheffold, K, B. (2001), “From Brand Loyalty to E-Loyalty: A
Conceptual Framework”, Journal of Economic and Social Research, Vol. 3, No. 1, pp. 43-58.
Kesić, T. (1999), Ponašanje potrošača, Adeco, Zagreb.
Kotler, P. (2001), Upravljanje marketingom: analiza, planiranje, primjena i kontrola, Mate, Zagreb.
Ministry of agriculture (2012),“HR RASFF – obavijest za potrošače – “Svježe vučena tijesta – listovi za pite
i savijače”, svih oznaka rokova trajanja između 01.10.2012. i 01.12.2012. godine, proizvođača
Clarum d.o.o.”[Internet], Available at: http://www.mps.hr/default.aspx?id=8901 [accessed on
09.06.2013].
Ministry of agriculture (2013), “HR RASFF – obavijest za potrošače – Povlačenje i opoziv proizvoda dječja
kašica”[Internet], Available at:
http://www.mps.hr/default.aspx?id=9193 [accessed on 09.06.2013].
Ministry of agriculture (2013), “Sustav brzog uzbunjivanja za hranu i hranu za životinje HR RASFF –
obavijest za potrošače” [Internet], Available at: http://www.mps.hr/default.aspx?id=9125
[accessed on 09.06.2013].
Ministry of agriculture (2013), “HR RASFF – obavijest za potrošače – Povlačenje i opoziv proizvoda: RIAL
– tuna komadi u salamuri” [Internet], Available at: http://www.mps.hr/default.aspx?id=9113
[accessed on 09.06.2013].
Ministry of agriculture (2013), “HR RASFF – obavijest za potrošače – Povlačenje mlijeka s tržišta u svrhu
prevencije i zaštite potrošača” [Internet], Available at: http://www.mps.hr/default.aspx?id=9112
[accessed on 09.06.2013].
Moolla, A. I. and Bisscoff, C. A. (2012), “Empirical Evaluation of a Model That Measures the Brand Loyalty
for Fast Moving Consumer Goods”, Journal of Social Science, Vol. 32, No. 3, pp. 341-355.
Moolla, A. I. (2010), A conceptual frame work to measure brand loyalty, Thesis for Ph.D, North-West
University, Potchedstroom.
Oliver, R. L. (1999), “Whence Consumer Loyalty“, Journal of Marketing, Vol. 63, Special Issue, pp. 33-44.
Ostroški, Lj. (editor), (2012), Statistički ljetopis Republike Hrvatske – Statistical Yearbook of the Republic
of Croatia 2012, Državni zavod za statistiku Republike Hrvatske, Zagreb.
Vranešević, T. (2007), Upravljanje markama (Brand management), Accent, Zagreb.
Vranešević, T, Vignali C. and Vrontis, D. (2004), Upravljanje strateškim marketingom, Accent, Zagreb.
Martina Ferenčić Podravka d.d.
A. Starčevića 32, 48000 Koprivnica, Croatia
Phone: ++385 99 665 1696
E-mail: [email protected]
Ana Wölfling
Podravka d.d.
A. Starčevića 32, Koprivnica, Croatia
Phone: ++385 99 665 1174
E-mail: [email protected]