impact of rhu-epo supplementation on crf induced ... · erythropoietin (epo) epo - glycoprotein...
TRANSCRIPT
Impact of rHu-Epo supplementation on CRF
induced Neurobehavioral changes in rats: Studies on
correlation with APP ratio, β amyloid and pTau
expression
Dr.P.Venkataraman, MSc, MPhil, PhD.
Department of Medical Research
&
Mr. N.Karthick, MSc.
Department of Physiology
SRM Medical College Hospital and Research Centre
SRM University, INDIA

Regulators for many of the body’s functions and control complex processes and
maintain homeostasis
Receive 20 to 25% of cardiac output/ min; Blood is filtered through the nephrons

Broscious and Castagnola, 2006

CHRONIC RENAL FAILURE (CRF)
CKD - major clinical health problem as it is a systemic disorder
that causes widespread organ damage and is related to
significant morbidity and mortality (Ryuji ikeda et al., 2010)
With a prevalence of 15% in developed nations (Krishnan &
Kiernan, 2009).
CKD - can occur as a result of a primary renal disorder or as a
complication of multisystem disease (Krishnan & Kiernan,
2009).
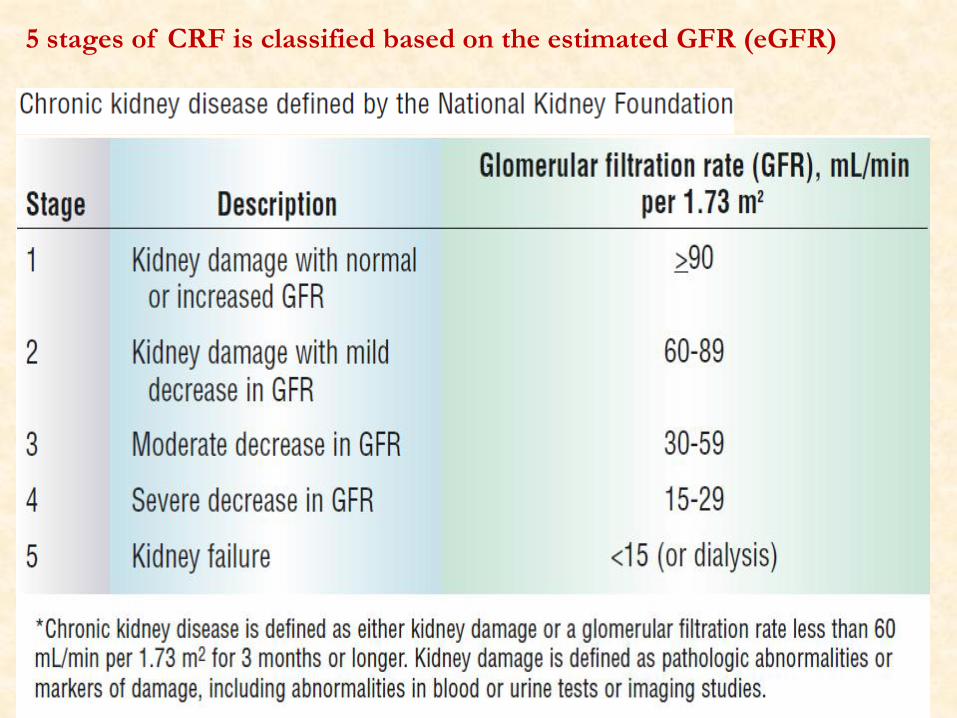
5 stages of CRF is classified based on the estimated GFR (eGFR)

Manifestations of kidney failure
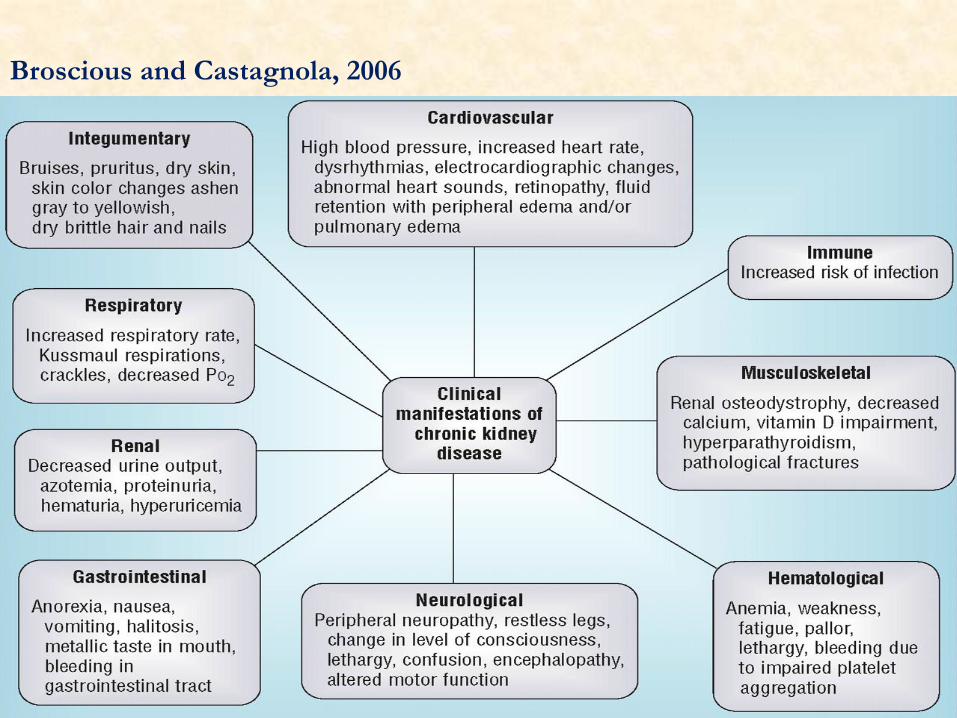
Broscious and Castagnola, 2006
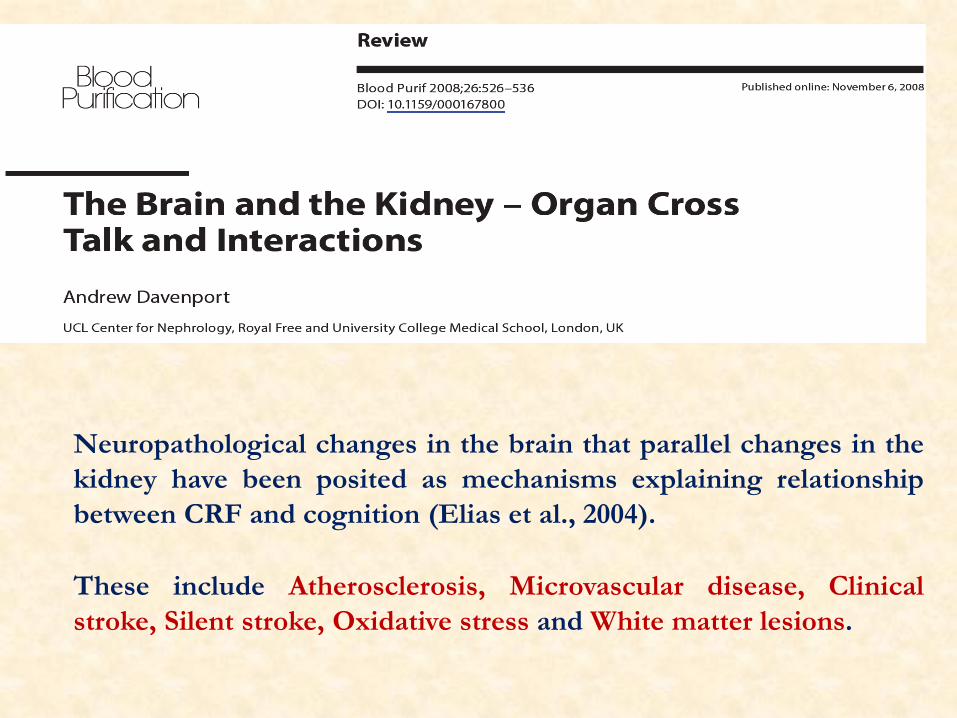
Neuropathological changes in the brain that parallel changes in the
kidney have been posited as mechanisms explaining relationship
between CRF and cognition (Elias et al., 2004).
These include Atherosclerosis, Microvascular disease, Clinical
stroke, Silent stroke, Oxidative stress and White matter lesions.

In a study of homebound elderly individuals, Albuminuria was
associated with lower levels of executive function ability and with
white matter hyper intensities and white matter volume (Weiner et
al., 2008)
Uremic toxins and Neurological diseases
Accumulation of Urea, Creatinine, PTH, Myoinositol, β2 microglobulin
Middle molecules (MW 300 -12,000 Kda)
Hyperkalemia
Electrolytes disturbances (hypercalcemia, hypophosphatemia,
hyponatremia)
Hyperparathyroidism, Affected Intermediary Metabolism
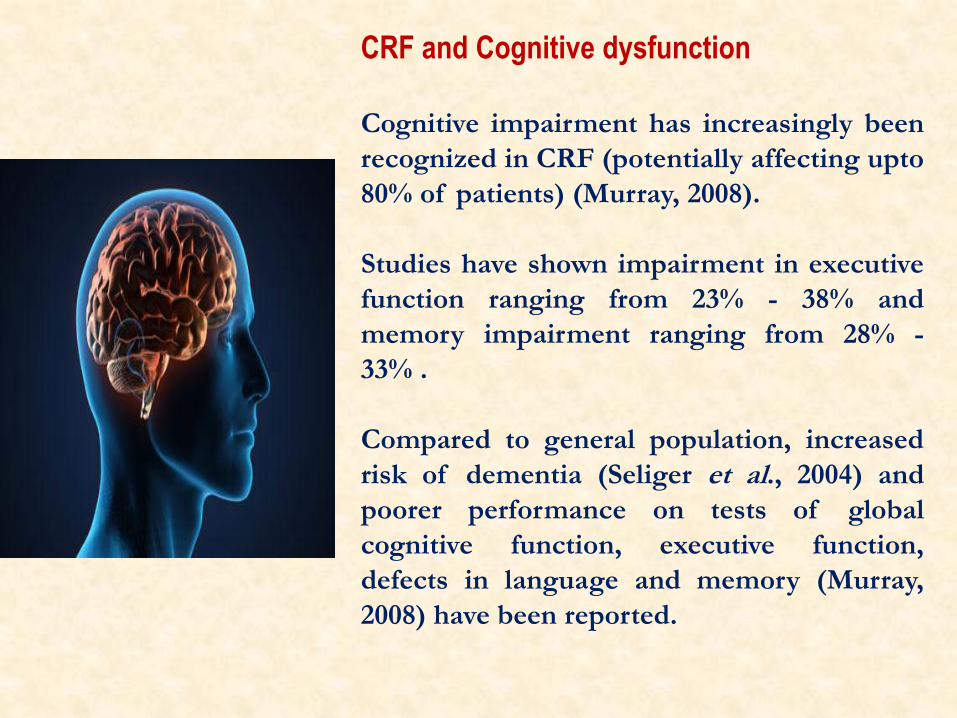
CRF and Cognitive dysfunction
Cognitive impairment has increasingly been
recognized in CRF (potentially affecting upto
80% of patients) (Murray, 2008).
Studies have shown impairment in executive
function ranging from 23% - 38% and
memory impairment ranging from 28% -
33% .
Compared to general population, increased
risk of dementia (Seliger et al., 2004) and
poorer performance on tests of global
cognitive function, executive function,
defects in language and memory (Murray,
2008) have been reported.

Neurological complications
of CKD:
Cognitive dysfunction
Stroke
Restless leg syndrome
Peripheral and autonomic
neuropathy
Carpal tunnel syndrome
Uremic Myopathy (Krishnan &
Kiernan, 2009)

Effects of Renal Transplantation
Girva et al. (2006) gave clear evidence that cognitive function
improves following renal transplantation.
Kramer et al. (2006), demonstrated improvement in both
neuropsychological tests, (MMSE) and neurophysiological
markers of cognitive function, as measured using evoked
potential latencies and EEG rhythms.
Amyloid precursor protein (APP) and β amyloid (Aβ)
Dementia is a primary neurodegenerative disorder and it leads
to a complete psychological and physical dependency and
finally to death within one to two decades.
It involves aberrant protein processing and is characterized by
the presence of both intraneuronal protein clusters composed
of
(i) Extracellular Aβ protein aggregates (senile plaques)
(ii) Bundles of Paired Helical Filaments (PHF) of abnormal
pTau (Intra cellular neuro fibrillary tangles) (Butterfield et al., 2007).

Aβ is a 39-43 residue protein
MW (˜ 4 Kda).
It is derived by proteolytic cleavage of an integral
membrane protein known as amyloid precursor protein
(APP) by the action of β- and γ - secretases (Butterfield et al., 2007).

Barron et al., 2006. The role of Gonadotrophins in Alzheimer’s disease.
Endocrine, Vol 9, 257-269


Oxidative stress - play a crucial role in the pathogenesis of
neurodegenerative disorders, cancer, and ischemia.
Oxidative stress and Aβ production are proportionally linked
to each other because Aβ induces oxidative stress invivo and
invitro (Tabner et al., 2005), and oxidative stress increases the
production of Aβ (Tamagno et al., 2008).
Aβ induces iNOS expression in vivo that produces
neurotoxic levels of NO and results in the cholinergic signaling
dysfunction and memory impairment (Tan et al., 2001).

Tau Protein and its Hyper phosphorylation
Major microtubule-associated phosphoprotein (~55
Kda), located in axons where it binds to microtubules, thus
promoting microtubule assembly and stability
Encoded by single gene located on chromosome 17
Among its post translational modifications,
phosphorylation has been most widely studied (Zhang et al., 2009). Many neurodegenerative diseases are
characterized by Tau phosphorylation

Tau (mis) localization in neurons, and
consequently the development of
neurofibrillary tangles (NFT)
In healthy persons –
(i) Involvement in the outgrowth of
neural processes,
(ii) Axonal transport,
(iii)Development of neuronal polarity
(iv)Maintenance of normal neuron
morphology

PHFs – Main constituent of large pathological structures
(NFTs).
Tau hyperphosphorylation affects the morphology and
biological functions of the neurons.
As a result of NFTs formation, MAP –Tau is no longer
available for cytoskeletal stabilization. The disorganization of
the neuronal skeletal contributes to neuronal malfunction,
neuronal cell death and eventually dementia


ERYTHROPOIETIN (EPO)
EPO - Glycoprotein (30.4 kDa) and it is widely known as the
major growth factor for the RBC production (Lin zhu et al.,
2009)
165 AA residues chain to which four glycans are attached
The first purification of human EPO from urine of aplastic
anemia patient in 1977 led to the cloning of human EPO gene
and permitted mass production of recombinant human EPO
(Katavetin et al., 2007)

EPO was first characterized as a hematopoietic growth factor
and has been in clinical use by millions of patients over the
decade for the treatment of anemia (Anna-leena Siren et al.,
2000).
The clinical relevance for the use of EPO as a neuroprotective
agent was enhanced when it was found to cross the blood -
brain barrier after peripheral administration (Brines et al.,
2000)
Epo has been show to act as antioxidant by decreasing NO
and increasing GSH (Moran et al., 2009).
Neuroprotection by EPO has been shown to associate with
anti-apoptosis, neuroregeneration and anti-inflammation (Sola
et al., 2005)
Sun et al. (2008) reported that Epo prevented tau
hyperphosphorylation in SH-SY5Y cells exposed to the β
amyloid peptide.
In mice, Epo treatment improves hippocampus dependent
memory by modulating plasticity, synaptic connectivity and
activity of memory related neuronal networks (Adamcio et al., 2008).

Anaemia is an important risk factor for cognitive impairment in
CRF and the major factor is a relative deficiency of erythropoietin
synthesis by the failing kidneys (Eschbach, 1989).
Epo is used routinely to treat anemia in CRF. It has been shown
that along with the level of Hb, cognitive function also improves
(Pickett et al., 1999).
Lacunae
There is no study on the expression of APP, β Amyloid and
phospho Tau in CRF induced experimental animals
Impact of antianemic drug EPO on those protein abnormalities
in CRF induced animals (?)

Hypothesis
1. CRF could induce changes in the expression of APP, Aβ and
hyperphosphorylated tau protein (pTau) levels in
cerebellum, cerebral cortex and hippocampus of wistar
strain albino rats.
2. Epo could protect the CRF induced protein abnormalities
along with correcting hematological parameters
Aim
To study the impact of Epo supplementation on CRF induced
changes in expression of APP, Aβ and hyperphosphorylated tau
protein levels in cerebral cortex, cerebellum and hippocampus
Materials and methods
Reviewed and approved by the Institutional Animal Ethics
Committee, SRM University, INDIA.
This study was done on 48 Adult Male Wistar rats 120 – 150 gm
in weight
After 10 days of acclimatization the animals were randomly
assigned to either the experimental groups or control group

- Were housed in Central Animal house
of SRM Medical College Hospital
Each 3 animal has given individual
labeled cages
They were maintained in controlled
laboratory conditions of 12 hour dark/
light cycle, 20-22° C temp.
All the animals were weighed
alternative days through out the study
and water intake was also measured
daily.
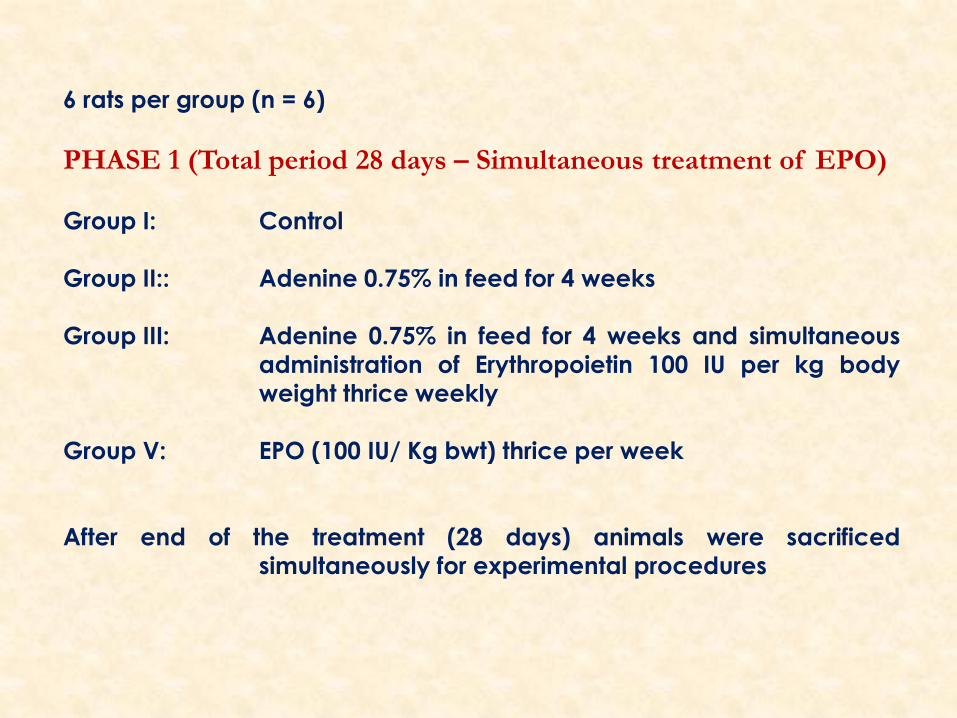
6 rats per group (n = 6)
PHASE 1 (Total period 28 days – Simultaneous treatment of EPO)
Group I: Control
Group II:: Adenine 0.75% in feed for 4 weeks
Group III: Adenine 0.75% in feed for 4 weeks and simultaneous
administration of Erythropoietin 100 IU per kg body
weight thrice weekly
Group V: EPO (100 IU/ Kg bwt) thrice per week
After end of the treatment (28 days) animals were sacrificed
simultaneously for experimental procedures

PHASE II (Total period 40 days – Post treatment of EPO)
Group I: Control
Group II:: Adenine 0.75% in feed for 4 weeks
Group III: Adenine 0.75% in feed for 4 weeks + after 4
weeks post treatment of Erythropoietin (100 IU/ Kg
bwt.) 12 days, daily once.
Group IV: EPO (100 IU/ Kg bwt) thrice per week
After end of the treatment (40 days) all animals were sacrificed
simultaneously

The most commonly used rat model for progressive renal
failure is the “remnant kidney” model (also called 5/6
nephrectomy) (Kujal & Vernerová, 2008).
The other valid, widely used model, is the adenine-induced
CRF in rats (Ormrod & Miller, 1980)
Adenine is given mixed with the feed at a concentration of
0.75%, w/w, for 4 weeks. Orally-administered adenine is
metabolized to 2,8-dihydroxyadenine, which precipitates and
forms tubular crystals that injure the renal tissue (Shuvy et al.,
2011)

Chemicals
Adenine was purchased from Sisco
Research Lab (SRL), India.
EPO was purchased from Serum
Institute of India, Chennai.
Primary and secondary antibodies
for western blotting were purchased
from Cell Signaling Technology
EPO i.p injection

Primary Antibodies
GAPDH (D16H11) – Rabbit mAb # 5174BC
β Amyloid (D54D2) – Rabbit mAb # 8243
Phospho Tau (Ser 202) – Rabbit Polyclonal Ab # 11834
Total Tau (Tau 46) – Mouse mAb # 4019
APP – Rabbit polyclonal Ab # 2452
Quantification of the bands was done by using image J software

Methods
Rectangular maze procedures has been done weekly once
from day 0, till the last day of treatment to find out the
changes in memory and learning as the treatment progress.
After ending the treatment period, the animals were taken to
record the behavioral changes with the help of plus maze.
At last the animals were sacrificed and then blood samples
and organs were collected for analysis.

Rectangular maze

Plus maze
Introduced by Handley and Mithani in 1984,
widely used model to assess anxiety-related behavior in rodents.
- Two open arms and two arms that are enclosed by high walls.
The open arms are perpendicular to the closed arms, with the
four arms intersecting to form the shape of a plus sign.
Usually elevated approximately 50 cms. above the floor. Security
is provided by the closed arms whereas the open arms offer
exploratory value.
Therefore, one would expect anxious rats to spend less time in
the open arms than those that are less fearful (Salum et al., 2000).
Environmental temperature was maintained equal to the
temperature measured in the housing room.

A weak cider vinegar solution (10%) was used to clean the
apparatus prior to the introduction of each animal.
Each rat was placed at the center of the elevated plus-maze
with its head facing the open arms and allowed to freely
explore for 5 min.
After each observation, the EPM was cleaned with ethyl
alcohol (10%) to remove scent cues left from the preceding
subject.

During this 5 min experiment, the behavior of the rat was
recorded as
Percent time spent in open arm (Time spent in open
arm *100/ 300)
Number of entries in open arm
Percent time spent in closed arm (Time spent in closed
arm *100/ 300)
Number of entries in Closed arm
Percent time spent in centre
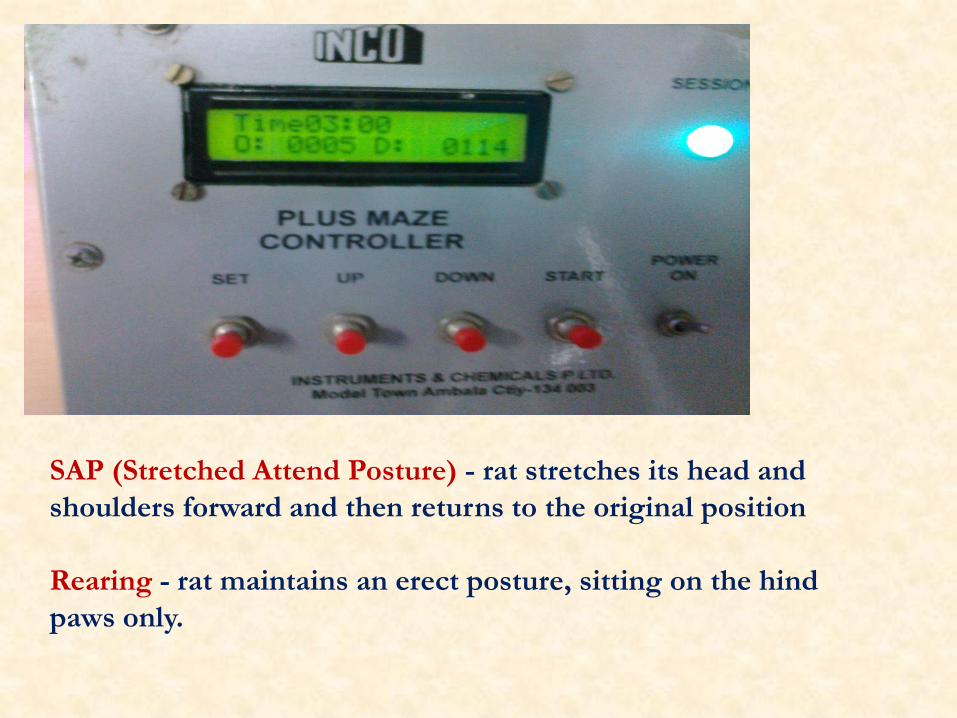
SAP (Stretched Attend Posture) - rat stretches its head and
shoulders forward and then returns to the original position
Rearing - rat maintains an erect posture, sitting on the hind
paws only.

Grooming - rat licks/rubs its face
and/or body
Defecation – number of fecal boli
produced
Head Dip - scanning over the sides
of the maze towards the floor

Hematological analysis
After recording the behavioral changes, blood has been collected
from the posterior cava vein in each animal, under ether
anesthesia, to determine hematological parameters.
Two blood samples has been taken with and without EDTA.
Samples without EDTA was centrifuged at 5000 rpm for 20
minutes and the samples were stored in -70 ºC until analysis.
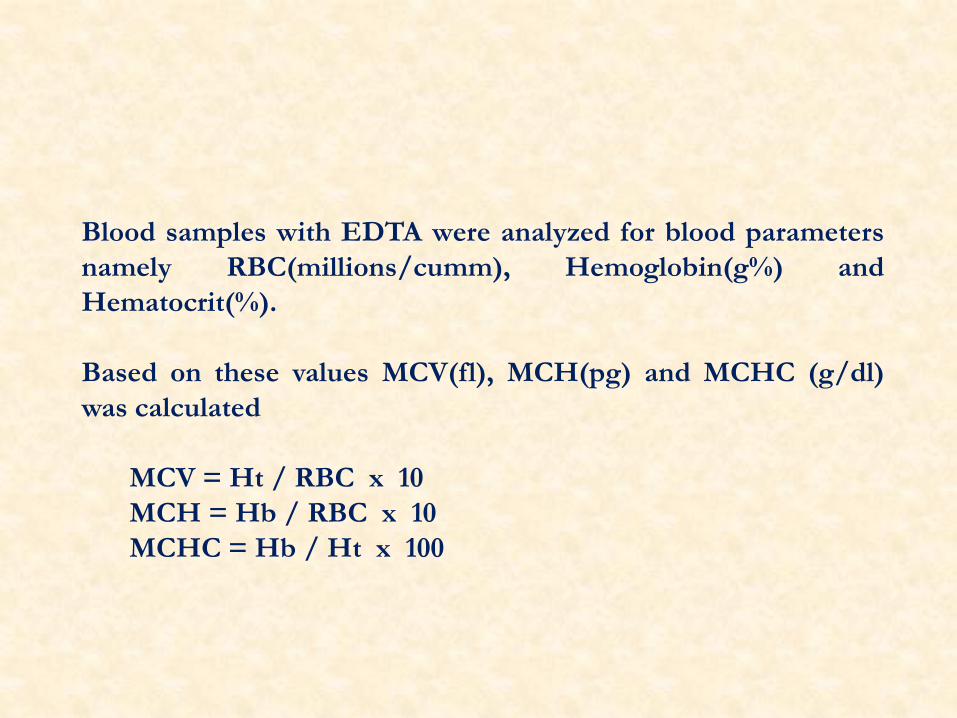
Blood samples with EDTA were analyzed for blood parameters
namely RBC(millions/cumm), Hemoglobin(g%) and
Hematocrit(%).
Based on these values MCV(fl), MCH(pg) and MCHC (g/dl)
was calculated
MCV = Ht / RBC x 10
MCH = Hb / RBC x 10
MCHC = Hb / Ht x 100
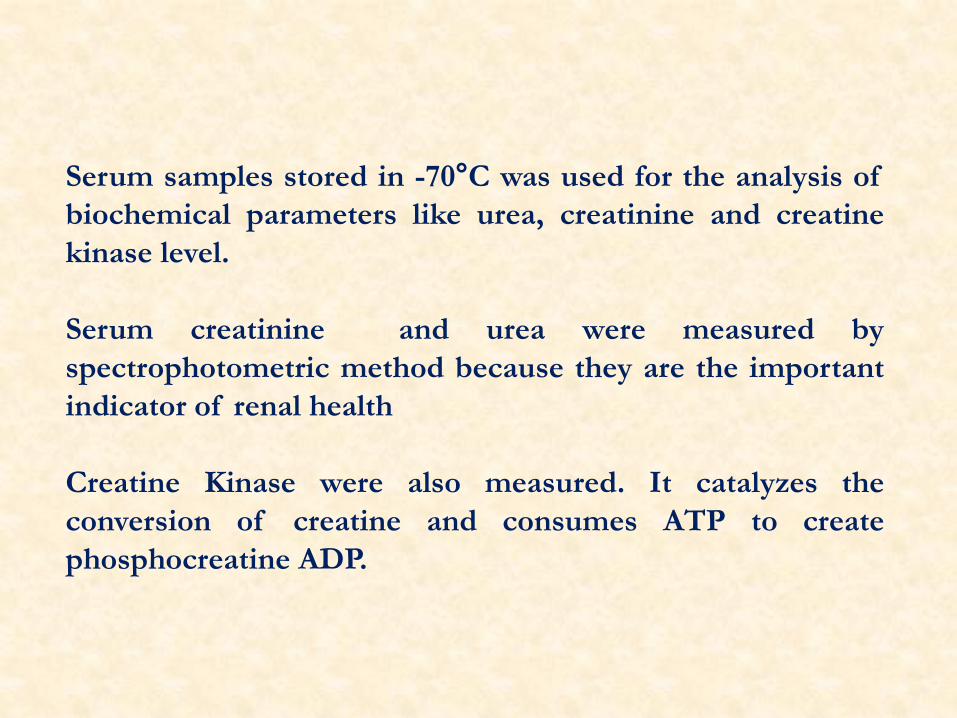
Serum samples stored in -70°C was used for the analysis of
biochemical parameters like urea, creatinine and creatine
kinase level.
Serum creatinine and urea were measured by
spectrophotometric method because they are the important
indicator of renal health
Creatine Kinase were also measured. It catalyzes the
conversion of creatine and consumes ATP to create
phosphocreatine ADP.

24 hours after last treatment, the animals were sacrificed and brain
was immediately removed and washed in ice-cold physiological
saline repeatedly and brain was dissected over ice-cold glass slides
to the following regions:
Cerebral cortex and Hippocampus and cerebellum (Glowinski and
Iverson, 1966).
Regions from each of the brain tissue were blotted, weighed accurately

All the organs weighed separately and brain and kidney relative
weight was calculated based on the formula (organ weight /
final body weight X 100)
Body weight was calculated based on the formula (body weight
change = final weight - initial weight X 100)
The brain regions were placed in chilled 0.1 mol/L Tris–HCl
buffer, pH 7.4.
The samples were homogenized using a Potter-Elvehjem
homogenizer to produce 10% homogenates.
The samples were centrifuged at 12,000 x g for 30 min. The
supernatant was collected and used for the experiments

Parameters Group 1 Group 2 Group 3 Group 4
RBC
(millions/cumm) 7.05 +0.52
4.42 +0.31
** 7.3 + 0.43NS
11.3
+0.88***
HB (g%) 13.13+0.62 6.65+0.51 *** 10.2+0.25
*
17.6+1.31
***
PCV (%) 43.08+2.73 27.33 ± 1.80
***
37.83 ±2.15
NS
58.50 ±2.36
**
MCV (fl) 60.92+1.29 61.78 ± 1.27
NS 51.80 ±2.56 *
54.76 ± 1.02
NS
MCH (pg) 16.95+ 0.69 13.81 ± 0.19
**
14.15 ± 0.76
**
16.61 ± 0.32
NS
MCHC (g/dl) 28.62+0.74 21.27 ± 0.81
***
27.37 ± 0.88
NS
35.82 ± 0.70
*
Phase I – Haematological parameters

Parameters Group 1 Group 2 Group 3a Group 3b Group 4
RBC
(millions/cumm) 7.58 +0.46
3.87+0.18
***
4.48+ 0.32
**
6.53+0.41
NS
12.3+0.71
***
HB (g%) 12.63+0.52 6.08+0.38
***
5.96+0.30
***
10.85+0.32
NS
18.6+1.11
***
PCV (%) 46.00+2.29 24.33 ± 1.49
***
27.50 ±1.17
***
35.17 ±1.35
**
56.27 ±2.15
**
MCV (fl) 57.92+1.34 62.09 ± 1.79
NS
62.16 ±
2.37 NS
54.47 ± 2.43
NS
52.39 ±
1.92 NS
MCH (pg) 17.45 +0.69 12.97 ± 0.24
**
13.52 ±
0.72 ***
15.18 ± 0.45
*
24.31 ±
0.52 **
MCHC (g/dl) 29.85+0.24 22.33 ± 0.67
***
21.73 ±
0.74 ***
34.25 ± 0.88
*
38.12 ±
0.65 **
Phase II – Haematological parameters


Latency period of rectangular maze in CRF induced and EPO treated animals in both (A)
– Simultaneous treatment phase and (B) – Post treatment phase. Results are expressed as
mean ± SEM of 6 rats in each group; (a) -P< 0.001, (b) - P < 0.01, (c) P < 0.05, NS – Not
Significant
Parameters Group 1 Group 2 Group 3 Group 4
OA 14.39 ± 2.14 6.50 ± 1.05
**
8.56 ± 1.34
*
12.07 ± 0.91
NS
CA 55.33 ± 3.73 64.33 ± 5.28
NS
56.33 ± 4.01
NS
49.24 ± 4.15
NS
Centre 30.28 ± 1.77 29.28 ± 4.27
NS
35.06 ±4.73
NS
37.97 ±3.16
NS
EOA 6.33 ±1.11 2.86 ± 0.16
*
3.50 ± 0.42
NS
5.97 ± 0.8
NS
ECA 4.67 ±0.55 5.67 ±0.33
NS
6.33 ± 0.66
NS
5.50 ± 0.56
NS
SAP 4.17 ±0.66 8.13 ± 1.15
**
5.00 ± 0.57
NS
7.83 ± 0.61
**
Rearing 16.73 ± 1.04 29.83 ± 1.24
**
23.83 ± 1.4
NS
24.17 ± 1.49
NS
Grooming 3.50 ± 0.76 6.15 ±0.51
*
3.83 ±0.6
NS
4.45 ±0.48
NS
Defecation 1.43 ±0.7 3.83 ±0.47
*
2.83 ±0.47
NS
2.50 ±0.42
NS
Head dips 3.67 ±0.55 9.09 ±0.81
***
6.17 ±0.47
*
4.54 ±0.33
NS
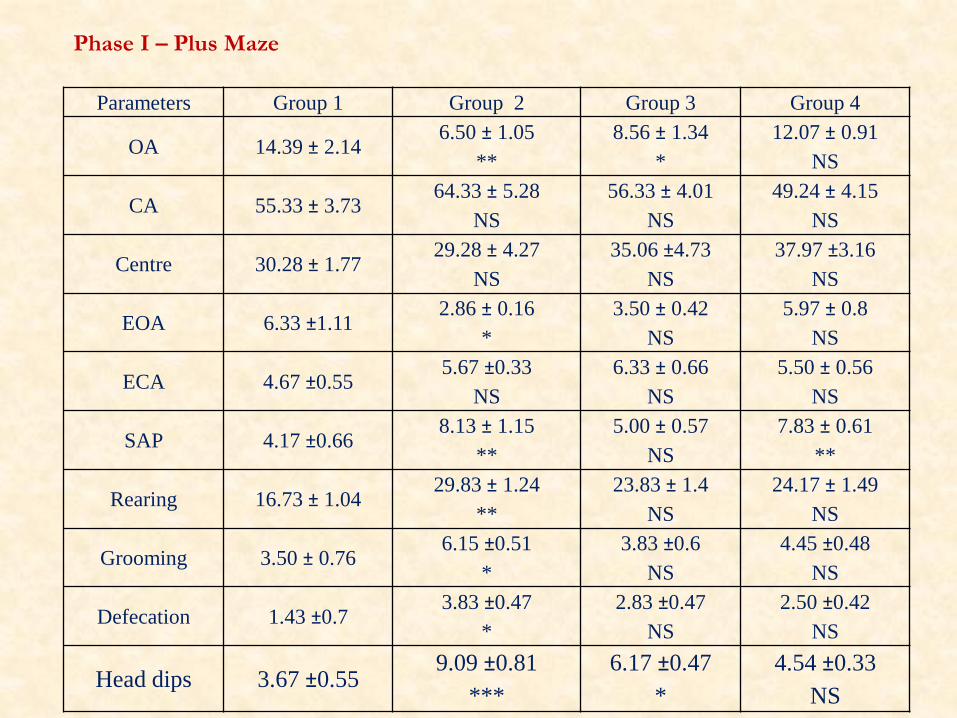
Phase I – Plus Maze
Parameters Group 1 Group 2 Group 3a Group 3b Group 4
OA 17.19 ± 1.14 5.58 ± 0.95
***
5.61 ± 1.07
**
7.22 ± 1.11
**
11.67 ± 0.79
*
CA 53.27 ± 3.28 67.69 ± 6.65
NS
65.17 ± 5.21
NS
57.50 ±4.71
NS
45.67 ± 3.47
NS
Centre 29.51 ± 2.03 28.28 ± 3.95
NS
29.39 ±4.24
NS
35.33 ±4.9
NS
42.67 ±2.68
*
EOA 5.33 ±1.27 3.00 ± 0.36
NS
2.67 ± 0.42
*
3.17 ± 0.87
NS
6.17 ± 0.7
NS
ECA 3.27 ±0.71 6.17 ±0.41
*
5.17 ± 0.3
NS
5.33 ± 0.49
NS
4.13 ± 0.26
NS
SAP 3.67 ±0.45 7.00 ± 1.15
*
9.17 ± 0.6
***
7.83 ± 0.7
**
7.33 ± 0.55
**
Rearing 18.23 ± 1.84 31.83 ± 1.08
**
32.17 ± 2.38
***
27.83 ± 2.57
*
22.77 ± 1.31
NS
Grooming 2.87 ± 0.17 5.45 ±0.44
*
5.00 ± 0.57
NS
5.33 ±0.49
NS
3.50 ±0.61
NS
Defecation 1.83 ±0.3 4.26 ±0.67
*
3.50 ±0.42
NS
3.00 ±0.36
NS
4.17 ±0.61
*
Head dips 3.01±0.22 9.17 ±0.94
***
9.33 ±0.76
***
7.00 ±0.93
*
4.00 ±0.73
NS
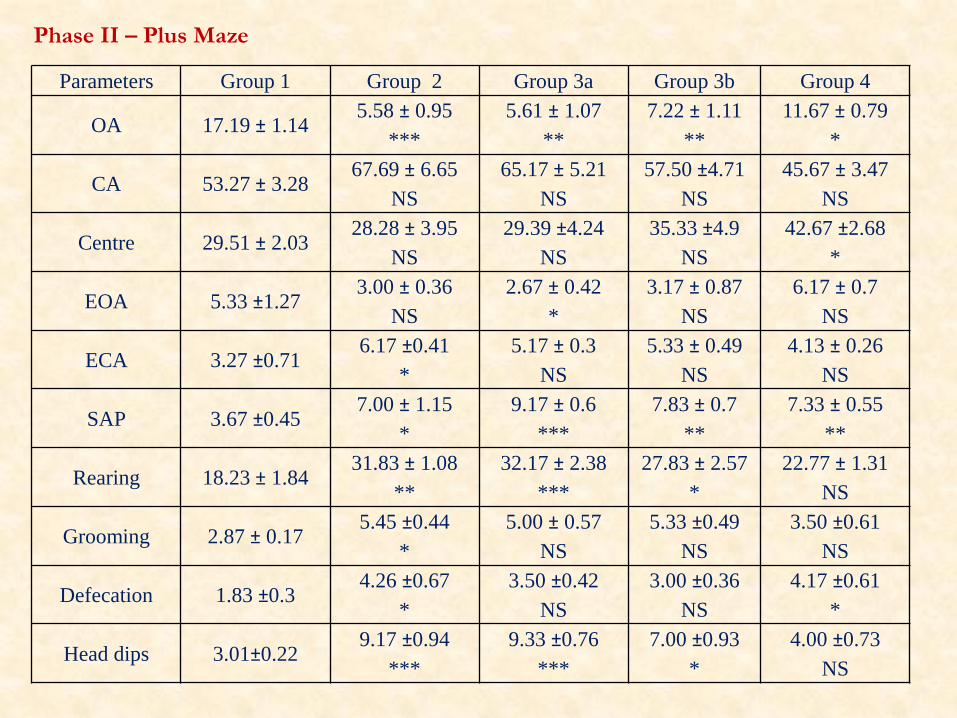
Phase II – Plus Maze

Blood Urea Nitrogen (BUN) levels in CRF induced and EPO treated animals in both (A) –
Simultaneous treatment phase and (B) – Post treatment phase. Results are expressed as
mean ± SEM of 6 rats in each group; * P < 0.05, ** P < 0.01, *** P < 0.001, NS – Not
Significant

Serum Creatinine levels in CRF induced and EPO treated animals in both (A) – Simultaneous
treatment phase and (B) – Post treatment phase. Results are expressed as mean ± SEM of 6
rats in each group; * P < 0.05, ** P < 0.01, *** P < 0.001, NS – Not Significant

Serum Creatine kinase levels in CRF induced and EPO treated animals in both (A) –
Simultaneous treatment phase and (B) – Post treatment phase. Results are expressed as
mean ± SEM of 6 rats in each group; * P < 0.05, ** P < 0.01, *** P < 0.001, NS – Not
Significant
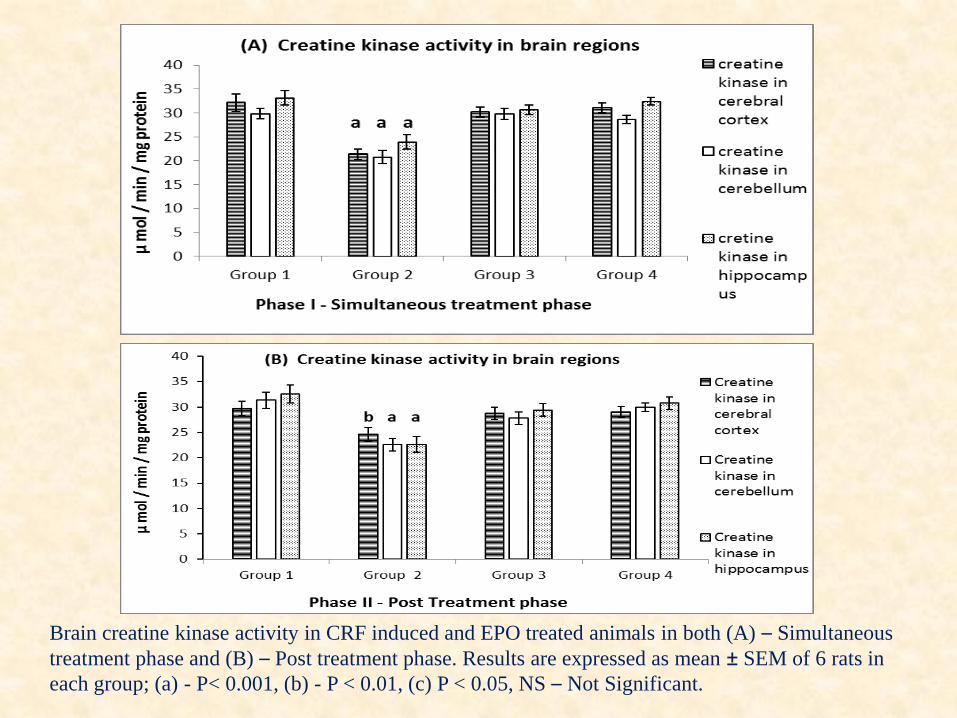
Brain creatine kinase activity in CRF induced and EPO treated animals in both (A) – Simultaneous
treatment phase and (B) – Post treatment phase. Results are expressed as mean ± SEM of 6 rats in
each group; (a) - P< 0.001, (b) - P < 0.01, (c) P < 0.05, NS – Not Significant.
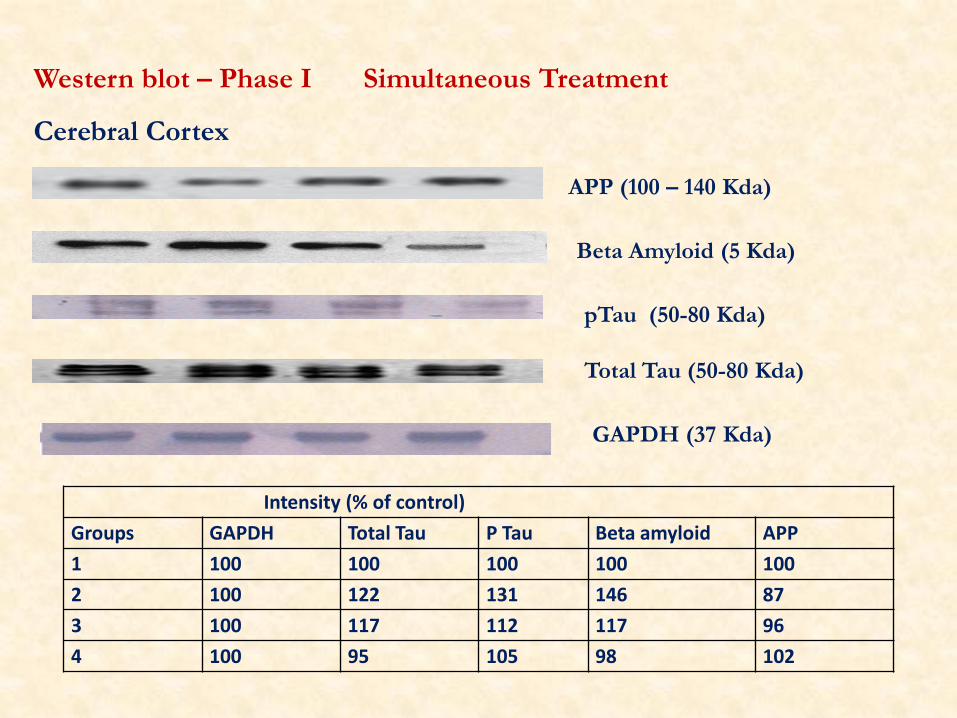
Western blot – Phase I Simultaneous Treatment
Cerebral Cortex
GAPDH (37 Kda)
APP (100 – 140 Kda)
Beta Amyloid (5 Kda)
pTau (50-80 Kda)
Total Tau (50-80 Kda)
Intensity (% of control)
Groups GAPDH Total Tau P Tau Beta amyloid APP
1 100 100 100 100 100
2 100 122 131 146 87
3 100 117 112 117 96
4 100 95 105 98 102
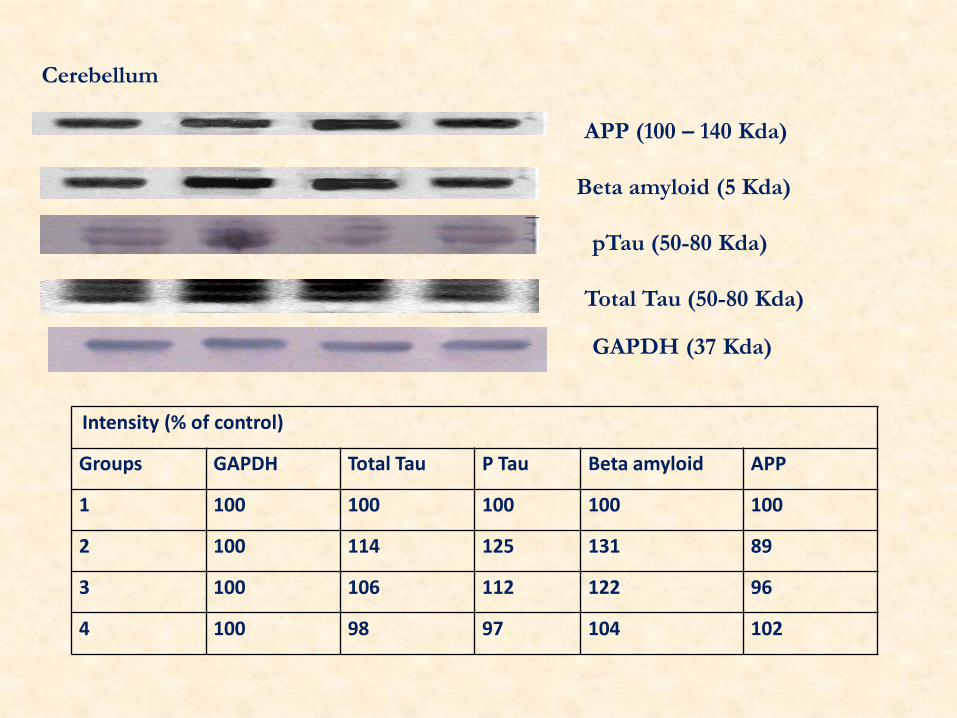
Cerebellum
APP (100 – 140 Kda)
Beta amyloid (5 Kda)
pTau (50-80 Kda)
Total Tau (50-80 Kda)
GAPDH (37 Kda)
Intensity (% of control)
Groups GAPDH Total Tau P Tau Beta amyloid APP
1 100 100 100 100 100
2 100 114 125 131 89
3 100 106 112 122 96
4 100 98 97 104 102

Hippocampus
Intensity (% of control)
Groups GAPDH Total Tau P Tau Beta amyloid APP
1 100 100 100 100 100
2 100 121 147 153 72
3 100 117 122 121 87
4 100 96 97 104 106
APP (100 – 140 Kda)
Beta Amyloid (5 Kda)
Phospho Tau (50-80 Kda)
Total Tau (50-80 Kda)
GAPDH (37 Kda)

Phase II – Post Treatment
Cerebral cortex
APP (100 – 140 Kda)
Beta Amyloid (5 Kda)
pTau (50-80 Kda)
Total Tau (50-80 Kda)
GAPDH (37 Kda)
Intensity (% of control)
Groups GAPDH Total Tau P Tau Beta amyloid APP
1 100 100 100 100 100
2 100 127 135 151 82
3 100 119 129 131 93
4 100 99 94 103 106

APP (100 – 140 Kda)
Beta Amyloid (5 Kda)
pTau (50-80 Kda)
Total Tau (50-80 Kda)
GAPDH (37 Kda)
Cerebellum
Intensity (% of control)
Groups GAPDH Total Tau P Tau Beta amyloid APP
1 100 100 100 100 100
2 100 121 131 127 92
3 100 117 122 119 96
4 100 96 95 104 106

Hippocampus
Intensity (% of control)
Groups GAPDH Total Tau P Tau Beta amyloid APP
1 100 100 100 100 100
2 100 121 147 153 78
3 100 117 131 129 85
4 100 96 97 105 109
APP (100 – 140 Kda)
Beta Amyloid (5 Kda)
pTau (50-80 Kda)
Total Tau (50-80 Kda)
GAPDH (37 Kda)
Conclusion
Increased Aβ and Hyperphosphorylated tau proteins (ser 202) were
observed in selected brain regions of CRF induced experimental
animals. Creatine kinase (CK) activity also decreased in CRF
induced animals
Supplementation of EPO protects the CRF induced protein
abnormalities and CK alterations significantly in both
simultaneous and post treatment.
This study proves the clinical usefulness of Epo as supplemental
therapeutic agent in cognitive dysfunction in CKD.

THANK YOU