impact of section 5 inspections - foundation · 5.2 impact on outcomes from follow-up case-study...
TRANSCRIPT

1
National Foundation for Educational Research Impact of Section 5 inspections: maintained schools in England Final report Tami McCrone Peter Rudd Sarah Blenkinsop Pauline Wade Simon Rutt Tilaye Yeshanew

Impact of Section 5 inspections: maintained schools in England: Final report

Contents
Acknowledgements i
Executive summary iii Introduction iii
1. Introduction 1
1.1 Background 1 1.2 Aims and objectives 2 1.3 Methodology 2 1.4 The school sample 4 1.5 Structure of the report 6
2. The inspection process 9
2.1 Stakeholder interviewees’ involvement in the inspection 9 2.2 Completion and usefulness of the Self-Evaluation Form 11 2.3 Update of the SEF 17 2.4 Oral feedback and dialogue 21
3. Impact: the inspection report 27
3.1 The diagnosis and the inspection grades 28 3.2 Identifying strengths and weaknesses 34 3.3 The letter and the report 37
4. Impact on School Improvement 43
4.1 Recommendations for action 44 4.2 Action planning 48 4.3 Progress on actions taken on recommendations 51 4.4 Factors contributing to school improvement 54 4.5 Progress in school improvement 61
5. Impact on outcomes 65
5.1 Impact of actions 65 5.2 Impact on outcomes from follow-up case-study interviews 68 5.3 Impact on quantifiable outcomes 71 5.4 Findings from statistical modelling 74 5.5 Overview on impact 75
6. Overview of schools’ perspectives 77
6.1 Overall satisfaction with the inspection 78 6.2 The Cost of inspection 82 6.3 Main benefits arising from the inspection 83 6.4 Main concerns following inspection 85 6.5 Ways of improving inspections 87 6.6 Expectations of future inspections 92

Impact of Section 5 inspections: maintained schools in England: Final report
7. Conclusions and recommendations 95
Appendix A Detailed results from multinomial logistic modelling - satisfaction 101
Appendix B Detailed results from multinomial logistic modelling - impact 105
Appendix C Impact of s5 Inspections – School Context for Primary Schools 109
Appendix D Impact of s5 Inspections – School Context for Secondary Schools 111

Acknowledgements
i
Acknowledgements
The research team would like to thank the headteachers, senior managers, governors, pupils and parents who participated in this evaluation. Their inputs, on the impact of the s5 inspections, were extremely valuable and the study could not have been completed without their cooperation and assistance.
Special thanks are due to our NFER colleagues, in particular to Julia Rose for her unfailing administrative support, to Neelam Basi for putting together the final report, and to Gaby White for her contribution to the research team in the early stages of this project. In addition we are extremely grateful to the following colleagues for assisting with the case-study visits.
Robert Smith Robat Powell Nia Seaton Anne Lines Matthew Walker Thomas Spielhofer Karen Lines Karen Whitby Sandie Schagen David Teeman Tamsin Chamberlain Claire Easton Sarah Golden
We would also like to express our gratitude to various individuals at Ofsted who provided valuable information and support for the project, most notably Andrew Reid, Robin Stoker and Harmer Parr.

Impact of Section 5 inspections: maintained schools in England: Final report
ii

Executive summary
iii
Executive summary
Introduction
A new form of inspection for maintained schools in England was introduced, in accordance with the provisions of Section 5 (s5) of the Education Act 2005, in September 2005. The main elements of the new system include: shorter notice of inspection, smaller inspection teams, more frequent inspections, an increased emphasis on the school’s own self-evaluation evidence, and shorter reports with fewer, clearer recommendations for improvement. In 2006-07 a research team at the National Foundation for Educational Research (NFER) had a unique opportunity to carry out a detailed and independent evaluation of the new inspection process. The central aim of the research was to assess the extent to which schools felt that the new inspections contributed to school improvement. The evaluation, commissioned by Ofsted, commenced in February 2006, with a pilot phase, and was completed in April 2007. The main research methods used were as follows:
• A survey of all schools inspected between October 2005 and March 2006
(subject to minor exclusions): 1,597 schools responded to this survey.
• Case-study visits to 36 schools where interviews were conducted with a total of 169 headteachers, senior managers, governors and parents, usually individually, along with 243 pupils, usually in small discussion groups.
• Follow-up interviews with headteachers or senior managers, to provide a longitudinal perspective over a short duration.
• Statistical modelling of survey responses and various school background factors, using satisfaction with, and perceived impact of, inspection as outcomes.
• A desk-top review of key case-study school documents and test and examination results.
Key findings
Overall the vast majority of schools were satisfied with the inspection process and this process was generally perceived as contributing to school improvement. The majority of survey respondents and interviewees agreed with the inspection report recommendations and valued the contribution to school improvement in terms of the confirmation, prioritisation and clarification of areas for improvement. On reflection many schools felt that the report had provided an impetus to drive forward progress.
• Overall satisfaction. Over half of the schools surveyed (52 per cent) were
‘very satisfied’ with the inspection and more than a third (36 per cent)

Impact of Section 5 inspections: maintained schools in England: Final report
iv
were ‘quite satisfied’. A minority, ten per cent of survey schools, were ‘not at all satisfied’ with the s5 inspection.
• The Self-Evaluation Form (SEF). Although the majority of interviewees reported that it was time-consuming to complete the SEF, there was also a strong view that the SEF had been effective as a means of identifying school strengths and weaknesses. Inspection teams made good use of the SEF and it provided a focus for the inspection. Self evaluation generally was regarded as having improved and the SEF framework had contributed to this improvement.
• Oral feedback. Oral feedback from the inspection team was found to be a vital part of the inspection process. Over half (60 per cent) of the survey respondents found the oral feedback very useful, and further 32 per cent fairly useful. The research also revealed a positive, and statistically significant, relationship between constructive oral feedback and overall satisfaction with the inspection process.
• Self-evaluation and inspection grades. Filling in the SEF required schools to make their own self-assessment of their ‘overall effectiveness’ and a number of other categories such as ‘achievement and standards’. School survey respondents were asked to compare their own SEF grades with those awarded by the inspectors: two-thirds of survey respondents reported no differences between the s5 and school’s SEF grades, indicating a large degree of consistency between the two sets of judgements. In addition, the grades appear to have become more ‘in tune’ the longer the s5 inspection has been in operation.
• The written report. Over three-quarters of case-study school interviewees believed the inspection team’s diagnosis, and the written report, to be fair and accurate. Over half of survey respondents found the written report helpful for identifying areas for improvement. The majority of interviewees found the written report to be useful, helpful and easy to read. A few interviewees believed the report to be too brief and generalised. However, it was perceived to be accessible and parents appreciated an independent assessment of schools. On the whole pupils liked the letter from the inspector and valued involvement in the process.
• Inspection recommendations. Recommendations for improvement were, on the whole, considered to be helpful and sufficiently specific and follow-up interviews showed that almost all case-study schools were implementing all, or most, of their recommendations. The area of greatest perceived impact, from the s5 recommendations, was in assessment, monitoring and tracking.
• Contribution of the inspection to school improvement. Nearly two-thirds of survey respondents and just over half the case-study interviewees considered that the inspection had contributed to school improvement. The main way it had contributed was by confirming, prioritising and clarifying areas for improvement, rather than by highlighting new areas. Above all, schools recognised that however reliable their own self evaluation was, it was useful for parents and the local communities, as well as for their own

Executive summary
v
staff, to have their judgements confirmed by an external and objective body.
• KS2 outcomes. There were some indications in primary schools that, where the recommendations identified a specific subject for improvement, an improvement in key stage 2 outcomes in this subject did indeed occur in several of the case-study schools in 2005-06, though it cannot be said with any certainty that the positive outcomes were directly related to the inspection report.
• KS4 outcomes. The research team ranked the case-study secondary schools on the basis of their key stage 4 outcomes and then examined the recommendations made in the highest-performing schools’ inspection reports. The main finding was that, in the majority of successful secondary schools (in terms of the proportion of pupils achieving five or more good GCSEs in 2006 compared to 2005), a specific recommendation to do with assessment, pupil tracking or marking had been made. It seems that this type of focused recommendation may be particularly helpful to secondary schools but, again, this does not necessarily indicate a direct causal link between KS4 outcomes and inspection recommendations.
• Costs of inspection. A substantial majority of survey respondents (83 per cent) thought that the actual monetary costs incurred due to inspections were minimal and were certainly less than those incurred during the previous s10 inspection process. Furthermore, three-fifths of school respondents thought that the new s5 inspection process was less stressful than the previous system.
Benefits and concerns • Benefits of inspection. The main benefit was perceived to be that the
inspection had been valuable in providing external confirmation of schools’ own self evaluation (86 per cent of survey respondents). Additionally, other benefits were perceived to be that inspection boosted staff morale (42 per cent) and, as well as providing confirmation, it also stimulated improvements (33 per cent).
• Concerns about the inspection process. The biggest concern, mentioned by just over half of the survey respondents, was found to be the time taken for schools to complete the SEF, and just over a quarter perceived that there were issues in relation to the use and interpretation of data.
• Suggested improvements. Although schools were generally satisfied with the inspection, just under half made suggestions for changes. These most often related to perceptions that the SEF should be simplified, more time should be allowed for inspectors to observe lessons, inspections should be less data-driven and that there should be more consistency across inspection teams.
Implications of the research
• Self evaluation. Although further guidance on SEF completion and on self evaluation generally, has already been provided by Ofsted, and SEF

Impact of Section 5 inspections: maintained schools in England: Final report
vi
completion should be less difficult from the second year of the process onwards, it would be worth keeping this area of support and advice for schools under close review.
• Use of data. Concern was expressed over data interpretation by some schools inspected throughout the period from October 2005 to March 2006. This suggests that there may be a need for more evenness and consistency in terms of the way data is used, particularly in relation to fully understanding the school context. With the introduction of RAISE online, there should be opportunities to ensure that consistencies in data use and interpretation are further promoted and strengthened.
• Importance of oral feedback and dialogue. In view of the importance that schools placed on the oral feedback, Ofsted should maintain and perhaps even enhance the central position which oral feedback has in the inspection process. Schools appeared to welcome the opportunity for, and were responsive to, dialogue, especially as this provided opportunities to explain the broader school context.
• Using positive terminology. Though it was widely accepted that inspectors had to work within the agreed standard framework of gradings, there was some dissatisfaction in schools with the terminology used to describe the ‘overall effectiveness’ grades, especially in relation to the ‘satisfactory’ grading. Whilst it was accepted that parents and other stakeholders should be provided with a clear, comparable, external, objective assessment of a school’s performance, some school interviewees expressed a view that the terminology was too negative and too rigid. Several respondents suggested that inspectors should look for further ways of providing praise and encouragement for staff: and it might be possible to do this through the oral feedback and the lesson observation elements of the inspection process.
• Refining inspection recommendations. The vast majority of survey respondents agreed with the inspection recommendations, found them helpful, and felt that they were sufficiently specific. Only one in ten schools found the recommendations ‘not at all helpful’. Where this latter view was present, the reasons were usually along the lines of: (1) the recommendations were not specific enough; or (2) the recommendations lacked practical guidance. It might be worth bearing these two points in mind when any further advice on drafting recommendations is given to inspectors.

Introduction
1
1. Introduction 1.1 Background
This report presents the findings from an independent external evaluation of the impact of Section 5 inspections, as perceived by schools, commissioned by Ofsted, and carried out by a team at the National Foundation for Educational Research (NFER). As well as building on the findings from a pilot phase of this research, also carried out by a team from the NFER, between February and July 2006, this research draws on a range of sources of data which include: • A survey of all schools inspected between October 2005 and March 2006
(subject to minor exclusions reported below).
• Case-study visits to 36 schools where headteachers, senior managers, governors, pupils and parents were interviewed.
• Follow-up interviews with headteachers or senior managers to provide a longitudinal perspective over a short duration.
• A desk-top review of key case-study school documents.
The new form of inspection for maintained schools in England was introduced, in accordance with the provisions of Section 5 (s5) of the Education Act 2005, in September 2005. The main elements of the new system include: shorter notice of inspection, smaller inspection teams, more frequent inspections, an increased emphasis on the school’s own self-evaluation evidence, and shorter reports with fewer, clearer recommendations for improvement. The Annual Report of Her Majesty’s Chief Inspector of Schools 2005/2006 states that:
The new inspection arrangements have raised the bar, but without putting it out of reach. The performance of schools, and the public’s expectations of them, have both risen, and it is right that inspection should reflect that. The rigour of the new grade descriptors, and the data now available, means that there is an ever more acute appraisal of pupils’ progress and a school’s performance. (Ofsted, 2006, p.7)1
1 OFSTED (2006): Annual Report of Her Majesty’s Chief Inspector of Schools 2005/06. London:
Ofsted.

Impact of Section 5 inspections: maintained schools in England: Final report
2
In addition Ofsted recognises that: ‘The new inspection framework focuses on a school’s effectiveness. It combines self evaluation with scrutiny from outside’ (Ofsted, 2006, p. 8). This relationship between self evaluation and inspection was acknowledged in the interim report for this evaluation which concluded that:
the majority view was that the impact of the inspection was primarily focused on the confirmation and validation of the school’s self evaluation, [and] it is important to acknowledge that it is precisely in this capacity that it contributes to school improvement. (McCrone et al., 2006, p.76).2
1.2 Aims and objectives It was in this context, at the end of the first year of s5 inspections, that Ofsted commissioned the National Foundation for Educational Research (NFER) to undertake a large-scale independent evaluation of how, if at all, the inspection process and outcomes have assisted with the development of school effectiveness and school improvement. The evaluation aims were: • to establish the differences, if any, in school effectiveness, including the
range of pupil outcomes, resulting from s5 inspection
• to identify the elements of the inspection process and contextual factors that affect the extent of difference made by inspection
The methodology used for the evaluation is outlined below.
1.3 Methodology In order to achieve the aims of the evaluation a range of research methods were adopted, as outlined below: Desk-top review Analysis of the key documents for the 36 case-study schools was carried out. These documents included: • The s5 inspection report
• The Performance and Assessment (PANDA) report (including Contextual Value Added data)
2 McCRONE, T., RUDD, P., BLENKINSOP, S. and WADE, P. (2006). Impact of Section 5
Inspections: maintained schools in England (Interim Report). Available at: http://www.ofsted.gov.uk/assets/Internet_Content/Shared_Content/Files/impacts5.pdf [13 April, 2007].

Introduction
3
• The completed Self-Evaluation Form
• The DfES’s Achievement and Attainment tables.
Analysis of these documents provided both a contextual background for the case-study schools and, in consultation with Ofsted, an analytical framework in which examination of the data could be carried out. The categories used for the analysis were the same as those used in the pilot evaluation and were drawn from the Guidance for Inspectors of Schools (Ofsted, 2006), the Standard Inspection Report Template (Ofsted, 2005) and other sources.3 In addition pupil outcomes and Contextual Value Added (CVA) or Value Added (VA) scores from the case-study schools visited in both the pilot and the large-scale evaluations (a total of 72 schools) were analysed. The impact of inspection on outcomes in these 72 schools is explored in Chapter 5. Fieldwork visits Semi-structured interviews with headteachers, senior managers and governors in each of the 36 schools were a central part of the main research study. These visits provided interviewees with an opportunity to comment on the usefulness of their s5 report, and the recommendations made, in relation to their school effectiveness and improvement processes. Each school was sent an approach letter and a request for interviews with: • the headteacher
• one or two other school senior managers
• a governor.
In addition, each school was asked to select a group of pupils for the research team to interview. Up to eight pupils were interviewed in each group. It was requested that pupils would be representative of the school population in terms of age, gender and ability. Where school councils existed, it was requested that some of the members would be included in the groups as it was considered likely that they would have had involvement in the inspection process. Paired interviews were conducted with pupils in special schools. Interviews were also carried out with parents in case-study schools. With the school’s permission, letters were sent out to the parents of the pupils involved
3 OFSTED (2006). Using the evaluation schedule: Guidance for inspectors of schools. Available at:
http://www.ofsted.gov.uk/assets/Internet_Content/Shared_Content/IIFD/Files/usingTheSchedule.pdf [13 April, 2007]; OFSTED (2005). Inspection Report Template. Available at: http://www.ofsted.gov.uk/assets/Internet_Content/Shared_Content/IIFD/Files/inspectionReportTemplate.pdf [13 April, 2007].

Impact of Section 5 inspections: maintained schools in England: Final report
4
in the group discussions inviting them to participate in a telephone interview about their views on the school and the Ofsted inspection. The school visits were carried out in September and October 2006. Either the headteacher or a senior manager in the schools was subsequently re-interviewed in January or February 2007. The fieldwork visits were carried out by the ‘core’ research team, plus additional NFER researchers. The interview data was analysed systematically in order to establish any trends in experiences of the inspection process, and any patterns in post-inspection school improvement strategies. The follow-up interviews also provided a view on the impact of the inspection recommendations and the update of the SEF over time.
Questionnaire survey A survey, sent to all schools inspected between October 2005 and March 2006 was carried out between October and November 2006. Schools which had been or were to be visited by the NFER were excluded from the list, as were schools included in the pilot questionnaire survey. Schools on special measures were excluded but all other schools graded ‘1’ to ‘4’ were included. In addition schools that had responded to Ofsted’s own evaluation were excluded. The questionnaire was predominantly quantitative in nature, but also incorporated some open-ended questions. Questionnaires were sent to headteachers in the sampled schools, with a request that they should either fill them in themselves or delegate to another senior manager who had been closely involved in the inspection (details of the achieved sample are provided below).
1.4 The school sample A representative sample was drawn for the case-study schools, while the entire population of schools inspected between October 2005 and March 2006 was surveyed (subject to the limited exclusions outlined above). Case-study sample Datasets were provided by Ofsted of all schools inspected from October 2005 to March 2006. A random representative sample of 36 schools for the case-study visits was drawn, stratified on the following criteria: • school sector – secondary, primary and special
• geographical region – based on nine government office regions
• overall inspection grade (grade 1 ‘outstanding’, grade 2 ‘good’, grade 3 ‘satisfactory’, and grade 4 schools ‘notice to improve’).

Introduction
5
The achieved sample consisted of 16 secondary, 16 primary and four special schools. In terms of overall inspection grades there were three grade 1 ‘outstanding’, 16 grade 2 ‘good’, 14 grade 3 ‘satisfactory’ and three ‘notice to improve’ schools. The survey sample All schools, visited by Ofsted between October 2005 and March 2006 inclusive (apart from the limited exclusions mentioned previously), were selected for the survey. A total of 2,309 schools were invited to participate and a response rate of 67 per cent, or 1,597 schools, was achieved. This was a very positive response rate and, as well as enabling the research team to access a large amount of robust survey data, was indicative of the fact that the majority of school managers were pleased to have an opportunity to express their views about inspection and its impact on their school. The most frequent reason given for non-response was from schools who had a new headteacher in the academic year and who felt that there was not another appropriate member of staff who could complete the questionnaire. Characteristics of the respondents The achieved survey sample of schools was representative of the full population of schools across size of school, achievement bands, school types, and eligibility for free school meals. In terms of the date that the inspection took place, 42 per cent were inspected between 1 October and 31 December 2005, 25 per cent between 1 January and the 14 February and 32 per cent between 15 February and the 31 March 2006. The overall effectiveness grade for 11 per cent was ‘outstanding’, 34 per cent were graded ‘good’, 48 per cent ‘satisfactory’ and seven per cent ‘notice to improve’. The majority of survey questionnaires were completed by headteachers, as can be seen in Table 1.1 below. Respondents were experienced teachers having a mean of 26 years experience.
Table 1.1 Role in the school
Role in school %
Headteacher 92 Deputy Head 4 Assistant Head 1 Other 2 No response 1 N = 1597 Due to rounding, percentages may not sum to 100 1580 respondents answered this question Source: NFER Impact of Section 5 Inspection School Survey 2006

Impact of Section 5 inspections: maintained schools in England: Final report
6
Characteristics of interviewees In total, 167 adults linked with the 36 case-study schools were interviewed. The interviewees consisted of: • 36 headteachers
• 53 senior managers of which 21 were deputy heads, and seven were assistant heads
• 34 governors of which 22 were the Chair of governors
• 44 parents.
In addition, 116 primary pupils from Years 2 to 6, 101 secondary students from Years 8 to 11 and 26 students from special schools were interviewed. Senior staff in 32 schools gave follow-up interviews four months subsequent to the first interview.
1.5 Structure of the report The remaining chapters of this report focus on the impact of different elements of the s5 inspection. They are organised in the follow sequence: Chapter 2 examines the impact and updating of the Self-Evaluation Form, the dialogue between inspectors and teachers and the oral feedback. Chapter 3 explores the impact of the written inspection report, the letter to pupils, the diagnosis and the inspection grades. It further examines discrepancies in grades between the s5 report and the SEF and looks at levels of agreement about schools’ strengths and weaknesses. Chapter 4 considers the impact of the s5 inspection on school improvement. It discusses Ofsted’s recommendations and the actions that followed on from the inspection. It also examines the perceived contribution of the inspection to school improvement, and any progress reported in school improvement. Chapter 5 reports on the impact of actions subsequent to inspection and any impact on test and examination results. It also presents quantitative and qualitative evidence of impact and incorporates a section on statistical modelling. Chapter 6 presents an overview of the schools’ perspectives. It examines the schools’ overall satisfaction with the inspection and the main perceived benefits and concerns. This chapter also summarises what respondents have

Introduction
7
said about ways in which the inspection could be improved, and expectations with regard to the next inspection. Chapter 7 concludes the report by drawing out the main findings and implications from the case-study interviews and the survey data.

Impact of Section 5 inspections: maintained schools in England
8

The inspection process
9
2. The inspection process
Key findings • Although perceived as time-consuming to complete by the majority (three-
quarters) of interviewees, the Self-Evaluation Form was perceived to be effective at identifying school strengths and weaknesses by the vast majority of respondents (97 per cent). It provided focus for the inspection (two-thirds of interviewees) and for the schools’ self evaluation (three-quarters of interviewees). Self evaluation was regarded as having improved and the SEF framework had contributed to this improvement. Statistical modelling revealed that receiving appropriate guidance on SEF completion contributed to overall satisfaction with the inspection process.
• SEF completion was considered to be a collaborative exercise with SMT and, to a lesser extent, governors involved in the process. Although many schools had not altered the way in which they approached the SEF, there was some evidence that, subsequent to first inspections, a more distributed approach to self evaluation and SEF completion had been adopted in some (five) of the case-study schools. In addition, over half of headteachers were motivated to produce a more concise, evidence-based SEF.
• The modelling revealed a positive statistical relationship between constructive oral feedback and overall satisfaction with the inspection process. Two-thirds of case-study respondents found the feedback useful, they valued the explanatory dialogue, the direction and guidance offered by inspectors, the confirmation and validation of the SEF and the general reassurance that the oral feedback provided.
• A minority of case-study schools (five) reported disputes. Where these occurred they centred on school perceptions about the inflexible interpretation of data, a lack of consideration of school context, and a view that the grading system was too rigid and structured.
This chapter commences by examining the involvement of school staff, pupils and parents in the inspection process. It also considers the experience of completing the Self-Evaluation Form (SEF), the success of the inspection process in identifying the school’s strengths and weaknesses, the helpfulness of the SEF as a vehicle for self evaluation, and how, if at all, the SEF has been updated since inspection. It also explores perceptions of the oral feedback and the extent to which disagreements, if there were any, were resolved.
2.1 Stakeholder interviewees’ involvement in the inspection All headteachers said that they were heavily involved in the inspection, from SEF completion to the oral feedback. All of the senior managers interviewed

Impact of Section 5 inspections: maintained schools in England
10
felt involved either as a member of the senior leadership team, or, for example, in their capacity as subject leader or with regard to child protection or behaviour and discipline. Many said they contributed to the SEF, helped in the lead up to the inspection and were ‘on hand’ during the inspection. Some interviewees were observed teaching by inspectors and felt that this experience had been worthwhile: ‘The inspector observed me teaching half a lesson. He gave me individual feedback which was useful and fair’. However, others would have liked more feedback from the inspectors, as in the case of a senior teacher in an ‘outstanding’ school who had to ask for feedback, and was then only given some from a colleague. Several members of the senior management team (SMT) commented on the fact that they were formally interviewed and some felt that the discussions were ‘very short and sharp’. Others would have liked to have been more involved ‘they didn’t really want to see me, so I had to impose myself on them. I had produced three files and made sure that they did get to see them’. Similarly another senior manager said he had ‘very little involvement – I actually had to ask for a meeting and I did then have an interview’. In the majority of case-study schools the chair or vice-chair of governors had been interviewed by the inspectors. Levels of involvement varied from extensive: ‘I work at the school as well as being a governor so I get it from both sides. When the inspectors came I was in two of the classes which they observed’, to moderate; ‘I was involved in helping to write and compile the SEF prior to the inspection. I greeted the inspectors on the morning of the inspection and was present throughout the inspection in order to support the staff’, to minimal; ‘I had no involvement at all. The only involvement was that I was invited to the feedback’. A few governors noted that inspectors’ questions were searching: ‘I found the inspector’s questions to be challenging and focused’. Two governors observed that the s5 inspection required less time commitment from governors compared to previous inspections. The majority of pupils interviewed recalled the inspectors visiting their school, and a few remembered such things as ‘being told to behave on that day’. One secondary student recollected: ‘it was a normal day except that everyone was on their best behaviour’, while a primary pupil stated that the day before the inspection the pupils were told to: ‘look happy and if the inspector asks you anything, remember, …only good stuff!’ Many students reported speaking to the inspectors. They recalled that they discussed things such as how the school dealt with bullying, whether they found the work easy or hard, did the work interest them and did the pupils get help when they felt they were struggling. One primary pupil recalled: ‘We

The inspection process
11
were in school council when they talked to us, they asked us what do you like about the school and what don’t you like? They asked about the sports we do here and about anti-bullying’. Many pupils recalled that the inspectors visited their lessons and for most this appeared to have been an unremarkable experience. Numerous pupils talked as if they were largely indifferent to having inspectors in their lessons, indeed one primary pupil showed a mature attitude to the experience: ‘We were just ourselves, this isn’t a perfect school, we have the odd problem but it was fine’. Although, for a few, it made more of an impression. For example, one boy found it ‘quite annoying’ being observed, whereas a primary pupil said: ‘It was really scary because they walk around and look at you and they stand behind you and watch what you’re doing and it makes you feel nervous’. Nearly all of the parents interviewed were aware of the inspection, but most had not been involved in it, although a minority recalled completing a questionnaire for the school or the inspectors. Two parents reported having spoken to the inspectors and two more commented on the fact that they would have liked to have been more involved. One commented: ‘there’s not the same opportunity to talk to inspectors as before [in previous inspections]’.
2.2 Completion and usefulness of the Self-Evaluation Form
Completion of the SEF The vast majority of survey respondents (90 per cent) completed the SEF before inspection as can be seen in Table 2.1 below.
Table 2.1 Extent to which Part A of SEF completed prior to the inspection
Completion of Part A of SEF %
Fully completed 90 Partially completed 9 Not at all completed 1 No response 1 N = 1597 Due to rounding, percentages may not sum to 100 1584 respondents answered this question Source: NFER evaluation of the impact of Section 5 Inspection School Survey 2006
Similarly, the SEF was completed in most of the case-study schools visited. Most interviewees (three-quarters) found the process to be time consuming but worthwhile, as a deputy headteacher pointed out: ‘We spent a lot of time on it, hours and hours of time. But it was an incredibly useful process. We held an offsite meeting. It was a bit of an obsession’. Furthermore, there was an

Impact of Section 5 inspections: maintained schools in England
12
awareness that the development of the SEF for the first time was time-consuming but subsequent updates would be less onerous, as a secondary headteacher explained: ‘It did divert a huge amount of time to get that first SEF going – but we’re now in the process of reviewing and now it’s a case of updating stuff we’ve already got’. Updating of the SEF is explored in more detail in Section 2.3. However, a few interviewees were not convinced that the time spent compiling the SEF was time well-spent. A headteacher from a primary school graded ‘3’ stated: ‘I think the document is too detailed and took too much time to complete’. Another primary headteacher, from a school graded ‘good’, agreed: ‘Writing the SEF was not hugely helpful because it was very time consuming and didn’t give anything not already known – it was just a case of putting everything into one document. I haven’t revisited it since’. The 18 survey respondents (one per cent) who had not completed the SEF prior to the inspection, were asked what other data or documents were used by the school and the inspectors as part of the dialogue. The following sources were drawn upon: • PANDA (12 respondents)
• other attainment data (12 respondents)
• school’s own self-evaluation sources (11 respondents)
• school development plan (ten respondents)
• parent questionnaires (ten respondents)
• pupil questionnaires (nine respondents) and the
• old SEF (six respondents).
Survey respondents were also asked about their experiences of, and involvement of others in, completing the SEF. As can be seen in Table 2.2 below the experience was viewed as a collaborative one with, in most cases, school colleagues and governors contributing to the process. Three-quarters of all respondents reported that the SEF was completed by the headteacher and the SMT, although approximately one in ten (12 per cent) of headteachers completed the SEF alone. Case-study data indicated that, subsequent to inspection, the proportion of schools involving more staff in updating the SEF, had risen.

The inspection process
13
Table 2.2 Experiences of completing the Self-Evaluation Form
Experience of completing SEF Yes %
No %
No response%
I and/or other staff were assisted by an independent consultant 16 65 20
I and/or other staff attended LA training on how to complete the SEF 58 29 13
The SEF was completed by the Head alone 12 66 22 The SEF was completed by the Head and Senior Management Team 75 16 9
Staff were consulted about the SEF 86 6 8 Staff had input into the SEF 80 12 9 Governors were consulted about the SEF 85 8 8 Governors had input into the SEF 62 24 14 The SEF was completed at the last minute prior to inspection 14 66 20
The SEF was completed in good time before inspection was notified 74 17 10
There was appropriate guidance for completing the SEF 62 25 13
N = 1597 Due to rounding, percentages may not always sum to 100 A total of 1245 respondents answered at least one item in this question Source: NFER evaluation of the impact of Section 5 Inspection School Survey 2006
In comparison to the pilot survey, more respondents reported that the SEF was completed in good time before the inspection (67 per cent in pilot and 74 per cent in main evaluation), and fewer respondents expressed a view that they had not received appropriate guidance on completing the SEF (34 per cent compared with 25 per cent). The statistical modelling analysis revealed that survey respondents who felt that they had received appropriate guidance on SEF completion were more likely to be very satisfied with the inspection overall (see Section 5.4 for more detail). Usefulness of SEF Just over one half of survey respondents felt that the self-evaluation process was ‘very effective’ at identifying the school’s strengths and weaknesses, as can be seen in Table 2.3 below. The SEF was seen as a ‘very helpful’ vehicle for self evaluation by almost half of respondents, and another half expressed a view that it was ‘somewhat helpful’, as can be seen in Table 2.4 below.

Impact of Section 5 inspections: maintained schools in England
14
Table 2.3 Effectiveness of the self-evaluation process in helping to identify the school’s strengths and weaknesses
Identifying strengths and weaknesses %
Very effective 55 Somewhat effective 42 Not at all effective 3 No response 1 N = 1597 Due to rounding, percentages may not sum to 100 1584 respondents answered this question Source: NFER evaluation of the impact of Section 5 Inspection School Survey 2006
Table 2.4 Helpfulness of the SEF as a vehicle for self evaluation
Helpfulness of SEF %
Very helpful 47 Somewhat helpful 48 Not at all helpful 3 No response 1 N = 1597 Due to rounding, percentages may not sum to 100 1580 respondents answered this question Source: NFER evaluation of the impact of Section 5 Inspection School Survey 2006
This picture of the SEF as an effective and helpful means of self evaluation was generally endorsed during the 36 case-study visits. Interviewees were asked how the inspection team had made use of the SEF. Over half of the interviewees felt that the SEF offered a good insight into the schools’ performance to the team and that the inspection was based on the SEF and the PANDA. It was generally reported that inspectors used the SEF as a source of data for an examination of the school’s own self evaluation. Inspectors’ judgements were then matched against those of the school. Furthermore, interviewees in the majority (two-thirds) of schools believed that the SEF provided focus for the inspection team. A headteacher in an infant school commented that: ‘It [the SEF] had informed their judgements and they were just checking and sampling that what we had said was the truth’. Another headteacher, in a secondary school, agreed that it was used to provide a focus in that it supplied a checklist: ‘They are checking judgements in the SEF. If there’s a mismatch then the problem comes. They use it as a checklist’. One governor of a secondary school felt that, not only did the SEF provide a focus for the inspection, but it also gave direction for future development: ‘It provided a more objective focus for what they were doing. It was also a way of identifying what needed to be done and where resources should be prioritised’.

The inspection process
15
Most comments about how the SEF provided focus for the inspection team and the way in which the team used the SEF, were positive. A governor, for example, explained that: ‘They used the SEF as a way of giving them some sense of focus, but I wasn’t under the impression that it railroaded them in a certain direction. I thought they were quite capable of seeing outside and beyond it’. However, one headteacher felt that the inspectors provided too much direction: ‘we feel that’s something that’s crept into s5 – that they’re telling us how to improve’. This concept of inspectors’ provision of advice with regard to school improvement is further explored in Section 2.4. Various headteachers and senior managers believed that the SEF formed the basis of the Pre-Inspection Briefing (PIB), and in the PIB the team identified the areas to be investigated further. This method was generally perceived to work well, however the headteacher in one special school was not quite so sure as, although he felt certain that the inspector had read the SEF: ‘when he phoned up [pre-inspection] and told me their hypothesis, I couldn’t see where it had come from’. In a few cases some school staff felt that the inspection team had not fully utilised the SEF, which led to feelings of frustration with the inspection process. The following examples are from schools graded ‘3’ or ‘4’.
Case studies: SEF perceived to be not fully used by inspectors 1. One headteacher, in a primary school graded ‘satisfactory’, felt that the
whole inspection ‘was a rush and too data driven’ and that the information in the SEF was not fully ‘absorbed – it was all too coloured by the key stage 2 results’. As a consequence, the contribution the inspection made to school improvement was limited as the recommendations were, in the school’s view, too focused on improving key stage 2 results.
2. In a different primary school, also graded ‘satisfactory’, the headteacher felt that there ‘was a lot there [in the SEF] for the inspection team to pick up on, but not all of this made it into the final report’. He gave the example of science being as good as reading, and writing standards (especially at key stage 1) which were generally thought to be high. He was disappointed that these factors, evident in the SEF, were apparently not reflected in the report.
3. In a third school a senior manager, in a secondary school given ‘a notice to improve’, said that the inspection team ‘used it [the SEF] to bash us round the head with’. The main issue for them was the sixth form, ‘we knew that the sixth form outcomes were not good enough’. But the interviewee maintained that the school had been very honest and ‘they [the inspection team] said we didn’t know the school and got it wrong’.
As well as being a valuable document for the inspectors, interviewees in most case-study schools (three-quarters) also remarked on the benefit of the SEF from the school perspective. Completing the SEF was perceived to be a

Impact of Section 5 inspections: maintained schools in England
16
worthwhile process because it helped schools to focus, provide evidence and inform school improvement. One headteacher, in a primary school graded ‘3’, observed: ‘It’s helped to put everything together in one place, provide a picture of where we are. It brings everything together so you can see the school as a whole; I think it’s a very good tool. It’s time-consuming, but valuable’. SEF completion also enabled schools to ‘analyse practice’; it was perceived to be ‘the most useful part of the inspection process’, and the SEF was considered to be ‘a reflective tool’, one that was ‘interesting and revealing’ and helped ‘to focus the mind on the strengths of the school and what one might want to work on in the future’. It was seen, by a senior manager in a pupil referral unit (PRU), as ‘good for harnessing things. It was useful for the school. I felt you could feel things moving tangibly forward with it’. Staff in a few case-study schools (seven) commented on the contribution of the SEF, from the schools’ perspective, towards increased self-awareness. A member of the senior management team (SMT) in a secondary school graded ‘good’ observed: ‘A strength of the new system is that they [the inspectors] are saying ‘you judge yourself and we will seek to verify the quality of your judgement’. That has strengths. It places the responsibility on us. Having self knowledge [through self evaluation] is significantly more important than any inspection’. Similarly a governor, in a secondary school graded ‘outstanding’ admitted that he was ‘quite cynical’ about the process before it started, but concluded that the SEF was ‘quite good at making us sit down and assess ourselves’. Other comments included:
I think the inspection itself was so much less stressful this time because of the SEF. When I think of all the things I have to write for the education department, the SEF is perhaps more useful than the others. It’s very obvious that there are lots of things happening as a result of the SEF in terms of individual departments doing their own self evaluations. So I think the process is snowballing.
As can be seen in Table 2.5 below, over four-fifths of respondents believed that the inspection confirmed the school’s own evaluation and provided valuable confirmation of the SEF. Those respondents who strongly agreed that the s5 inspection provided valuable confirmation of the SEF were more likely to be very satisfied with the inspection (see Section 5.4 for more detail). Only a quarter (26 per cent) of respondents expressed a view that the inspection relied too heavily on the SEF. Of those, the respondents who strongly agreed (five per cent) that the s5 inspection relied too heavily on the SEF also

The inspection process
17
expressed a belief that the inspection had not contributed to school improvement.
Table 2.5 Levels of agreement with views about self evaluation
Self evaluation Strongly agree
%
Agree
%
Disagree
%
Strongly disagree
%
No response
The s5 inspection just confirmed our own evaluation 38 47 12 1 1
The s5 inspection provided valuable confirmation of our SEF
35 47 13 2 2
The s5 inspection relies too heavily on the SEF 5 21 62 10 3
N = 1597 Due to rounding, percentages may not always sum to 100 A total of 1551 respondents answered at least one item in this question Source: NFER evaluation of the impact of Section 5 Inspection School Survey 2006
Staff in 32 of the 36 case-study schools were re-interviewed approximately four months after the initial visit by NFER researchers. The next section examines how these schools revised the SEF after the inspection, and considers interviewees’ reflections on the ongoing SEF completion process.
2.3 Update of the SEF SEF revision Staff in approximately two-thirds of the case-study schools revisited had continued to update the SEF. Some interviewees had only just started that update, or had only made small amendments. As one headteacher explained: ‘Yes [I have started to update the SEF], but not a lot, there’s always something more important to do. I planned to take one section per month but so far it has just been me tinkering with it’. Others said redrafts had been on paper and that they had not updated online yet. Two headteacher interviewees reported that they had ‘dramatically’ overhauled the SEF, as can be seen in the example below. A number of headteachers explained that they updated the SEF when they received more information or evidence: they commented that it was an ‘on going process’, and that in some cases the SEF needed ‘streamlining’ because it was ‘comprehensive and very wordy’.

Impact of Section 5 inspections: maintained schools in England
18
Case study: Update of SEF One senior manager from a primary school graded ‘good’ explained: ‘We have gone through every section and updated it in regard to our results from last summer. We haven’t changed the parents section yet, we want to get feedback from our parent questionnaires first. We’ve updated the leadership and management section and the main priorities for improvements. Other priorities include points like improve procedures for assessment and recording, improve aspects of health and safety through joining a healthy schools initiative, raise standards through emotional aspects of learning and improve teaching and learning in the Foundation Stage. We’ve raised the percentage targets at key stage 1. Our 2006 results were higher than the national results’.
Several school interviewees stated that they had not updated the SEF subsequent to the inspection, and a few mentioned that they were waiting for RAISE on-line information but that some of it was not available. Interviewees were asked in what way they had changed their approach to self evaluation, and whether their approach to the update of the SEF would be different from the initial completion. For just over a half of those who had updated their SEFs, the change involved streamlining the SEF because it needed to be briefer. One interviewee expressed an intention to ensure that the SEF, in the future, would be ‘a lot less descriptive and more analytical’. This theme of a more concise, succinct and evidence-based SEF was common, as can be seen in the examples below.
Case studies: providing more focus in the SEF 1. The headteacher in one small special school, inspected before
Christmas, said: ‘It took a lot of time to complete, it was a bit daunting at first. I’m now putting in more bullets, more evidence, less narrative. When you first do it, it’s like writing an MA dissertation. It gets a bit easier each time’.
2. The headteacher in a primary school graded ‘satisfactory’ reported: ‘We have changed our approach. It [the SEF] has become more focused. It’s more time-consuming but more focused. It’s now evidence-based. Target setting across the board gives us good evidence across all years… It was painful for some teachers but we needed to do this to achieve results later on. Now we have clear expectations for each year in English and maths’.
Some headteachers felt more knowledgeable about the SEF and what it represented. As one explained: ‘I think we’ll try to be more concise. We can do this because we now have a better understanding of the SEF and what it requires. Initially, we saw it as a kind of bolt-on to what we were doing, but now we’d see it as a tool to drive planning and school improvement’. This enhanced understanding, in turn, had in some cases brought about more effective self evaluation: ‘it has made me think more about the evidence for all

The inspection process
19
statements – makes using the data more effective as we focus on specific groups and progress across year groups.’ Headteachers in several (six) schools explained that the updating of the SEF had changed as more staff were involved and trained to complete different sections: ‘it has raised issues which we may not have addressed before. It is very searching and instigated lots of discussion’. A number of headteachers, subsequent to inspection, delegated the completion of sections of the SEF to subject or department heads. An example of this more apportioned approach to SEF completion is given below.
Case study: More distributed approach to SEF completion One headteacher explained that: ‘The biggest change was that whereas before [the inspection] the SEF would reflect my own judgements, from now on it will reflect those of the whole leadership team’. Although this shared or distributed method of SEF completion was beneficial in many ways, such as subject heads taking ownership of subject areas, it was not without problems as the headteacher explained: ‘the SEF has helped enormously as the framework is better for self evaluation – but the only problem with distributed leadership is how do you pull together all the mini SEFs [from departments]?’
A few interviewees stated that, when updating the SEF, they would: ‘make sure that we put down all the positives and don’t undervalue ourselves’. This observation was not just from ‘good’ and ‘satisfactory’ schools. A headteacher in a school graded ‘outstanding’ felt she had ‘a little more confidence’ because she was ‘more familiar and confident with the terminology that defines ‘outstanding’’. SEF framework A quarter of schools felt that the SEF provided a useful formal framework for self evaluation, and half felt that self evaluation had improved and that the SEF was significant to this improvement. As one headteacher explained: ‘It gives you a framework to conduct the self evaluation, a structured approach… it works well’. The SEF provided the framework which enabled them to do a ‘good job’ by, for example, ‘drilling down to department level’. A couple of schools, graded ‘good’, were very enthusiastic about the SEF: one headteacher felt that it was ‘more important than the inspection itself’, and another expounded:
I think the SEF is the best thing since sliced bread! It’s tough and time-consuming to do, but it’s a good exercise. It helps you get to know your school. Self evaluation hadn’t come to fruition until the SEF. The inspection doesn’t reflect all the achievements of a school.
A small minority of schools, all graded ‘good’ or ‘satisfactory’, felt that the SEF would benefit from improvements. There was a view held by a few

Impact of Section 5 inspections: maintained schools in England
20
headteachers that the SEF was ‘repetitive in parts’ and that ‘it is still hard to judge where to put information, it is still tempting to put information in every place you feel it perhaps should go, and this can result in an overlong SEF’. SEF influence on inspection The majority (three-quarters) of headteachers believed that the content of the SEF influenced the outcome of the inspection. At the very least the inspectors used it for ‘a baseline’ for the inspection: ‘lack of time means the inspection team is reliant on the SEF’. In some cases, as outlined below, the content of the SEF was perceived to be the most important aspect of the inspection.
Case study: Influence of SEF content on inspection While most schools regarded the SEF as influential, a few believed it to be extremely powerful in determining the inspectors’ view of the school. One headteacher said: ‘They have virtually written it [the report] before they come, based on the SEF’. Another believed: ‘the SEF heavily influences the outcome of the inspection, the inspectors’ minds are almost made-up before they arrive’.
Furthermore, some headteachers felt the SEF played ‘a part in shaping the inspectors’ views’ by, for example, ‘telling inspectors what to look for’. One primary headteacher explained what had happened during the course of the inspection:
The inspectors take up what’s in it [the SEF], we made one mistake, we made no mention of multi-cultural education. It’s embedded here, we do it, but it was an oversight. But we got stung for it. We will address that in the SEF.
A minority of schools perceived the language, the tone of the language, and the grades used in the SEF, to have influenced inspectors. Senior staff in one school had re-written the document, subsequent to inspection, in a ‘positive language, as we felt the language we used in the first SEF may have led the inspectors to make certain pre-emptive judgements before even seeing the school’. This positive tone also related to the grades. One headteacher in a pupil referral unit observed: ‘If you put down ‘satisfactory’, they [Ofsted] may well look for ‘satisfactory’! All our grades [in the SEF] are ‘good’ now!’ Staff in two schools, however, felt that the SEF contributed little to the inspection outcome, and that the inspection teams that had visited the schools were more influenced by what they saw and the attainment evidence. One headteacher felt that ‘the PANDA report, more than anything, had influenced the outcome of the inspection’.

The inspection process
21
2.4 Oral feedback and dialogue Oral feedback As well as the headteacher, the vast majority of case-study schools had members of the senior management team present for the oral feedback from the inspection team. Additionally, interviewees at half of the schools recalled local authority advisers or representatives had also been present. In most cases the chair, or vice-chair, of governors also attended. The majority (60 per cent) of survey respondents found the oral feedback to be ‘very useful’, and a further 32 per cent found it to be ‘fairly useful’. It was evident that the oral feedback was a very important stage of the inspection process as school staff valued the verbal input (see Table 2.6).
Table 2.6 Usefulness of the oral feedback
Usefulness of oral feedback %
Very useful 60 Fairly useful 32 Not at all useful 8 No response <1 N = 1597 Due to rounding, percentages may not sum to 100 1591 respondents answered this question Source: NFER evaluation of the impact of Section 5 Inspection School Survey 2006
Furthermore, the statistical modelling (see Section 5.4 for more detail) revealed a positive statistical relationship between finding oral feedback very useful and overall satisfaction with the inspection. Three-quarters (76 per cent) of respondents who found the oral feedback ‘very useful’ were ‘very satisfied’, whereas only four respondents who found oral feedback very useful were ‘not at all satisfied’ with the inspection. Similarly, three-quarters (75 per cent) of those who found oral feedback ‘not at all useful’ were ‘not at all’ satisfied with the inspection, whereas only three respondents who found oral feedback ‘not at all’ helpful were ‘very’ satisfied with the overall inspection. Satisfaction with the inspection process is further explored in Section 6.1. Interview responses from the 36 case-study schools largely confirmed these views on the importance of the oral feedback. Interviewees in approximately two-thirds of schools found the oral feedback to be very useful. Oral feedback was perceived to be useful in four main ways. • The oral feedback provided an explanation behind the report findings.
This was the case with one headteacher who appreciated ‘being able to talk around things’, while another said ‘we were told about things not in the report’. It was also perceived as providing illumination, as a governor

Impact of Section 5 inspections: maintained schools in England
22
described: ‘it provided an explanation of why they [the inspectors] put in what they did’. Further comments included:
I found it really useful as they go through the draft report with you and it was explained with examples and we talked it through.
It was very useful – it was more meaningful than the written report, which seemed a very cut-down version of the feedback we were given. We needed that explanation.
The oral feedback was very useful, it told the school exactly where the inspectors were in their thinking and enabled the school to respond to that.
• Feedback was useful as it provided direction. As one governor described:
‘we readjusted our priorities slightly’ in the light of the feedback. An interviewee from a school graded ‘notice to improve’ said ‘we knew what we had to do and were able to start straight away, the negative feedback prompted us to do something quickly’. Other examples of the provision of direction and advice for school improvement included:
It gave us additional momentum to tackle the areas we had already identified as needing improvement.
It helped to crystallize and cement our views. No immediate action was taken but a lot of actions were in process and we have continued with those,… the inspectors developed a very accurate view of the school. It did draw attention to a couple of issues that needed to be pushed up the priority ladder.
It was about areas that we had already identified with one or two pointers, one or two tweaks and a few ideas from the inspector. He was very good in that the inspection report is quite short, but he was offering advice as well as inspecting.
• It provided confirmation that the school and the SEF were on track.
School staff and governors were encouraged by the receipt of oral validation of the SEF. The following are typical examples:
it confirmed what we thought, it validated what we thought were our strengths and areas of improvements needed.
I think it confirmed for us the areas that we needed to work on. We had a rough idea as a staff anyway. When I came here as head I had a lot to do and I wanted to get everyone into working as a team. We had one failing teacher at the time and they [the inspectors] picked up on that but it was something we were aware of.
• Finally school staff and governors found the oral feedback provided reassurance. It provided ‘closure’ and ensured that there were ‘no surprises’ in the written report. Many interviewees also commented on the fact that they liked receiving oral feedback quickly, and in a couple of cases it prompted immediate action, as can be seen in the examples given below:

The inspection process
23
One of the issues was attendance, and we wrote to parents shortly after the inspection saying that their children must attend. We also clamped down on holidays in term time.
We did take action in terms of one of the things that they found – it was about risk assessments and we hadn’t realised that we had let it go – They highlighted this and we were able to then put it in place, so that was an immediate action.
Staff in five schools (all graded 3 or 4) did not find the oral feedback helpful or useful. (Four of these schools were inspected in October or November 2005, the fifth in February 2006.) In three cases schools believed that the inspectors had relied too heavily on data as the following comments illustrate:
Judgements were made without the full picture. It was intimated that we didn’t know the children’s progress…. They [Ofsted] were too reliant on documents. They said we didn’t get children’s comments, but we do involve children all the time. We check their understanding.
The oral feedback was negative, destructive and an inaccurate representation of their findings [which were based on] a shallow interpretation of data and was unbalanced.
In another school the headteacher found the oral feedback unhelpful as she found there was not enough time and the feedback was ‘rushed’ allowing little two-way dialogue. She did not agree with the findings and subsequently challenged the report. Another headteacher said that ‘there was very little time for reflection’, and she would have liked more time to respond to the inspection team’s findings. The final school that found the oral feedback unhelpful did so because: ‘It [the inspection] was totally and wholly inappropriate given the state of the school at the time’. The school felt they were given unfair criticism as they were a new school and were still undergoing reorganisation. In all these five cases where the oral feedback was perceived to be unhelpful, there was a common perception that a meaningful dialogue had not taken place between the school and the inspection team. Ongoing dialogue The dialogue between the inspection team and the school staff, during the course of the inspection (prior to the oral feedback), was similarly perceived to be important to a meaningful outcome for the inspection. The following examples illustrate the significance of the positive rapport an effective inspection team can build up with a school.

Impact of Section 5 inspections: maintained schools in England
24
Case studies: The importance of successful dialogue 1. The inspectors were brilliant and I can’t fault them. They kept us fully
updated and a couple of times a day they would drop in to give us feedback.
2. Obviously it is a stressful time and one of our fears was that because it [the inspection] is so short, they [the inspection team] wouldn’t get the full picture. The on-going dialogue was a useful time to ask them have you seen this, or have you seen that? Had we not got that then I’m not sure we would have been happy that they would have got the full picture.
3. I think I developed a very good relationship with the lead inspector. He would ask questions and give suggestions and we would have an opportunity to explain what we do in response. There was that on-going sort of dialogue happening all the time, which was good because it meant it was more developmental.
4. Every maths teacher was seen and the documentation for maths was reviewed and strategies to improve key stage 2 to key stage 3 progress and CVA progress, were examined. There was a lot of dialogue about that and on the first evening the school was able to gather more evidence to demonstrate that since last year’s SATs (the ones in the PANDA) the progress we have made since then, the strategies we have put in place, and the SATs results that will come out after the inspection, will be much better.
Levels of agreement Survey respondents were asked whether there had been any disagreements with the inspection team at the oral feedback stage. The majority (84 per cent) reported experiencing none, or minor, levels of disagreement (see Table 2.8 below).
Table 2.8 Disagreements between the school and the inspection team at the oral feedback stage
%
Yes 9 Partly – but minor issues 29 Partly – but major issues 5 No 55 No response 1 N = 1597 Due to rounding, percentages may not sum to 100 1576 respondents answered this question Source: NFER evaluation of the impact of Section 5 Inspection School Survey 2006
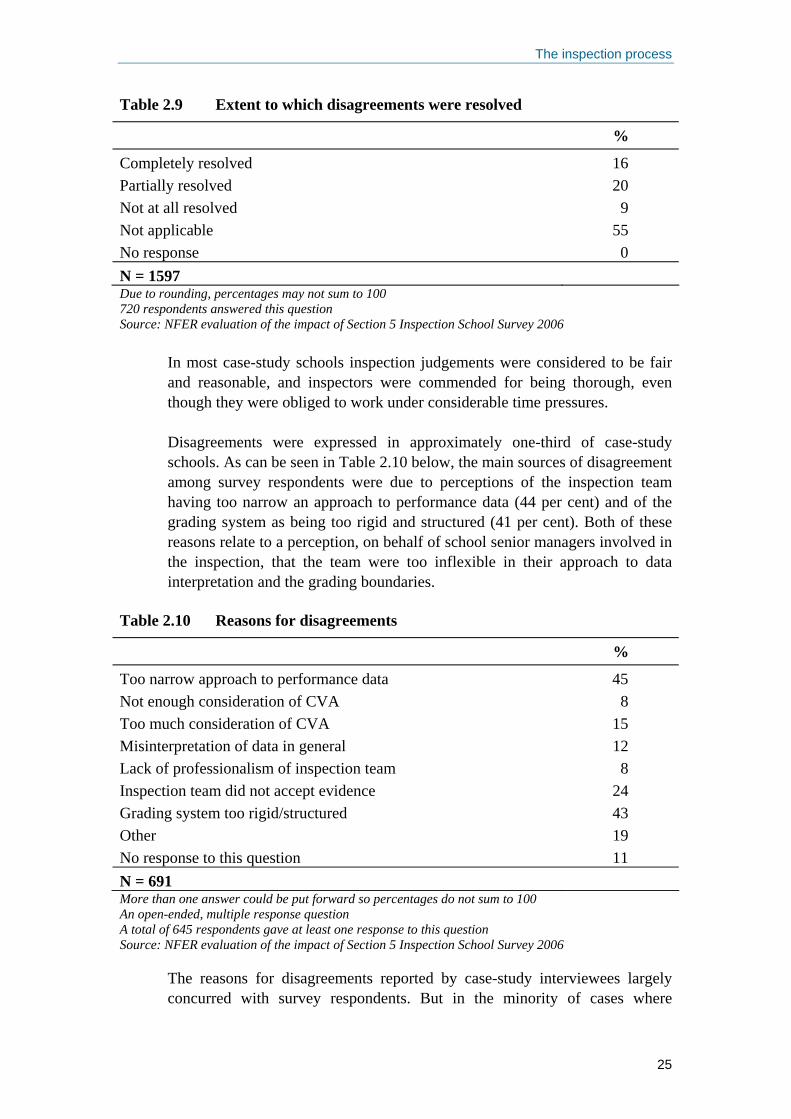
As can be seen in Table 2.9 below, most disputes were resolved and in only one in ten cases did the disputes remain unresolved.
The inspection process
25
Table 2.9 Extent to which disagreements were resolved
%
Completely resolved 16 Partially resolved 20 Not at all resolved 9 Not applicable 55 No response 0 N = 1597 Due to rounding, percentages may not sum to 100 720 respondents answered this question Source: NFER evaluation of the impact of Section 5 Inspection School Survey 2006
In most case-study schools inspection judgements were considered to be fair and reasonable, and inspectors were commended for being thorough, even though they were obliged to work under considerable time pressures. Disagreements were expressed in approximately one-third of case-study schools. As can be seen in Table 2.10 below, the main sources of disagreement among survey respondents were due to perceptions of the inspection team having too narrow an approach to performance data (44 per cent) and of the grading system as being too rigid and structured (41 per cent). Both of these reasons relate to a perception, on behalf of school senior managers involved in the inspection, that the team were too inflexible in their approach to data interpretation and the grading boundaries.
Table 2.10 Reasons for disagreements
%
Too narrow approach to performance data 45 Not enough consideration of CVA 8 Too much consideration of CVA 15 Misinterpretation of data in general 12 Lack of professionalism of inspection team 8 Inspection team did not accept evidence 24 Grading system too rigid/structured 43 Other 19 No response to this question 11 N = 691 More than one answer could be put forward so percentages do not sum to 100 An open-ended, multiple response question A total of 645 respondents gave at least one response to this question Source: NFER evaluation of the impact of Section 5 Inspection School Survey 2006
The reasons for disagreements reported by case-study interviewees largely concurred with survey respondents. But in the minority of cases where

Impact of Section 5 inspections: maintained schools in England
26
significant disagreements occurred these centred around, as discussed above, the overall grades awarded. The grading by inspectors was often perceived to be too rigid and inflexible. Staff in several schools also believed that inspectors adopted too narrow an approach to data, for example ‘they pinned all their judgements on one year’s results’, and especially did not make enough allowance for a weak cohort. The following examples are typical of the minority of schools that expressed this concern.
Case studies: Disagreements over grading 1. The headteacher in a large primary school, which had recently
expanded significantly and had altered its socio-economic profile described how: ‘judgements were based on key stage 2 SATs from 2004 to 2005 when two-form entry had just started. That year group had emotional and behavioural difficulties and the results were no surprise to us. No parent in that year complained about the results, many of the pupils were socially disadvantaged and emotionally needy. The s5 was like a tick box grid, inspectors said ‘if results dropped we can’t say the overall effectiveness grade is anything more than satisfactory’ – but we did achieve what was expected in our SEF, we knew the results would be poor in that year’.
2. In another school the chair of governors said that: ‘there were disagreements’, and he stated that the school had written to Ofsted to indicate that they were completely dissatisfied with the inspection findings. The LA also wrote to complain. The LA representative was present at the feedback session and it was apparent, said this respondent, that she ‘Just couldn’t believe what she was hearing. The LA backed the school’. The chair of governors said that everything seemed to revolve around data, and the school was not good at dealing with and understanding that. ‘So the slogan “Every Child Matters” with regard to the inspection, as far as I could see, didn’t apply – what mattered was the result and added value wasn’t taken into consideration at all’.
Additionally some minor reasons for disagreements were incidences of potentially ambiguous wording used in the written report, these were usually resolved by altering the language. Lastly, some differences of opinion stemmed from inspectors needing documentary evidence to back up a school’s assertions, for example monitoring and evaluation data.

Impact: the inspection report
27
3. Impact: the inspection report
Key findings • The majority (79 per cent) of survey respondents felt that the inspection
findings broadly met the schools’ expectations and this link was strongest amongst schools most recently inspected.
• The majority (71 per cent) felt that the written report was completely consistent with the oral feedback. The findings from the statistical modelling show that those who found complete consistency between the oral and written feedback were more likely to be very satisfied with the inspection overall.
• Two-thirds of survey respondents reported no differences between the s5 and SEF grades. The grades appear to have become more ‘in tune’ the longer the s5 inspection process has been in operation.
• Over three-quarters of case-study schools believed the diagnosis, and the written report, to be fair and accurate, especially in the areas of ‘personal development’ and ‘care and guidance’. However, some schools felt ‘achievement and standards’ grades were sometimes too data-driven. Disagreements over grades stemmed from perceived poor timing of inspection, too much or too little emphasis on data (including CVA), including, at times, a lack of understanding of a school’s context.
• The vast majority (84 per cent) of stakeholders found the written report helpful in identifying areas for improvement and approximately three-quarters found it accurate in identifying strengths and weaknesses. A small minority (five) felt that the inspection teams had not correctly identified the school’s strengths and weaknesses.
• Over half (57 per cent) found the written report helpful for identifying areas for improvement. Furthermore, the statistical modelling analysis revealed that there was a positive relationship between schools who believed the inspection helped to identify priorities and impact on school improvement.
• Parents valued the independent assessment of their schools and the ease with which they could read the report. On the whole the pupil letter was perceived to be a good development and appreciated by pupils.
• The written report was perceived, by the majority of case-study interviewees, to be user friendly, easy to read, concise and useful. A small minority (15 per cent) of respondents, however, found the report to be unhelpful in identifying areas for improvement. Case-study interviewees in six schools thought the report was too brief and generalised.
This chapter examines perceptions of the diagnosis and the inspection grades and the extent to which the headteachers, senior managers, governors and parents believed that the inspection teams correctly identified the schools’ strengths and weaknesses. The pupil letter and the content of the report are
Impact of Section 5 inspections: maintained schools in England
28
also explored, and pupils’ opinions with regard to the letter, in particular, are considered.
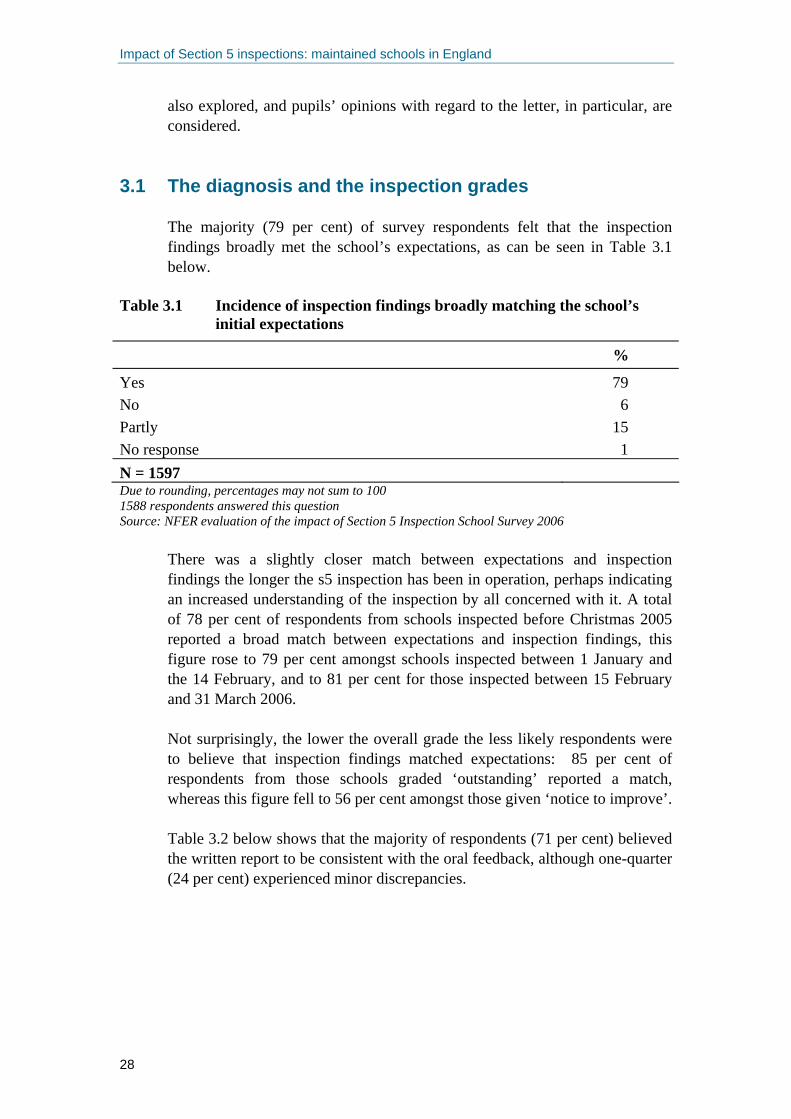
3.1 The diagnosis and the inspection grades The majority (79 per cent) of survey respondents felt that the inspection findings broadly met the school’s expectations, as can be seen in Table 3.1 below.
Table 3.1 Incidence of inspection findings broadly matching the school’s initial expectations
%
Yes 79 No 6 Partly 15 No response 1 N = 1597 Due to rounding, percentages may not sum to 100 1588 respondents answered this question Source: NFER evaluation of the impact of Section 5 Inspection School Survey 2006
There was a slightly closer match between expectations and inspection findings the longer the s5 inspection has been in operation, perhaps indicating an increased understanding of the inspection by all concerned with it. A total of 78 per cent of respondents from schools inspected before Christmas 2005 reported a broad match between expectations and inspection findings, this figure rose to 79 per cent amongst schools inspected between 1 January and the 14 February, and to 81 per cent for those inspected between 15 February and 31 March 2006. Not surprisingly, the lower the overall grade the less likely respondents were to believe that inspection findings matched expectations: 85 per cent of respondents from those schools graded ‘outstanding’ reported a match, whereas this figure fell to 56 per cent amongst those given ‘notice to improve’. Table 3.2 below shows that the majority of respondents (71 per cent) believed the written report to be consistent with the oral feedback, although one-quarter (24 per cent) experienced minor discrepancies.

Impact: the inspection report
29
Table 3.2 Extent to which the written report was believed to be consistent with the oral feedback
%
Completely consistent 71 Partly consistent with minor discrepancies 24 Partly consistent with major discrepancies 4 Not at all consistent 1 No response 0 N = 1597 Due to rounding, percentages may not sum to 100 1591respondents answered this question Source: NFER evaluation of the impact of Section 5 Inspection School Survey 2006
Interestingly, the statistical modelling analysis revealed that the respondents who found that the written report was completely consistent with the oral feedback were more likely to be ‘very satisfied’ with the overall inspection (see Section 5.4 and Appendix A). Survey respondents were asked whether there were any differences between the s5 inspection report grades and the SEF grades. Table 3.3 below reveals that approximately two-thirds of respondents reported no difference in grading between the SEF and the s5 report. For example, 72 per cent said there was no difference in grading on ‘curriculum and other activities’ and 64 per cent felt there was consistency with regard to ‘leadership and management’. Table 3.3 also reveals that where differences in grades were reported, the s5 graded ‘personal development and well-being’ higher than the SEF. As discussed above, the incidences of differences reported also appeared to diminish over time from 71 per cent before Christmas 2005 who believed there was ‘no difference’, to 76 per cent in February and March 2006. (These figures have excluded ‘no responses’.) A similar pattern emerged with regard to ‘care, guidance and support’. It is suggested that schools may have been more effective in these areas of education (which have few hard outcomes) than they realised. On close examination, Table 3.3 reveals that a total of 15 per cent of respondents reported that the SEF graded ‘overall effectiveness’ higher than the s5, whereas 12 per cent related that the s5 graded it higher then the SEF. As would be expected the vast majority of respondents (95 per cent) who said that the s5 graded ‘overall effectiveness’ higher then the SEF, were from schools graded ‘outstanding’ and ‘good’. And 92 per cent of those who said the SEF graded ‘overall effectiveness’ higher were from schools graded ‘satisfactory’ and ‘notice to improve’. Further statistical analysis (see Section 5.4 and Appendices A and B for more details) also revealed that, not surprisingly, those schools where the SEF graded ‘overall effectiveness’

Impact of Section 5 inspections: maintained schools in England
30
higher than the s5, were less likely to be very satisfied with the inspection process.
Table 3.3 Differences between the s5 inspection report and the SEF in relation to grades….
….in the following areas No difference in grading
%
s5 graded it higher than
SEF %
SEF graded it higher than s5
%
No response
%
Overall effectiveness 69 12 15 5 Achievements and standards 69 14 13 5 Personal development and well-being 70 17 9 4 Teaching and learning 70 13 13 5 Curriculum and other activities 72 12 12 4 Care, guidance and support 68 17 11 4 Leadership and management 64 16 16 4 N = 1597 Due to rounding, percentages may not always sum to 100 A total of 1561 respondents answered at least one item in this question Source: NFER evaluation of the impact of Section 5 Inspection School Survey 2006
Table 3.4 below shows that the number of respondents who reported no differences between the SEF and the s5 grades for ‘overall effectiveness’ in February and March 2006 (76 per cent) was higher than before Christmas 2005 (68 per cent).
Table 3.4 Differences between the s5 inspection report and the schools’ self evaluation in relation to ‘overall effectiveness’
Time 1 Oct-31 Dec
2005 1 Jan-14 Feb
2006 15 Feb-31 Mar
2006 No difference in grading 68 73 76 s5 graded it higher 15 11 11 SEF graded it higher 17 16 13 N=1525 Due to rounding, percentages may not always sum to 100 A total of 1525 respondents answered this question. 72 did not respond. Source: NFER evaluation of the impact of Section 5 Inspection School Survey 2006
This suggests that the more accustomed the schools and the inspection teams have become with the new process of inspection, the fewer incidences of differences have occurred. Across case-study schools, headteachers, senior teachers, governors and parents were asked what they thought about the inspection team’s diagnosis of the schools’ progress. The overall response from interviewees in the vast majority of schools was that the diagnosis was viewed as fair and accurate.
Impact: the inspection report
31
This did not appear to vary according to the grade awarded. The headteacher of one ‘satisfactory’ school said:
I thought the diagnosis was excellent, I feel very strongly about that. Not long before the Ofsted inspection I had asked the LEA to do some work and they produced an analysis which in my view was completely inaccurate. Ofsted analysis and the analysis the inspectors did was completely in line with what we were doing. I was very impressed that it was very sharp.
Similarly, other headteachers were happy with the diagnosis and felt that the inspection team knew their school. One headteacher said:
They picked up the issues we expected and the team were very helpful. They were focused, they knew what they needed and got on with it. I thought their diagnosis was spot on. I can’t fault them in what they did. I felt the inspection was rigorous but focused. I thought they were on the ball.
Governors and senior managers appeared to be equally impressed. One governor commented: ‘The grades were mainly accurate. They were a fair reflection of what the school does. They largely agreed with our grades. The report supported the SEF’. Similarly a senior manager said: ‘They had a very good handle on the levels of attainment and I felt that they had a good handle on the context in which we are working which has sometimes been lacking I feel.’ Furthermore, respondents in six schools commented that there were ‘no surprises’ with the diagnoses, and the fact that it appeared to be viewed as confirmatory in some cases was accepted as a positive finding, as one senior manager observed: ‘The inspection helped validate and confirm the school’s SEF across the board. The school had already set a direction’. In relation to the inspection team’s diagnosis and the grades awarded, a substantial minority of schools commented on the fact that they did not want to grade themselves too high. As one senior manager said: ‘I think we were harsher on ourselves than they [the inspection team] were. We undersold ourselves. They thought we were better in some of the areas’. This view was reiterated by a few schools. As one governor observed: ‘I think we were a bit cautious with the SEF. I think they thought our strengths were stronger and they were kinder to us than we had been in the SEF’. Not surprisingly, a number of schools reported that the inspection team upgraded them. Interviewees in one school said that inspectors judged the quality of the teaching to be higher than the school had. The school had been more cautious. The inspection team judged the care and support given to pupils to be outstanding whereas the school’s judgement was that it was good. The headteacher observed: ‘They [the inspection team] had a much wider

Impact of Section 5 inspections: maintained schools in England
32
benchmark than the school itself’. In a couple of cases headteachers expressed surprise at being upgraded. One headteacher said: ‘I still wouldn’t put us there [overall effectiveness grade ‘good’] as I think we can still do better, because based where I think we are on our journey we can still do better, whereas the inspector said he was comparing us to other schools’. Case-study interviews revealed that, with regard to the individual grades given in different inspection areas, there was general agreement with the survey findings. Interviewees were largely happy with the diagnosis in ‘personal development and well-being’ and ‘quality of provision’. Survey findings found that the s5 graded personal development higher than the SEF more often than the SEF graded it higher (see Table 3.3), which would concur with case-study interviewees feelings of content with the grading. However, although some schools felt the grades for ‘achievement and standards’ were fair, there was also some concern expressed. The most frequent complaint was that grades were ‘too data-driven’. Comments, mainly from schools graded ‘satisfactory’, included the following:
We had poor writing results that year which brought our value-added scores down. This year’s results are very good. Had we been inspected in two weeks’ time, we probably would have come out as a good school. The frustration is that the process is too data driven.
…a lot of the inspection was around data issues and this school is about dealing with the whole child and not just data. The inspection process is too data driven and proceeds on the notion that the data is right.
This issue of the inspection being too data-driven is explored in more detail in Section 6.4. Similarly, although a number of schools believed the grades for ‘leadership and management’ were fair, some reservations were expressed. For instance the headteacher in a school graded ‘satisfactory’ said: ‘One of the things we were picked up for was inconsistency within the leadership team, which was no surprise considering we had a completely new senior management team. I understand why it was done but I think it was a bit harsh’. Another headteacher in a school graded ‘good’ queried: ‘What have you got to do to get a grade 1?’ Many schools stated that they were happy with the ‘overall effectiveness’ diagnosis. One senior manager, for example, observed that it was ‘a fair reflection of standards and indicated room for improvement’, while another commented: ‘To get a ‘3’ for overall effectiveness was a fair judgement. We would have liked it to have been better, but with only an acting headteacher, it was unlikely’. Although many schools were content with their ‘overall

Impact: the inspection report
33
effectiveness’ grade, a minority were disappointed; this again reflects the survey findings where more schools reported the SEF grading ‘overall effectiveness’ higher than the s5 grade. The following comments, from a governor and a headteacher, were typical: ‘Overall effectiveness was a bit disappointing when the inspector was so positive about the school, but I agreed that some actions had started but not been evaluated, so there was no justification for giving us a ‘2’’ and ‘I hoped for a ‘2’ rather than a ‘3’, because I felt we had made great improvements, but not enough sections gained a ‘2’’. A small minority of schools (four) fundamentally disagreed with the diagnosis of the school’s progress. For two of these the timing of the inspection was perceived to be negative. The issue of inspection timing is illustrated below.
Case study: Diagnosis - disagreement over inspection timing One case-study secondary school was undergoing major building work and had expanded rapidly, (700 extra students and had moved from being a middle school to a secondary). The school was still undergoing massive reorganisation. The headteacher said: ‘we thought the inspection team were embarrassed to be inspecting the school when they did. They knew they would have to be giving judgements that would be the worst thing for the college – which it was. They recognised the developmental stage of the college and knew what the impact of a category decision would be on the college’. The headteacher believed that the inspectors recognised that the leadership team knew the school’s strengths and weaknesses and were making an impact on the school’s progress. ‘For a school post-reorganisation they said ‘Yes, you can do all these things’, but because the key stage 4 results in the year of reorganisation were poor value added we were put in a [lower] category’.
Other schools felt that the inspectors had not understood the school context and therefore had misjudged the schools’ progress, and in the schools’ opinion had wrongly diagnosed them.
Case study: Inspection team did not understand the school context One of the case-study primary schools had a high proportion of pupils with special needs, and they did not enter their statemented children in for SATs. The headteacher explained: ‘That year we’d got five statemented children out of thirty so our results were down 15 per cent before we started’. The headteacher continued: ‘I don’t think they [the inspection team] understood the nature of our school, so they couldn’t see the progress our mainstream children had made. I had two sets of results, and they were all given to her, but she kept going back to ‘Yes, your MLD children make progress,’ but they will never make progress to improve our results. They are here because we’re a resource-based school, we don’t put children in to fail, and that affects your results’.

Impact of Section 5 inspections: maintained schools in England
34
3.2 Identifying strengths and weaknesses As can be seen in Table 3.5 below, the vast majority of survey respondents (84 per cent) found the written report helpful, to some degree, in identifying areas for school improvement. However, 15 per cent believed that it was not at all helpful.
Table 3.5 Extent to which the written report was helpful in identifying areas for improvement in the school
%
Very helpful 33 Fairly helpful 51 Not at all helpful 15 No response 1 N = 1597 Due to rounding, percentages may not sum to 100 1580 respondents answered this question Source: NFER evaluation of the impact of Section 5 Inspection School Survey 2006
Table 3.6 below indicates that the majority of survey respondents reported that the inspection teams accurately identified the schools’ strengths (79 per cent) and weaknesses (71 per cent). Only a small minority (five per cent) believed that the teams had not identified strengths or weaknesses accurately.
Table 3.6 Incidence of the inspection team identifying the school’s strengths and weaknesses accurately
Strengths %
Weaknesses %
Yes 79 71 No 5 5 Partly 16 22 No response 0 2 N = 1597 Due to rounding, percentages may not sum to 100 1592 respondents answered the ‘strengths’ question and 1568 answered the ‘weaknesses’ question Source: NFER evaluation of the impact of Section 5 Inspection School Survey 2006
A minority of survey respondents (14 per cent) believed that the inspection teams detected extra strengths of which the schools were previously unaware, as can be seen in Table 3.7 below. The corresponding figure for previously unidentified weaknesses was seven per cent.

Impact: the inspection report
35
Table 3.7 Extent to which the inspection teams identified additional strengths and weaknesses
Additional strengths
%
Additional weaknesses
% Yes 14 7 No 86 92 No response 0 1 N = 1597 Due to rounding, percentages may not sum to 100 1594 respondents answered the ‘strengths’ question and 1587 answered the ‘weaknesses’ question Source: NFER evaluation of the impact of Section 5 Inspection School Survey 2006
Over three-quarters of survey respondents (77 per cent) agreed that the s5 inspection process was more useful than the s10 inspection (see Table 3.8 below), though a fifth (20 per cent) disagreed, to some extent, with this view. Findings from the statistical modelling revealed that respondents who strongly agreed or agreed that the inspection helped to identify main priorities (57 per cent) were more likely to believe that the inspection had at least some impact on school improvement. Survey respondents were also asked about the extent to which they agreed that the inspection report was superficial; 18 per cent agreed and a further four per cent strongly agreed, as can be seen in Table 3.8 below. However the majority (76 per cent) disagreed, to some extent, that the s5 inspection report was superficial.
Table 3.8 Different people have different views about the s5 inspections. Extent of agreement with the following areas.
Usefulness Strongly agree
%
Agree
%
Disagree
%
Strongly disagree
%
No response
% The s5 inspection process was more useful than the s10 inspection
27 50 16 4 3
The inspection helped to identify main priorities 11 46 35 6 1
The inspection report was superficial 4 18 56 20 2
N = 1597 Due to rounding, percentages may not always sum to 100 A total of 1592 respondents answered at least one item in this question Source: NFER evaluation of the impact of Section 5 Inspection School Survey 2006
In accord with the survey findings, three-quarters of case-study schools believed that the inspection teams identified the schools’ strengths and

Impact of Section 5 inspections: maintained schools in England
36
weaknesses accurately. One headteacher, for example, said: ‘Yes, generally they did. For example, they recognised the quality of the school ethos and that we had a broad and balanced curriculum. But they were critical of our paper record of assessment’. A senior manager in another school said: ‘It was surprising in the short time they were here how easily they identified the strengths and weaknesses. What I liked is that it was sold as an inspection where you could open yourselves up to show what you didn’t do very well, and were given ideas to improve. We admitted to issues and said what we were doing about it. It was a more honest approach’. A minority of schools reported that the inspection team identified some new weaknesses, such as: • insufficient work-related learning
• an inability to communicate multicultural awareness to children
• the need for better communication with parents
• the need to evaluate interventions.
Interviewees in five case-study schools believed that the inspection teams had not correctly identified the school’s strengths and weaknesses. One headteacher of a PRU felt that they had been treated as a mainstream school, and therefore their strengths and weaknesses had not been considered carefully enough. Another headteacher believed standards to be too influential:
The inspectors did a very thorough evaluation of the PANDA and the SEF and that was reflected in the report – but it was all seen in the light of the standards. It’s a too linear model – your standards are satisfactory, so therefore your teaching and learning is satisfactory, your leadership is satisfactory, your pastoral is satisfactory and I just find that framework is so naïve.
The remaining three schools felt that the inspectors had not engaged with the strengths and weaknesses because the inspection was ‘a quick snapshot’, that ‘it was too generalised’ and ‘not real’. One headteacher felt that the inspection team had not ‘adequately referenced the SEF’, which he believed ‘better highlighted the successes of several areas including PE and ICT which were not drawn out in the report’.

Impact: the inspection report
37
3.3 The letter and the report Staff and governors in case-study schools were asked what they thought about the written report and how the report and pupil letter were distributed in their schools. On the whole, attitudes to the written report reflected the opinions about the diagnosis and the grades. The majority of case-study school staff were positive about the reports, and governors generally felt their role to be sufficiently represented. Views were expressed in four main themes: • The written report was perceived to be accurate and fair. It was said to
‘hit the nail on the head’ and to be ‘comprehensive. It laid out everything we needed to do’. One headteacher said: ‘I wouldn’t have written the report much differently myself’.
• The report was seen to be user-friendly and easy to read. Comments included: ‘It is easier and simpler to read. It’s much better. It was far more complicated in the past’, ‘I was impressed with the paper work and how easy it was to read – there’s clearly been a lot of effort to improve the inspection process which I think they’ve been successful in doing’ and ‘I think it was much more user friendly – far more understandable and used language that everyone understood rather than technical jargon. With this one you wanted to carry on reading because it wasn’t too long and was easy to read’.
• Staff also liked the fact that the report was succinct and concise. It was perceived to be: ‘very detailed…every sentence contains a fact’ and ‘It’s to the point – it told us what we needed to know’. One senior manager liked the report because it was ‘very succinct’ compared to ‘the old one’ which was ‘very waffly’. Another took the view that, because ‘it was succinct it was therefore easier to digest it, understand it and use it’.
• A significant minority also commented on how useful they found the report in assisting with specific issues. For some respondents, it helped them to focus; ‘it highlights the areas for development clearly and praises the strengths’, and provided ‘good clarity on the issues the school needed to focus on’. For others, it gave the school ‘justification’ for action they might take. For example, one school was glad of the attention Ofsted gave to low level disruption because it gave some backing to staff and meant that the school could ‘turn the pressure up on the students who were causing the disruption’ – and with parents too. For yet others it was a useful resource to share with the wider community, as pointed out by two headteachers: ‘We were very happy with it – it is a very positive thing for our school; we’ve used it to take quotes out of it for our school prospectus’, and ‘There were some beautiful phrases for sharing with parents’.
There were a number of criticisms of the written report. Some found it to be too brief, ‘I would have liked something more detailed’, ‘something with a bit

Impact of Section 5 inspections: maintained schools in England
38
more depth would have been useful’, and ‘some of us felt it was perhaps a bit too brief…all that work. It could have been a little bit more detailed’. In a few cases interviewees felt that the brevity detracted from the report. One headteacher, for example, felt there had been ‘a bit of dumbing down to get it into fewer pages’. And one governor explained:
We were advised that the report wouldn’t be as lengthy as the original ones…more of a summary. More was said verbally than was written. It was so positive verbally, that it would have been nice for the staff to have read…rather than us relay what was said. It was a bit of a disappointment when the report did come…it didn’t come across…it was a summary.
A few schools commented on the fact that they found the report too generalised. One senior manager said: ‘if you looked at a lot of reports they would have a sameness about them’, while a headteacher felt ‘the report is very bland. When you’re looking to lift statements, I couldn’t find anything to lift for the prospectus. I’ve still got the comments from last time. It is edited down. I read it through a few times, but it ends up being very bland’. Other ways in which the written report could be improved, according to a minority of interviewees, were: • The report could give more praise and recognition of the school’s
strengths. It could be written in a more positive tone.
• It could more closely reflect the oral feedback and the evidence.
• It would be helpful if more specific feedback could be given, for example in relation to subject or department areas.
In addition to school staff and governors, pupils and parents were asked what they thought about the written report. Parents were also asked whether they agreed with Ofsted’s assessment of their school’s strengths and for their views on the written report. Many parents could not remember receiving the report or could not recall the content of it, but of those who could, some appreciated the fact that the report represented an independent assessment of the school. For instance one parent from a school graded ‘satisfactory’ said: ‘It was reassuring to have an independent assessment but I think this was because it was such a good report’. Another parent commented: ‘It is good to have someone else’s perspective’. Others remembered the report as easy to read: ‘I can’t remember much of the detail, but it was clearly laid out and easy to read’, and: ‘It was very clear and easy to read – I thought the new style of report was much more accessible than the old version, although the change in scoring systems (seven point scale to four) made comparing the reports from the two systems difficult’.

Impact: the inspection report
39
A few parents remembered specific items in the report, with which some of them agreed. One parent thought that the report (accessed on the internet) was a fair summary of the school: ‘There wasn’t anything there that I would disagree with in any way. It was quite perceptive about the school. I know there are some very good teachers there and a small number of weaker ones’. Understandably parents felt most able to comment on areas such as ‘personal development’ and ‘care and guidance’. One parent, for example, agreed with the report’s assessment of a ‘good community feel’ and another that the discipline was ‘good’. In a school graded ‘notice to improve’ two parents agreed with the inspection findings.
A sister-in-law has a child in the sixth form and she said that she thinks the changes are really going to improve the sixth form. Some parents had already made similar observations to those highlighted by the inspectors. The lessons weren’t structured enough and there wasn’t enough out-of-lesson support for pupils.
Yes, I did actually [agree], it [the report] was very detailed and it touched on every aspect that I was interested in. You know, it actually told me exactly what I thought it was going to tell me.
While in a primary school another parent found the report accurate.
I was aware of music being a strength. They have an excellent music teacher whom I know and she is very good and very enthusiastic. I wasn’t aware of science – that is not something my two children have made me aware of. I would go along with the weaknesses, especially the one about cultural awareness but it is not a surprise because of the area we live in. we have very few people of other cultures here which makes it difficult.
However, some parents disagreed with observations in the report. For example, one parent said: ‘A question had arisen about communication. I thought the school was no worse than any others at communicating with parents and was probably one of the better ones judging by my experience of other schools’. While another commented:
No, I did not agree with the report findings – I was disappointed with the terminology in the report. I think Ofsted’s term of ‘satisfactory’ also has negative overtones, although I know this school to be a good school.
In another small primary school one parent described how parents did agree with most of the assessment but felt that the report did not emphasise the important community element and happy atmosphere of the school. The parent felt that the inspector had no prior knowledge of small schools and did not take the school’s rural context into consideration: ‘She (the inspector) was

Impact of Section 5 inspections: maintained schools in England
40
from inner-city Birmingham and made no allowances for the rural area. She didn’t understand the context of a small rural school’. The majority of pupils, when prompted, could remember the inspection. School staff, parents and pupils agreed, when they could remember, that in most cases the pupil letter, which summarised the key points from the report, was given to the pupils. Similarly, the report was most frequently distributed to parents via ‘pupil post’. In some cases the report was posted to parents, in others parents were directed to the website or the school office for a copy. In some cases the letter was read out in assembly, and subsequently discussed either in assembly or in class time. Parents and pupils, on the whole, did not recall discussing the findings. Similarly the vast majority of pupils said that they did not discuss the inspection with their friends, however a few did, and for one primary pupil it caused some anxiety. She said: ‘I got quite scared on that day because in one of the books I have read…..a school had to pretend there were more pupils to stop Ofsted from closing it, and I thought if Ofsted were really, really mean they might close down our school’. In a minority of cases the inspection findings were discussed in the school council, but there was a general feeling that the council could achieve little change anyway. Most pupils liked the letter. Some commented on the fact that it represented a fair reflection of the school. One secondary student said: ‘It showed that they had considered our views’, while another felt ‘you can see how things are going to improve’. Yet another was aware of the image of the school: ‘I think it was a good letter because it makes the school look good’. Another student perceived changes in the school to be linked with inspection findings. He believed that discipline and behaviour had improved and there was less bullying. He also felt that the peer mentoring scheme was helping the younger pupils and that there were also classes for things like anger management. For some primary pupils the letter relieved anxiety: ‘if we didn’t get the letter then we would be worrying about what was going to happen’, and another boy said he thought the letter ‘had been quite honest about the school’. Primary pupils in another school thought it was a good idea, because ‘it shows what progress the school is making,’, and ‘gives us feedback’. While some pupils in one primary school could relate the findings to changes in the school: ‘now when we do homework Miss gives an A+, A-, B+, B- … and it’s really good how she marks our work now’. One pupil said simply: ‘It is nice to get a letter from someone important’. A few pupils did not like the letter. Pupils in two primary schools felt that the content of the letter was ‘not fair’, while some secondary students found the language difficult. Many interviewees, in addition to the pupils, liked the pupil letter. Comments included:

Impact: the inspection report
41
• The letter to the pupils was very good because it made the point to the pupils that they were attending a good school and should not waste their opportunities (parent).
• The pupil letter was so great. It was so respectful to the children. It was a wonderful idea. That was given out much earlier than the report. It was like a thank-you for the pupils (governor).
• I do think it is important that we have a mechanism to feed back to youngsters and I think the student letter does this (senior manager).
• I thought the letter was really nice. It made the children feel important and it really involved them. I think it is a good idea (senior manager).
• The pupils were thrilled with the letter; one boy kept the letter under his pillow because it was such an important letter (headteacher).
• The letter to the children was delightful…absolutely delightful. Every child took one home. It said ‘dear pupil’, so they all took them home. However if the letter had not been as positive I may think very differently! (headteacher).
A small minority of schools questioned whether there was a need for the letter. One senior manager said, ‘the letter is quite bland; I’m not sure how useful it is…I think the school’s feedback is much more useful’. Others felt that the letter was inappropriate: ‘it was almost entirely negative, and kids would use sentences in it to play up in class, saying things like “some teaching is not as good as it should be”’. While others found the letter to be ‘a bit condescending – a bit twee’, ‘patronising’ and ‘slightly gimmicky’.

Impact of Section 5 inspections: maintained schools in England
42
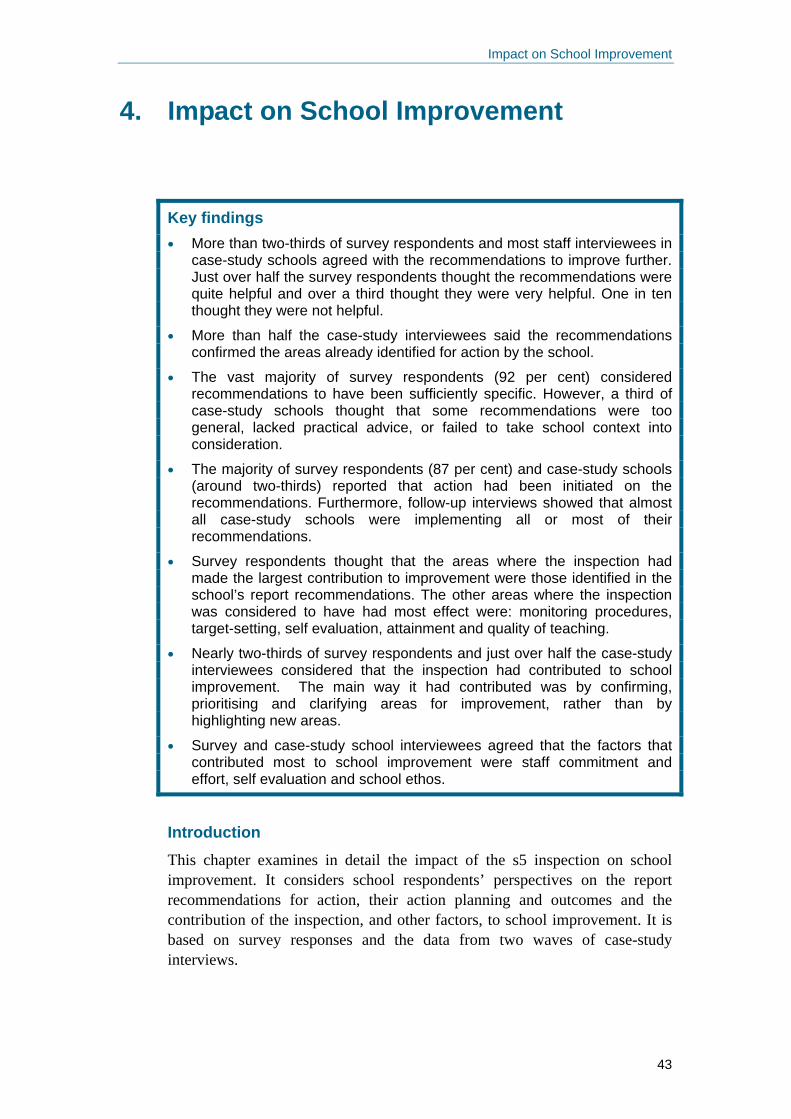
Impact on School Improvement
43
4. Impact on School Improvement
Key findings • More than two-thirds of survey respondents and most staff interviewees in
case-study schools agreed with the recommendations to improve further. Just over half the survey respondents thought the recommendations were quite helpful and over a third thought they were very helpful. One in ten thought they were not helpful.
• More than half the case-study interviewees said the recommendations confirmed the areas already identified for action by the school.
• The vast majority of survey respondents (92 per cent) considered recommendations to have been sufficiently specific. However, a third of case-study schools thought that some recommendations were too general, lacked practical advice, or failed to take school context into consideration.
• The majority of survey respondents (87 per cent) and case-study schools (around two-thirds) reported that action had been initiated on the recommendations. Furthermore, follow-up interviews showed that almost all case-study schools were implementing all or most of their recommendations.
• Survey respondents thought that the areas where the inspection had made the largest contribution to improvement were those identified in the school’s report recommendations. The other areas where the inspection was considered to have had most effect were: monitoring procedures, target-setting, self evaluation, attainment and quality of teaching.
• Nearly two-thirds of survey respondents and just over half the case-study interviewees considered that the inspection had contributed to school improvement. The main way it had contributed was by confirming, prioritising and clarifying areas for improvement, rather than by highlighting new areas.
• Survey and case-study school interviewees agreed that the factors that contributed most to school improvement were staff commitment and effort, self evaluation and school ethos.
Introduction This chapter examines in detail the impact of the s5 inspection on school improvement. It considers school respondents’ perspectives on the report recommendations for action, their action planning and outcomes and the contribution of the inspection, and other factors, to school improvement. It is based on survey responses and the data from two waves of case-study interviews.

Impact of Section 5 inspections: maintained schools in England
44
4.1 Recommendations for action Table 4.1 shows the extent to which survey respondents agreed with the s5 recommendations to improve further.
Table 4.1 Extent of agreement with the Ofsted recommendations to improve further
%
Completely agree 69 Partially agree 29 Do not agree 2 No response 1 N = 1597 Due to rounding, percentages may not sum to 100 1586 respondents answered this question Source: NFER evaluation of the impact of Section 5 Inspection School Survey 2006
More than two-thirds of the respondents agreed completely with the recommendations and most of the others agreed partially. The minority (two per cent) that had not agreed represented 24 schools. Survey schools that were graded outstanding were particularly in agreement with the recommendations, for example, 85 per cent of grade 1 schools completely agreed with their report recommendations and none disagreed. Amongst grade 2 schools, 70 per cent agreed completely and just over one per cent disagreed. Schools graded satisfactory had a higher level of disagreement (just over two per cent), but nearly two-thirds (65 per cent) completely agreed with their recommendations. There was a lower level of disagreement among the schools that had been graded 4 (under two per cent) and a slightly lower level of complete agreement (60 per cent), but these schools had the highest level of partial agreement with recommendations (38 per cent).
Table 4.2 Extent to which the recommendations were viewed as helpful
%
Very helpful 38 Quite helpful 51 Not at all helpful 10 No response 1 N = 1597 Due to rounding, percentages may not sum to 100 1582 respondents answered this question Source: NFER evaluation of the impact of Section 5 Inspection School Survey 2006
Table 4.2 above shows that over a third of respondents had considered the recommendations to be very helpful, with more than half preferring the

Impact on School Improvement
45
description ‘quite helpful’. Around ten per cent of the schools had not found the recommendations at all helpful. The responses of interviewees from case-study schools helped to provide the details of why some respondents agreed with the recommendations, but did not necessarily find them very helpful. More than half the headteachers and senior managers interviewed said that they had agreed completely or mainly with the recommendations, but about two-thirds of that group stated that all the issues were already being tackled. For most this was seen in a positive light, because it was external confirmation of the school’s own judgement and was therefore welcomed. Comments included: ‘Their focus on boys’ achievement fitted completely with the school’, and ‘We agreed wholeheartedly. It was nice that Ofsted supported our judgements’. Sometimes however, school interviewees perceived the recommendations as not being particularly helpful if they reiterated what the school was already doing. Typical comments included: ‘Their recommendations were all valid, but they were what we were focusing on anyway’, and ‘I think they told us what we knew’. There were also examples amongst the case-study schools of agreement with the recommendations, but some disappointment that they were not sufficiently specific to be helpful, or that there was no practical guidance on how to deal with a problem. These individual school concerns came through more clearly in the interviews than in the survey, where most responses were positive about the specific nature of recommendations, as shown in Table 4.3.
Table 4.3 Extent to which the recommendations were viewed as specific
%
Very specific 31 Specific 61 Not specific at all 6 No response 1 N = 1597 Due to rounding, percentages may not sum to 100 1582 respondents answered this question Source: NFER evaluation of the impact of Section 5 Inspection School Survey 2006
When schools considered that a recommendation was too general, as in this example from a case-study school, ‘I would have thought that “consistency across middle management” was almost generic across all schools’, it was not seen as a particular problem, although such a recommendation was probably likely to receive less attention than others. On the other hand, if a school was anxious to address an issue highlighted in the recommendations, but had no idea how to tackle it, the lack of specific advice could be a concern,

Impact of Section 5 inspections: maintained schools in England
46
as this headteacher explained: ‘We agreed that attendance was an issue, but they [the inspectors] were at a loss, as we are, as to how to improve it’. Table 4.4 sets out the survey responses to a question about the link between the way in which recommendations were expressed and how easy it was to put them into action.
Table 4.4 Did the way in which the recommendations were expressed make them easy or difficult to action?
%
Easy 47 Neither easy nor difficult 49 Difficult 3 No response 1 N = 1597 Due to rounding, percentages may not sum to 100 1587 respondents answered this question Source: NFER evaluation of the impact of Section 5 Inspection School Survey 2006
Only a small percentage of surveyed schools claimed that they had found it difficult to act on the recommendations and nearly half said that it had been easy. However, the majority of respondents gave the neutral response that it had been neither easy nor difficult to take action. It may have been this view that led a headteacher from a case-study school to say: ‘you don’t get key issues for action; you have to kind of read between the lines a bit’. Most schools that broadly agreed with the recommendations may sometimes have found the wording rather vague, or lacking in practical advice, but were not resistant to them. For the minority that disagreed with all or some recommendations, this was less likely to be so. Case-study interviews indicated that there were three main reasons for disagreement with report recommendations. These were: • A perception that the inspection team lacked understanding of the school’s
context or circumstances.
There were five case-study schools where the headteachers interviewed felt a sense of grievance because they thought that the recommendations had not taken the school’s context into account. For example, one headteacher, from a secondary school, described a sense of disappointment over lack of understanding on the part of the inspection team, commenting that, ‘the recommendations they made were not in the context of the school and therefore were naïve’.

Impact on School Improvement
47
• A belief that misjudgements were based on lack of proper lesson observation. This was a source of concern for several schools, as these examples from two schools illustrate:
They didn’t observe a full lesson while they were here; it [the recommendation] was based on an observation of a few minutes of a Year 5/6 class. We took it on board, but we didn’t think it was a major issue. They went down to see the Foundation Stage for five minutes and they made a judgement on the quality of teaching in the Foundation Stage when they [the pupils] were getting changed for PE. So we were quite shocked when they said we needed better quality of teaching and they didn’t see one lesson in its entirety.
• A view that recommendations were based on judgements that were unfair,
or too dependent on narrow interpretation of data.
Schools that felt that they had been criticised unjustly were also unlikely to agree with recommendations, or find them helpful. In one example, the headteacher described an ‘argument’ with inspectors over a security issue, one over which the school had no control and had tried to get the local authority to take action. He added, ‘I think the inspectors failed to understand that and had to put it in the report, but there was no mention of why and we did feel bad about that’. A similar sense of injustice was reflected in this comment: ‘I think what some of the staff felt really bad about was that this inspector was criticising us for what we were doing and we were going along with what the local authority had recommended, which [in turn] had come from QCA and the Strategies’. The perception that data had been misinterpreted or taken out of context was another reason for a negative reaction to recommendations. Comments included: ‘The data collected by the school and included in the PANDA did not support their conclusions, so the recommendations were not very useful’, and ‘The recommendation about more able children – you could always do more for any children, but their argument was statistically flawed’. Headteacher explanations as to why they had not agreed with recommendations were supported by other senior managers and governors, so these were whole-school views. It was interesting that parents who were interviewed often picked up on the same disagreements, sometimes using their children’s experience to support their views. One interviewee, referring to a recommendation about matching work to pupils’ abilities, for example, said that: ‘N was identified as good at maths at his primary school. They said he should be challenged and he has been. I don’t think this is an area of weakness’.

Impact of Section 5 inspections: maintained schools in England
48
However, case-study schools also revealed plenty of examples of agreement with recommendations, as stated by this deputy headteacher: ‘I agreed completely with the recommendations. They [the inspectors] gained a really good insight in a very short period of time’. Just as negative responses were supported by governor and parent interviews, so too were the positive reactions. In the schools where recommendations related to governors, there was agreement from interviewees that the focus on their role was correct, as this governor admitted: ‘Even I felt that as a parent governor we needed to get our act together. We needed someone to bring us together and bring us forward’. Where parents were prepared to give their opinions on the recommendations (some said they did not think they knew enough about the school to comment), they mirrored quite closely the views of the staff and governors.
4.2 Action planning During the first wave of interviews with case-study schools, the staff and governor interviewees were asked about any actions that had followed on from the recommendations. The same question was asked of survey respondents (see Table 4.5 below).
Table 4.5 Did specific school actions follow from these Ofsted recommendations?
%
Yes 87 No 11 No response 2 N = 1597 Due to rounding, percentages may not sum to 100 1563 respondents answered this question Source: NFER evaluation of the impact of Section 5 Inspection School Survey 2006
Overall there was a strongly positive response from survey schools, with the strongest coming from the schools given notice to improve. Amongst grade 4 schools, 95 per cent reported taking action on Ofsted recommendations. The second most positive response came from schools graded satisfactory (89 per cent). This pattern would be expected, given that the schools graded 3 and 4 would generally have had more recommendations and probably more radical changes to implement. The majority of the case-study schools visited initially also reported that they had already acted on recommendations. Just under half the senior managers described definite actions on all or some of their recommendations, while another third explained that the recommendations had given new impetus to

Impact on School Improvement
49
their existing plans. There were several case-study schools that provided good examples of interweaving recommendations with existing policies. In this way the inspection had helped them to build on what they were already doing, and in some cases re-focus their actions, although the diagnosis of what needed to be done and the means of achieving improvement had already been established by the school. The following is one example of this.
Case study: Recommendations providing focus A primary school in a rural location had been graded ‘satisfactory’ and the headteacher explained that the school had been aware of its weaknesses and was already taking measures to deal with them: ‘We were putting a lot of things into place when the inspection came and now they are more consolidated and embedded in terms of target setting for numeracy and reading and writing. We looked at the more able children, ways we might enable them to do better. Every year I’ve always taken a more able maths group out, potential level 5s to give them additional support. We had girls underachieving in Year 6, who were very unlikely to achieve level 4, and in fact half of them got a level 4. We were about to start a school council and that has happened. We’ve also trained peer mediators. We’ve continued to do the things we said we were going to do. We’ve continued to develop our senior leadership team and involved everyone in the school improvement process, which is important’.
Of the remaining schools, some said that nothing new was required because all the recommendations were already in operation, while others found the recommendations difficult to implement, or had not taken action because they disagreed with them. One school faced particularly challenging circumstances, as described below:
Case study: Challenging circumstances This case-study school, a primary school, had been given notice to improve and the headteacher explained that it was the local authority that had to write the school’s action plan. This had been done, a task force had been set up to advise the school and the local authority promised support. However, the deputy headteacher was on long-term sick leave with stress, leaving a supply teacher in Year 6. So far, no further support had been given and the interim visit from the task force, which was supposed to assist the school to implement its action plan, had not taken place.
Amongst those schools that reported that definite actions had followed the recommendations, the most common developments included improvement to assessment, tracking and targeting systems, setting up or formalising school councils, behaviour policy, developing the role of governors and developing teaching and learning strategies. Most of these schools were positive about the benefits of their actions which they thought were helping progress, but occasionally interviewees thought that acting on recommendations had results that caused the school some anxiety, as this deputy headteacher explained:
Impact of Section 5 inspections: maintained schools in England
50
The big area that has caused us to go into this category [grade 4] is the sixth form. We have become far more ruthless in who we allow to sit A levels. We will not take chances now…If we’re not sure the pupil is going to reach their attainment according to their GCSE scores, we will not allow them to sit the exams, we won’t let them back.
Follow-up interviews revealed a few examples of unforeseen and negative consequences from following recommendations and these are discussed in Section 4.3. Some schools had found that certain recommendations were more difficult to act on than others and so had sometimes made little progress in planning in these areas. Improving pupil attendance was one such area and another was developing the role of governors. However much schools may have agreed that these were areas for action, school circumstances could severely limit any real progress. For example, one headteacher made this comment about her school’s efforts to meet the recommendation to increase the size of the governing body: ‘We have worked with the local authority and have borrowed one of their stands to try and recruit more governors, but I would say the governing body is still sort of embryonic’. As stated in Section 4.1, governor interviewees generally were in agreement with recommendations that referred to them increasing their involvement and taking a more active role, but some admitted that acting on this was complicated, as a chair of governors explained: ‘The relationship we have with the head is that of a critical friend, but I don’t see how we can be more dogmatic. It’s difficult to implement – I see difficulties around suggesting to the headmaster how he should run things’. Parent interviewees were asked about the extent to which recommendations were being acted on and most either said that they did not know or that, as far as they were aware, there was no need for further action because the school was already dealing with the issues. Sometimes parents voiced opinions that were challenging of the recommendations that had been given, as in this example of a comment from a primary school parent made about attainment levels: ‘I think we get far too caught up with talk about attainment levels when what really matters are social skills, tolerance and kindness. There are much more crucial things to be concerned with’. Groups of pupils were also interviewed during the first wave of school visits and they were asked what changes had taken place since the inspection. Their perceptions of what had changed did not usually match up with the school’s recommendations, though ten groups were able to directly link a school development with what the report or their letter from the inspector had said. The relevant comments related mainly to making lessons more interesting, using more ICT, or improving the school environment, and these developments were generally welcomed, as described by this pupil from a

Impact on School Improvement
51
secondary school: ‘We’re having a lot more fun lessons recently – we’re getting more involved and it’s not just sitting down and answering questions’.
4.3 Progress on actions taken on recommendations During the initial case-study visits, school interviewees were asked about action planning and actions already underway as a result of report recommendations. When schools were contacted again, around four months later, interviewees were asked to reflect on how much progress there had been in carrying out recommendations. School contacts were first asked to consider any significant general changes that had taken place in their schools since the first visit, regardless of their recommendations. In many cases the reported changes were linked to issues raised in their Ofsted report, even if not directly to recommendations. The largest group of responses related to assessment procedures, use of data and data tracking systems, with a number of interviewees reporting having implemented Assessment for Learning procedures. Curriculum reform was also mentioned quite frequently, while changes to buildings and equipment, to staffing and to monitoring systems featured fairly regularly. When interviewees were asked to focus on developments relating to their report recommendations, the responses fell into three categories: schools that were implementing all or most of their recommendations, those that had prioritised and focused on some, and those where there had been little action. The first category was the largest, as by this stage most schools reported good progress on implementation. The three schools that had only had one recommendation had not faced much difficulty in turning this recommendation into action. In one primary school, the recommendation, which referred to extending more able pupils in mathematics, had led on to wider developments, as explained by the headteacher: ‘We are developing our target setting for literacy and numeracy, consolidating what we were doing earlier. Now we can see pupils’ progress on a half-termly and termly basis’. There was also a generally positive response from schools with two and three recommendations, with most stating that they had, at least, begun to take action. In the case of some recommendations, progress was already apparent, but this was dependent on the nature of the issue. The case-study below is an example of a school graded 3, which reported a full programme of implementation of their recommendations.

Impact of Section 5 inspections: maintained schools in England
52
Case-study: Full implementation of recommendations One of the case-study schools, a Pupil Referral Unit, had been given three wide-ranging recommendations. The first was about staffing and quality of teaching and the headteacher reported that a new teacher had been appointed and a programme of additional support introduced. As a result, based on lesson observations, she thought that ‘we now have three very good teachers’. Teaching assistants were also receiving training and it was likely that they would move on to the HLTA grade, which would be good for the school and ‘good for their career development’. The second recommendation was about monitoring and evaluation and providing feedback to pupils. To meet this, there had been a new marking and feedback policy and layered target setting, with more pupil involvement. Subject leaders were now heavily involved and there was lots of assessment data. The headteacher said they were ‘looking at the gaps and how we can make better use of assessment’ and added that ‘all pupils have individual learning plans’. Enhancing the curriculum and making it more relevant to pupils’ needs had been the third recommendation and had led to attempts to enrich the curriculum, especially its cultural and community aspects, to introduce greater creativity and to encourage pupil voice through the establishment of a school council. The headteacher thought that progress on this third recommendation had been good, but it was a long-term issue and although they had made a start, it was unlikely to have much impact immediately: ‘This is a big change and it will take time’.
Some schools that had been given several recommendations had decided to prioritise and concentrate on one or more, rather than attempting to deal with all of them together. The reasoning behind their decisions however, did vary. In some cases it was a pragmatic approach, taking action first on those issues that were easiest to implement quickly, while others were left to longer-term planning. For example, in a secondary school that had been given three recommendations, the headteacher reported that more consistent monitoring was already being dealt with and so it was only necessary to embed the new processes. The second recommendation to raise the standard of boys’ achievement had been acted on quickly, with lesson observations and monitoring of work. The third recommendation referred to staff CPD and this was more complicated and required much consideration and planning, so it was still ‘under examination’. In other cases, the prioritisation had been based more on what the school saw as useful, or it reflected a disagreement about a recommendation’s relevance to the school. In a secondary school that had been given two recommendations, the one relating to self evaluation had been acted on with a comprehensive series of measures. However, the other, which related to marking and feedback to students, was considered far less important because the entire homework policy was under review and the issue was perceived to be more about differentiation.

Impact on School Improvement
53
Schools that had reported little or no progress on implementation gave two main reasons for their inaction: • The recommendations were already being undertaken prior to the
inspection
• There was fundamental disagreement with the recommendations.
Case-study: Difficulty of implementing recommendations with which a school disagreed In a secondary school that had been graded 4 the staff interviewees reported widespread demoralisation during the first research visit. In his second interview the headteacher described the struggle to try to carry out recommendations that the school staff believed were based on incorrect assessments. ‘We reviewed everything and the key decision was to restructure the senior team, but it was hard. The inspection framework is detrimental to vulnerable children. The senior management team was committed to Every Child Matters and we had a large number of children from damaged or deprived backgrounds and new arrivals to the UK. For them life is a struggle and their immediate needs do not include cramming through an exam. We have to settle the child and that takes more than a year’. The headteacher went on to question the use of key stage 2 data which he said came to the school in an incomplete form and on which value-added data was then based.
It was also the case that some schools that reported having implemented their recommendations felt that they had done so because it was required of them, but they did not really share the same priorities, as this interviewee from a primary school explained: ‘We don’t go in for personal targets, targets can get in the way. Our SATs results are good, but what’s important are things like the Green Flag Eco-school status we’ve just obtained and the production the pupils have just performed. That’s attainment for the whole school’. Some schools also drew attention to the fact that focusing strongly on attainment in one area could lead to a decline in others, as this headteacher explained: ‘Our key stage 2 to 3 CVA has shot up, but the focus on that means the key stage 3 to 4 fell slightly. It’s ironic, but shows how difficult it is to be successful in every aspect’.
Overall, therefore, the picture that emerged from the two rounds of case-study interviews was a positive one of most schools doing their best to act on the recommendations that they had been given and a recognition that, for the majority, they fitted in with the school’s own concerns.

Impact of Section 5 inspections: maintained schools in England
54
4.4 Factors contributing to school improvement Survey responses to a question on the extent to which the s5 inspection had contributed, or was likely to contribute, to improvements in certain areas are shown in Table 4.6.
Table 4.6 Extent to which the s5 inspection overall contributed to or is likely to contribute to improvements
To a great extent
%
To some extent
%
Not at all %
No response
% Monitoring procedures 21 55 22 1 Target setting 18 48 32 1 Attainment 15 54 28 2 Action plans 12 51 34 2 Leadership 12 53 32 2 Attendance 6 27 63 3 Quality of teaching 15 58 24 2 Specific pupil/student skills (e.g. writing, spelling) 10 46 41 2
Behaviour 3 25 68 3 Every Child Matters outcomes 7 39 51 2 Safeguarding children 4 29 63 3 Staff’s career and professional development 6 36 55 2 Self evaluation 17 54 25 3 Areas identified by Ofsted’s recommendations 24 51 14 10
N = 1597 Due to rounding, percentages may not always sum to 100 A total of 1583 respondents answered at least one item in this question Source: NFER evaluation of the impact of Section 5 Inspection School Survey 2006
As would be expected, the areas identified by the inspection recommendations were considered most likely to see improvement. Monitoring, target-setting, self evaluation and attainment were also identified as areas that had benefited (or would benefit) from the s5 inspection. Quality of teaching scored quite highly too, although the inspection was not thought to have had a corresponding impact on staff CPD. Further statistical analysis showed that there was a difference in how schools perceived impact on certain areas according to how they were graded. Schools that had been graded 4 were far more likely to consider that the inspection had contributed to a great extent to improvements in monitoring procedures (42 per cent). As regards quality of teaching, more grade 4 schools (37 per cent) and grade 3 schools (20 per cent) thought that the inspection had contributed
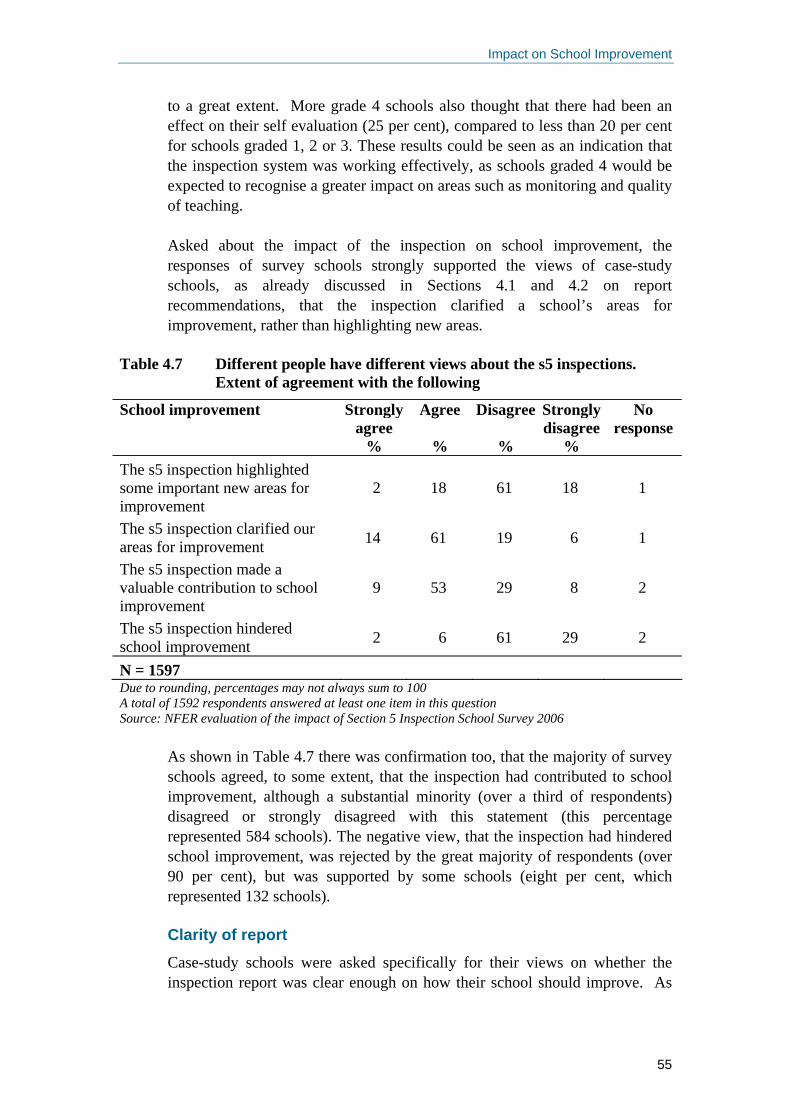
Impact on School Improvement
55
to a great extent. More grade 4 schools also thought that there had been an effect on their self evaluation (25 per cent), compared to less than 20 per cent for schools graded 1, 2 or 3. These results could be seen as an indication that the inspection system was working effectively, as schools graded 4 would be expected to recognise a greater impact on areas such as monitoring and quality of teaching. Asked about the impact of the inspection on school improvement, the responses of survey schools strongly supported the views of case-study schools, as already discussed in Sections 4.1 and 4.2 on report recommendations, that the inspection clarified a school’s areas for improvement, rather than highlighting new areas.
Table 4.7 Different people have different views about the s5 inspections. Extent of agreement with the following
School improvement Strongly agree
%
Agree
%
Disagree
%
Strongly disagree
%
No response
The s5 inspection highlighted some important new areas for improvement
2 18 61 18 1
The s5 inspection clarified our areas for improvement 14 61 19 6 1
The s5 inspection made a valuable contribution to school improvement
9 53 29 8 2
The s5 inspection hindered school improvement 2 6 61 29 2
N = 1597 Due to rounding, percentages may not always sum to 100 A total of 1592 respondents answered at least one item in this question Source: NFER evaluation of the impact of Section 5 Inspection School Survey 2006
As shown in Table 4.7 there was confirmation too, that the majority of survey schools agreed, to some extent, that the inspection had contributed to school improvement, although a substantial minority (over a third of respondents) disagreed or strongly disagreed with this statement (this percentage represented 584 schools). The negative view, that the inspection had hindered school improvement, was rejected by the great majority of respondents (over 90 per cent), but was supported by some schools (eight per cent, which represented 132 schools). Clarity of report Case-study schools were asked specifically for their views on whether the inspection report was clear enough on how their school should improve. As

Impact of Section 5 inspections: maintained schools in England
56
with previous questions on the report recommendations, the responses fell into three categories: • the majority who thought that the report had been both clear and helpful.
Comments from headteacher interviewees were positive such as: ‘We were given three clear action points and I have highlighted the positive comments as well for staff – to try and motivate people’, and ‘The specifics on using ICT for review, planning and assessment were very useful’. One headteacher made a comparison with the previous inspection system and stated that: ‘The report gave clear messages because there were fewer points for action than the old reports and therefore the key issues for improvement were more focused’. • a few who thought it was clear, but not particularly helpful.
Comments included: ‘They were the areas I was going to move forward on anyway. I don’t think there were any surprises and it’s not changed my development plan’, and ‘It was only useful in that it confirmed what we were aware of – that we were going in the right direction’. • some whose response was entirely negative.
For the minority of schools that had negative perceptions of the report, interviewees reiterated comments that had been made previously about the usefulness of the recommendations – that the report had not given real advice, that it was too generalised and did not contain enough detail, it was unhelpful because it did not consider the school context, or the recommendations and criticisms were not based on evidence. Most school interviewees felt that the report had supported the school’s improvement plans. As with the survey responses, interviewees valued the inspection’s confirmation of the school’s plans, or the fresh impetus or sharper focus it provided, as these comments reveal:
A lot we would have done anyway, but some plans have been given an extra push by the inspection, because Ofsted gives it greater currency and helps push it forward. Whilst these issues would probably have been on the SIP anyway, without Ofsted the school might have been more relaxed in these areas. We are trying to address the issues raised. We were already looking at data because there’s a data-driven mentality, so you’ve got to live with it. We’ve been a bit sloppy with data in the past – now we’re

Impact on School Improvement
57
demanding that teachers look at it to gain information and draw conclusions.
For those schools that did not feel that the report had supported their improvement plans, this was because the recommendations were not seen as relevant, the report made no difference at all to their plans, or they had a very negative overall attitude to their inspection. Contribution of Inspection to school improvement The inspection’s role in confirming school self evaluation and improvement plans was its most widely recognised contribution to school improvement. For example, this headteacher’s explanation was typical:
I have confidence that what I am doing and what I am asking my staff to do is right and is having an impact. I have identified the right issues and can carry that through with staff. It’s the validation that we are right and that is hugely beneficial.
The following case-study example shows in greater detail how a school thought that improvement had been assisted by the inspection and its recommendations.
Case-study: Inspection assisting school improvement One primary school had been graded 4, but whereas some schools that had been given notice to improve had found the inspection a negative experience, this school felt that there were good directions for the future. The headteacher explained that, ‘with these areas being identified, it was something we had down to look at, like our tracking system and lesson observations. Now we do it every half-term and the staff are used to it. It’s also made us look at how the children record their work and now we’re less work-sheet driven and looking at cross-curricular themes’.
Some schools also thought that an important way in which the inspection had contributed to improvement was by boosting staff morale and improving confidence, as described by this headteacher: ‘I think that because it was a positive inspection, it has given the staff a real boost. The school has had a lot of changes and it was important to know we were doing well, so we are now keen to make changes and carry on with those changes’. Several headteachers thought that the inspection had made a particularly useful contribution to school improvement by giving them added authority to introduce innovations or changes. The significance of the report providing a lever to the headteacher was described by this interviewee: ‘It has provided me with a very powerful management and motivation tool. Some staff had resisted change and were even obstructive – the s5 has helped to address this’.

Impact of Section 5 inspections: maintained schools in England
58
A minority of survey and case-study respondents thought that the inspection had actually hindered improvement. Such schools tended to be those that had been graded 3 or 4, but the following example is from a school graded ‘outstanding’.
Case-study: Inspection hindered school improvement The headteacher at a primary school complained about the amount of paperwork that the inspection entailed and how much time he had spent filling out forms instead spending the time more productively. He added, ‘Ofsted actually held things up, because we were so involved in preparing for it that taking on new initiatives was just too much. I was aware that I wanted certain things to be watertight so if Ofsted came in there was no ambiguity about things. It took a bit of creativity away from the school, because we thought, “Ofsted will want to see this”, whereas otherwise we might have said, “let’s abandon the curriculum for the day and do something creative”. The school is not a better place because of Ofsted and it hasn’t had a direct impact on children’s learning’.
In a secondary school that had been graded 4, the headteacher stated that the inspection ‘had done more harm than good – it’s probably set the school back two years’. These examples are included to show the whole range of responses and it should be emphasised that the majority of schools considered that the external confirmation of their self evaluation provided by the inspection, was regarded as valuable. Responses relating to the perceived contribution made, or likely to be made, to school improvement are summarised in Table 4.8 below.
Table 4.8 Extent of inspection contribution to improvements in your school
Already contributed
%
Likely to contribute
To a great extent 14 20 To some extent 71 69 Not at all 14 10 No response 1 1 N = 1597 Due to rounding, percentages may not sum to 100 1586 respondents answered the question on ‘contributions already made’ and 1578 the question on ‘likely to contribute’. Source: NFER evaluation of the impact of Section 5 Inspection School Survey 2006
There was a clear, positive response in that the great majority of those surveyed thought that the inspection had already contributed, or was likely to contribute, to some extent, to school improvement. More respondents thought it was likely to contribute to a great extent in the future than it had already,

Impact on School Improvement
59
which was not surprising, given that some developments would take time to show results. This is also supported by the survey responses to a question on who had identified the areas for improvement, (see Table 4.9), where the great majority thought that it had been a combination of the school and the inspection and far more considered it was the school rather than the inspection report alone.
Table 4.9 Have your school’s areas for improvement been identified by:
Yes %
the school only 15 the s5 inspection report only 1 a combination of the above 84 No response 1 N = 1597 Due to rounding, percentages may not sum to 100 1577 respondents answered this question Source: NFER evaluation of the impact of Section 5 Inspection School Survey 2006
Findings from the statistical modelling analysis (see Section 5.4 and Appendices A and B) revealed the significance of some background variables. Small and medium-sized primary schools were more likely to feel that the inspection had impact, to a great extent, on school improvement, than was the case in large primary schools. In addition, schools from the midlands, rather than the north or south were more likely to feel that the inspection had impacted to a great extent on school improvement. In order to put the part played by the inspection in school improvement into context, both the survey and the case-study respondents were asked about the other factors which they thought contributed to school improvement. Table 4.10 shows the survey responses. The factors that survey schools considered to have the largest effect on school improvement were: • Staff commitment and effort
• Good communication between staff and senior management
• School ethos
• School self evaluation
• Assessment/monitoring and tracking systems.

Impact of Section 5 inspections: maintained schools in England
60
Table 4.10 Extent to which the following factors contributed or are likely to contribute, to school improvements
To a great extent
%
To some extent
%
Not at all %
No response
% Staff commitment and effort/professional pride 77 18 4 1 Good communication between staff and Senior Management Team 74 20 5 1
School’s self evaluation 68 30 2 1 Sharing good practice/innovation through local network 37 53 8 1
Improved pupil assessment, monitoring and tracking/targeting systems 65 31 4 1
Lesson observations 39 54 6 1 School ethos 69 20 9 1 Changes to leadership/management team 25 38 35 2 Inspection 7 66 25 1 Staff development 45 47 6 1 Emphasis on/new techniques in teaching and learning 31 59 8 1
Local authority input 9 64 26 1 Initiatives to improve pupil attitudes/behaviour 20 52 27 1 Impact of school improvement plans 41 50 8 1 Improvements to school buildings 27 46 25 1 N = 1597 Due to rounding, percentages may not always sum to 100 A total of 1588 respondents answered at least one item in this question Source: NFER evaluation of the impact of Section 5 Inspection School Survey 2006
For school interviewees, the other most important factors were (in descending order): • The senior leadership team/school leadership
• School ethos
• Self evaluation
• Monitoring/assessment/targeting systems
• Vision and purpose.
There was therefore a very similar perception among the survey and the case-study respondents as to what contributed most to school improvement and these views were also supported by governor and parent interviewees. Governors put teachers/school staff at the top of their list, followed by school leadership, school ethos and assessment and monitoring. Parents put the headteacher/school leadership first, followed by school staff, school ethos and

Impact on School Improvement
61
quality of teaching. The parental view of the importance of the headteacher’s role was illustrated by this parent’s response:
The head has a massive influence on the running of the school and on the morale of the staff. She has a massive impact because she is prominent and proactive. She’s interested in what’s going on in school and is always there at events – she makes sure she makes an appearance.
The following comment, made by a headteacher when asked about the most important factors in school improvement, is a good example of school thinking behind the ranking order:
This is a Catholic school and what drives improvement above all else is the school’s vision and commitment to fulfilling God-given potential. I rate that as first and suspect that from a professional angle, that is a paramount factor for most teachers. The collective commitment of the SLT is also vitally important and so is accountability to parents and to the local authority. Where does Ofsted fit? At the back of the mind is the sense that you will have to account to Ofsted at some stage and that becomes particularly strong in an Ofsted year, but other factors will drive school improvement in the intervening years.
Although other schools may not have defined their ethos in quite the same way, it seems likely that many school staff would agree that the intangible factors of school ethos and purpose were as important as the more practical contributions.
4.5 Progress in school improvement This section considers the progress in improvement that case-study schools thought that they had made by the time of the second wave of interviews (mainly in February 2007). All the schools that were contacted again (32), reported that, in their opinion, they had made progress, although this varied from substantial progress to a perception that the school had ‘moved on’, but without any specific evidence, as in this response: ‘Yes we have progressed, as we have settled staff who are open and share good practice now’. Most schools reported that they had made particular progress in taking action on their recommendations, as with these two examples:
Yes, there has been progress – the excellent teaching is being spread more widely, there are more staff on CPD, we have done more on pupils’ personal development and we now have better communications with parents. Yes, we’re still collecting evidence, but I think we’re moving our teaching on from satisfactory to good. We have better evidence now of

Impact of Section 5 inspections: maintained schools in England
62
children’s progress so it’s easier to intervene effectively with weaker pupils or more able ones.
A number of schools reported progress, not only on inspection recommendations, but in other areas too, as this headteacher explained: ‘Yes, we have made progress in the designated areas and in others. In particular, we have been extending our policies on support for vulnerable children and improving levels of physical activity’. Some schools were anxious to point out that there had been definite progress, but it was not necessarily linked directly with the inspection: ‘Yes, there’s an on-going improvement, but it’s not down to the inspection. The issues we are addressing were things we had already identified’. In a few cases, where there had been a negative reaction to the inspection, progress on school improvement was reported, but it was regarded as having been hampered by the inspection, as in this response from a school graded unsatisfactory: ‘Yes, we have made progress, but that’s been despite Ofsted. We could have done more if we hadn’t been labelled – that influenced teacher recruitment, so we are short of ten teachers’. However, regardless of how the progress was attributed, there was a strongly positive response on levels of improvement, even from schools that had initially been very concerned about their situation. This example was from a school that had been graded 4 and where the inspection was described as having ‘stirred up a lot of strong feelings in the school’. Even so, the headteacher stated that: ‘…attendance is better, the provision for post-16 students is better, as is the accommodation made available to them. The signs are that the quantitative evidence is moving in the right direction’. The case-study schools were also asked to reflect on how much they now thought that the inspection had contributed to progress. Their responses were generally less positive than those of the survey schools in answer to the question on how much the inspection had contributed to school improvement (see Table 4.9). Four schools believed that the inspection had made a significant contribution, as one special school headteacher explained: ‘Ofsted made a big difference – the school was too cosy before. The inspection was helpful in pinpointing particular areas that still needed attention and the lead inspector was sympathetic and easy to deal with’. Another interviewee made the point that the inspection had a particular value for her as a new headteacher because it provided ‘a viewpoint of the school’ from which she could move on and gave her ‘something to root my headship in’. She added ‘although you always evaluate, it’s good to get an outside perspective’. Those who thought the inspection had made a limited contribution attributed it to confirmation of the school’s self evaluation and planning and of providing focus and impetus. This headteacher’s comment summed up the views of

Impact on School Improvement
63
several of the others: ‘To be honest, the inspection made very little difference. We would have done all of it anyway, but it probably speeded up the process’. Some of the schools that thought that the inspection had made no contribution would have agreed with this to a large extent too, but they put less value on the confirmatory role of the inspection, as in this example from a grade 2 school manager: ‘The inspection made no difference, because all the issues would have been done regardless of Ofsted. I suppose the only value was confirming our issues’. The small number of schools that held a belief that the inspection had contributed nothing were usually those that had been unhappy with the inspection, felt that they had been misjudged, or believed the inspection was too ‘data-driven’, as the following example illustrates.
Case-study: belief that the inspection had not contributed to improvement Senior staff in a primary school that had been graded 3 expressed a concern about the evidence on which the inspector’s judgements were based. The headteacher’s perception was that: ‘Ofsted did not add any value at all. We were tracking pupils anyway; it was just that we did not record every single assessment. This is a small school and we know the children very well – our deep knowledge just wasn’t taken into account. The inspection missed the evidence for the progress we are making. Progress is affected by cohort size and pupils coming into and leaving the school and one Year 6 child represents more than ten per cent of the cohort’s results’.
On a more positive note, several school interviewees commented on the motivation to attain a higher grade next time they were inspected, as illustrated by this comment: ‘The staff are probably more motivated, they seem to realise what we have to do to get graded good’. There was too, the effect of needing to be prepared for the next inspection, summed up by: ‘It’s keeping us on our toes because we know they’ll be back’. Schools that had dismissed the inspection’s contribution to their progress as negligible did admit that the report would nonetheless have an influence – one interviewee referred to it as a ‘live document’ and another described it as ‘a helpful part of the navigation’. The most positive aspect of the school case-study responses was the fact that all of them reported some level of progress in school improvement since their inspection. Although the majority of both survey and case-study schools considered that their inspection had contributed to some extent, rather than to a large extent to this progress, there were individual school examples where the inspection was regarded as having played a significant role. Above all, schools recognised that however reliable their own self evaluation was, it was useful for parents and local communities, as well as for their own staff, to have their judgements confirmed by an external and objective body.

Impact of Section 5 inspections: maintained schools in England
64

Impact on outcomes
65
5. Impact on outcomes
Key findings • The area of greatest perceived impact, in relation to the s5
recommendations, was in assessment, monitoring and tracking. Impact had also been felt in the areas of teaching and learning and classroom culture.
• Many case-study schools believed that, although the inspection had not identified any new areas for development, it had however, provided impetus to drive forward change.
• There are some indications in primary schools that, where the recommendations identified a specific subject for improvement, an improvement in outcomes in this subject did indeed occur in several of the case-study schools in 2005-06.
• In the most successful secondary schools, in terms of key stage 4 outcomes, the main thrust seems to have been a specific recommendation on raising standards, or a recommendation to do with assessment, pupil tracking or marking, though it cannot be said with any certainty that the positive outcomes were directly related to the inspection.
This chapter considers the evidence relating to the key research question: what impact has the Ofsted inspection had on pupil outcomes? This is a complex question with no straightforward answers. However, this NFER evaluation has involved the collection of three types of data relating to impact: qualitative interview data, quantitative survey data and aggregated school statistics. This chapter presents the findings on outcomes from each of these data sources and offers some concluding comments about the extent and nature of the impact of inspections upon pupil outcomes.
5.1 Impact of actions During the first wave of school case-study visits in autumn 2006, the interviewees were asked if they could identify any impacts from the actions that they had taken to implement the report recommendations. Responses showed that it was in the area of assessment, monitoring and tracking that schools considered the impact had been greatest. There were many references to improved assessment systems, more differentiation, closer monitoring of individuals and groups of pupils and better feedback to pupils. The following two examples reflect similar comments made by others:

Impact of Section 5 inspections: maintained schools in England
66
We are now sharing assessment criteria with pupils in key stage 3. We’re trying to develop work using assessment feedback and increased use of data and there’s more discussion now about individual pupils and their targets.
Staff are more focused on data and analysis. In the past they felt that this was something just for the person who does the performance review.
Governors had also recognised the impact on this area, as this secondary school chair of governors explained:
The ICT assessment and review facility has made a massive difference. We had a meeting recently to look at results, and now we have a huge amount of information compared to the past. We are able to look at trends and comparisons and can see that some departments have not improved at the same rate and we can then look at this in more depth.
At this stage, interviewees were still cautious about the extent to which the new methods would produce definite outcomes, although most expressed optimism that this would be so, as in this headteacher’s comment: ‘Rigour of tracking has improved, but we need to have it in place for some time to see if it stimulates improved outcomes – possibly in a year’s time’. Two other areas of impact cited frequently were those of teaching and learning and classroom culture. Several schools reported having taken up the SEAL (social and emotional aspects of learning) programme, and others had developed circle time techniques, or introduced learning to learn and thinking skills programmes. Again, it was judged too early to be able to predict outcomes, but there was enthusiasm about the difference these changes had made, as these two comments reveal:
The vibrant schools and story-making project have made the children more aware of how they learn. It is benefiting the children, they talk more readily about what they need to do and they have more control over their learning. They are changing from being passive to active.
Generally it’s had impact on the way pupils speak to one another, and their questioning technique has improved, so they are more independent now and the more sensitive are braver now.
A number of schools had been given a recommendation about improving attendance and this was often regarded as a very difficult issue to address. Nevertheless, several that had introduced new methods, such as the First Day system, to deal with attendance, were able to report some progress, and this was supported by governors in the schools concerned. In a secondary school, where sixth form attendance had been an issue, for example, it was reported that ‘attendance in Year 13 has increased from 89 to 95 per cent’.

Impact on outcomes
67
A less tangible impact, but a significant one, was boosting the morale and confidence of staff. The positive effect of this is demonstrated by the response from a case-study school where the inspection led to improved staff confidence (see below).
Case studies: Positive impact on staff morale One case-study school was a secondary school that had been graded satisfactory and had undergone a series of radical changes. The deputy headteacher, reflecting on the impact of the inspection, stated that: ‘If I had to give a word, I think it would be confidence. Confidence is not measurable, but it makes a massive impact. Those that wanted the school to turn around believed we were on the right lines, and that confidence went through the staff and the students’.
Other areas where schools considered that there had been an impact, but which were mentioned less frequently were: • improved leadership and management
• improved behaviour
• better communication with parents
• staffing changes
• broader curriculum
• better use of ICT
• improvements to food.
Not surprisingly, many schools thought it was too early to be able to evaluate any impact on performance and attainment at the time of the first wave of interviews. Most were confident that there would be better results in the future, but cautioned, for example, that ‘the full extent of the intervention will not be seen for some time’. Some also drew attention to other factors that had to be considered, as in this comment: ‘It’s difficult to say, we’ve only done one round of data analysis since the inspection. Anyway, it depends on the cohort’. In one school that had been graded 4, the deputy headteacher drew attention to the pressures of having a lot of recommendations to implement and how demands on staff could actually hold up progress: ‘It will make a difference when people are in a position to just get on with it, without the constant pressure of being assessed and monitored. Scrutiny can be a good thing, but it is energy sapping’. Many school interviewees were determined to point out that whatever impact their actions may have had, or were likely to have, this owed little to the inspection itself. As discussed in Chapter 4, this was because schools were already implementing the changes recommended in the inspection, or planning

Impact of Section 5 inspections: maintained schools in England
68
to do so. Consequently any impact on the school was not perceived as being due to the inspection, as the following comments illustrate:
I want to make it clear that these are the areas we were working on before Ofsted came. We haven’t changed our direction because of Ofsted, and the only reason we would do that is if they pointed something out that we weren’t aware of.
Last summer’s exam results were a great improvement, but the processes needed to make the improvement were already there.
When discussing impact, some schools also emphasised another point made frequently in assessing the relative contribution of the inspection (Section 4.4), that it did not identify areas for improvement, but it did provide impetus, as described by this headteacher: ‘These activities and outcomes would have happened even if we had not been inspected, but perhaps it did get things moving more quickly in some areas’. A minority of schools reported a negative impact from acting on recommendations, but they made some interesting observations. A secondary school that had been graded 2, said that the emphasis on reading standards had led to improvements there, but at the cost of writing – ‘we’ve cured the reading problem, but now we can’t write’. In another grade 2 school, the deputy headteacher stated that yet more emphasis on target-setting and pupil monitoring was making school improvement more challenging because staff were sceptical about how it was interpreted by Ofsted – ‘there’s been a negative impetus, because it was a disheartening experience and it’s not made selling targets and monitoring any easier for the management team’. Schools were especially concerned about recommendations that were perceived as going against the ethos of the school, as in a secondary school, graded 4, where changes in sixth form admissions had been particularly uncomfortable (see also Section 4.2):
We were advised by Ofsted to do that [not allow students with poor GCSE scores to take A levels], and in terms of results, it will improve them. The morality side is another issue. There were lots of arguments in the school that we shouldn’t be doing this, but in the end you’ve got to do what’s necessary to stay alive.
5.2 Impact on outcomes from follow-up case-study interviews When the second wave of case-study interviews took place, headteachers or those in senior management positions, were asked to discuss what impact, or further impact, taking action on recommendations was having. School

Impact on outcomes
69
respondents were asked if they had any quantitative or qualitative evidence relating to the impact of the recommendations. Quantitative evidence Most interviewee perceptions, in terms of quantitative evidence of impact, related to pupil progress and achievement. Impact on test and examination results is reported in Section 5.3, but some of the comments made by interviewees in four schools provide examples of the impact that schools thought had now become evident.
There’s been quantitative evidence in the results of Year 6 mock SATs. These are higher than expected, even though our targets at this stage were quite ambitious. There’s been a definite impact in the first two areas [identified for improvement], with a dramatic improvement in pupil writing skills. As a result we should walk all over the targets for this year. The CVA is up and performance in key stage 3 is within the target range. The GCSE results went up eight per cent and exceeded the local authority target.
We have clear evidence for our Year 2. We find that 82 per cent are meeting or exceeding their targets in reading, 74 per cent in writing and 89 per cent in numeracy. These are all an improvement on last year. We also had higher numbers on Level 3. We are succeeding in challenging our more able pupils and providing good support for the lower-attaining ones.
Two of the schools that received recommendations relating to the gender gap in achievement provided contrasting examples of considerable success and more limited improvement:
There’s been a narrowing of the differential in achievement between boys and girls between 2005, when there was a 17 per cent difference between girls’ and boys’ A*-Cs, and 2006, when it was six per cent. Boys’ performance was slightly better, but it’s still a problem. There are still too many boys on the wrong side of the C/D borderline. We’ve targeted coursework among boys to get it finished earlier, but whatever strategies are in place, the girls perform better than the boys.
As had been the case with general comments on impact, the interviewees were not always convinced that these quantifiable improvements were directly related to the inspection and some referred again to the role of the inspection in confirming measures that the schools were already taking. One headteacher did not think improved results were the direct result of their inspection, ‘but

Impact of Section 5 inspections: maintained schools in England
70
the impact is in the external validation. The areas they gave us were the areas we gave them’. In addition to levels of achievement, other examples given of quantitative evidence of impact were: • fewer exclusions
• positive comments on pupil surveys
• better attendance by pupils
• better parent attendance at events
• increased demand for school places.
Qualitative evidence of impact The positive effect of the inspection on school confidence and staff morale, referred to by interviewees during the first wave of visits (Section 5.1), featured again during the later wave of interviews, with comments such as: ‘Staff morale is good. Ofsted gave us confidence that our self evaluation was on the right lines and that our quality of teaching and learning is good. This confidence has carried on, so that staff feel they are working in a good school’. There was also a perception in some schools that staff commitment had improved because the inspection had provided an impetus for innovation:
there is less resistance to testing, accountability and hard data since Ofsted – the inspection was the evidence I needed to move the staff. I feel they are more on board now – the inspection report may have been the catalyst to some extent for the staff to wake up.
This comment and the following one, about changes in staff attitude, support the views already reported in Chapter 4 about the value of the inspection in terms of providing assistance for overcoming barriers to innovation: ‘there has been a discernible change in subject leaders’ attitudes – they talk more about individual pupils and their individual targets’. Other more individual responses on qualitative evidence related to: • staff CDP
• positive feedback from parents
• pupil attitudes and self-esteem
• pupils’ awareness of their own learning.

Impact on outcomes
71
5.3 Impact on quantifiable outcomes This section examines changes in quantifiable outcomes, particularly key stage 2 outcomes in case-study primary schools, and key stage 4 results for secondary schools. It is important to note that there are several factors which need to be taken into account when looking at outcomes data of this sort, including the following: • Firstly, the time period for the evaluation, consisting of approximately 15
months from the start of the pilot evaluation to the data analysis for the main study, was relatively short in school improvement terms. This means that any improvements in outcomes are likely to be limited, because there has only been a relatively short period of time for the inspection (and the recommendations) to have had an impact. The research literature in the area of school improvement indicates that it can often take three, or even five, years for improvements in outcomes to become manifest.
• The second factor to consider is the effect of multiple variables. In other words, there were many others factors, other than inspection, that could have affected pupil outcomes. These could have included the quality of the 2005-06 pupil cohorts, changes in staffing, and the impact of other initiatives, including the national strategies. In other words, where there has been an improvement (or a decline) in pupil outcomes, causality for this cannot necessarily be attributed to the inspection, or to post-inspection actions. This is especially true given that a predominant view in the schools was that inspection findings tended to be ‘confirmatory’ and ‘affirmatory’, suggesting that pre-planned school actions have primacy over more indirect inspection-inspired recommendations.
• Finally, it is also worth adding a note of caution about the nature of inspection recommendations and the levels of implementation of these recommendations by schools. Some recommendations are more closely linked to pupil outcomes than others, and some can be implemented quickly, whereas with others it might take a number of years for full implementation to be achieved. In addition, the inspections took place at different times and schools will vary in terms of their levels of commitment of implementing the required changes.
For all of these reasons the findings presented in this section need to be treated with considerable caution. There were 36 case-study schools in the pilot evaluation and a further 36 in the subsequent, more detailed evaluation, giving a total of 72 schools for which we have detailed information. In addition to visiting each of these schools, and interviewing staff, governors, parents and pupils, a proforma of quantitative information was completed for each school (the proformas for primary and secondary schools are provided in Appendices C and D). Of the 72 case-study schools, 33 were secondary schools, 31 were primary schools and eight were special schools.

Impact of Section 5 inspections: maintained schools in England
72
Key stage 2 An examination of the key stage 2 results in key subjects for the 23 primary schools for which we had data (which are ‘raw’ results, with no adjustments for pupil intake or school context) revealed the following information:
• The percentage of pupils achieving level 5 in English, between 2005 and
2006, increased in 17 of the 23 schools, stayed the same in one school and decreased in five schools.
• The percentage of pupils achieving level 5 in mathematics, between 2005 and 2006, increased in 17 of the 23 schools and decreased in six schools.
• The percentage of pupils achieving level 5 in science, in this period, increased in ten of the 23 schools, stayed the same in one school and decreased in 12 schools.
These raw results, on their own, should not be used as direct ‘findings’ on the impact of inspection on pupils’ outcomes, though it is useful background to know that the majority of schools experienced improvements in the proportions of pupils at level 5 in English and mathematics in 2006 compared to the previous year, whereas progress was more mixed in science. A more instructive approach is to examine the interaction between the inspection recommendations and the quantitative data for each school to see if it is possible to identify any key factors related to inspection that might have contributed to these improvements. Analysis of the data in this way, as has already been noted, is difficult because of the sometimes broad nature of inspection recommendations and the short timescale between the inspection and the end of key stage tests and examinations in 2006. Sometimes the recommendations related to a particular subject (notably English, mathematics or science, or all three), or to a particular key stage, or to a particular group of pupils (such as able pupils or boys). On other occasions, the recommendations were much less directly related to attainment; for example, ‘provide governors with training about their roles and responsibilities’. Where the recommendation was to do with a particular subject or subjects, it was possible to look at the key stage 2 results for this subject to see if there had been any improvement (but, again, causality should not be assumed). Some examples of subject improvements in particular schools are provided below. • In School A’s inspection report there was just one recommendation: to
ensure that all pupils were suitably challenged throughout mathematics lessons. This appears to have had some influence (or the school was already taking measures to achieve this) in that between 2005 and 2006 the proportion of pupils at level 4 or above in mathematics increased from 64

Impact on outcomes
73
per cent to 68 per cent, and at level 5 the proportion increased from 21 to 26 per cent.
• A recommendation was made to School B that staff should raise standards of writing throughout the school: it seems possible that this had an effect on the level 5 English results because the proportions of pupils at this level increased from 14 per cent to 33 per cent between 2005 and 2006.
• Something similar to this (improvements in English outcomes) occurred in School C, where the recommendation was to improve attainment of all pupils in writing, particularly that of boys, the proportion of pupils at level 5 in English in this school increased from 26 per cent to 48 per cent.
• Likewise, in School D, the recommendation was to ‘raise standards in writing’ and the proportion of pupils at level 5 increased dramatically, from nine per cent to 57 per cent.
There were several instances where the recommendation was to improve attainment in all three key subjects (English, mathematics and science), but the 2006 results for the schools indicated improvements in two subjects and a decline in a third. This perhaps suggests that a recommendation for all-round improvements for attainment might be too ambitious for some schools: it is perhaps better to focus, wherever possible, on one or two subjects and / or a specific aspect of teaching, learning or assessment. Not all schools had improved key stage 2 outcomes in 2006. There were two primary case-study schools where the proportions of pupils at level 5 declined in all three key subjects. One of these was School F where the proportions of pupils achieving level 5 went down by 17 per cent in English, by three per cent in mathematics, and by ten per cent in science. The two recommendations for this school were not subject specific: (i) involve pupils more in identifying what they need to learn next; and (ii) make a clearer distinction between specific groups of pupils so that their progress is tracked more effectively. Key stage 4 Of the 72 case-study schools, 33 were secondary schools and the research team had appropriate data from 32 of these. An examination of the key stage 4 results4 for these schools (which, again, are ‘raw’ results, with no adjustments for pupil intake or school context) reveals the following: • Of these 32 schools, 25 registered an improvement in the proportion of
pupils achieving five or more GCSEs at grades A*-C in 2006 compared to the previous year. For two schools the proportion remained the same, and for five schools there was a decline in the percentage of pupils achieving five or more GCSEs at these grades.
4 Validated key stage 3 results were not available at the time of writing.

Impact of Section 5 inspections: maintained schools in England
74
• The biggest single improvement using this indicator was in School G, where the proportion of pupils achieving five or more GCSEs at grades A*-C increased from 21 per cent to 44 per cent. One of the Ofsted recommendations for this school was to ‘raise standards’ and this certainly seems to have been achieved.
• In another school, School H, the proportion of pupils achieving five good GCSE passes increased from 53 to 68 per cent and there is a possibility that actions relating to a recommendation to improve assessment and marking may have contributed to this (the CVA score for this school also improved from 992 to 1014).
• In relation to School I a recommendation was made ‘to raise standards and achievement for all pupils, especially in mathematics and science’. This appears to have been achieved because the proportion obtaining five good GCSE grades increased from 32 to 43 per cent, and the proportion achieving five good GCSE grades including English and mathematics increased from 24 per cent to 34 per cent.
• For School J one of the recommendations was to improve the results of lower attaining pupils and this seems to have occurred to some extent in that the proportion of pupils obtaining five or more GCSEs at grades A*-G increased from 92 to 94 per cent.
• As with the primary schools, there were many more cases of recommendations potentially contributing to improvements, than of poor results that might relate to the content or focus of an inspection recommendation. An example of the latter was School K, where all the recommendations were aimed at improving underachievement in the sixth form. Although the pass rate at AS level improved from 74 per cent in 2005 to 80 per cent in 2006, with respect to A2 level the percentage pass rate declined, as did the average number of passes per student. In this example, Ofsted’s emphasis on a requirement for progress in the sixth form has made little difference.
5.4 Findings from statistical modelling Introduction Questionnaire data was collected from 1,597 primary and secondary school headteachers and managers as part of this evaluation. This data contains information about the SEF, oral feedback and the written report, as well as information about what headteachers and managers thought about the inspection findings. This data has been combined with an Ofsted database and the NFER’s register of schools database (ROS). Two multinomial logistic models were constructed in order to address the two main objectives of the research: identifying factors behind the levels of satisfaction of the school respondents with the inspection, and identifying

Impact on outcomes
75
factors which influence perceptions of the impact of the inspection on school improvement. The first outcome measure in this analysis was the satisfaction level of senior leaders with the inspection. This was indicated in the answers to a survey which allowed responses of: very satisfied, quite satisfied and not at all satisfied. This outcome was modelled against self evaluation, oral feedback, view of the inspection process, view of the written report and a number of background variables including grade, region, inspection period, school type and school size. Full details of the results from the ‘satisfaction model’ are presented in Appendix A of this report. The second model outcome measured the impact of inspection on school improvement (with answers of: to a great extent, to some extent and not at all). This outcome was modelled against the perception of the usefulness of s5 inspections, area of school improvement, view of the Ofsted inspection team, self evaluation, and a number of background variables including grade, region, inspection period, school type and school size. Full details of the results from the ‘impact model’ are presented in Appendix B.
5.5 Overview on impact Identifying impacts of inspection can be difficult, mainly because there has been a relatively short timescale (for this evaluation) between the inspection and the delivery of any outcomes from the changes made as a result of inspection. In addition there are many factors contributing to achievement and standards in a school, apart from inspection, and it is extremely difficult to disentangle or isolate the effects of these various factors. This provides part of the explanation as to why inspection was often seen as confirmatory, or why the effects of inspection might be interpreted as being indirect rather than direct. Nevertheless, the inspection process clearly has had an impact on school improvement in many of the schools featured in this research. Both the qualitative findings and analysis of the schools’ outcomes data provide some indication that assessment, monitoring and pupil tracking are the areas where inspection has had the greatest impact. There are also some indications that in primary schools, where the recommendations identified a specific subject for improvement (especially English or writing) improvements in this subject did indeed occur in several of the case-study schools in 2005-06.

Impact of Section 5 inspections: maintained schools in England
76

Overview of schools’ perspectives
77
6. Overview of schools’ perspectives
Key findings • Overall, over half (52 per cent) of schools were very satisfied with the
inspection and more than a third (36 per cent) were quite satisfied.
• ‘Outstanding’ schools were most satisfied with inspections, whereas schools given ‘notice to improve’ were least satisfied. Primary schools were less likely to be satisfied than other schools.
• At least 80 per cent of schools were satisfied with the quality of various aspects of the inspection, particularly in relation to Ofsted’s interaction with pupils (57 per cent were ‘very satisfied’ and 36 per cent ‘quite satisfied’).
• Three-fifths (61 per cent) of schools either agreed or strongly agreed that the new s5 inspection process was less stressful than the previous system, whereas just under a quarter (23 per cent) disagreed and 14 per cent strongly disagreed.
• A substantial majority of survey respondents (83 per cent) thought the actual monetary costs incurred due to s5 inspections was minimal; just under a fifth (18 per cent) thought actual costs were significant. In direct comparison with the previous s10 inspection process, costs overall were generally thought to be minimal (74 per cent).
• The main benefit of s5 inspections, mentioned by 86 per cent of survey respondents, was thought to be that they had confirmed what schools had identified in their own self evaluation. Two-fifths (42 per cent) reported that the inspection had boosted staff morale.
• The biggest concern, mentioned by just over half (55 per cent) of the survey respondents, was the time taken for schools to complete the SEF. In addition, just over a quarter (27 per cent) perceived that there was an issue in relation to the use of data; although a greater proportion of schools inspected between October and December 2005 were concerned about the use of data, compared with schools inspected later, the difference was not statistically significant.
• Although schools were generally satisfied with the inspection, just under half (44 per cent) made suggestions for changes. These most often related to perceptions that the SEF should be simplified, more time should be allowed for inspectors to observe lessons, and that there should be more consistency across inspection teams.
This chapter offers an overview of levels of satisfaction with the s5 inspection process, including a summary of views on the main benefits of the new inspections and some of the concerns held by schools following the process. It also summarises perceptions on how the new process could be improved, as well as interviewees’ expectations of their next Ofsted inspection. This

Impact of Section 5 inspections: maintained schools in England
78
chapter includes findings from the questionnaire survey of 1597 schools and the more in-depth case-study interviews in 36 schools.
6.1 Overall satisfaction with the inspection The school survey included questions about levels of satisfaction with s5 inspections. As shown in Table 6.1 below, just over half (52 per cent) were ‘very satisfied’ and just over a third (36 per cent) were ‘quite satisfied’ with the s5 inspection. Only ten per cent (166 individuals) were ‘not at all satisfied’.
Table 6.1 Overall satisfaction with inspection
Overall satisfaction with inspection %
Very satisfied 52 Quite satisfied 36 Not at all satisfied 10 No response 3 N = 1597 Due to rounding, percentages may not sum to 100 1556 respondents answered this question Source: NFER evaluation of the impact of Section 5 Inspection School Survey 2006
As presented in Table 6.2 below, schools awarded a grade 1 for overall effectiveness were most satisfied with inspections, while those who were given notice to improve expressed most dissatisfaction. This was confirmed in the outcomes of the statistical modelling analysis. The modelling also revealed that primary schools were less likely to be satisfied with the inspection, in comparison with other schools.
Table 6.2 Overall satisfaction with inspections, by overall effectiveness grade
Satisfaction Grade 1 %
Grade 2 %
Grade 3 %
Grade 4* %
Very satisfied 90 60 35 29 Quite satisfied 9 35 46 44 Not at all satisfied 1 5 19 28 N = 1556 Due to rounding, percentages may not always sum to 100 Source: NFER evaluation of the impact of Section 5 Inspection School Survey 2006 *Grade 4 schools only include those given notice to improve
As shown in Table 6.3 below, the timing of inspection did not appear to have an impact on the level of satisfaction with inspections overall.

Overview of schools’ perspectives
79
Table 6.3 Overall satisfaction with inspections, by timing of inspection
Satisfaction 1 October-
31 December 2005%
1 January- 14 February 2006
%
15 February- 31 March 2006
% Very satisfied 52 54 53 Quite satisfied 37 35 37 Not at all satisfied 11 11 10 N = 1556 Due to rounding, percentages may not always sum to 100 Source: NFER evaluation of the impact of Section 5 Inspection School Survey 2006
It is perhaps not surprising to note that schools which had found the oral feedback useful were most likely to be very satisfied with the inspection overall. Three-quarters (76 per cent) of those who had found the oral feedback ‘very useful’ were ‘very satisfied’ with the inspection overall, whereas just two per cent of those who had found the oral feedback ‘not at all useful’ were ‘very satisfied’ overall. The statistical modelling analysis found that schools which felt there was appropriate guidance for completing the SEF were more likely to be very satisfied with inspections than quite satisfied or not at all satisfied (views of the SEF are discussed further in Sections 2.2 and 2.3). Those who strongly agreed that the inspection provided valuable confirmation of their SEF were more likely to be ‘very satisfied’ than satisfied to a lesser degree. The statistical analysis showed that schools which felt inspection outcomes had matched their initial expectations were more likely to be ‘quite satisfied’ rather than ‘very satisfied’ or ‘not at all satisfied’ with inspections. It can reasonably be assumed that had the inspection been more positive than they had initially expected, or revealed areas for improvement they had not already identified, these schools might have been more likely to say they were ‘very satisfied’ with inspections. The school survey also included a question on the levels of satisfaction with the quality of the inspection in relation to use of data, lesson observation and interaction with staff, governors, pupils and parents. The responses are illustrated in Table 6.4 below. The table shows that a substantial majority of respondents were ‘quite satisfied’ or ‘very satisfied’ with the quality of the various elements of the inspection. There was particular satisfaction with the quality of inspections in relation to Ofsted’s interaction with pupils; more than half (57 per cent) were ‘very satisfied’. There was also particular satisfaction with Ofsted’s interaction with staff; more than half (52 per cent) were ‘very satisfied’. It is worth noting that in comparison with the smaller-scale pilot survey, a greater proportion of respondents were ‘very satisfied’ with Ofsted’s interaction with staff (32 per cent were ‘very satisfied’ in the pilot survey). Around a fifth (19 per cent) expressed some degree of dissatisfaction with the quality of inspections in relation to the use of data (a similar proportion to that

Impact of Section 5 inspections: maintained schools in England
80
found in the smaller pilot survey). The findings from the statistical modelling analysis showed that schools which had experienced disagreements with the inspection team over what they considered to be ‘misinterpretation of data in general’ were less likely to be ‘very satisfied’ with inspections as opposed to just ‘quite satisfied’ or ‘not at all satisfied’. However, those who felt that any disagreements with inspectors had been completely resolved were more likely to be satisfied with inspections than not satisfied.
Table 6.4 Satisfaction in relation to the quality of the inspection
Quality of inspection in relation to…
Very satisfied
%
Quite satisfied
%
Not very satisfied
%
Very dissatisfied
%
No response
% Use of data 38 42 14 5 1 Lesson observation 41 43 12 3 <1 Ofsted interaction with staff 52 35 10 4 1 Ofsted interaction with governors 44 42 10 3 1
Ofsted interaction with pupils 57 36 4 2 <1 Ofsted interaction with parents 37 48 11 3 3 N = 1597 Due to rounding, percentages may not always sum to 100 A total of 1592 respondents answered at least one item in this question Source: NFER evaluation of the impact of Section 5 Inspection School Survey 2006
There was overall satisfaction with inspectors amongst survey respondents, with 58 per cent strongly agreeing and 32 per cent agreeing that the inspection team were very professional (nine per cent either disagreed or strongly disagreed with this, and those remaining did not respond). As shown in Table 6.5 below, the majority of respondents reported that they had given some thought to the inspection after the event, though a small proportion (eight per cent) either agreed or strongly agreed that they had not done so. Three-fifths (61 per cent) of survey respondents either agreed or strongly agreed that the new inspection process was less stressful than the previous system, though just under a quarter (23 per cent) disagreed and 14 per cent strongly disagreed. There was a general perception that the process was more about accountability than inspection, with 55 per cent of respondents agreeing and 17 per cent strongly agreeing that this was the case. As in the earlier pilot survey, there was more of a mixed picture in relation to views on the impact of inspections on staff morale. Just over half (51 per cent) agreed or strongly agreed that the inspection had indeed helped to boost morale, yet only a slightly smaller proportion (46 per cent) expressed some degree of disagreement with this (those remaining did not respond). The findings from the more sophisticated statistical modelling analysis indicated that respondents

Overview of schools’ perspectives
81
who felt that the inspection had boosted staff morale were more likely to say that the inspection had contributed to school improvement than they were to say it had not.
Table 6.5 Views on the Inspection
The inspection Strongly
agree %
Agree
%
Disagree
%
Strongly disagree
%
No response
% I have not thought about the inspection since the inspectors left 2 6 54 37 1
The s5 inspection was a lot less stressful than previous inspections 23 38 23 14 2
The process was more about accountability than inspection 17 55 23 3 2
The inspection boosted staff morale 18 33 26 20 3 N = 1597 Due to rounding, percentages may not always sum to 100 A total of 1592 respondents answered at least one item in this question Source: NFER evaluation of the impact of Section 5 Inspection School Survey 2006
Across case-study schools, parents and pupils were asked what they thought about inspections overall, and whether they were in favour of them generally. Overall, parents were in favour of inspections, and many made general positive comments, including: ‘I like the idea of someone external looking at the school, they probably put teachers under a lot of stress, but I believe they have to be done otherwise there are no comparative standards to measure against’, and ‘I think they’re a good idea. Schools need to be held accountable and this is one of the ways of doing this’. Pupils were also generally in favour of inspections. Comments included, ‘It gives the school a good idea about what they’re doing right and wrong…it pinpoints areas for improvement’ (grade 2 school), ‘…if you didn’t have inspections a bad school would stay bad’ (grade 3 school) and ‘It’s got to be good ‘cos then the school…know where they’re going wrong…where they need to improve…’ (grade 3 school). A small number of parents (three) specifically said that inspection reports had been useful when choosing a school for their child. For instance, ‘as a parent, Ofsted reports are very useful…I put quite a lot of stock by it’, and ‘it is important that parents have access to knowledge about a school’s performance. How else can you make judgements about where to send your children?’ Some parents (six) favoured the s5 process compared with the previous s10 process, particularly because they felt that the short notice contributed to a more accurate picture of a school being obtained. Comments included, ‘less notice is better because the inspectors would get a better idea of the school’

Impact of Section 5 inspections: maintained schools in England
82
and ‘having not so much notice is better…[it gives an] accurate picture of how the school is working’. However, others (three) felt quite the opposite and preferred the previous s10 system. For instance:
I didn’t take it as seriously…they wouldn’t get what they needed in two days of drop-in’ and ‘I know they get less notice now but that makes it difficult for the school. My son’s school was recently inspected and they got the short notice and it meant parents’ evenings and everything had to be re-arranged, which was a bit inconvenient’.
Pupils in seven case-study schools made specific comments about inspections having had an impact on their school. Comments from pupils included, ‘A lot of teachers are probably more organised…’, ‘we have brand new computers which are really good’, and ‘I reckon the teachers are a bit more hard…they’re teaching us new stuff so we get the right grades’.
6.2 The Cost of inspection Survey respondents were asked to comment on the extent of the costs to their school of their recent s5 inspection in terms of time involved in preparation and actual (monetary) costs, and in comparison with the previous s10 inspection process. The findings are presented in Table 6.6 below.
Table 6.6 Costs of inspection to schools
Extent of… Significant
%
Minimal
%
None
%
No response
% Time involved in preparation 62 36 1 2 Actual costs 11 83 5 1 Costs in comparison with s10 inspections 18 74 8 1
N = 1597 Due to rounding, percentages may not always sum to 100 A total of 1588 respondents answered at least one item in this question Source: NFER evaluation of the impact of Section 5 Inspection School Survey 2006
Just over a third (36 per cent) thought the costs to their school in terms of time spent preparing for inspection had been minimal. However, 62 per cent of survey respondents reported that costs in relation to the time had been significant; there was a perception that the SEF was time consuming to complete, which could have contributed to this cost in relation to time. Despite three-fifths thinking that the s5 inspection had been costly in terms of time, the general feeling amongst three-quarters (74 per cent) of the respondents was that the costs to their school of the new inspection process had been minimal compared with the previous s10 system. In the majority of

Overview of schools’ perspectives
83
cases, actual monetary costs were perceived to have been minimal (83 per cent), though 11 per cent felt actual costs had been significant. Senior managers in case-study schools were also asked about their perceptions of the costs to the school resulting from inspection. Views were very mixed regarding the costs in terms of time for preparation, with about half of the schools reporting that that costs had been minimal and the other half saying that they had been considerable (this did not seem to depend on the grade awarded by Ofsted). The headteacher of one ‘outstanding’ school said that: ‘the actual process is ongoing all the time. It is complete stress. [The LA] has high achieving schools and they put pressure on you’. In contrast, the headteacher of another ‘outstanding’ school said, ‘it was quite reasonable’. Similarly to survey respondents, staff in case-study schools generally felt the actual monetary costs of inspection were minimal. Exceptions were four schools which mentioned some administration costs, such as photocopying, and two schools had paid for supply cover (one to cover staff involved in talking to inspectors, and the other to cover a particular teacher who had been on sick leave after the inspection). The general perception in case-study schools was that the s5 process was more cost-effective in terms of time than the s10 system. For example, ‘The costs were definitely lower than for the previous s10 inspection. This model is far, far better than the old model’. There were a small minority of interviewees (in three case-study schools) who felt that the new process was more pressured than the s10 process; some thought the shorter inspection process was too intense. Comments included, ‘we did the same amount of preparation work in four days, as we used to do in 13 weeks’ and ‘The new system is so intensive it doesn’t help your work/life balance at all’.
6.3 Main benefits arising from the inspection The school survey included a question on what respondents thought were the main benefits for their school arising from the inspection. A pre-determined list of responses was included (see Table 6.7 below), though respondents were also given the opportunity to comment freely on ‘other benefits’. Interviewees in case-study schools were not asked specific questions about the benefits of inspections, so this section focuses primarily on the survey findings. If general comments relating to benefits of inspection were made during interviews, they are quoted below for illustration.

Impact of Section 5 inspections: maintained schools in England
84
Table 6.7 Main benefits from inspection
Benefits %
Confirmation/validation of self evaluation 86 Boosted morale 42 Stimulated improvements 33 Other benefits 7 No response 6 N = 1597 More than one answer could be put forward so percentages do not sum to 100 A total of 1494 respondents gave at least one response to this question Source: NFER evaluation of the impact of Section 5 Inspection School Survey 2006
A particular benefit, recorded by a substantial majority of respondents (86 per cent), was that the inspection had been valuable in providing external confirmation and ‘validation’ of schools’ own self evaluation. Similarly, when asked about the impact of inspections, a substantial proportion of case-study interviewees (22 individuals across 20 schools) said that the inspection had helped to confirm their own self evaluation. As one senior manager said, ‘I think it helped because it showed us we were on the right track. That was good…to have confirmed. I would say that was the biggest thing’. Only a third (33 per cent) of survey respondents reported that the inspection had helped to stimulate improvements. However, this could be linked to the fact that a large proportion of respondents felt that the inspection had confirmed their own self evaluation (thus, it could be the case that schools were working on improvements that they had already identified in their SEF, rather than ‘relying’ on Ofsted to stimulate what those improvements might be). The impact of inspections on school improvement is discussed further in Chapter 4. Two-fifths (42 per cent) of survey respondents felt that a benefit of the inspection had been that it had helped to boost staff morale. This benefit was raised in seven of the case-study schools. As one senior manager said, ‘the subtle thing, which is immeasurable, is confidence. If you have someone endorsing what you do in a highly complimentary way…it makes everyone feel upbeat and confident…quite buoyed up by it’. Similarly, a governor said, ‘since the inspection it’s made a big impact on our staff and that reflects on the students’. Of the seven per cent who made other comments, 28 individuals reiterated that the main benefit of inspections was to provide external ‘validation’ of their own self evaluation (giving impetus), and 22 respondents made similar comments in relation to the inspection confirming issues for improvement identified by the school. Fourteen individuals commented that the inspection had helped them to prioritise improvements in school. Seven respondents

Overview of schools’ perspectives
85
specifically mentioned that a benefit of the inspection had been that it had helped them come out of special measures. A smaller proportion mentioned that the inspection had helped to bond their staff into a team, had helped them gain confidence in Ofsted, and that it had been useful in terms of continuing professional development (CPD) for staff. Two people said the main benefit had been the relief afterwards that it was over.
6.4 Main concerns following inspection As discussed in Section 6.1, there was a high level of overall satisfaction with s5 inspections, though a small proportion of survey schools reported some level of dissatisfaction. The school survey included a more specific question on respondents’ main concerns following inspection. A pre-determined list of responses was included (see Table 6.8 below), though respondents were also given the opportunity to comment freely on ‘other concerns’. Interviewees in case-study schools were not asked specific questions about their concerns following inspections, so this section focuses primarily on the survey findings.
Table 6.8 Main concerns following inspection
Concerns %
Time taken to complete SEF 55 Use of data 27 Conflict of opinion between inspectors and school 16 Concerns about inspection process 14 Post-inspection concerns 12 Low impact of inspection 7 Other concerns 9 No response 20 N = 1597 More than one answer could be put forward so percentages do not sum to 100 A total of 1283 respondents gave at least one response to this question Source: NFER evaluation of the impact of Section 5 Inspection School Survey 2006
Just over half (55 per cent) of the respondents reported that they were concerned about the time it had taken to complete the SEF (a point already noted in Section 2.2). As one case-study interviewee said, ‘it is too big…I put off doing it…having evidence to justify everything is tough’. Just over a quarter (27 per cent) of respondents expressed concern about the use of data. Ofsted acknowledged this concern after s5 inspections had been introduced, and issued further guidance for inspectors on the use of data in June 2006. However, some concerns still remain amongst schools. As ‘use of data’ was a category in a pre-defined list in the school survey, no further detail about the nature of such concerns was available. However, this issue is also

Impact of Section 5 inspections: maintained schools in England
86
raised in Section 6.5 below, which discusses respondents’ suggestions for changes to the inspection process. Table 6.9 below explores whether there is any link between concerns over use of data and the timing of inspection (based on the survey responses). It would seem that a greater proportion of schools which had been inspected between October and December had concerns about the use of data, compared with schools inspected later. However, these differences were not statistically significant.
Table 6.9 Concern about use of data, by timing of inspection
Concerned about use of data?
1 October- 31 December 2005
%
1 January- 14 February 2006
%
15 February- 31 March 2006
% Yes 43 24 33 N = 429 The differences in the table are not statistically significant Due to rounding, percentages may not always sum to 100 Source: NFER evaluation of the impact of Section 5 Inspection School Survey 2006
A smaller proportion of survey respondents were concerned about conflict between the inspectors and the school (16 per cent), concerns over the inspection process (14 per cent), post-inspection issues (12 per cent), and the low impact of inspections (seven per cent). Some of these issues are discussed in more detail in Section 6.4 which summarises respondents’ views on how inspections could be improved. Of the nine per cent (144 individuals) who expressed other concerns, 23 individuals reported that the inspection had a negative impact on staff morale. Sixteen individuals perceived that the new s5 inspection process relied too heavily on the headteacher, which had added to stress levels. Ten individuals were concerned about how to further improve as a school following the inspection (this could mean that they required guidance on how to improve, or that they felt that there was no room for improvement). There was some general concern about the Ofsted grades, mentioned by nine individuals, including a perception that they were too broad or that the definition was unclear. Eight respondents were worried about how to ‘pick up the pieces’ following a ‘negative’ inspection. Other comments, made by an even smaller minority of respondents, related to perceptions of a lack of inspector expertise in analysing data, a lack of consistency between the opinions of inspectors and LA advisers, a lack of time for thorough inspection, and inspectors having their own agenda.

Overview of schools’ perspectives
87
6.5 Ways of improving inspections At the end of the school survey, respondents were given the opportunity, in an open-ended question, to suggest how the s5 inspections could be improved. The majority of schools were satisfied with inspections overall, as discussed above, though just under half (44 per cent) of survey respondents made suggestions for changes to s5 inspections. From those who did respond, comments were diverse and have therefore been summarised under broader themes (see Table 6.10). Senior managers and governors in case-study schools were also asked to comment on what they might change. Findings from both the survey and case studies are therefore reported in this section. It is worth noting that more than half (56 per cent) of all survey respondents did not respond to this question and thus did not suggest changes to inspections.
Table 6.10 Suggestions for improvements to inspections
Ways in which s5 inspections could be improved % N
Process 14 216 Use of data 12 183 Inspectors 12 190 Maximising impact 3 55 Timing of inspections 2 34 Other comments 15 231 No response 56 705 N = 1597 More than one answer could be put forward so percentages do not sum to 100 An open-ended, multiple response question A total of 705 respondents gave at least one response to this question Source: NFER evaluation of the impact of Section 5 Inspection School Survey 2006
As shown in Table 6.10, 14 per cent of all survey respondents (216 individuals) made suggestions for improvements in the s5 inspection process. This was most often in relation to simplifying the SEF (44 individuals) or allowing more time to observe lessons (44 individuals). The SEF was raised as a possible area for improvement during interviews with three headteachers, a senior manager and a governor across five case-study schools. The governor in one school said, ‘the SEF is time consuming and needs constantly updating. It’s a snapshot of a particular time. They should have regular updating…’ Time for lesson observation was another issue raised in case-study schools (mentioned by six headteachers, four senior managers and four governors). There was concern that fewer lesson observations had left some staff feeling ‘deflated’ as they ‘missed showing off what they could do’. One senior manager said, ‘with the reduction in the number of lesson observations. There

Impact of Section 5 inspections: maintained schools in England
88
are, perversely, a lot of disappointed teachers who gear themselves up for it and are not visited. Under the old regime they observed for whole lessons, this time it was just part lessons’. A governor said, ‘the inspectors didn’t achieve a balance of lessons [for example, by subject area or key stage] in their classroom observation’. Also relating to process, 39 survey respondents wanted to see changes in the grading system. This issue was also raised by staff in seven case-study schools. In particular, there were suggestions of changes to the grade bands, with a perception that they were currently too broad. As one governor commented:
It looks like a mountain to climb [from good to outstanding]. I would have thought there was an argument to have more bands of ‘good’. If a school’s bad, it’s bad, but when you try to differentiate between schools which are satisfactory and outstanding…good seems so broad. There are lots of schools that are very good which might appear to be under-rated.
Also regarding the inspection process, 23 survey respondents wanted inspections to be longer overall. This view was mirrored across 11 of the case-study schools (although, interestingly, not in any ‘outstanding’ schools). There was a feeling amongst these schools that an accurate perspective of a school could not be obtained in the relatively short time allowed. One senior manager’s view matched that of others: ‘a slightly longer visit would allow them to dig down and develop a more three-dimensional perspective’. Similarly, another senior manager said, ‘I would have not liked it to have been any shorter. It took them most of the first day to get used to the place. It was very quick’. There was a perception that, because inspection time is limited, this meant that a good deal of pressure was put on the headteacher and senior management team. Of the survey respondents, 22 said that pressure should be taken off of the headteacher and senior management team (for instance, by involving other staff in inspections). Twenty survey respondents said that they thought the process should incorporate more time to engage teaching staff. This view was reiterated in seven case-study schools. As one senior manager said, ‘some staff didn’t feel they could have their say’. Another said, ‘I wish teachers could have more opportunities to voice their concerns’. Interviewees in 12 case-study schools (across all ‘grades’ of schools) felt that individual feedback should be given to staff, particularly heads of department. Some who had been observed had not received feedback, which they would have found helpful. It was felt that time did not allow for this level of feedback. One senior manager who had been observed said:
I would prefer it if inspectors fed back to staff directly…I think it would be good for professional development. The feedback I got was second

Overview of schools’ perspectives
89
hand and it meant I didn’t get to question the inspectors or hear their explanations.
Overall, 12 per cent of all survey respondents made suggestions for improvements in relation to the use of data. Of these, most comments related to inspections being too ‘data-driven’ (74 individuals). Other comments raised the issue of use of Contextual Value Added data, though views were mixed (27 people wanted less emphasis to be given to CVA, whereas 23 wanted more emphasis). For instance, a headteacher in one school perceived that inspectors had put too much emphasis on CVA: ‘CVA can trip up good schools. It can all be manipulated by what’s included, for example, gender, ethnicity, etc’. The assistant headteacher of the same school said, ‘it is not proving to be as useful or reliable a tool and that is clouding our judgement/confidence in Ofsted. The CVA is not transparent’. In another school, the headteacher felt that the inspectors had not given enough emphasis to CVA. The school had been awarded ‘good’ for achievement and standards, though the headteacher felt that the value-added data suggested they were, at best, ‘satisfactory’. She said, ‘CVA did not feature and if that had been used we would have been deemed at best satisfactory and I would have accepted satisfactory’. She had wanted what she considered would have been a realistic ‘satisfactory’ grade to avoid staff complacency. Other comments, made by fewer people, included that inspectors should be given more training to interpret data, and that more emphasis should be given to data trends rather than just the most recent results. It is worth noting that, when interviewees were asked how the inspection process could be improved, one of the most common responses across case-study schools was about inspections being less data-driven (staff in 13 schools raised this as an issue). One headteacher described it as ‘data mentality’. There was a general perception amongst these schools that inspectors had been too focused on data which had not given them a comprehensive picture of the school context. One senior manager, for example, said that there should be ‘less emphasis on exam results, or rather a wider focus’. Another said there should be ‘less emphasis on data crunching and more understanding of the issues’. As was the case amongst survey respondents, some interviewees felt that there should be more focus on data trends: ‘there’s an over-reliance on one year’s data. I knew the poor writing results were a one-off, but they dragged the whole inspection process down’. There was some concern amongst senior managers about their perception that a ‘satisfactory’ grade for achievement and standards (resulting from examination results) had an impact on their overall effectiveness grade. Comments included:
‘If you get no more than ‘satisfactory’ for standards then that’s what you’ll get overall’, and: ‘the inspector said on his initial phone call “you do realise that with the results you’ve had, the best you’ll do in any category is satisfactory”, and that was quite telling’.

Impact of Section 5 inspections: maintained schools in England
90
The issue of use of data is illustrated in the case-study box below.
Case study: concern over use of data In one of the case-study schools, a Technology College that had received a grade 3 (‘satisfactory’) for overall effectiveness, there had been concern amongst staff that they were going to be given ‘notice to improve’ due to a focus on the analysis of ‘inaccurate key stage 2 data’. This key stage 2 data, reportedly, made students’ ability on entry look better than it was, meaning that their value-added data gave an inaccurate picture of progress (this inaccuracy had been confirmed by the LA). Ofsted accepted the school’s evidence that the data was inaccurate and so their inspection result for standards was better than it might have been if they had not accepted it. Staff were concerned that they had had to have a ‘battle over data’. The headteacher said, ‘I would argue very strongly that had we had a different team we would have had a different outcome…they [the inspectors] were very brave and willing to listen about the data. We were lucky that we had a very experienced team. The team had the confidence and experience to look beyond what the data said. They did accept it, but we had to work hard at it. I have colleagues who are Ofsted inspectors and I do not believe they would have made that judgement’. The headteacher felt that all inspectors should look beyond the data and ‘take into consideration your circumstances a bit more’, and that he should not have had have the ‘data battle’ he had experienced.
Interestingly, none of the 13 case-study schools where staff expressed a concern about use of data were graded as ‘outstanding’; four were ‘good’ but the others had received a ‘satisfactory grade’ (seven) or were given ‘notice to improve’ (two). Most of them (seven) been inspected during the first round of s5 inspections between October and December 2005, whereas three had been inspected slightly later in between January and February 14, 2006 and the remaining three between February 15 and March 31.5 As shown in Table 6.10 above, 12 per cent of survey respondents suggested changes in relation to inspectors. There was some perception that there was inconsistency between inspectors and between inspection teams (41 respondents). This perception was also reflected in the interviews conducted in nine case-study schools, as illustrated in the case study below.
5 This could suggest that schools inspected earlier had more concerns about the use of data.
However, it should be noted that more than half of the case-study schools were inspected between October and December and thus their views are disproportionately represented. Moreover, as discussed in Section 6.4 above, when the survey data was analysed to explore the relationship between concerns about use of data and the timing of inspection, no statistically significant differences were found in relation to timing.

Overview of schools’ perspectives
91
Case study: concern over inconsistency across inspectors Staff in a high-achieving, Church of England primary school felt strongly that the ‘outstanding’ result of their inspection might have been very different had they had a different inspection team. The lead inspector agreed with the school’s philosophy in relation to teaching and learning in the Foundation Stage, but the headteacher was concerned that a different team would have resulted in a different outcome. She said, ‘fortunately the lead inspector totally believed in our ethos so we got outstanding. Now, a school down the road, their headteacher doesn’t believe in learning through play…and the Ofsted inspector there complimented them for not using learning through play and they also got ‘outstanding’. Had we had their team, we would probably not have got outstanding. It’s a lack of standardisation. Who’s making these judgements? If that’s two schools within half a mile of each other, what’s the national picture? A senior manager said, ‘we are lucky that we had one [inspector] who appreciated what we had and what we were trying to achieve’. The governor also reiterated this view: ‘Inspectors should be more consistent. What would have happened if we didn’t get that inspector?’
Similarly, 25 survey respondents perceived that inspectors should be less ‘subjective’. There were also suggestions that inspectors should have more expertise related to the school context in which they were inspecting (32 survey respondents and interviewees in seven schools). Interestingly, headteachers of two PRUs had had very different experiences. One felt that the inspectors had understood the context of the PRU and said, ‘if he had not been a PRU specialist the inspection would have been a disaster’. In contrast, the other felt the inspectors had given recommendations that were not appropriate for a PRU context (such as giving pupils the opportunity to study vocational courses off site). Another suggested change in relation to inspectors was that they should be more supportive (26 survey respondents) and adopt a more ‘advisory’ approach (ten respondents). Staff in approximately half of the case-study schools mirrored this view and would have found it helpful if they had been given advice and support on how to implement the recommendations. It was felt that more of an on-going dialogue with inspectors would have been useful. As one senior manager said, ‘I would like someone at the end to say this is what we recommend and give you a couple of directions. There’s never any direction about how you can achieve the recommendations’. Of the small minority (three per cent) of survey respondents overall who suggested improvements in relation to maximising impact of inspections, comments most often related to the desire for inspection to link more closely with the LA advisers and School Improvement Partners (14 individuals). This relates to the previous point about on-going support; these individuals felt they were able to build more of a relationship with LA advisers and SIPs, which was more useful to support improvement. Staff in eight case-study schools also held this view. One senior manager said: The SIP is a better way of

Impact of Section 5 inspections: maintained schools in England
92
improving schools. That is effectively inspection by another means. I think that’s better as you have time to build a relationship. To include the SIP model into the SEF model is better. Then to have external verification, but maybe the SIP can advise’. Another said, ‘Ofsted should have a close look at the SEF and then have a discussion with the school advisers. There should be more dialogue between inspectors and advisers’. Of those who mentioned wanting changes in relation to the timing of inspections, most wanted more notice (22 survey respondents), though five respondents wanted less notice. Seven survey respondents said they would like inspections to be less frequent. Amongst survey respondents who made ‘other comments’ were some individuals who suggested that they would like a different framework altogether. A total of 16 survey respondents specifically said that inspections should not be required for ‘outstanding’ schools. Eleven respondents wanted inspections to have a broader remit (for example, focus on curriculum subjects, as the previous s10 system had done). It is worth noting that, included in the ‘other comments’ were also three per cent of all survey respondents (49 individuals) who made general positive comments rather than suggesting changes to inspections. Respondents in the ‘other comments’ category also included 13 people (one per cent) who specifically said that no change was required. Moreover, although interviewees across case-study schools gave suggestions for changes to inspections, staff across half of the schools specifically made positive comments about the new process; the new system was generally favoured in comparison with the s10 process.
6.6 Expectations of future inspections During follow-up interviews with headteachers and senior managers in case-study schools, respondents were asked what their expectations were for their next inspection. The most frequent response, made by interviewees in 18 of the 32 schools, was that they would aspire to obtain higher grades next time, though there was some perception that this would depend on the cohort at the time. Comments included: ‘The grades expected are still dependent on the year group and the cohort, however it would be fair to achieve a ‘2’ in all areas previously achieved ‘3’ and maintain other ‘1’s and ‘2’s’; and ‘we expect better grades, however, we are to a limited degree at the mercy of the cohort – if we get good results then we will get a better grade’. Senior managers in 11 schools specifically mentioned that they hoped they would have met their recommendations by their next inspection. One interviewee said, ‘The recommendations will be met fully – in fact we would

Overview of schools’ perspectives
93
be ready tomorrow if some-one came in’. Another senior manager said, ‘The school should have improved by the next Ofsted inspection. We should be in a position where the inspectors can see that the school is good at self evaluation and is addressing its priorities’. Other interviewees made more individual comments. For instance, the headteacher of one ‘outstanding’ school felt they were under pressure to maintain their positive inspection outcome: ‘We will put a lot of effort into preparing for it as we want a grade ‘1’ again – it won’t be quite as bad as we’re in a slightly better position, but it will be like another big black cloud hanging over us’. Two headteachers said they were unsure what to expect of their next inspection as they felt there was a lack of consistency across inspection teams. One said, ‘so much depends on who the inspectors are, which says a lot about the subjectivity of the process’. Another headteacher felt there would be less pressure next time: ‘I don’t think we’ll be as edgy as last time…though there will always be a slight edginess. It is natural. The new process is much, much better’.

Impact of Section 5 inspections: maintained schools in England
94

Conclusions and recommendations
95
7. Conclusions and recommendations
Conclusions Overall the vast majority of schools were satisfied with the inspection process and this process was generally perceived as contributing to school improvement. The majority of survey respondents and interviewees agreed with the inspection report recommendations and valued the contribution to school improvement in terms of the confirmation, prioritisation and clarification of areas for improvement. On reflection many schools felt that the report had provided an impetus to drive forward progress. Figure 1 over the page presents the research team’s interpretation of the factors that influence school improvement and how the cycles of school improvement and Ofsted inspections interrelate. Although time-consuming to complete, the SEF was perceived to be a key, influential part of the inspection process, as it provided focus for the inspection and for the schools’ self evaluation. Self evaluation, in turn, was seen to be an integral factor in school improvement. SEF completion was regarded as an increasingly collaborative exercise, and there was some evidence that, subsequent to first inspections, schools were endeavouring to produce a more concise, evidence-based SEF. Satisfaction with the s5 inspection and its contribution to school improvement were effected by the usefulness and helpfulness of the oral feedback, the consistency of the written report with the oral feedback, and the ability of the inspection team to identify main priorities. Another input to satisfaction was guidance on SEF completion as, where schools felt they had appropriate guidance (from whatever source), the more likely they were to be satisfied with the inspection process. The majority of interviewees found the written report to be fair and accurate, especially in the areas of ‘personal development’ and ‘care and guidance’ (areas graded higher in the s5 report than in the SEF). However some schools felt that ‘achievement and standards’ (graded similarly in the s5 and the SEF) were too data driven (with, on occasion, too little or too much emphasis on data, including CVA), showing, at times, what respondents perceived was a lack of understanding of a school’s context.

Impact of Section 5 inspections: maintained schools in England
96
The written report was also generally perceived to be accessible, succinct and useful. In addition parents valued the independent assessment which the report provided and pupils, on the whole, appreciated the letter from the inspector. A small minority of school respondents, however, found the report to be too brief and too generalised, and felt that the recommendations did not take adequate consideration of the school context and, on occasions, lacked practical advice. With regard to the contextual factors that were perceived to affect the extent of difference made by inspection, there was less satisfaction with the inspection process amongst primary schools than other schools. In addition, it emerged from the statistical modelling that respondents in the midlands felt that inspection had more impact on school improvement than those in the north or south of England. Also, respondents in small- and medium-sized primary schools believed that inspection had more impact, than those in large primary schools. Most schools reported having put into action the recommendations and respondents felt that impact was greatest in specific recommendation areas. More wide-ranging impact was felt in areas such as monitoring, target setting, self evaluation, assessment, attainment and quality of teaching. Respondents felt that the main factors, overall, that contributed to school improvement were staff commitment and effort, self evaluation and school ethos.
teachers & school staff
governor parent
pupils
school leadership team
Figure 1: Impact of s5 inspection on School Improvement
school drives
SI forward
Ofsted inspection process
• Identifies s5 recommendations
• Drives SI forward • Confirms and/or
identifies new issues
LA/SIP
School actions
school Improvement
Plan
held accountable
to Ofsted
school identifies key issues to promote
school improvement
Panda/raise online
data/standards
School self-
evaluation SEF

Conclusions and recommendations
97
A substantial majority of survey respondents thought that the actual monetary costs incurred due to inspections were minimal and were certainly less than those incurred during the previous s10 inspection process. Three-fifths of respondents believed the s5 inspection to be less stressful than previous inspections.
Implications for inspections • Self evaluation - the SEF was perceived to be a key part of the inspection
process, and receiving appropriate guidance on SEF completion contributed to overall satisfaction with the inspection process. Furthermore, schools recognised the need to produce more concise and simplified SEFs and were increasingly adopting a collaborative staff approach to SEF completion. Schools were also concerned with the amount of time spent on SEF completion. Although further guidance on SEF completion and on self evaluation generally, has already been provided by Ofsted, and SEF completion should be less difficult from the second year of the process onwards, it would be worth keeping this area of support and advice for schools under close review.
• Use of data - concern was expressed over data interpretation by some schools inspected throughout the period from October 2005 to March 2006. This fact, in addition to schools requesting improvements with regard to more perceived consistency across inspection teams, suggests the need for more evenness and consistency in terms of the way data is used, particularly in relation to fully understanding the school context and for data to be viewed sometimes as (just) one source of information. With the introduction of RAISE online (after the period of this evaluation), and without affecting the universally-agreed need for inspectors to be objective in their use of evidence about a school, it would be worth seeking further opportunities to ensure that there are consistencies in data use and interpretation, both across inspection teams and between inspectors and schools.
• Importance of oral feedback and dialogue - in view of the importance that schools placed on the oral feedback, and the clear relationships that this has with overall satisfaction with inspection and perceived impact on school improvement, Ofsted should maintain and perhaps even enhance the central position which oral feedback has in the inspection process. Schools appeared to welcome the opportunity for, and were responsive to, dialogue, especially when school context was appreciated.
• Using positive terminology - though it was widely accepted that inspectors had to work within the agreed standard framework of gradings, there was some dissatisfaction in schools with the terminology used to describe the ‘overall effectiveness’ grades, especially in relation to the ‘satisfactory’ grading. Whilst it was accepted that parents and other stakeholders should be provided with a clear, comparable, external, objective assessment of a school’s performance, some school interviewees (and, indeed, some parents) complained that the terminology was too negative and too rigid. Several respondents suggested that inspectors should look for further ways of providing praise and encouragement for

Impact of Section 5 inspections: maintained schools in England
98
staff: even if this is not possible within the overall effectiveness grading requirement, it might be possible through the use of other elements of the inspection process, such as the oral feedback, lesson observations and the report narrative.
• Refining inspection recommendations - the vast majority of survey respondents agreed with the inspection recommendations, found them helpful, and felt that they were sufficiently specific. Only one in ten schools found the recommendations ‘not at all helpful’. Where this latter view was present, the reasons were usually along the lines of: (1) the recommendations were not specific enough; or (2) the recommendations lacked practical guidance. It might be worth bearing these two points in mind when any further advice on drafting recommendations is given to inspectors.
Implications for further research • Research on the SEF and use of data - it was evident that appropriate
guidance for SEF completion, from a number of sources, was valued highly by schools and respondents suggested that the inspection process would be improved by simplifying the SEF. Further research could address the question of how the SEF could be refined over time and how it might be tailored to individual school circumstances. Should subject leaders or department heads who are involved with completing the SEF be more formally involved in the inspection process? In addition, interpretation of data was perceived to be a difficulty in some inspections. A better understanding of the nature of this problem could enhance SEF completion and help to more closely align school and Ofsted expectations of data use and interpretation.
• Research on oral feedback and dialogue - the present study has shown that a meaningful dialogue between school staff and inspectors is an essential ingredient of a satisfactory inspection. Considering this perceived importance of oral feedback, it would be useful to ask what it is that makes oral feedback very useful and that prompts satisfaction with the whole process. What is it that constitutes ‘minor inconsistencies’ between written and oral feedback? How could these inconsistencies be avoided?
• Sub-category research - the use of survey data and statistical modelling allowed the research team to carry out analyses relating to, for example, the relationships between inspections and the size of schools, by region and the different school sectors, but further analyses of this nature would be useful. For example, it would be interesting to explore further any regional or local differences. A deeper understanding of these sorts of differences might enable inspection teams to tailor the support and challenge they provide more closely with school needs.
• Pupil and parent research – this present research explored pupils’ and parents’ views on aspects of the inspection process. In view of the importance of the pupils in the school improvement cycle, it might be worth considering examining the pupil and parent voice with regard to the whole inspection process, in more depth.

Conclusions and recommendations
99
• Longitudinal research - finally, this evaluation has been limited to a fifteen month period. A more longitudinal study would allow researchers to track the effects and impacts of inspection over a more meaningful school improvement cycle, such as three or five years. It would be very useful, for example, to look carefully at the specific recommendations made to schools and to examine how these are reflected (or not reflected) in test and examination results over a three-year period.

Impact of Section 5 inspections: maintained schools in England
100
Appendix A
101
Appendix A Detailed results from multinomial logistic modelling - satisfaction
Two multinomial logistic models1 were constructed based on the level of satisfaction with the inspection and the impact of the inspection on (the contribution of the inspection to) school improvement. This Appendix presents detailed results from the satisfaction model and Appendix B presents detailed results from the impact model. The satisfaction level of senior leaders with the inspection was indicated in the answers to a survey which allowed responses of: very satisfied, quite satisfied and not at all satisfied. This outcome was modelled against self evaluation, oral feedback, view of the inspection process, view of the written report and a number of background variables including grade, region, inspection period, school type and school size.
Table A shows whether variables were significant for the satisfaction outcome: significant variables having a positive impact have been identified with an asterisk (*), and significant variables having a negative impact have been identified with an asterisk and a negative symbol *(-). For the model described in Table A, the normalised coefficients can be found in Figures A.1 and A.2. For each variable, the estimated normalised coefficient is plotted as a diamond, with a vertical line indicating the 95 per cent confidence interval for that estimate. Any variable whose line intersects the bold horizontal line can be regarded as not statistically significant (at the five per cent level). Any variable with an odds ratio of greater than one implies a positive relationship with the outcome variable; for example if we look at Figure A.1, the odds ratio for ‘outstanding’ grade is more than 1. This can be interpreted in the following way: if a school has an Ofsted grading of outstanding rather than good, they are more likely to be satisfied with the inspection report. The same type of interpretation applies to all other variables with an odds ratio of greater than 1. If the odds ratio is less than one then a negative relationship exists between the independent variable and the outcome of interest.
1 Models in which the dependent variable consists of several unordered categories can be estimated with
the multinomial logit model, and these models can be easily interpreted. There is no need to limit the analysis to pairs of categories, or to collapse the categories into two mutually exclusive groups so that the (more familiar) logit model can be used. Indeed, any strategy that eliminates observations or combines categories only leads to less efficient estimates.

Impact of Section 5 inspections: maintained schools in England
102
Table A Significant variables using multinomial logistic modelling: results for school satisfaction
Significant variables for the multinomial models (satisfaction): very satisfied and quite satisfied versus not at all satisfied
Variables
Very satisfied Vs not at all
satisfied
Quite satisfied Vs
not at all satisfied Baseline variables
Graded outstanding by Ofsted
* Good Percentage of free school meals
* There was appropriate guidance for completing the SEF (q2 k yes)
*
No
Did Specific school actions follow from these Ofsted recommendations?
*
No
How useful was the oral feedback at the end of the inspection visit?
* *
Not at all useful
Did the findings from the inspection broadly match the school's initial expectations?
*
No The written report completely consistent
* * Not at all consistent
The narrow approach to performance data * (-) * (-) Disagreement not experienced
Disagreement experienced due to misinterpretation of data in general
*(-) Disagreement not experienced
Disagreement experienced due to lack of professionalism of inspection team *(-) *(-) Disagreement not
experienced
Disagreement experienced due to inspection team not accepting evidence *(-) *(-) Disagreement not
experienced
Disagreement experienced due to grading system too rigid/structured
*(-) *(-) Disagreement not experienced
SEF graded Overall effectiveness higher than s5 *(-) *(-) No difference in grading
SEF graded Achievements and standards higher than s5
* No difference in grading
SEF graded Curriculum and other activities higher than s5
*(-) No difference in grading
SEF graded Leadership and management higher than s5
* No difference in grading
The s5 inspection provided valuable confirmation of our SEF
*
Strongly disagree Disagreement completely resolved
* * Not at all resolved Not applicable
* Not at all resolved
Primary school *(-) Secondary school
* - significant at 0.05 level

Appendix A
103
variables variable names q2kyes There was appropriate guidance for completing the SEF (q2kyes) q8_1a completely disagreement resolved(q8_1a) q84a Not applicable (q8_4a) q9c_1 The narrow approach to performance data (q9c_1)
q9c_4 disagreement experienced due to misinterpretation of data in general (q9c_4)
q9c_5 disagreement experienced due to lack of professionalism of inspection team(q9c_5)
q9c_6 disagreement experienced due to inspection team did not accept evidence (q9c_6)
q9c_7 disagreement experienced due to grading system too rigid/structured(qc_7)
q10_1 The written report completely consistent (q10_1) q11a_3 SEF graded overall effectiveness higher than s5 (q11a_3) q11b_2 SEF graded Achievements and standards higher than s5 (q11b_2)
q11e_3 SEF graded Curriculum and other activities higher than s5(q11e_3)
q11g_2 SEF graded Leadership and management higher than s5 (q11g_2)
q21yes Did Specific school actions follow from these Ofsted recommendations (q21yes)?
q24b the inspection helped us to identify our main priorities(q24b)
q24e The s5 inspection highlighted some important new areas for improvement(q24e)
inspection date 1st January -14th of February inspection date 15th of February -31st March
Size of schools
Small Medium Large
Primary Up to 182 182-279 280+ Secondary Up to 885 885 - 1244 1245+

Impact of Section 5 inspections: maintained schools in England
104
Figure A.1 How satisfied with the inspection: q31=Very satisfied Vs Not at all satisfied
How satisfied with the inspection: q31-Very satisfied Vs Not at all satisfied
0.00
1.00
2.00
3.00
4.00
5.00
6.00
7.00
8.00
outs
tnad
ing
pcfs
m05
q2ky
es
q10_
1
q9c_
1
q9c_
4
q9c_
5
q9c_
6
q9c_
7
q11a
_3
q11g
_2
q24k
_1
q8_1
a
q8_4
a
Odd
s M
ultip
lier
Figure A.2 How satisfied with the inspection: quite satisfied Vs Not at all satisfied (q31)
0.00
1.00
2.00
3.00
4.00
5.00
6.00
7.00
q21y
es
q10_
1
q9c_
1
q9c_
5
q9c_
6
q9c_
7
q11a
_3
q11e
_3
q8_1
a
Odd
s M
ultip
lier

Appendix B
105
Appendix B Detailed results from multinomial logistic modelling - impact
The second model outcome measured the impact of inspection on school improvement (with answers of: to a great extent, to some extent and not at all). This outcome was modelled against the perception of the usefulness of s5 inspections, area of school improvement, view of the Ofsted inspection team, self evaluation, and a number of background variables including grade, region, inspection period, school type and school size. Table B below shows whether variables were significant for the impact outcome: significant variables having a positive impact have been identified with an asterisk (*), and significant variables having a negative impact have been identified with an asterisk and a negative symbol *(-). For the model described in Table B, the normalised coefficients can be found in Figures B.1 and B.2. For each variable, the estimated normalised coefficient is plotted as a diamond, with a vertical line indicating the 95 per cent confidence interval for that estimate. Any variable whose line intersects the bold horizontal line can be regarded as not statistically significant (at the five per cent level). Any variable with an odds ratio of greater than one implies a positive relationship with the outcome variable. If the odds ratio is less than one then a negative relationship exists between the independent variable and the outcome of interest. For example if we look at the variable ‘outstanding’ grade in Figure B.2, the odds ratio is less than one. This can be interpreted in the following way: if a school has an Ofsted inspection grading of outstanding rather than good, they are less likely to feel that the inspection had made, to a great extent, an impact, on school improvement. The same type of interpretation applies to all variables with an odds ratio of less than 1.
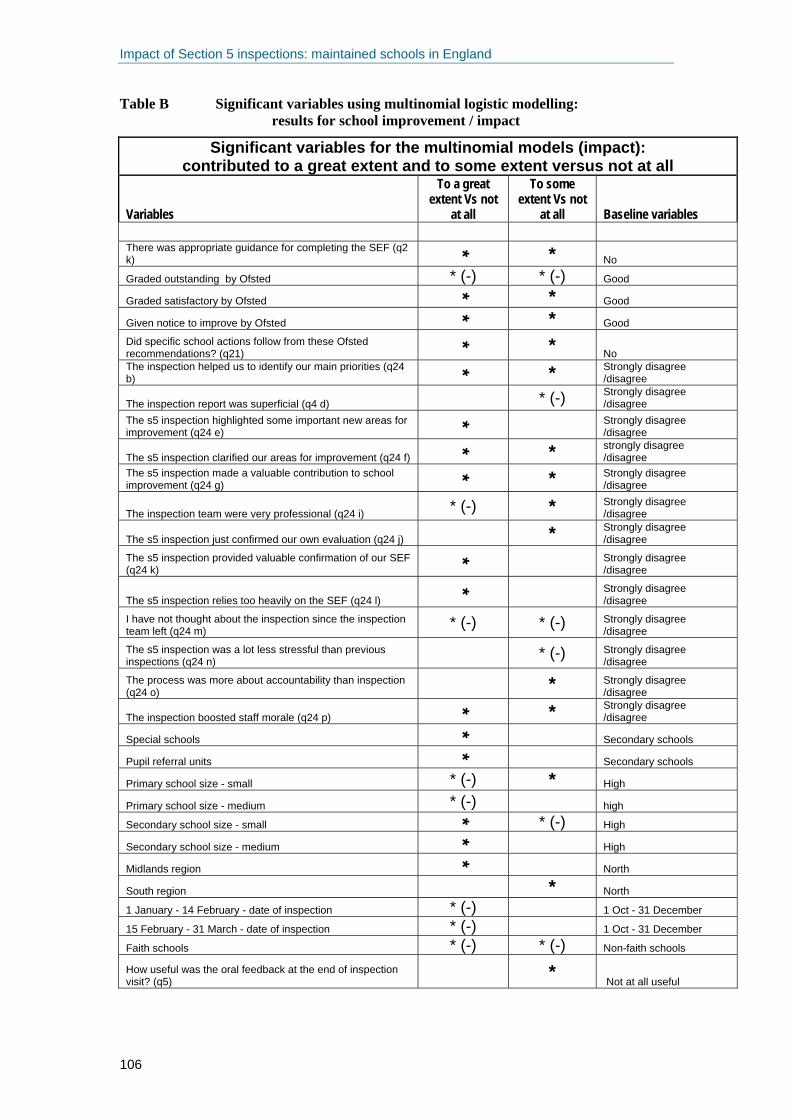
Impact of Section 5 inspections: maintained schools in England
106
Table B Significant variables using multinomial logistic modelling: results for school improvement / impact
Significant variables for the multinomial models (impact): contributed to a great extent and to some extent versus not at all
Variables
To a great extent Vs not
at all
To some extent Vs not
at all Baseline variables
There was appropriate guidance for completing the SEF (q2 k)
* * No
Graded outstanding by Ofsted * (-) * (-) Good
Graded satisfactory by Ofsted
* * Good
Given notice to improve by Ofsted * * Good
Did specific school actions follow from these Ofsted recommendations? (q21)
* * No The inspection helped us to identify our main priorities (q24 b)
* * Strongly disagree /disagree
The inspection report was superficial (q4 d) * (-) Strongly disagree /disagree
The s5 inspection highlighted some important new areas for improvement (q24 e)
* Strongly disagree /disagree
The s5 inspection clarified our areas for improvement (q24 f)
* * strongly disagree /disagree
The s5 inspection made a valuable contribution to school improvement (q24 g)
* * Strongly disagree /disagree
The inspection team were very professional (q24 i) * (-) * Strongly disagree /disagree
The s5 inspection just confirmed our own evaluation (q24 j) * Strongly disagree /disagree
The s5 inspection provided valuable confirmation of our SEF (q24 k)
* Strongly disagree /disagree
The s5 inspection relies too heavily on the SEF (q24 l)
* Strongly disagree /disagree
I have not thought about the inspection since the inspection team left (q24 m) * (-) * (-) Strongly disagree
/disagree
The s5 inspection was a lot less stressful than previous inspections (q24 n) * (-) Strongly disagree
/disagree The process was more about accountability than inspection (q24 o) * Strongly disagree
/disagree The inspection boosted staff morale (q24 p)
* * Strongly disagree /disagree
Special schools
* Secondary schools
Pupil referral units
* Secondary schools
Primary school size - small * (-) * High
Primary school size - medium * (-) high
Secondary school size - small
* * (-) High
Secondary school size - medium
* High
Midlands region
* North
South region
* North
1 January - 14 February - date of inspection * (-) 1 Oct - 31 December
15 February - 31 March - date of inspection * (-) 1 Oct - 31 December
Faith schools * (-) * (-) Non-faith schools
How useful was the oral feedback at the end of inspection visit? (q5)
* Not at all useful

Appendix B
107
Figure B.1 Improvements and overall satisfaction: contribution to SI (great extent vs. not at all)
0.00
1.00
2.00
3.00
4.00
5.00
q2k
outs
tand
ing
satis
fact
ory
q24b
q24e
q24f
q24k
q24l
q24m
q24p
spec
ial s
choo
ls
Pup
il re
ferra
l uni
t
smal
l siz
e pr
imar
y sc
hool
Mid
dle
size
prim
ary
scho
ols
Sm
all s
ize
seco
ndar
y sc
hool
Mid
dle
size
sec
onda
ry s
choo
l
Mid
dlan
ds
1st J
anua
ry -1
4th
offe
b(in
spec
tion
date
)
15th
of f
eb -3
1th
mar
ch(in
spec
tion
date
)
faith
sch
ools
Odd
s M
ultip
lier
Figure B.2 Improvements and overall satisfaction: Some extent vs. not at all
0.00
1.00
2.00
3.00
4.00
5.00
6.00
7.00
8.00
9.00
10.00
outs
tand
ing
satis
fact
ory
nim
prov
e
q21
q24b q4d
q24f
q24g
q24i
q24j
q24m
q24n
q24o
q24p
smal
l prim
ary
scho
ol
smal
l sec
onda
ry s
choo
l
sout
h re
gion
faith
sch
ool
q5a
Odd
s M
ultip
lier

Impact of Section 5 inspections: maintained schools in England
108

Appendix C
109
Appendix C Impact of s5 Inspections – School Context for Primary Schools
Name of School:
Local authority
GOR:
Inspectors (eg HMI):
Date of inspection: From Primary School Performance Tables 2006 *when available http://www.dfes.gov.uk/performancetables/primary_06.shtml Age range Legal status e.g. independent, voluntary aided Number of pupils on school roll Percentage of pupils with SEN with statements Percentage of pupils with SEN without statements Authorised absence (% of half days) Unauthorised absence (% of half days) % pupils achieving level 4 in English % pupils achieving level 5 in English % pupils achieving level 4 in Maths % pupils achieving level 5 in Maths % pupils achieving level 4 in Science % pupils achieving level 5 in Science CVA 2006 results: Researcher to add information about impact on performance in relation to Ofsted recommendations e.g. results in key stage 2 mathematics if it was a recommendation to improve key stage 2 mathematics (record whether up or down on 2005 results) Data from PANDA
% Eligible for Free School Meals % English as an Additional Language (EAL) % White British Grades from s5 and SEF s5 grade for overall effectiveness School SEF grade Comments: E.g. any discrepancies to note s5 grade for achievements and standards School SEF grade Comments: E.g. any discrepancies to note

Impact of Section 5 inspections: maintained schools in England
110
s5 grade for personal development and well-being School SEF grade Comments: E.g. any discrepancies to note s5 grade for teaching and learning School SEF grade Comments: E.g. any discrepancies to note s5 grade for curriculum and other activities School SEF grade Comments: E.g. any discrepancies to note s5 grade for care, guidance and support School SEF grade Comments: E.g. any discrepancies to note s5 grade for leadership and management School SEF grade Comments: E.g. any discrepancies to note Key strengths and weaknesses (see overall effectiveness in s5 report)
What the school could do to improve further (from s5 report)
Capacity to improve (from SEF and s5 report)
Effectiveness of school’s self evaluation (Ofsted judgement from s5 report)
Ofsted reaction to Every Child Matters criteria (see s5 report) yes all met

Appendix D
111
Appendix D Impact of s5 Inspections – School Context for Secondary Schools
Name of School:
Local authority:
GOR:
Inspectors(eg HMI):
Date of inspection: From Secondary School Performance Tables 2006 *when available http://www.dfes.gov.uk/performancetables/schools_06.shtml Comprehensive/selective etc. Mixed or single sex Age range Specialist school? Legal status e.g. independent, voluntary aided Number of pupils on school roll Percentage of pupils with SEN with statements Percentage of pupils with SEN without statements Authorised absence (% of half days) Unauthorised absence (% of half days) % 15 year olds obtaining 5 or more A*-Cs at GCSE/GNVQ
% 15 year olds obtaining 5 or more A*-Gs at GCSE/GNVQ
% of 15 year olds achieving no passes at GCSE/GNVQ Average GCSE/GNVQ point score per 15 year old CVA 2006 results: Researcher to add information about impact on performance in relation to Ofsted recommendations e.g. results at key stage 3 or GCSE mathematics if it was a recommendation to improve mathematics. Note whether up or down from 2005. From Post-16 Performance Tables (if applicable) – 2006 when available http://www.dfes.gov.uk/performancetables/16to18_06.shtml 16-18 Year-old students on roll: Comb. A/AS/GNVQ average point score per student Comb. A/AS/GNVQ average point score per entry Data from PANDA
% Eligible for Free School Meals % English as an Additional Language (EAL) % White British

Impact of Section 5 inspections: maintained schools in England
112
Grades from s5 and SEF (including the inspection judgements) s5 grade for overall effectiveness School SEF grade s5 grade for achievements and standards School SEF grade s5 grade for personal development and well-being School SEF grade s5 grade for teaching and learning School SEF grade s5 grade for curriculum and other activities School SEF grade s5 grade for care, guidance and support School SEF grade s5 grade for leadership and management School SEF grade Key strengths and weaknesses (see overall effectiveness in s5 report)
What the school could do to improve further (from s5 report)
Capacity to improve (from SEF and s5 report)
Effectiveness of school’s self evaluation (Ofsted judgement from s5 report)
Ofsted reaction to Every Child Matters criteria (see s5 report)