impact of the cycle to work scheme: evidence report
TRANSCRIPT

Impact of the Cycle to Work Scheme Evidence Report
Sam Swift, Martha Green, Jim Hillage, Vahé Nafilyan
June 2016 Report 509

Institute for Employment Studies City Gate 185 Dyke Road Brighton BN3 1TL UK
Telephone: +44 (0)1273 763400 Email: [email protected] Website: www.employment-studies.co.uk
Copyright © 2016 Institute for Employment Studies
IES project code: 00964-4308
Institute for Employment Studies
IES is an independent, apolitical, international centre of research and consultancy in HR issues. It works closely with employers in all sectors, government departments, agencies, professional bodies and associations. IES is a focus of knowledge and practical experience in employment and training policy, the operation of labour markets, and HR planning and development. IES is a not-for-profit organisation.

Contents
Executive Summary ....................................................................................................................................... 1
1 Introduction ........................................................................................................................................... 4
1.1 The scheme ..................................................................................................................................... 4 1.2 Our report ....................................................................................................................................... 5
1.2.1 Methodology ................................................................................................................................ 5 1.2.2 Structure ...................................................................................................................................... 6
2 Cycling to work ..................................................................................................................................... 7
2.1 Introduction ................................................................................................................................... 7 2.2 Are there more cyclists? ............................................................................................................... 7 2.3 Are people cycling more?............................................................................................................. 8 2.4 Conclusion .................................................................................................................................... 11
3 The Health Benefits of Cycling ........................................................................................................ 12
3.1 Introduction ................................................................................................................................. 12 3.2 The positive impact of cycling on health ................................................................................. 12
3.2.1 Type-two diabetes ...................................................................................................................... 13 3.2.2 Coronary heart disease ............................................................................................................... 14 3.2.3 Colon Cancer ............................................................................................................................. 15 3.2.4 Breast cancer/all-cause ............................................................................................................... 16
3.3 Cycle to work scheme survey results ....................................................................................... 18 3.4 Conclusion .................................................................................................................................... 18
4 Literature on Economic Benefits ...................................................................................................... 20
4.1 Introduction ................................................................................................................................. 20 4.2 Policy context ............................................................................................................................... 20 4.3 General economic benefits from cycling .................................................................................. 20 4.4 The wider benefits of investing in cycling infrastructure...................................................... 22 4.5 Economic benefits of increased physical activity ................................................................... 24
4.5.1 Lower absenteeism ..................................................................................................................... 24 4.5.2 The wider benefits from increased physical activity .................................................................. 24
4.6 Estimating the health benefits of the cycle to work scheme ................................................. 25 4.7 Conclusions .................................................................................................................................. 26
5 Conclusions .......................................................................................................................................... 28
6 Appendix .............................................................................................................................................. 30
7 References ............................................................................................................................................ 32
7.1 Health Benefits ............................................................................................................................. 32 7.2 Economic benefits ....................................................................................................................... 34


Institute for Employment Studies 1
Executive Summary
Around 180,000 people a year participate in the cycle to work scheme operated by employers, through which employees can save up to 40 per cent of the cost of a new bicycle to cycle to work from reduced income tax and National Insurance. In February 2016, the Cycle to Work Alliance – a policy coalition comprising Cyclescheme, Cycle Solutions, Evans Cycles and Halfords, the leading providers of the Cycle to Work Scheme - commissioned IES to undertake a rapid assessment of the evidence around the efficacy of cycle to work schemes and the health and economic benefits of cycling to work.
Over three quarters of a million people cycle to work in England and Wales and although official data do not show an increase in the number of people cycling, they do indicate that the amount of cycling (in terms of miles cycled) is rising.
There is evidence from a survey of 13,000 scheme users that participating in the scheme is associated with increased cycling to work, although we do not know whether the survey is representative of all scheme users. The survey suggests that some previous non-cyclists took up cycling and others cycled more as a result of their involvement (see Figure 1).
Figure 1: Uptake of cycling by previous cycling activity
Source: cycle to work employee survey 2015
cycle morecycle the same
cycle more
cycle more
Initially non-cyclists, who
Novice/occasional cyclists, cycle the same or less
Enthusiastic cyclists, whocycle the same or less

2 Impact of the Cycle to Work Scheme
According to the survey, nine per cent of particpants were non-cyclists who started cycling once they had joined the scheme. Overall an average 65 per cent of scheme users increased the amount of cycling they did, by an average of around 30 minutes a day. There is additional evidence from other studies, including those of similar initiatives in Ireland and elsewhere, that the scheme encouraged an increase in cycling among participants and particularly promoted non-cyclists to take up cycling.
There is a substantial range of international evidence that an increase of physical activity, such as cycling (eg of 30 minutes a day), is associated with a range of health benefits. For example one systematic literature review found that the evidence was consistent in showing a positive relationship between cycling and health. Other studies have focussed on the specific benefits of cycling to work such as reduced incidence of diabetes, heart disease, and cancer.
■ A comprehensive study in Finland found that cycling to work for over 30 minutes a day was significantly associated reduced risk of developing type-two diabetes and as a consequence, lower mortality rates. Another study in the USA found a significant correlation between higher rates of cycling to work and lowewr rates of obesity and diabetes.
■ There is substantial evidence to suggest that physical activity, such as cycling, has a ‘protective’ effect against developing coronary heart disease, a leading cause of mortality, both globally and in the UK. Another Finnish study with 48,000 participants found a significant relationship between active commuting, eg by cycling to work, and a reduced risk of coronary heart disease among women, although not among men.
■ There is also evidence that the risk of developing colon cancer is significantly reduced among people who cycle to work, with the greatest reduction among those who cycled the most.
There is also consistent evidence in the literature that public investment in measures to facilitate increases in cycling is generally cost effective with high benefit-to-cost ratios, of often over five or ten to one. There is also evidence that while some investments in cycling infrastructure can have significant payback they appear to work most effectively when combined with direct efforts to increase cycling activity such as through cycle to work schemes.
Although the literature has less to say about the direct benefits associated with interventions such as the cycle to work scheme, there is evidence to suggest that such schemes could, for instance, result in reduced sickness absence which would produce savings for employers. The literature also indicates that these positive benefits are relatively small compared to the more widespread economic gains from improved physical fitness and the consequent reduction in mortality.

Institute for Employment Studies 3
The literature also provides key evidence to develop a model to estimate the social value of such an impact, based on Department for Transport guidance. Assuming a modest impact on amount of additional cycling among those who take advantage of the scheme and that just five per cent of participants, 9,200 people, cycle for 30 minutes more a working day as a result of their involvement in the scheme, then we estimate that the social benefit from reduced absence and increased physical fitness to be £72 million a year. This amounts to more than twice the estimated cost to the Treasury in lost tax and National Insurance. In addition there are likely to be further environmental benefits.
On this basis, we conclude that the scheme is economically and socially beneficial, and, especially if combined with infrastructure improvements, would continue to play a positive role in a comprehensive and cost effective strategy to increase the number of cyclists and volume of cycling in the UK.

4 Impact of the Cycle to Work Scheme
1 Introduction
The cycle to work scheme is a tax-free, salary sacrifice benefit currently offered through employers, who may loan cycles and various items of cycling equipment to employees, with the intention of promoting both more environmentally friendly commuting and health benefits associated with cycling (Department for Transport, 2009). The Cycle to Work Alliance brings together a group of leading providers of the cycle to work scheme, including Cyclescheme, Cycle Solutions, Evans Cycles and Halfords, who work with employers to administer the schemes offered to employees.
In February 2016, the Cycle to Work Alliance, commissioned IES to undertake a rapid evidence assessment of various quantitative and qualitative data around the efficacy of cycle to work schemes and the health and economic benefits of cycling to work. This approach provides a good overview of the state of play regarding research into this area, identifying key themes and issues in research surrounding cycling. As well as a documentary review, the assessment analysed responses of a survey administered by the Cycle to Work Alliance to employers and employees who have taken advantage of the scheme.
1.1 The scheme The cycle to work scheme was introduced in the 1999 Finance Act. Under the scheme, employers buy or lease cycling equipment up to the value of £1,000 from suppliers approved by their scheme administrator, and hire it to their employees. At the end of the loan period, the employer may choose to give the employee the option to purchase the equipment. In return, employees agree to sacrifice an equivalent proportion of their salary, for an agreed period, in exchange for the loan thereby paying less income tax and NICs on their remaining salary. Employees can save up to 40 per cent of the cost of a new bicycle. Employers also save on Secondary Class 1 NICs (usually around 13.8 per cent) as the amount they're paying in wages is also lower.
According to the Cycle to Work Alliance, over 1.1 million successful applications have been made to the scheme since 2007, although as individual employees may participate a number of times this is not the same as the total number of participants. The Alliance data indicate that the annual number of participants is rising.In 2014, 183,423 employees

Institute for Employment Studies 5
participated in the cycle to work scheme, an 11.6 per cent increase on the numbers taking part in 2013.
1.2 Our report
1.2.1 Methodology
This report draws on data from a survey conducted between August and September 2015 by the Cycle to Work Alliance and a review of relevant literature on the health and economic benefits of cycling to employers, employees, and society more generally.
In our survey analysis, we look at the effect of the cycle to work scheme on cycling activity. This takes two forms. Firstly, we consider whether the cycle to work scheme has increased the number of people cycling, and whether more people are now reporting cycling more often as a direct result of the scheme. The second aspect we look at is whether people are cycling further, looking at the length of the trip and whether this is increasing, as well as the number of journeys to and from work being made by bicycle.
The analysis based on this survey is valid only for the respondents to this survey and cannot be straightforwardly generalised to the population (ie those who signed up to the scheme). The sample is unlikely to be representative of the population, as it consists of selected respondents. Therefore, the reader should bear in mind that the results should not be interpreted as the impact of the scheme on those who signed up for the scheme, but only as the impact of the scheme on those who signed up for the scheme and chose to respond to the survey. We suspect that those who sign up to the scheme but did not start to cycle to work are far less likely to respond to such a survey.
Literature was sourced largely through Google Scholar, which in IES’ experience serves best as an effective meta-trawler, as well as consideration of other databases. Policy context has largely been ascertained from the government’s own publications database. In examining both the health and economic impacts of cycling, we have considered scientific studies based on their robustness, quality and the impact factor of the journal in which they are published. The search was conducted in English, as the journals with the highest impact factor publish in English, using search terms and Boolean operators such as ““health benefits” + cycl*”. We focussed predominantly on evidence from transferable settings to the UK, which are mainly developed knowledge economies with large urban centres and rural parts as well. This was largely the EU, North America, Australia, and New Zealand. This provided useful case studies that are good proxies for a UK setting; one paper’s study was set in Barcelona, for example, which shares enough characteristics to be a proxy for a city such as Manchester. We put no limits on included populations, although much evidence disaggregated between separate benefits for men and women.

6 Impact of the Cycle to Work Scheme
1.2.2 Structure
Our findings are presented in four sections. First in Chapter 2 we look at the data on cycling to work and the Alliance’s survey of employees to extract evidence on the volume of cycling to work and whether the scheme is associated with an increase in cycling among participants. The next section (Chapter 3) examines the evidence from literature on the health benefits of cycling. In Chapter 4 we examine the available evidence on the economic benefits of cycling. Using a model developed by the Department for Transport and evidence from the literature we provide an estimate of the likely economic benefits associated with an increase in cycling as a result of the cycle to work scheme.

Institute for Employment Studies 7
2 Cycling to work
2.1 Introduction In this section we examine national data on cycling to work and the data from the Alliance’s survey of employees to extract evidence on the volume of cycling to work and whether the scheme is associated with an increase in cycling among participants.
2.2 Are there more cyclists? Respondents to the Alliance’s survey of employees can be divided up into three categories based on their responses:
■ those who were non-cyclists before participating in the scheme
■ those who described themselves as novice cyclists (cycling less than once a month) or occasional cyclists (cycling once or twice a month) before participating in the scheme
■ those who described themselves as enthusiastic cyclists (cycling every week) before participating in the scheme.
The results suggest that the scheme is attracting non- or occasional cyclists. Some 11 per cent of the respondents were non-cyclists, 51 per cent were occasional or novice cyclists, and 38 per cent considered themselves as enthusiastic cyclists (ie cycling every week).
However national data do not suggest an overall rise in the proportion of the population who cycle to work. An analysis of the Census published by the Office for National Statistics (ONS) shows that in 2011, 741,000 working residents aged 16 to 74 cycled to work in England and Wales, up from 651,000 in 20011. However the increase reflects the general rise in the population and the proportion of working residents who cycle to work in England and Wales has remained stable at 2.8 per cent. That said the proportion increased substantially in London, going up to 3.9 per cent from 2.3 per cent. Substantial
1 http://webarchive.nationalarchives.gov.uk/20160105160709/http://www.ons.gov.uk/ons/rel/census/2011-
census-analysis/cycling-to-work/2011-census-analysis---cycling-to-work.html

8 Impact of the Cycle to Work Scheme
increases were also observed in other cities, including Cambridge, Bristol, Oxford, Brighton and Hove and Exeter.
The Census data cover an earlier period than the cycle to work survey and so may not pick up a more recent trend and also may not pick up an increase in leisure cycling. Additionally, the overall number of cyclists may not be a useful indicator of the overall volume of cycling as people who do own a bicycle may be using it more frequently.
2.3 Are people cycling more? The cycle to work survey also asked respondents about whether they felt they were cycling more since joining the scheme and 66 per cent of respondents reported that they cycled more since they joined the scheme, 32 per cent cycled a similar amount to before and two per cent said they cycled less.
The survey data on the type of cyclists and the amount they cycle can be combined to derive an estimate of the perceived impact of the scheme on the uptake of cycling among respondents (see Figure 2). It shows that:
■ nine per cent of respondents were non-cyclists who started cycling to work as a result of the scheme
■ 57 per cent of the respondents were already cyclists and were cycling to work more often as a result of the scheme (impact on cycling intensity)
The other respondents did not report a change their behaviour as a result of the scheme:
■ two per cent of the respondents were non-cyclists and did not cycle
■ 33 per cent of the respondents were already cyclists and cycled the same amount (impact on cycling intensity)
The change in cycling behaviour differed depending on how the respondents classified themselves as cyclists before they signed up to the scheme, with a larger proportion of non and novice/occasional cyclists reporting theycycld more (over 80 per cent) compared to enthusiastic cyclists (only 40 per cent).

Institute for Employment Studies 9
Figure 2: Uptake of cycling by previous cycling activity among cycle-to-work scheme participants
Note: Each square represents one per cent of the respondents
N= 12,542
Source: Cycle to Work employee survey 2015
These data suggest that for a proportion of those who take-up the scheme their involvement makes no difference to the amount they cycle and this therefore could be considered ‘deadweight’. However the data also suggest that a larger proportion the scheme are cycling more as a result of their involvement. It should be borne in mind that these results are based on a self-selected sample. This means, for example, people who sign up to the scheme but did not start to cycle to work may have been less likely to respond to such a survey. These results may therefore over-estimate the impact of the scheme on the cycling behaviour of all participants.
The survey data can also be used to measure the impact of the scheme on the distance cycled each week. Respondents were asked to report how many miles per week they currently cycle to work, but there is no readily available information about how many miles per week they used to cycle to work before signing up to the scheme2. We have therefore constructed an estimate of the weekly distance cycled to work before signing up to the scheme using data from the survey. First, we imputed the number of days per week cycled to work before signing up to the scheme using the reported cycling activity. We then derived the distance to, and from, work by dividing the weekly distance cycled by the number of days a week the respondent cycled to work. Finally we multiplied the
2 It should be noted that the survey did not provide for the option of not using the bicycle for any distance or
frequency of cycling to work, so the data are likely to over-estimate the number of miles cycled.
cycle morecycle the same
cycle more
cycle more
Initially non-cyclists, who
Novice/occasional cyclists, cycle the same or less
Enthusiastic cyclists, whocycle the same or less

10 Impact of the Cycle to Work Scheme
number of days per week cycled to work before signing up to the scheme by the commute distance to get an estimate of the distance cycled weekly before signing up to the scheme.
Figure 3 shows the average weekly distance cycled to work before and after signing up to the cycle to work scheme. Respondents cycle on average 30.4 miles a week on their way to and from work, after having joined the scheme, up by 18.0 miles from 12.4 miles before joining the scheme. The increase in the number of miles cycled on the way to work was much larger among those who were non-cyclists or occasional cyclists when joining the scheme (26.7 and 23.7 respectively) than among those who considered themselves as enthusiastic cyclists (8.4 miles).
An increase of 18 miles a week is an average of 3.6 miles a day (assuming a five day working week), which is roughly equivalent to around 30 minutes extra cycling. This calculation excludes any extra leisure cycling that might have resulted from participation in the scheme.
Figure 3: Weekly distance cycled to work, before and after the cycle-to-work scheme
N= 12,542
Source: Cycle to Work employee survey 2015
Our analysis follows a similar pattern to a survey conducted in Yorkshire as part of a study of the cycle to work scheme by Clarke et al (2014). While this survey was based on a much smaller sample (N = 254), it included both participants and non-participants. This study also found an increasing propensity to cycle: 47 per cent of their respondents cycled
0
5
10
15
20
25
30
35
40
Non-cyclists Occasional cyclists Enthusiastic cyclists All
Wee
kly
mile
s cy
cled
to w
ork
Before After

Institute for Employment Studies 11
weekly before the scheme’s implementation versus 96 per cent afterwards, with 92 per cent cycling to work after joining the scheme as opposed to 42 per cent beforehand.
Clarke et al (2014) reported a case study of a single employer’s involvement in the cycle to work scheme (Eliot, 2010) that also found that participants in the scheme increased their amount of cycling, particularly novice cyclists. A study of the cycle to work scheme in Ireland (Caulfield and Leahy, 2011) found uptake to be different to that in the UK, as 48 per cent of scheme users did not already own a bicycle, and 45 per cent of new cyclists cycled to work at least twice a week. Furthermore, a study in Belgium (Vanoutrive et al, 2009) found that ‘the active provision of bicycles by employers seems to influence the proportion of cycling employees in a positive way’, demonstrating that such a mechanism as the cycle to work scheme can positively influence choices of commuting, potentially leading to the benefits outlined above. Finally Wardman et al (2007) found that a cash incentive to cycle to work was effective in causing an uptake in cycling.
There is also some support for evidence of an increase in the overall amount of cycling in national statistics from the Department for Transport (DfT). The total number of miles cycled has risen steadily in recent years, from 2.6 billion miles in 2007 to 3.2 billion in 2014 – an increase of 18 per cent, taking into account the increase in the working population3.
2.4 Conclusion There is no conclusive evidence on the impact of the cycle to work scheme on the overall volume of cycling and in particular cycling to work. While there is some evidence from the survey of scheme users that participating in the scheme is associated with increased cycling to work, particularly among previous non-cyclists or occasional cyclists, we do not know whether the survey is representative of all scheme users. However other surveys of scheme users have found similar results and other evidence suggest that incentives to use bicycles can have a positive effect on the volume of cycling. While official transport data do not show an increase in the number of people cycling, they do indicate that the amount of cycling (in terms of miles cycled) has risen by over two per cent per annum in recent years. We can therefore conclude that the scheme is likely to have a positive impact on the volume of cycling to work.
3 (www.gov.uk/government/organisations/department-for-transport/series/road-traffic-statistics)

12 Impact of the Cycle to Work Scheme
3 The Health Benefits of Cycling
3.1 Introduction In this section we briefly review the academic literature on the relationship between cycling and health. While most of the literature focusses on physical activity in general or including walking to work, a growing body of studies look at the health benefits of cycling and in particular commuting by bicycle. We also examine the survey results on the perceived health benefits to users of the cycle to work scheme at the end of the section.
3.2 The positive impact of cycling on health The importance of physical activity for improving public health and wellbeing is long established. Cycling provides a convenient means of increasing physical activity, as well as being a non-weight bearing, efficient form of aerobic and cardiovascular exercise. Research has shown that incorporating cycling into a daily routine can help prevent or reduce the risk of cardiovascular disease, colon and breast cancer, type-two diabetes, and obesity. A systematic review of 16 studies (Oja et al, 2011) found that they were consistent in showing a positive relationship between cycling and health.
Any increase in the uptake of cycling, therefore, could have a substantial effect on improving physical activity and thus reducing the incidence of multiple health conditions associated with a sedentary lifestyle. This is particularly significant given that the World Health Organisation estimates that more than 300 million adults worldwide are obese4 and physical inactivity has been identified as one of the ten leading risk factors contributing to the burden of disease worldwide (Lim et al. 2013). Furthermore, a notable 1996 report5 from the US Surgeon General, Physical Activity and Health, concluded that a sedentary lifestyle can increase the risk of a number of chronic illnesses, such as coronary
4 World Health Organisation (2003), Global strategy on diet, physical activity, and health: obesity and overweight.
Available at: http://www.who.int/dietphysicalactivity/ publications/facts/obesity/en/ 5 United States. Department of Health (1996), Physical activity and health: a report of the Surgeon General, Diane
Publishing.

Institute for Employment Studies 13
heart disease, some cancers and diabetes. Perhaps the most significant point to be taken from this report is that it suggested even 30 minutes per day of moderate-intensity physical activity, if performed regularly, provides significant health benefits. It was also argued that the benefits of physical activity are proportional. Hence, exercise need not be rigorous, as any increase in physical activity will have some benefit.
Some of the studies focus on particular health benefits and in the rest of this section we look at the impact on diabetes, coronary heart disease and cancer
3.2.1 Type-two diabetes
A common health condition that frequently appears within the cycling-health literature is type-two diabetes. This chronic disease has increased rapidly during the last few decades and continues to do so, with NHS estimates reporting that more than 1 in 16 adults in the UK are currently diagnosed with the condition. Type-two diabetes is often associated with obesity, a poor diet and lack of exercise. Research shows physical activity to be beneficial in the prevention and management of this health condition and evidence suggests that cycling may also have a protective effect against developing type-two diabetes.
Previous literature has often focused on leisure-time physical activity in relation to diabetes, with little research providing evidence of other forms of physical activity. However, a Finnish paper has estimated the effect of commuter, as well as occupational and leisure-time, physical activity6 on the incidence of diabetes (Hu et al, 2003). This cohort study prospectively followed approximately 15,000 Finnish men and women between the ages of 35 and 64, without a history of stroke, coronary heart disease or diabetes as a baseline. Extensive background information on the individuals’ levels of physical activity was compiled for all three types (occupational, commuting and leisure-time), in order to account for general individual activity levels.
Commuter physical activity was defined as walking or cycling to and from work and three categories were created: none, 1 to 29 minutes and over 30 minutes. The cohort had a mean follow up of 12 years and the results showed that the effect of walking or cycling to work for over 30 minutes was significantly associated with a reduced risk of developing type-two diabetes (compared to individuals who did not walk or cycle to work). This was after adjusting for confounding factors such as age, sex, blood pressure, smoking, education, study year, BMI and the other two types of physical activity (occupational and leisure-time). Their evidence suggests that moderate to high commuter physical activity has an independent and significant ‘protective’ effect on the development of type-two diabetes for the general middle-aged population.
6 Commuter physical activity also included walking to and from work.

14 Impact of the Cycle to Work Scheme
When combined with occupational and leisure-time activity, the effect of commuter activity was also shown to have a larger effect on reducing the incidence of diabetes. Furthermore, the same research group carried out a similar study, this time looking at individuals already diagnosed with type-two diabetes and found that those who participated in higher levels of commuter activity, experienced lower mortality rates (Hu et al, 2004). This appears to confirm the theory that cycling may also be beneficial in managing the condition of type-two diabetes.
Another paper investigating the effects of commuter cycling on diabetes is that of Pucher et al (2010). The approach differed from that of Hu (2003), as it offered a comparative analysis across cities, states and countries. Rather than estimating the individual level effect of cycling on the risk of developing diabetes, they examined aggregate cross-sectional health and travel data from 14 countries, all 50 US states and 47 of the 50 largest US cities to determine rates of diabetes at the country, state and city levels.
At the state and city levels they found that higher rates of cycling (and walking) to work were associated with: a higher percentage of adults achieving recommended levels of physical activity; a lower percentage of adults with obesity; and a lower percentage of adults with diabetes. Although their regression analysis did not prove that there is a causal relationship between cycling and incidence of diabetes, it did show that there is a significant negative correlation between rates of physical activity and diabetes. The lack of causality is likely explained by self-selection, as individuals who are already health conscious are more likely to take up cycling.
The main strength of this paper, however, is that the analysis shows a discernible relationship between cycling and health at three distinct geographical levels: international, national, and city. Whilst the evidence does not prove that cycling causes improved health, it does show that there is a significant relationship between active travel and lower rates of diabetes. The authors argued that their work should not be viewed in isolation but as part of the emerging literature that documents the health benefits of associated with cycling. Once viewed in a wider context, they felt that this paper provided substantial evidence of the population health benefits of active travel.
3.2.2 Coronary heart disease
A significant amount of literature investigating the health benefit of cycling has focused on the impact of the occurrence of coronary heart disease (CHD). CHD is the leading cause of mortality, both globally and in the UK. Risk factors associated with an increased risk of developing CHD include, amongst others, lack of exercise, poor diet and obesity (diabetes is also often associated with an increased risk of CHD). There is substantial evidence to suggest that physical activity, including cycling, has a ‘protective’ effect against developing this life-threatening condition, although few papers have estimated

Institute for Employment Studies 15
the specific effect of cycling on CHD and even fewer have investigated the association of commuter cycling.
One paper that investigated the impact of cycling – in particular, commuter cycling – on coronary heart disease was by Hu et al (2007). The approach taken to estimate the effect of commuter cycling on the incidence of coronary heart disease was similar to that of the same study team involved in the 2003 paper (on the effect of commuter cycling on diabetes). However, this study used a much larger sample of almost 48,000 Finnish participants between the ages of 25 and 64 with no history of CHD or stroke. The categories of activity intensity were none, 1 to 29 minutes, over 30 minutes and occupational and leisure-time cycling activity were taken into account.
Results showed that active commuting had a significant inverse relationship with the risk of CHD events for women, after adjusting for several confounding factors (such as age, smoking, education, BMI and blood pressure, as well as alcohol consumption and total cholesterol and history of diabetes). Results were not significant for men, which is interesting given that men suffer from higher rates of CHD and it might be expected that they would gain the most from cycling to work. Furthermore, simultaneously engaging in two or all three types of physical activity had a slightly stronger protective effect against CHD.
3.2.3 Colon Cancer
Similar associations may be found in relation to cycling and cancer. Physical activity has been proven to significantly reduce the risk of developing some cancers - 18.7 per cent of colon cancer cases and 17.9 per cent of breast cancer cases in the UK are thought to be attributable to physical inactivity (Lee et al, 2012). Yet the branch of literature that focusses on cycling, and commuter cycling, in particular, is limited due to the specific nature of the research. However, there are a few papers indicating that the health benefits of commuter cycling are significant in their ‘protective effect’ against the development of colon and breast cancer.
Literature exploring the relationship between active travel and colon cancer has almost exclusively been carried out in western countries, with the exception of Hou et al (2004), who carried out research using a large, population-based study in Shanghai, China. They were motivated by the large increase in the incidence of colon cancer in China in the last two decades, which is largely attributed to the westernisation of Chinese lifestyle. This spike in colon cancer diagnoses is worrying given that China had previously been considered a low risk country for this health condition. China provides an interesting case study for investigating the cycling-health relationship. Before the start of the 1990s, a

16 Impact of the Cycle to Work Scheme
combination of walking, cycling and taking the bus were the most common forms of transportation, and the level of active commuting in the study population was high.7
Hou et al (2004) investigated the association between commuter cycling on the risk of colon cancer for Chinese men and women. This study took on a population-based case-control approach with 900 cases and over 1,500 controls. As well as witnessing high levels of commuter cycling, they found that the performance of commuter physical activity for individuals was fairly constant over a long time period; a large proportion of participants had had the same levels of commuter physical activity for more than two decades. Past cycling behaviour is assumed to be accurate given the incidence of cycling already within the country. Their evidence showed that the risk of developing colon cancer was significantly reduced for those with high levels of commuting physical activity. This was particularly the case for individuals who had had a history of high levels of commuter cycling for at least 35 years. The risk reduction was more than 50 per cent for those who cycled more than two hours a day compared to those who cycled for less than 30 minutes a day.
3.2.4 Breast cancer/all-cause
The association between commuter cycling and breast cancer is less clear than that of colon cancer. From a public health perspective, exercise is one of the few modifiable risk factors associated with breast cancer; yet the evidence remains inconsistent. This is partly because the mechanism mediating the effect on exercise on breast cancer is still debated; though the link is often assumed to be hormonal.
There is a proven effect of recreational physical activity on post-menopausal breast cancer Monninkhof et al (2007); yet physical activity such as active commuting has been less rigorously investigated. George et al (2010) found an inverse relationship between active commuting and the risk of invasive breast cancer in post-menopausal women, which was not found to be significant; though the direction of the relationship between commuting physical activity and risk of invasive breast cancer is the same as that of a large Finnish cohort study (Luoto et al, 2000). However, this study by Luoto et al (2000) only found a small protective effect of commuter physical activity on the incidence of breast cancer.
It should be noted that the two aforementioned papers do not distinguish between cycling and walking in their definitions of active commuting. As walking is a much lower intensity form of physical activity compared to cycling, it may be argued that this has had a depressive effect on the association between commuter cycling and breast cancer. It is possible that this may have contributed to the inconclusiveness of their research.
7 Hou et al (2004) found that the level of physical activity in the lowest third of their study population was
still higher than the highest cut-off point for a similar paper from Norway by Thune and Lund (1996).

Institute for Employment Studies 17
Matthews et al (2007) distinguished between walking and cycling as a means of transportation8 and the effect on all-cause mortality in Chinese women. They found that cycling as active transport was both inversely and independently associated with all-cause mortality. However, the independent effect of walking for transportation was only weakly and non-significantly associated with all-cause mortality. By combining walking with cycling George et al (2010) and Luoto et al (2000) may have diminished the effect cycling may have in reducing the risk of invasive breast cancer.
Matthews et al (2007) classified cycling levels using METs9 rather than duration. Cycling levels used in the analysis were defined as 0, 0.1 - 3.4 and greater than 3.4 (for the middle category this is equivalent to a few minutes up to over an hour of cycling). They find that compared to non-cyclists, all-cause mortality for women in the middle group was 0.79 and 0.66 for women with the highest levels of cycling. Overall, this is a statistically significant decreasing trend. An obvious strength of this research is the very large cohort size – 74,942 Chinese women formed the longitudinal cohort – and also the high prevalence of cycling in this part of the world lends analytical power and robustness to the results. Their findings provide substantial evidence for the health benefits associated with cycling to work.
Matthews et al (2007) also contribute to the significantly smaller body of work that attempts to identify benefits gained from commuter cycling in terms of all-cause mortality for women. This lack of evidence is often attributed to the low prevalence of commuter cycling in many Western countries. All-cause mortality is also an important measure of overall health to consider, as it allows us to view the health benefits of cycling in a broader sense. This is vital, especially when we want to view commuter cycling and disease burden from a public health perspective. For example, Andersen et al (2000) reported a significant reduction in all-cause mortality for Danish adults who cycled to and from work (relative risk 0.72). The results of the study showed that those who cycled to work experienced lower mortality rates. This was after adjusting for leisure time physical activity and sports participation, even for the most physically active and those who did not cycle to work experienced a 39 per cent higher mortality rate than those who did. However, results were proved not to be significant for women, due to the small sample size.
8 Although Matthews et al (2007) use cycling as transportation as their measure of physical activity here,
cycling is not necessarily restricted to commuting. 9 MET is another name for the Metabolic Equivalent of Task, or simply the metabolic equivalent. It is a
measure of exercise intensity based on oxygen consumption.

18 Impact of the Cycle to Work Scheme
3.3 Cycle to work scheme survey results The survey of the cycle to work scheme asked users whether they felt they had gained any health benefits from their involvement in the scheme and 86 per cent of them said they had, mostly in terms of improved fitness. There was little variation by whether the respondent was a non-cyclist, occasional cyclist or enthusiast (see Figure 3.1).
Figure 3.1: Reported health benefits among cycle to work scheme participants
N= 12,542
Source: cycle to work employee survey 2015
3.4 Conclusion The importance of physical activity for public health is well established. While the more specific effects of cycling and commuter cycling, in particular, have received less attention; research has emerged in recent times recognising the need to distinguish between leisure-time physical activity and non-recreational physical activity and has attempted to analyse their separate effects on health outcomes. There is now a solid body of evidence reporting on the health benefits to be gained from cycling to work. Large and significant associations have been found between commuter cycling and reduced risk of developing a number of illnesses, including type-two diabetes, coronary heart disease and colon cancer, as well as having significant effects on all-cause mortality. Cycling physical activity may also help with the management of existing health conditions, such as type-two diabetes.
0%
20%
40%
60%
80%
100%
Any healthbenefits
Improved fitness Weight Loss Less stressed Improved asthma
Non-cyclists Occasional cyclists Enthusiastic cyclists All

Institute for Employment Studies 19
Overall, commuter cycling as opposed to leisure time physical activity is a time efficient and feasible way of incorporating physical activity into daily life. With physical inactivity contributing towards 16.9 per cent of premature all-cause mortality in the UK (Lee et al, 2012), an increase in the prevalence of cycling could have significant implications for public health, with the potential for health benefits to translate into financial benefits for the employer as well.

20 Impact of the Cycle to Work Scheme
4 Literature on Economic Benefits
4.1 Introduction In this final section we examine the available evidence on the economic benefits of cycling and link that, as far as possible, with what we have found about the effect of the scheme on cycling volumes and the health benefits of cycling.
4.2 Policy context Investment in cycling is currently being undertaken in the UK. As well as the cycle to work scheme itself, various schemes and funds have been commissioned by the Department for Transport (DfT) with the intention of increasing participation in cycling. In March 2015, DfT outlined its position for investing in cycling and walking, noting there was a strong business case for doing so due to high benefits from associated costs, and that ‘active travel interventions have the potential to deliver strong benefits and deserve a place in the modern toolkit of transport policy’ (DfT, 2015a:4).
4.3 General economic benefits from cycling One of the main cycling charities in the UK, the Cyclist’s Touring Club (CTC), has outlined a strong economic case for increasing cycling activity10. The CTC’s research has found that if cycle use, currently around two per cent of all journeys, increased to ten per cent by 2025 and 25 per cent by 2050, the cumulative benefits would be around £42 billion per annum in today’s money by 2050; roughly analogous with current UK defence spending. This is an extremely ambitious target, although it is the figure recommended by the All Parliamentary Group on Cycling11. The CTC’s position is that cycling would mitigate the economic risks of excessive road transport, such as pollution, road accidents, and physical inactivity. A healthier workforce would be more productive, and there would be numerous tangible and intangible benefits.
10 http://www.ctc.org.uk/campaigning/views-and-briefings/cycling-and-economy 11 http://www.ctc.org.uk/sites/default/files/get_britain_cycling.pdf

Institute for Employment Studies 21
The CTC is a group arguing in favour of increasing cycling rates and therefore not independent so less weight should be attached to this evidence than peer-reviewed journal evidence. However, it is comprehensive and well-researched, and set in the UK, making it a relevant and useable evidence body for this review.
A more achievable but still ambitious target comes from the DfT’s Cycling Delivery Plan (DfT, 2014a), which looks to double the number of cycling trips over the next ten years. If this were achieved, we would still expect to see annual net benefits of around £6.4 billion by 2050 (Lovelace and Crawford, 2015) which would have a benefit-to-cost ratio of 5.5:1. In support of achieving the target, the government’s draft Cycling and Walking Investment Strategy was released in March 2016 (DfT, 2016). As well as £191 million earmarked for Cycle Ambition Cities, the government has committed to £50 million of funding for Bikeability, a school-based schemewhich teaches young children to ride bicycles, £100 million for improving cycling infrastructure, safety, and integration, and £80 million to be openly bid for by projects that support cycling around the country.
More broadly, evidence suggests that the benefit-to-cost ratio of investing in cycling and walking schemes could be as high as 13:1 (Davis, 2010), and a case study in Copenhagen found that the costs of car driving to society over cycling was roughly six times as high (Gössling and Choi, 2015).
Alongside this general evidence, a large proportion of the academic literature focusses on wide, sweeping economic benefits of getting a population cycling, on a variety of scales and in numerous settings. Methodologically, the studies are a combination of evidence reviews, econometric models and estimations, and case studies of specific locales. They quantify the direct benefits of cycle schemes, and also make an assessment of indirect, intangible benefits to society and employers, which are diverse and influence numerous sectors of the economy.
Several large-scale evidence reviews have highlighted the numerous economic benefits that cycling can bring, for example Rajé and Saffrey (2016) and Cavill et al (2008:2). Cavill et al highlighted the ‘wide variation in the approaches taken to examining the health effects of physical activity in economic analyses of transport projects’ and an affiliated ‘lack of transparency of methods in many studies’.
Those that did provide methodologies largely took two approaches, both structured around public health. One approach was to consider the effect of physical inactivity on respondents’ health by contrasting respondents who completed the recommended amount of physical activity (30 minutes per day, five days per week) with those that did not. The other was a cost-of-illness approach, attributing the costs for specific diseases to physical inactivity. Both approaches yield robust data, and provide an estimate of the wide economic benefits of promoting cycling and increasing physical activity amongst the population.
22 Impact of the Cycle to Work Scheme
An example of the former approach is a study commissioned by the Michigan fitness foundation (De Jong et al, 2003). Conservatively estimating direct (medical care, workers’ compensation, lost productivity) and indirect costs (inefficiencies associated with replacement workers) of inactivity, the final amount totalled $8.9 billion ($1,175 per resident). Using the latter model, a study in Minnesota12 found $495 million was spent treating diseases and conditions that could be prevented by increased physical activity; over $100 per resident (Garrett et al, 2001). Both approaches, although differing in the size of the effect, highlight the positive impacts of increased physical activity on health and associated costs in the area.
Although not peer reviewed, a similar study has been carried out in a UK setting by Davis (2010) for the Department of Health. Davis examined a range of UK and non-UK studies on the costs and benefits of interventions to promote routine walking and cycling and found that almost all of the studies reported economic benefits which were highly significant, with benefit to cost ratios averaging between 13 and 19:1 - much higher than the 2:1 figure that the government considers ‘high’ value for money.
Further evidence on the economic benefits of cycling to work comes from a case study conducted in Dublin (Deenihan and Caulfield, 2014), inferring that a modest modal shift (an increase of 2.5 per cent in the number of people cycling to work) could directly save around 26 million euros over a ten year period, whilst larger shifts (ten per cent of the workforce cycling) could yield 141.2 million euros over the same ten year period, at a cost benefit ratio of between 2 and 12:1.
4.4 The wider benefits of investing in cycling infrastructure
A significant body of the literature focuses on the wider benefits of investment in cycling infrastructure, which is largely outside the scope of this study. Most show significant benefits.
For example, in the UK, a cost benefit analysis has been conducted by central government (DfT, 2014b). This evaluates the Cycle City Ambition Grant, which was a fund invested in increasing cycling amenities in eight UK cities, and the Cycling in National Parks grant, which had the same principle of targeting a specific area but in this case in four national parks13. Numerous benefits (fitness, absenteeism, reduced accidents etc.) and costs (loss of
12These are transferable settings due to similar economies and demographics to the UK. Demographically
and economically, Minnesota can be a loose proxy for Scotland, for example. 13 Birmingham, Bristol, Cambridge, Leeds, Manchester, Newcastle, Norwich and Oxford for the cities, with
the national parks being Dartmoor, the New Forest, the Peak District and the South Downs.

Institute for Employment Studies 23
revenue to the Exchequer through reduced taxation, cost of the scheme itself) were evaluated, with cost-benefit ratios modelled from this. All 12 sites displayed cost-benefit ratios higher than the 2:1 ‘gold standard’ used by other government departments, from 2.1:1 in Leeds through to 16.5:1 in Oxford. Across all 12 sites, the average ratio was 5.9:1. This suggests that targeted interventions on cycling can be extremely cost effective, and that both urban and rural areas can benefit from this investment. At a European level the benefits also hold true, with Rabl and de Nazelle (2012) found that one driver switching to cycling for a 10km round trip full time commute brought a health benefit with and economic value of about €1,300 per year, and in a large city a reduction of air pollution worth roughly €30 a year.
Two case studies produced robust findings on the benefits of investing in cycling infrastructure and uptake. Evidence from Pilsen showed the importance of interlinking uptake and infrastructure, finding that contrary to the evidence discussed above, costs did not cover benefits of building a new cycling infrastructure in the city as demand was low (Foltýnová and Kohlová, 2002). Although not all wider benefits were considered (such as noise reduction) benefits did not cover costs because in Pilsen demand for cycling was rather low; only 0.3 per cent of residents cycled to work. The UK has a higher cycling rate, but consideration of the demand of cycling needs to factor into cost/benefit analyses, and be considered when schemes are being implemented. This suggests that the two perhaps needed to be treated in tandem, improving infrastructure as uptake is encouraged in a balanced approach. This is compounded by evidence from Portland, Oregon, which found that ‘by 2040, investments in the range of $138 to $605 million will result in health care cost savings of $388 to $594 million, fuel savings of $143 to $218 million, and savings in value of statistical lives of $7 to $12 billion. The benefit-cost ratios for health care and fuel savings are between 3.8 and 1.2 to 1, and an order of magnitude larger when value of statistical lives is used’ (Gotschi, 2011:49). This evidence appears to suggest that investments in infrastructure on their own are not as cost effective as combining them with initiatives to promote increased cycling uptake.
What the Portland and Pilsen case studies show us is a need for a consideration of ‘supply and demand’ factors in cycling uptake. As well as the scheme and incentives, there has to be investment in cycling infrastructure, allowing the two elements to grow organically and ensure maximum benefit. A study on the potential effects has been conducted by Wardman et al (2007). This considers the cycle to work scheme, but models it by taking the scheme one step further and offering a financial incentive to those who take up cycling to work. This also demonstrated that along with the cash incentive, there needs to be investment in infrastructure, although facilities such as bicycles and showers at work are also helpful additions that can encourage uptake.
24 Impact of the Cycle to Work Scheme
4.5 Economic benefits of increased physical activity The economic effects of the health benefits of cycling can be seen at work through reduced absenteeism as cyclists tend to have fewer days off sick than non-cyclists and more widely through the reduced levels of mortality associated with increased physical activity (Rajé and Saffrey, 2016).
4.5.1 Lower absenteeism
Hendriksen et al (2010) found that cycling to work was associated with less all-cause sickness absence. They gathered cross-sectional data about the cycling habits of 1,236 Dutch employees using a self-reported questionnaire, as well as company absence records, to analyse differences between cyclists’ and non-cyclists’ absenteeism. The evidence showed that employees who cycled to and from work had mean total durations of absenteeism of approximately one day less per year than those who did not cycle (7.4 compared to 8.7, respectively). This was significant and remained significant even after controlling for subjective health; though the difference was partly explained by a larger proportion of those from the cycling group reporting no sickness absence at all during the year. Combining this finding with recent research from PwC (2013), employer benefits can be calculated here, giving a saving to employers which could be as high as £134 per annum per employee14. Clarke et al (2014) cited a DfT study that measured the reduction of absenteeism at between 0.4 and 2.1 days per annum; using the same assumptions as above, this would be worth between £41 and £216 per employee per year. Unwin’s study of civil servants (1995) built on this, finding that regular cyclists had less than half the coronary attack rates of non-cyclists; as heart disease costs Britain around £9 billion per annum this could be a cost-saving intervention.
4.5.2 The wider benefits from increased physical activity
However the economic benefits to employers from reduced absenteeism are relatively small compared to the wider benefits to public health generally as well as wider environmental benefits.
A large-scale epidemiological study by Anderson et al (2000) found that among men and women in all age groups there was a lower mortality rate in the physically active compared with the inactive. Those who used a bicycle to travel to work experienced a
14 PwC calculate the average employee to take 9.1 sick days per year, at a cost of £29 billion. Given that the
workforce is currently 31 million, this works out to £103 per sick day per employee. Using Hendrickson’s figures of 1.3 fewer sick days per year for those that cycle to work, we can calculate the benefit therefore of cycling to work at £134 per annum.

Institute for Employment Studies 25
lower mortality rate, by approximately 40 per cent, even after adjustment for leisure time physical activity and sports participation.
Crawford and Lovelace’s (2015) study of the benefits of getting England cycling which examined the potential economic gains from the DfT’s Cycle Delivery Plan calculated that the net benefits amounted to some £2 billion a year, of which the saving from reduced absenteeism was less than one per cent. The majority of the gain, some 90 per cent, was from increased physical fitness.
The Department for Transport (2015a) has provided guidance on how to construct an economic case for an intervention to increase physical activity, such as cycling, incorporating the World Health Organisation's (WHO) Health Economic Assessment Tool (HEAT) for monetising health benefits from increased physical activity. In addition the DfT identified a range of other potential economic benefits from cycling, such as improved journey quality and road safety and reduced decongestion.
In a worked example some 35 per cent of the total economic benefits of increasing cycling activity are attached to increases in physical activity, the largest proportion of all benefits, with 29 per cent of benefits attributable to improved journey quality. Another substantial benefit comes from decongestion, with 32 per cent of net economic benefits in the example coming from the effect of increased efficiencies of taking cars off the road.
4.6 Estimating the health benefits of the cycle to work scheme
The DfT model of the economic benefits of physical activity can be applied to the cycle to work scheme. It involves making a series of assumptions about take up and benefits based on the evidence from the literature. - see Appendix for the assumptions (Table 1 and 2) and the calculations (Tables 2 to 5).
Our calculations show that if we assume just a modest impact from the cycle to work scheme, ie that it generates an additional 9,200 cyclists a year, then the economic value of the benefits generated by reduced absenteeism and, more significantly, reductions in premature death due to increased physical exercise, would amount to £72 million.
The Anderson study (2000) cited in the DfT economic guidance provides the assumption for reduced mortality and the value of a prevented fatality (£1.64 million) again comes from DfT figures (see Table 3 in the Appendix).
The reduction in sickness absence is calculated using World Health Organisation data that 30 minutes cycling a day would, on average, reduce sickness absence by six per cent and is applied to average UK sickness and earnings rates.

26 Impact of the Cycle to Work Scheme
Increased physical activity is of most benefit to those who start from a low level of exercise and so we have assumed that the increase applies just to those who start cycling to work and who would not have cycled before. We have also assumed, again based on the literature, that while all those new cyclists would benefit in the first year, a number would not continue (because some would stop cycling and some would change jobs or stop going to work). We have assumed that rate of reduction to be 40 per cent a year.
The number of participants in the cycle to work scheme in 2014 is 184,000, according to the Cycle to Work Alliance data. Our analysis of the survey data suggests that nine per cent of participants were new to cycling and that the average increase in the amount of cycling was 30 minutes a day. As the survey may be an over-estimate, since some would have taken up cycling even in the absence of the scheme, we have assumed that just five per cent of cyclists taking part in the scheme start cycling as a result of their involvement, ie 9,200 people in the first year.
Using these figures we estimate the social benefit to be £72 million. This does not take into account the benefits from occasional cyclists cycling more. Nor does it take into account the potential economic benefits from environmental improvements, for example decongestion. We do not have data on the cost of the scheme, but a calculation (see Table 5), based on further data from the survey suggests the cost to the UK Treasury is approximately £190 per user, (ie £35 million for 184,000 participants). On this basis the scheme needs to generate just a 2.5 per cent increase in cycling to ‘break even’, from a social welfare point of view. From the five per cent increase among novice cyclists assumed here, the benefit cost ration is 2:1.
4.7 Conclusions There are a range of studies which seek to estimate the economic benefits from increased cycling or other forms of physical activity. Many of the studies centre on improvements to cycling infrastructure and also examine the wider environmental benefits of, for example, increasing cycling at the expense of car use. In addition there are clear economic benefits from the improvements in health associated with increased physical exercise and in particular from more cycling. There is also evidence from studies on investment in cycling infrastructure that such initiatives alone do not necessarily result in a greater uptake in cycling and that such investment would benefit from demand side schemes to directly promote cycling activity.
Although the literature has less to say about the direct benefits associated with interventions such as the cycle to work scheme, there is evidence to suggest that such schemes could, for instance, result in reduced sickness absence which would produce savings for employers. The literature also indicates that these positive benefits are relatively small compared to the more widespread economic gains from improved physical fitness.

Institute for Employment Studies 27
We have used the model developed by the Department for Transport for calculating the economic case for investing in cycling to provide approximate estimates of the health benefits of the cycle to work scheme. Using modest assumptions we estimate that if the scheme generates an additional 9,200 cyclists a year, then the social benefit would be £72 million a year and the cost benefit ratio would be more than 2:1.

28 Impact of the Cycle to Work Scheme
5 Conclusions
This study has reviewed the evidence on the health and economic benefits of cycling and particularly focussed on cycling to work. It was not intended to be a systematic review of all the available evidence as this was not possible in the available time, nor was it intended to be a rigorous impact assessment of the specific UK cycle to work scheme. We have relied on the literature identified through our rapid, though thorough, search and the data from the survey of cycle to work scheme participants conducted by the Cycle to Work Alliance. Our study therefore has limitations.
Nevertheless the weight of the general evidence on cycling and health is both substantial and clear. Cycling is a form of physical activity that clearly has a significant and positive effect on participants’ health. It improves their physical fitness and therefore reduces their risk of a range of diseases including diabetes, heart disease and some forms of cancer.
Consequently there are significant social and economic benefits for society as a whole from an increase in cycling, which can be given a monetary value. Some of these benefits will accrue to employers through reduced absenteeism and potentially higher levels of productivity (although we did not find any specific evidence on the latter). However most of the benefits are reaped by individuals and society as a whole through, for example, reduced health expenditure from a more physically fit population and from improvements to the environment.
To what extent does the cycle to work scheme contribute to these economic gains?
While there is no conclusive evidence on the impact of the cycle to work scheme on the overall volume of cycling and in particular cycling to work, we can conclude that through bringing about an increase in the physical fitness of participants it is likely to have a positive economic benefit and be cost effective from a social welfare point of view.
There is some evidence from the survey of scheme users that participating in the scheme is associated with increased cycling to work particularly among previous non-cyclists or occasional cyclists. Furthermore, other surveys of scheme users and studies of similar schemes have found increases in cycling among scheme participants. Finally, although official data do not show an increase in the number of people cycling, they do indicate that the amount of cycling (in terms of miles cycled) is rising. We can therefore conclude that the scheme is likely to have a positive impact on the volume of cycling to work.

Institute for Employment Studies 29
The literature also provides us with the key evidence for developing a model to estimate the social value of such an impact. Assuming a modest impact on the amount of additional cycling among those who take advantage of the scheme and that just five per cent of participants, 9,200 people, cycle for 30 minutes more a working day as a result of their involvement, then we estimate the social benefit to be £72 million a year. This amounts to more than twice the cost to the Treasury in lost tax and National Insurance. In addition there are likely to be further environmental benefits.
On this basis, the scheme is economically and socially beneficial and, especially if combined with infrastructure improvements, would continue to play a positive role in a comprehensive and cost effective strategy to increase the number of cyclists and volume of cycling in the UK.
30 Impact of the Cycle to Work Scheme
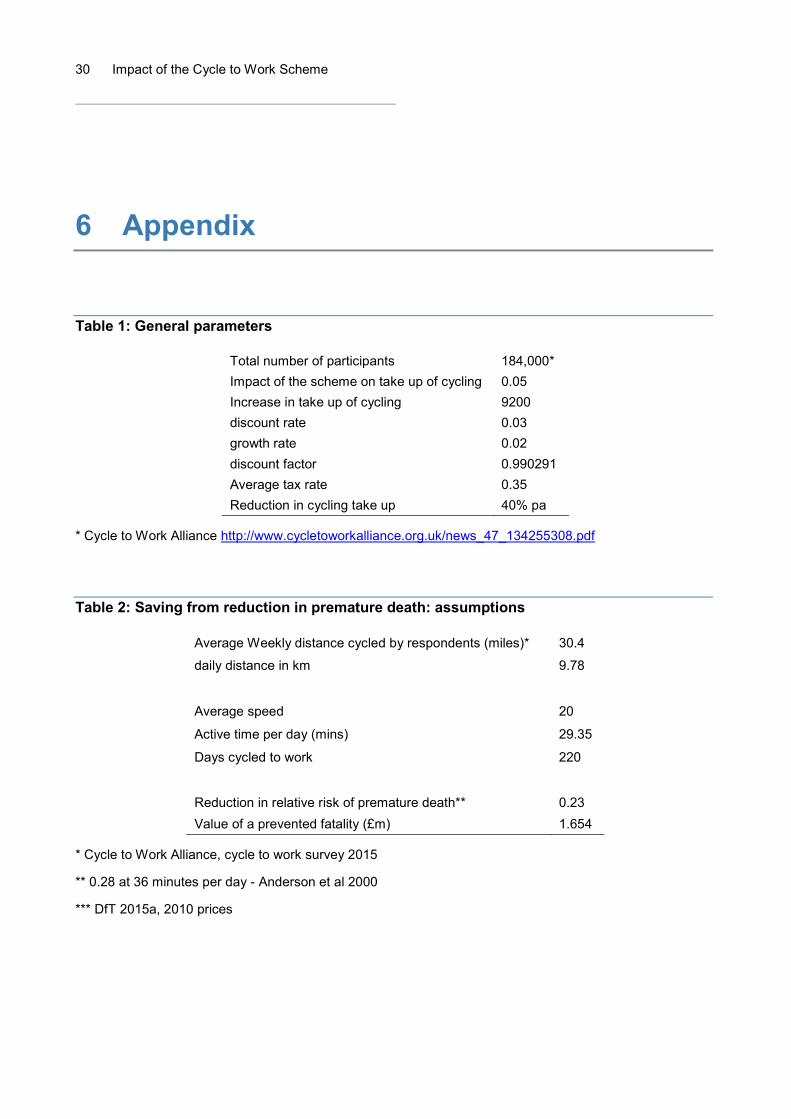
6 Appendix
Table 1: General parameters
Total number of participants 184,000* Impact of the scheme on take up of cycling 0.05 Increase in take up of cycling 9200 discount rate 0.03 growth rate 0.02 discount factor 0.990291 Average tax rate 0.35 Reduction in cycling take up 40% pa
* Cycle to Work Alliance http://www.cycletoworkalliance.org.uk/news_47_134255308.pdf
Table 2: Saving from reduction in premature death: assumptions
Average Weekly distance cycled by respondents (miles)* 30.4
daily distance in km 9.78
Average speed 20
Active time per day (mins) 29.35
Days cycled to work 220
Reduction in relative risk of premature death** 0.23 Value of a prevented fatality (£m) 1.654
* Cycle to Work Alliance, cycle to work survey 2015
** 0.28 at 36 minutes per day - Anderson et al 2000
*** DfT 2015a, 2010 prices

Institute for Employment Studies 31
Table 3: Saving from reduction in premature death: calculations
cycle for
% of total
benefits Number cycling
Average mortality
Expected death
Reduction in expected
death
Annual Monetised benefits
NPV over 40 years
(£) 1 year 20% 9200 0.0024 4.416 0.616137178 1019090.892 33,915,717 2 years 40% 5520 0.0024 5.2992 0.443618768 733745.4425 24,419,316
3 years 60% 2760 0.0024 3.9744 0.166357038 275154.541 9,157,243
4 years 80% 1380 0.0024 2.6496 0.055452346 91718.18032 3,052,414
5 years+ 100% 690 0.0024 1.656 0.017328858 28661.93135 953,880
Total
71,498,570
Table 4: Savings from reduced absenteeism
Average annual absenteeism (days)* 4.4 Reduction in sick days** 0.264
Average sick pay cost*** £133.56 Annual benefits per additional cyclist £35.26
Total annual benefits £324,391 Total benefits (discounted over 8 years) £704,794
* http://www.ons.gov.uk/employmentandlabourmarket/peopleinwork/labourproductivity/articles/sicknessabsenceinthelabourmarket/2014-02-25
** 6% based on 30 minutes activity a day, WHO 2003
*** based on UK average earnings 2015
Table 5: Costs - Salary sacrificed under the scheme
Mid point £
£0-£100 2,952 23.08 50 11.54 £101-300 765 5.98 200 11.96 £301-£500 1,983 15.5 400 62.00 £501-£700 1,932 15.1 600 90.60 £701-£900 1,459 11.4 800 91.20 £900-£1,000 3,702 28.94 950 274.93
Average salary sacrificed 542.23
Average cost to the exchequer per user 189.78
Source: Cycle to Work Alliance, cycle to work survey 2015

32 Impact of the Cycle to Work Scheme
7 References
7.1 Health Benefits Andersen L B, Schnohr P, Schroll M and Hein HO (2000), ‘All-cause mortality associated
with physical activity during leisure time, work, sports, and cycling to work’, Archives of internal medicine, 160(11), pp. 1621-1628.
George S M, Irwin M L, Matthews C E, Mayne S T, Gail M H, Moore S C, Albanes D, Ballard-Barbash R, Hollenbeck A R, Schatzkin A and Leitzmann M F (2010), ‘Beyond recreational physical activity: examining occupational and household activity, transportation activity, and sedentary behavior in relation to postmenopausal breast cancer risk’, American journal of public health, 100(11), pp. 2288-2295.
Hendriksen I J, Simons M, Garre F G and Hildebrandt V H (2010), ‘The association between commuter cycling and sickness absence’, Preventive medicine, 51(2), pp. 132-135.
Hou L, Ji B T, Blair A, Dai Q, Gao Y T and Chow W H (2004), ‘Commuting physical activity and risk of colon cancer in Shanghai, China, American Journal of Epidemiology, 160(9), pp. 860-867.
Hu G, Eriksson J, Barengo N C, Lakka T A, Valle T T, Nissinen A, Jousilahti P and Tuomilehto J (2004), ‘Occupational, commuting, and leisure-time physical activity in relation to total and cardiovascular mortality among Finnish subjects with type 2 diabetes’, Circulation, 110(6), pp. 666-673.
Hu G, Jousilahti P, Borodulin K, Barengo N C, Lakka T A, Nissinen A and Tuomilehto J (2007), ‘Occupational, commuting and leisure-time physical activity in relation to coronary heart disease among middle-aged Finnish men and women’, Atherosclerosis, 194(2), pp. 490-497.
Hu G, Qiao Q, Silventoinen K, Eriksson J G, Jousilahti P, Lindström J, Valle T T, Nissinen A and Tuomilehto J (2003), Occupational, commuting, and leisure-time physical activity in relation to risk for type 2 diabetes in middle-aged Finnish men and women, Diabetologia, 46(3), pp. 322-329.

Institute for Employment Studies 33
Lamb M J, Halbesma N and Wild S H (2013), ‘Cycling as a mode of transport: a possible solution for the increasing burden of type 2 diabetes?’, Practical Diabetes, 30(7), pp. 286-289.
Lee I M, Shiroma E J, Lobelo F, Puska P, Blair S N, Katzmarzyk P T and Lancet Physical Activity Series Working Group (2012), ‘Effect of physical inactivity on major non-communicable diseases worldwide: an analysis of burden of disease and life expectancy’, The Lancet, 380(9838), pp. 219-229.
Lim S S, Vos T, Flaxman A D, Danaei G, Shibuya K, Adair-Rohani H, AlMazroa M A, Amann M, Anderson H R, Andrews K G and Aryee M (2013), ‘A comparative risk assessment of burden of disease and injury attributable to 67 risk factors and risk factor clusters in 21 regions, 1990–2010: a systematic analysis for the Global Burden of Disease Study 2010’, The Lancet, 380(9859), pp. 2224-2260.
Luoto R, Latikka P, Pukkala E, Hakulinen T and Vihko V (2000), ‘The effect of physical activity on breast cancer risk: a cohort study of 30,548 women’, European journal of epidemiology, 16(10), pp. 973-980.
Matthews C E, Jurj A L, Shu X O et al (2007) Influence of exercise, walking, cycling, and overall nonexercise physical activity on mortality in Chinese women, American Journal Epidemiology, 165, pp. 1343–1350.
Monninkhof E M, Elias S G, Vlems F A, van der Tweel I, Schuit A J, Voskuil D W and van Leeuwen F E (2007), ‘Physical activity and breast cancer: a systematic review’, Epidemiology, 18(1), pp. 137-157.
Oja P, Titze S, Bauman A, De Geus B, Krenn P, Reger-Nash B and Kohlberger T (2011), ‘Health benefits of cycling: a systematic review’, Scandinavian journal of medicine & science in sports, 21(4), pp. 496-509.
Pucher J, Buehler R, Bassett D R and Dannenberg A L (2010), ‘Walking and cycling to health: a comparative analysis of city, state, and international data’, American journal of public health, 100(10), pp. 1986-1992.
Thune I and Lund E (1996), ‘Physical activity and risk of colorectal cancer in men and women’, British Journal of Cancer, 73(9), p. 1134.
United States Department of Health, 1996. Physical activity and health: a report of the Surgeon General. Diane Publishing.
World Health Organisation (2003), Global strategy on diet, physical activity, and health: obesity and overweight.

34 Impact of the Cycle to Work Scheme
7.2 Economic benefits Anderson L B, Schnohr P, Schroll M and Hein H O (2000), ‘All-cause mortality associated
with associated with physical activity during leisure time, work, sports, and cycling to work’, Archives of Internal Medicine, Vol. 160(11), pp. 1621-1628.
Buehler R and Pucher J (2012), ‘Walking and cycling in Western Europe and the United States: trends, policies, and lessons’, TR News, (280).
Caulfield B and Leahy J (2011), ‘Learning to cycle again: examining the benefits of providing tax-free loans to purchase new bicycles’, Research in Transportation Business & Management, 2, 42-47.
Cavill N, Kahlmeier S, Rutter H, Racioppi F and Oja P (2008), ‘Economic analyses of transport infrastructure and policies including health effects related to cycling and walking: a systematic review’, Transport policy, 15(5), pp. 291-304.
Clarke et al (2014), Cycle to work scheme – weekend warriors or daily commuters? Institute for Transport, University of Leeds.
Davis A (2010), Value for Money: An Economic Assessment of Investment in Walking and Cycling, Department of Health/Government Office for the South West. Available at: http://www.apho.org.uk/resource/item.aspx?RID=91553 [Accessed February 2016]
DeJong G, Sheppard L, Lieber M and Chenoweth D (2003), The economic cost of physical inactivity in Michigan, Michigan Fitness Foundation.
Deenihan G and Caulfield B (2014), ‘Estimating the health economic benefits of cycling’, Journal of Transport & Health, 1(2), pp. 141-149.
Department for Transport (2014a), Cycling Delivery Plan. Available at: https://www.gov.uk/government/uploads/system/uploads/attachment_data/file/364791/141015_Cycling_Delivery_Plan.pdf [Accessed March 2015].
Department for Transport (2014b), Value for Money Assessment for Cycling Grants. Available at: https://www.gov.uk/government/uploads/system/uploads/attachment_data/file/348943/vfm-assessment-of-cycling-grants.pdf [Accessed March 2016]
Department for Transport (2015a), Investing in Cycling and Walking The Economic Case for Action. Available at: https://www.gov.uk/government/uploads/system/uploads/attachment_data/file/416826/cycling-and-walking-business-case-summary.pdf [Accessed March 2015]

Institute for Employment Studies 35
Department for Transport (2015b), Setting the first cycling and walking investment strategy. Available at: https://www.gov.uk/government/uploads/system/uploads/attachment_data/file/487846/cycling-and-walking-investment-strategy.pdf [Accessed March 2016]
Department for Transport (2016), Cycling and Walking Investment Strategy. March 2016. Available at: https://www.gov.uk/government/uploads/system/uploads/attachment_data/file/512895/cycling-and-walking-investment-strategy.pdf
Elliot R (2010), Leeds Universities' cycle loan schemes: who participates, why and do they make a difference? Master’s thesis, Institute for Transport Studies, University of Leeds.
Foltýnová H and Kohlová M B (2002), Cost-Benefit Analysis of Cycling Infrastructure: A Case Study of Pilsen, Charles University Environment (Prague).
Garrett N, Brasure M, Schmitz K and Schultz M (2001), The Direct Cost of Physical Inactivity to a Health Plan, St. Paul, Minnesota, Minnesota Department of Health.
Gössling S and Choi A S (2015), ‘Transport transitions in Copenhagen: Comparing the cost of cars and bicycles’, Ecological Economics, 113, pp. 106-113.
Gotschi T (2011), ‘Costs and benefits of bicycling investments in Portland, Oregon’, Journal of Physical Activity and Health, 8(1), S49-S58.
Hendrikson I, Simons M, Garre F and Hildebrant V (2010), ‘The Association Between Commuter Cycling and Sickness Absence’, Preventative Medicine, No 51, pp. 132-135.
Krizec K J (2007), ‘Estimating the economic benefits of bicycling and bicycle facilities: An interpretive review and proposed methods’, in Essays on transport economics, pp. 219-248, Physica-Verlag HD.
Lovelace R and Crawford F (2015), The Economic Cycle, CTC. Jan 2015. www.ctc.org.uk/economic-cycle [Accessed February 2016]
Macmillan A, Connor J, Witten K, Kearns R, Rees D and Woodward A (2014), ‘The societal costs and benefits of commuter bicycling: simulating the effects of specific policies using system dynamics modelling’, Environmental health perspectives, 122(4), 335.
MTD (2013), Quantifying the Economic Impact of Bicycling: A Literature Review with Implications for Minnesota.
PwC (2013), Rising sick bill is costing UK business £29bn a year – PwC research. http://pwc.blogs.com/press_room/2013/07/rising-sick-bill-is-costing-uk-business-29bn-a-year-pwc-research.html [Accessed March 2016]

36 Impact of the Cycle to Work Scheme
Rabl A and De Nazelle A (2012), ‘Benefits of shift from car to active transport’, Transport policy, 19(1), pp. 121-131.
Rajé F and Saffrey A (2016), The Value of Cycling, Department for Transport.
Rowe K (2013), Bikenomics: Measuring the Economic Impact of Bicycle Facilities on Neighborhood Business Districts, Washington, DC University of Washington. Available at: http://www.dot.state.fl.us/planning/policy/bikeped/bestpractice/Bikenomics.pdf
Rutter H, Cavill N, Racioppi F, Dinsdale H, Oja P and Kahlmeier S (2013), ‘Economic impact of reduced mortality due to increased cycling’, American journal of preventive medicine, 44(1), pp. 89-92.
Transform Scotland (2013), The Value of Cycle Tourism, Commissioned by Sustrans Scotland. http://transformscotland.org.uk/what-we-do/publications/
Unwin N C (1995), ‘Promoting the Public Health Benefits of Cycling’, Public Health, No. 109, pp. 41-46.
Vanoutrive T, Van Malderen L, Jourquin B, Thomas I, Verhetsel A and Witlox F (2009), ‘ “Let the business cycle!” A spatial multilevel analysis of cycling to work’, Belgeo, 2, 2009, pp. 217-232
Wardman M R, Tight M R, Page M (2007), ‘Factors influencing the propensity to cycle to work’, Transportation Research A, 41(4), pp. 339-359.