impact of the fy 2009 building technologies …...pnnl-17598 impact of the fy 2009 building...
TRANSCRIPT

PNNL-17598
Impact of the FY 2009 Building Technologies Program on United States Employment and Earned Income O.V. Livingston J.A. Dirks M.J. Scott K.A. Cort D.J. Hostick June 2008 Prepared for the U.S. Department of Energy under Contract DE-AC05-76RL01830

DISCLAIMER
This report was prepared as an account of work sponsored by an agency of the United States Government. Neither the United States Government nor any agency thereof, nor Battelle Memorial Institute, nor any of their employees, makes any warranty, express or implied, or assumes any legal liability or responsibility for the accuracy, completeness, or usefulness of any information, apparatus, product, or process disclosed, or represents that its use would not infringe privately owned rights. Reference herein to any specific commercial product, process, or service by trade name, trademark, manufacturer, or otherwise does not necessarily constitute or imply its endorsement, recommendation, or favoring by the United States Government or any agency thereof, or Battelle Memorial Institute. The views and opinions of authors expressed herein do not necessarily state or reflect those of the United States Government or any agency thereof.
PACIFIC NORTHWEST NATIONAL LABORATORY
operated by BATTELLE
for the UNITED STATES DEPARTMENT OF ENERGY
under Contract DE-AC05-76RL01830
Printed in the United States of America
Available to DOE and DOE contractors from the Office of Scientific and Technical Information,
P.O. Box 62, Oak Ridge, TN 37831-0062; ph: (865) 576-8401 fax: (865) 576-5728
email: [email protected]
Available to the public from the National Technical Information Service, U.S. Department of Commerce, 5285 Port Royal Rd., Springfield, VA 22161
ph: (800) 553-6847 fax: (703) 605-6900
email: [email protected] online ordering: http://www.ntis.gov/ordering.htm
This document was printed on recycled paper. (9/2003)

PNNL-17598
Impact of the FY 2009 Building Technologies Program on United States Employment and Earned Income
O.V. Livingston J.A. Dirks M.J. Scott K.A. Cort D.J. Hostick June 2008 Prepared for the U.S. Department of Energy under Contract DE-AC05-76RL01830 Pacific Northwest National Laboratory Richland, Washington 9935

iii
Abstract
The Department of Energy (DOE) Office of Energy Efficiency and Renewable Energy (EERE) is interested in assessing the potential economic impacts of its portfolio of activities on national employment and income. A special purpose input-output model called ImSET is used in this study of 14 Building Technologies Program activities in the EERE final FY 2009 budget request to the Office of Management and Budget in February 2008. Energy savings, investments, and impacts on U.S. national employment and earned income are reported by activity for selected years to the year 2025. Energy savings and investments from these activities have the potential of creating a net total of 258,000 jobs and about $3.7 billion in earned income (2007$) by the year 2025.
iv
Summary As part of measuring the impact of government programs for improving the energy efficiency of the nation’s building stock, the Building Technologies (BT) Program within the Department of Energy (DOE) Office of Energy Efficiency and Renewable Energy (EERE) is interested in assessing the economic impacts of its portfolio of activities, specifically the potential impact on national employment and income. This assessment was done for the first time in FY 1999. The analysis provides estimates of primary energy savings and environmental and direct financial benefits of the BT Program. The current analysis relates to the FY 2009 budget request from EERE.
The programmatic needs of the Building Technologies Program suggest that a simple, flexible, user-friendly method is needed to derive national employment and income impacts of individual EERE activities. Therefore, BT funded Pacific Northwest National Laboratory (PNNL) to develop a special-purpose national input-output model called Impact of Sector Energy Technologies (ImSET) Model, the latest version of which is ImSET 2.1 (Roop et al. 2005). In this report, we use the ImSET model to calculate the impact of 14 BT activities, based on the final Building Technologies Program budget submitted February 2008. BT activities affect the economy through three primary mechanisms. First, if the incremental capital costs of the new technology per installed unit are different from those of the conventional technology, the level of purchases will change in the sectors involved in manufacturing, distribution, and installation for both technologies, changing the level of overall economic activity. Second, the efficiency investment may crowd out other domestic investments and consumer spending, offsetting some positive impact on the economy caused by the new efficiency investment. Third, energy expenditures are reduced, lowering final sales in the electric and gas utility sectors, as well as in the trade and services sectors that provide related maintenance, parts, and services. However, these savings are equivalent to increased income to households and businesses that, in turn, leads to increased spending across all sectors of the economy. Energy efficient technology is expected to have a measurable effect on the activity level of the U.S. economy. BT activities generally are characterized by significant investment requirements and delivered energy cost savings. The Building Technologies Program consists of three major organizational units: R&D, Regulatory, and Technology Validation and Market Introduction (TVMI). Research and Development (R&D) is further segregated into Residential Building Integration and Commercial Building Integration, which, in addition to system integration (whole building) approaches, each include various specific component research activities in emerging technologies (e.g., solid state lighting). “Regulatory” encompasses appliance standards and associated analysis while TVMI is further broken down into Building Codes and Standards, and Market Transformation activities (e.g., Energy Star). Detailed description of the activities can be found in the Building Technologies Multi-Year Program Plan 2008. A number of the technologies that would result from a subset of the activities from various planning units would interact with each other in practice, either degrading or enhancing each others’ effects on energy savings. This report accounts for the net effects of those activities in a cross-cutting “activity” called Integrated Lighting Shell. BT does not manage its interacting technologies in an Integrated Lighting Shell activity; the activity was a construct specifically created for this report to avoid double-counting the impacts on the U.S. macro economy of investment and energy savings of interacting technologies and

v
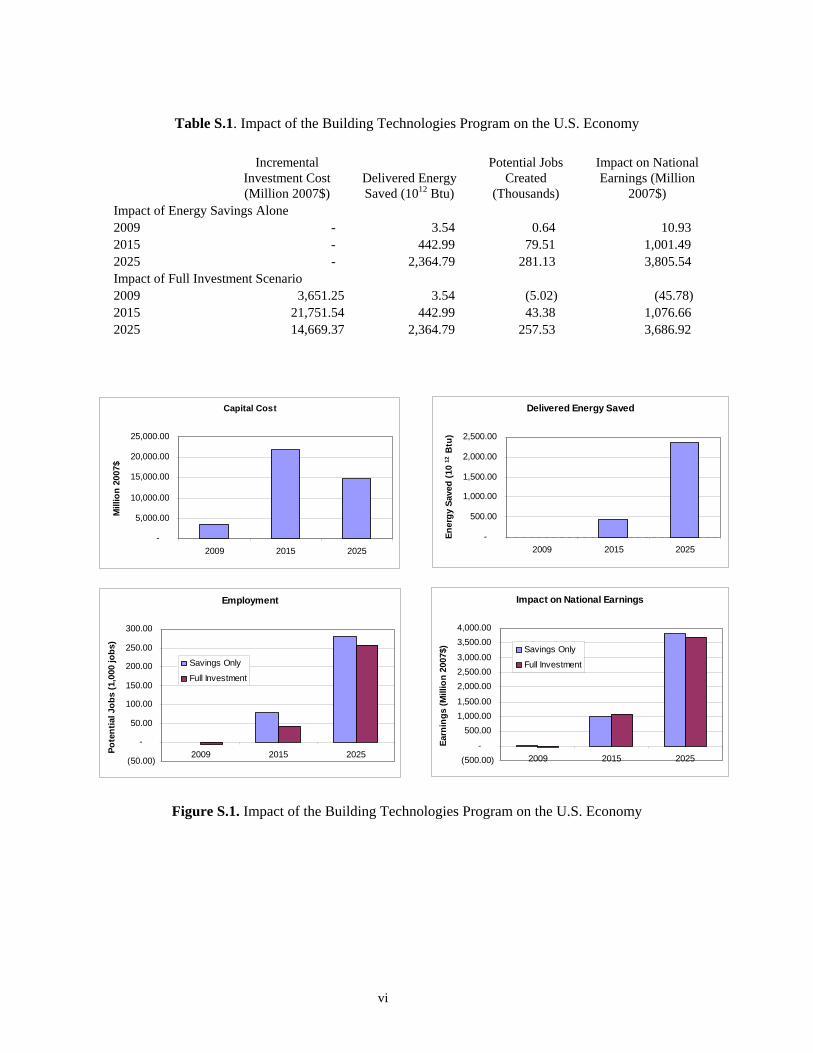
practices. For residential buildings, Integrated Lighting Shell comprises lighting (solid state and compact fluorescent light bulbs [CFLs]), windows, and envelope technologies activities described in the Multi-Year Program Plan; for commercial buildings it comprises just windows and solid state lighting activities. The impacts of the Building Technologies Program are summarized in Figure S.1 and Table S.1.a Figure S.1 and Table S.1 show that the energy savings expected to be created by market penetration of technologies and other outputs resulting from these activities have the potential of creating nearly 281,000 jobs and about $3.8 billion in earned income (2007$) by the year 2025. However, to achieve these gains would require intensive investment in new energy technology and new building practices during the 16-year period from 2009 to 2025, reducing the net impacts. These effects are incorporated in the full investment scenario shown in the lower half of Table S.1. Because the Building Technologies Program activities lead to investment that tends to be concentrated in capital-intensive, high-wage industries, there is a slight net negative impact on employment and positive impact on earnings from this group of investments. Many of the capital investments required to achieve these savings begin early in the 16-year period. The analysis of Building Technologies activities performed for this report shows that the impacts on investment and energy savings result from the interaction of four factors: 1) the size of the (usually growing) market at each point in time, 2) the penetration rate for the BT-developed technologies and practices, based on lifetime cost savings vis-à-vis conventional technology and the associated payback period for the investment, 3) increases in the efficiency per dollar of incremental investment, based in turn on the sales-volume based decline in the price of the technology and the higher durability of the Building Technologies Program technology compared to current technology, and 4) the market-transformation, crowding-out effects of one technology on market prospects of all of its potential competitors. This results in a “hill-like” pattern of activity-related efficiency investments shown in the upper left-hand panel of Figure S.1, and in Table S.1.
a In this analysis, we used activity information developed as described in the Multi-Year Program Plan 2008 that PNNL helped prepare in cooperation with EERE activity managers. Delivered energy is used to calculate potential savings resulting from reduced demand for electrical generating capacity and natural gas pipeline capacity. See Roop et al. (2005).
vi
Table S.1. Impact of the Building Technologies Program on the U.S. Economy
Incremental Investment Cost (Million 2007$)
Delivered Energy Saved (1012 Btu)
Potential Jobs Created
(Thousands)
Impact on National Earnings (Million
2007$) Impact of Energy Savings Alone 2009 - 3.54 0.64 10.93 2015 - 442.99 79.51 1,001.49 2025 - 2,364.79 281.13 3,805.54 Impact of Full Investment Scenario 2009 3,651.25 3.54 (5.02) (45.78) 2015 21,751.54 442.99 43.38 1,076.66 2025 14,669.37 2,364.79 257.53 3,686.92
Figure S.1. Impact of the Building Technologies Program on the U.S. Economy
Capital Cost
-
5,000.00
10,000.00
15,000.00
20,000.00
25,000.00
2009 2015 2025
Mill
ion
2007
$
Delivered Energy Saved
-
500.00
1,000.00
1,500.00
2,000.00
2,500.00
2009 2015 2025
Ener
gy S
aved
(10
12 B
tu)
Employment
(50.00)
-
50.00
100.00
150.00
200.00
250.00
300.00
2009 2015 2025Pote
ntia
l Job
s (1
,000
jobs
)
Savings Only
Full Investment
Impact on National Earnings
(500.00)-
500.001,000.001,500.00
2,000.002,500.003,000.00
3,500.004,000.00
2009 2015 2025
Earn
ings
(Mill
ion
2007
$) Savings Only
Full Investment

vii
Only when the energy benefits of cumulative efficiency investments have grown large, relative to the costs of current investment, would the full impacts on employment and income become visible. Thus, in the full investment scenario, as the energy technologies and practices associated with the Building Technologies activities penetrate the U.S. marketplace over the next 16 years, the required capital investments are significant and increasing over most of the period, reaching a peak of about $21.8 billion per year in 2015. These required investments divert national spending into capital-intensive sectors and initially reduce employment below what it otherwise would have been. However, the energy savings associated with these same investments (2.4 quadrillion Btus per year by the year 2025, worth about $45 billion) are true economic savings that provide new economic opportunities, generate ever-increasing numbers of jobs and higher income, and eventually become the dominant economic result of the BT activities. More than 80 percent of the positive job and earnings impacts come from only three activities: Integrated Lighting Shell, Commercial R&D, and Building Energy Codes. Just Integrated Lighting Shell alone accounts for 69% of the annual savings in 2025, 81% of the net savings, 73% of the net jobs, and 68% of the net earned income effects. These three activities are expected to produce large energy savings relative to the investments required. By the year 2025, these three activities will produce net annual savings to the U.S. economy (after investment costs) over $24.5 billion per year, $2.7 billion per year, and $1.7 billion per year, respectively, and 188,200, 22,400 and 16,600 net total jobs (after investment effects). Together, they account for 84 % of the annual savings in 2025, 96% of the net savings, 86% of the net jobs, and 87% of the net earned income effects. The impacts of most of the other BT activities are on a much smaller scale. The impacts of the Building Technologies Program in this report take into account the integrated energy savings associated with multiple activities that target the residential and commercial building stock. Thus, the energy impact and investment analysis within Integrated Lighting Shell for residential buildings takes into account the joint energy savings and interplay among activities for improved lighting (solid state and compact fluorescent light bulbs [CFLs]), windows, and envelope technologies described in the Multi-Year Program Plan that traditionally have been estimated one-at-a-time; similarly, in commercial buildings the energy impact and investment analysis takes into account the interplay of windows and solid state lighting activities.


ix
Acronyms AC air conditioning CFL compact fluorescent lamp DOE Department of Energy EERE Office of Energy Efficiency and Renewable Energy EIA Energy Information Administration FY fiscal year GDP Gross Domestic Product HPWH heat pump water heater HUD Housing and Urban Development HVAC Heating, Ventilating and Air Conditioning ImSET Impact of Sector Energy Technologies input-output model of U.S. economy NAICS North American Industry Classification System NAS National Academy of Sciences PNNL Pacific Northwest National Laboratory R&D Research and Development RIMS II Regional Input-Output Modeling System SIC Standard Industrial Classification


xi
Acknowledgments The authors would like to acknowledge Jerry Dion, Department of Energy Building Technologies Program, for support of the work discussed in this report. We would also like to acknowledge the assistance of several colleagues who reviewed and commented on the methodology and this report: A.K. Nicholls, S.C. McDonald, and J.M. Roop.


xiii
Contents Abstract ....................................................................................................................................................................... iii
Summary.......................................................................................................................................................................iv
Acronyms .....................................................................................................................................................................ix
Acknowledgments ........................................................................................................................................................xi
1.0 Methods........................................................................................................................................................1.1
1.1 Introduction ..................................................................................................................................................1.1
1.2 Calculation of Impact Using ImSET ............................................................................................................1.1
2.0 Analysis........................................................................................................................................................2.1
2.1 Building Technologies Program...................................................................................................................2.1
2.2 Results ..........................................................................................................................................................2.4
2.3 Summary of Impacts ..................................................................................................................................2.10
3.0 References ....................................................................................................................................................3.1
Attachment: Detailed Calculations on Building Technologies Activities .....................................................................1

xiv
Figures S.1 Impact of the Building Technologies Program on the U.S. Economy......................................... vi 1.1 Detailed Calculations of the ImSET Model ................................................................................ 1.2 1.2 Impact on National Employment of a Hypothetical Once-Only $100 Million Investment in Appliance
Efficiency ................................................................................................................................... 1.4
Tables S.1 Impact of the Building Technologies Program on the U.S. Economy ........................................ vi 2.1 Investment Cost and Savings from EERE Building Technologies Activities (Millions of 2007
Dollars) …………………………………………………………………………………………...2.3 2.2 Gross Effect of Energy Savings from Building Technologies Activities on Potential National
Employment................................................................................................................................ 2.6 2.3 Gross Effect of Energy Savings from Building Technologies Activities on Potential National Earned
Income ........................................................................................................................................ 2.7 2.4 Net Effect of the Full Investment Scenario on Potential National Employment ........................ 2.8 2.5 Net Effect of the Full Investment Scenario on Potential National Earned Income ............................................................................................................................ 2.9 A.1 Building Technologies Activity Investment Costs and Energy Savings, by Year...................... A.2 A.2 Building Technologies Activity Investment Costs by Sector ..................................................... A.6

1.1
1.0 Methods
1.1 Introduction
A primary goal of the Department of Energy (DOE) Office of Energy Efficiency and Renewable Energy (EERE) is to save energy. However, EERE activities also have economic impacts as energy investments, and the resultant savings in energy expenditures influences the national economy. As part of measuring the impact of government activities on improving the energy efficiency of the nation's building stock, the Building Technologies (BT) Program in EERE is interested in assessing the economic impacts of these activities, specifically the impact on national employment and earned income. As a consequence, BT funded Pacific Northwest National Laboratory (PNNL) to develop a simple-to-use method that could be used in-house to estimate economic impacts of individual activities. Three fundamental methods are available to estimate employment and earned income impacts for selected energy efficiency improvements in the U.S. economy: multipliers, input-output models, and macroeconomic simulation models. PNNL staff reviewed the BT programmatic needs and available methods and, based on this assessment and on realistic resource constraints, designed and developed a special-purpose version of the Impact Analysis for Planning (IMPLAN) national input-output model (Minnesota IMPLAN Group, Inc. 1997) specifically to estimate the employment and income effects of building energy technologies called ImBuild. Over time, evolving BT programmatic needs and updates to the U.S. national input-output table have resulted in significant changes and updates to this model, now known as the Impact of Sector Energy Technologies (ImSET) model. The version used in this study is called ImSET 2.1.0. Extensive documentation and a user’s guide are provided in Roop et al. (2005), which discusses the methods, structure of the ImSET model, and its testing and performance. For a detailed discussion of the methodology used in this study, refer to that report. Compared with simple economic multiplier approaches, such as the published multipliers from the Department of Commerce Regional Input-Output Modeling System (RIMS II) (Bureau of Economic Analysis 1997), ImSET allows for more complete and automated analysis of the economic impacts of energy efficiency investments in buildings. ImSET is also easier to use than extant macroeconomic simulation models. It does not include the ability to model certain dynamic features of markets for labor and other factors of production featured in these more complex models, but for most purposes these excluded features are not critical. Such impacts can be handled well by an input-output model and the analysis should be credible, as long as the assumption can be made that relative prices in the economy would not be substantially affected by energy efficiency investments. The expected scale of these investments is small enough in most cases that neither labor markets nor production cost relationships will seriously affect national prices as the investments are made. The exact timing of impacts on gross product, employment, and national earned income from energy efficiency investments is not well enough understood that much special insight can be gained from the additional dynamic sophistication of a macroeconomic simulation model. Thus, ImSET is a cost-effective compromise. 1.2 Calculation of Impact Using ImSET
As energy-efficient technologies penetrate the marketplace, BT activities will affect national employment and earned income. To analyze these effects, the ImSET model requires certain information

1.2
on the activities: the size of the incremental investment in the technology over time compared with the conventional technology it replaces, corresponding energy savings by fuel in physical and monetary terms (which may include additional use of some fuels when one type of fuel replaces another), and non-energy operations savings (if any) in comparison with the current technology (Figure 1.1). ImSET calculates changes in the use of energy, labor, and materials due to incremental investments and economic savings associated with BT-supported technologies and practices, as shown in Figure 1.1. As the figure illustrates, new investments in these technologies affect the level of employment and earned income in the economy by multiple pathways. First, the manufacture and installation of this equipment creates jobs and income in some industries, while diverting funds that otherwise would have been spent for other goods and services by businesses and households. At the same time, the investment in energy-efficient technologies or practices may make other investments in energy supply technologies (for example, power plants) unnecessary, directly and indirectly affecting jobs and income.
+Investment
- FinancingSource
Investment in Energy-Efficient Technology
Investment Path Savings Path
Procurement Installation Saved Investment
+Construction
-FinancingSource
-Construction
+Financing Source
ReducedFuelPurchases
ReducedNon-FuelPurchases
Fuel andNon-Fuel Savings
- EnergySectorPurchases
- Non-FuelServices Purchases
+ AllocatedSavings toSpending
W[I-BW] -1 *FinalDemand = Output *
Employment& IncomeIntensities
= Employment& Income
Figure 1.1. Detailed Calculations of the ImSET Model
The issue is discussed in more detail in Roop et al. (2005).a For this report, we assumed that financing for the energy-efficient investments is drawn proportionately from the rest of the U.S. economy.b
a For this report, we estimated electric power plant construction savings at about $590/kW of delivered electric energy, based on data in EIA (2002) and the equivalent value for natural gas, about $1.20/cubic foot/day capacity, based on EIA (1996) and EIA (1999). Similar values prevailed through early 2007. Though not incorporated in the current analysis, changes in estimated capital costs such as those that apparently occurred in 2007 and 2008 can be incorporated into future analyses using ImSET.

1.3
Figure 1.1 also shows that an investment in energy-efficient technology reduces the amount of energy needed. Reducing energy consumption reduces energy purchases (which in turn reduces employment and income in the energy-supplying sectors) and produces dollar savings that can be spent on any good or service, including energy (which creates employment and income). In addition, some energy efficiency investments may save the purchaser other costs such as maintenance services, and these savings also have impacts. All of these pathways in Figure 1.1 either affect the interindustry intermediate procurement (the matrix W[I-BW]-1 in Figure 1.1) or the final demand (the set of goods and services in the economy purchased for final consumption or new investment, as distinguished from those purchased merely as intermediate inputs to current production). In residential applications, the necessary model calculations are relatively straightforward, because residential savings are assumed to be entirely recycled into personal consumption and investment (that is, final demand). For commercial building applications, the process is more complicated because the interindustry relationships between specific sectors are affected, not just final demand. For savings in the commercial sector, the interindustry portion of the input-output table is automatically recomputed; then the model is run with the recomputed table. Because the energy and maintenance intensity of the commercial sector changes, the coefficients of the input-output structure are automatically recalculated at each time step. The financial impacts of energy and non-energy cost savings (for example, savings in building maintenance) are computed by the model. These savings are treated like “free” income, available to be saved or invested by the sector collecting the income. A brief hypothetical example from illustrates the concepts and functioning of the ImSET model. It is assumed that consumers spend a premium of $100 million on more-efficient residential heating and air-conditioning equipment in the year 2000, which each year thereafter saves them $15 million in electricity, $30 million in natural gas, and $5 million in building maintenance expenditures, for annual savings of $50 million. This $50 million annual savings yields a simple payback period of 2 years. The first two cases in Figure 1.2 show the employment effects of the $50 million savings alone. In the first case, the savings are confined to the residential sector. The second case shows how the impacts would change if these energy savings had instead been experienced in the commercial sector, where the savings are initially experienced as an increase in the profitability of those businesses saving the energy.
b It is assumed that personal (household) consumption represents 70% of spending; gross private fixed investment, 10%; federal defense spending, 9%; federal non-defense spending, 6%; and state and local government spending, about 5%. These percentages are close to the actual distribution of final demand among these sectors in the U.S. economy.

1.4
-0.20
0.00
0.20
0.40
0.60
0.80
1.00
1.20
1.40
1.60
2004 2005 2010 2015 2020 2025 2030
Years
Thou
sand
s of
Job
s
Residential Savings OnlyCommercial Savings OnlyResidential, $100 M InvestedResidential, $100 M No Opportunity Cost
Figure 1.2. Impact on National Employment of a Hypothetical Once-Only $100 Million Investment in Appliance Efficiency
These profits are assumed to be recycled in the economy as spending by workers, spending by the firms themselves, and by governments experiencing increases in tax collections. In the first case, the energy savings in the residential sector of $50 million have a net impact on the U.S. economy of about 170 jobs, or about 3.4 additional jobs per million dollars of direct energy savings. The impact is slightly larger than if the energy savings occur in the commercial sector, because the employment intensity of the spending mix of businesses, their workers, and government associated with commercial savings is only slightly different from the spending intensity of the household sector alone, which is associated with residential saving. Next, Figure 1.2 adds a third and fourth case to show the employment impacts of the $100 million investment itself. The third case shows the impact of the investment premium. In this case, even though investment in the technology itself generates employment, the short run net employment impact is quite small (-10 jobs) because the opportunity cost of the investment premium is the dollar amount the investment would have produced elsewhere in the U.S. economy, which on average is almost exactly as labor-intensive as the specific manufacturing sector (Sector 94, Heating and Air Conditioning Equipment) that makes the new technology.a Typically, efficiency activities are considered relatively labor-intensive, but this is not always the case. Heating and air conditioning manufacture, for example, is
aStrictly speaking, the labor intensity that counts is the employment, direct and indirect, that is created by each dollar of spending. Thus, it is theoretically possible for a capital-intensive industry to buy lots of labor-intensive inputs from other industries and the total effect to be labor intensive as a result.

1.5
quite capital-intensive. The strength and direction of the investment effect depends on the size of the investment premium and its combined domestic U.S. direct and indirect labor intensity, relative to that of other domestic spending (the opportunity cost of the investment). For the employment impact of the investment to be positive, the sectors supplying the new technology must on average create more domestic jobs per dollar of spending than does other domestic spending. An extreme form of this positive investment effect would occur, if the investment were financed internationally (that is, no domestic opportunity cost is included). This is the fourth case in Figure 1.2 (identified as Case 5 in the figure), which shows a short-run jobs impact of 1,430 jobs, with an employment impact as a result of the energy savings unchanged from the first case. The fourth case also corresponds with many regional analyses that have been made of energy conservation impacts, where the investment funds are assumed to come from somewhere else and have no opportunity cost in the region. The energy and non-energy savings from installation of efficient technology do not affect employment in the national economy until reinvested or spent. We assume that any increments to the economic value-added in each sector as a result of the investment (that is, the energy and non-energy savings) are allocated to compensation of labor, capital, and business taxes in the same proportions as all other value-addedb in that sector. The income of each sector then is assumed to be spent on investment and consumption of goods and services (final demand) in the same proportions as existing compensation of labor, capital, and government. That is, if a given sector captures 1% of all personal consumption expenditures in the economy and a 0.7% share of all business fixed investment, it will receive these same percentage shares of the efficiency-related increase in spending. Similarly, if labor compensation represents 70% of the baseline total value added in an industry, it will receive 70% of any energy savings in that industry. Finally, labor compensation, business profits and taxes are allocated to consumption, investment, and government spending, according to current proportions. ImSET accumulates the energy and non-energy savings in the residential buildings sector and the changes in economic value-added associated with energy and non-energy savings within the commercial buildings sector. The model then calculates spending impacts associated with these savings by proportionately increasing final demand across all sectors as noted previously, while at the same time reducing final demand in the sectors supplying the resources that are saved. This step accounts for the spending associated with the monetary savings and improvements in technological efficiency and for the associated shift from energy to non-energy spending. It also accounts for changes in the patterns of activity in the economy due to technological change caused by the BT activities (that is, less electricity is used per dollar of output in retailing because of more efficient lighting).c
bEconomic value-added is the value of output of the sector, less the cost of purchased materials and services. The sum of value-added in all sectors is Gross Domestic Product (GDP). c ImSET does not account for all of the long-term run impacts of the technological change. The change in energy-using capital in the commercial sector would alter the marginal value of all of the factors of production (including both labor and capital) and would induce a rearrangement of capital and labor that would ultimately result in an increase in output and in final demand. We show the multiplier effect created by spending of the energy and non-energy savings, but not the productivity effect of increased capital stock that would be created by the investment portion of the spending. Most economic models, including many dynamic simulation models, do not completely reflect the effect of capital accumulation and growth in capacity on final output and employment.

1.6
ImSET collects the estimates of the initial investments, energy and non-energy savings, and economic activity associated with spending of the savings (increases in final demand in personal consumption, business investment, and government spending), and provides overall estimates of the increase in national output for each economic sector using the adjusted input-output matrix. Finally, the model applies estimates of employment and earned income per dollar of economic output for each sector and calculates impacts on national employment and earned income.

2.1
2.0 Analysis 2.1 Building Technologies Program
This analysis encompasses the Building Technologies activities that were evaluated for Fiscal Year 2009. Table 2.1 shows the level of incremental residential and commercial investments and net energy savings in the selected years 2009, 2015, and 2025 for the buildings-related activities that were evaluated. Each activity is designated with a numerical activity code to ensure ease in numerical modeling and for tracing a given activity as it undergoes periodic name changes. It is important to note that the values in Table 2.1 represent levels of current investment and energy and non-energy savings in the year shown. It is current investment and current energy and non-energy savings that determine the impact on employment and earned income. Reported in this way, the values in Table 2.1 cannot be used to determine a rate of return on any particular investment because an investment in a given year provides a stream of savings over several years, and the energy savings experienced in any particular year are a function of the cumulative previous investment in energy efficiency. The investment and energy savings levels in a given year affect the level of GDP in that year, in turn affecting the level of national employment and earned income. Although the activities differ from each other in size and timing, for the most part the annual investment exceeds the annual savings early in the period, and savings tend to dominate later on. In a few cases, the early investments are expected to be so durable and to fall so much in cost that the later years show investment savings vis-à-vis conventional technology. The differences in investment reflect differences identified by the analysis as the size of the potential market opportunity or market niche for each activity, differences in the expected rate of market penetration into each niche, and differences concerning the incremental cost of the new technologies and practices penetrating the market, compared to the more conventional technologies or practices that they replace. Because investments occur over a period of years, the savings in any particular year do not necessarily correlate well with the investment in that year. Some technologies and practices are expected to generate relatively large energy savings and require relatively little incremental investment, while others require relatively more incremental investment or generate fewer savings. Generally, net energy expenditure is reduced, but reduced spending for one fuel (e.g., electricity for lighting) can result in slightly more expenditure for another (e.g., natural gas for heating) due to building system effects, as described in Appendix A. Savings are also sensitive to timing. For example, some activities like Building Energy Codes are expected to be still in the midst of their intensive incremental investment phase in the year 2025 (codes affect building investment patterns for a long time), while others like Solid State Lighting are expected to have come down in price to be competitive with the older technology and are enjoying pure savings by that date. Finally, the impacts of some activities interact so completely with others that it is virtually impossible to derive separate effects for each. A number of the technologies that would result from a subset of BT activities from various planning units would interact with each other in practice, either degrading or enhancing each others’ effects on energy savings. For example, improved commercial lighting affects the internal heat gains within commercial buildings, which in turn affects the energy savings of activities targeted on improving the thermal efficiency of building shells. Where those effects are most obvious, the analysis in this report has accounted for the joint energy savings impacts of the multiple activities. This report accounts for the net effects of those activities in a cross-cutting activity called Integrated Lighting

2.2
Shell. BT does not manage its interacting technologies in an Integrated Lighting Shell activity; the activity was a construct specifically created for this report to avoid double-counting the impacts on the U.S. macro economy of investment and energy savings of interacting technologies and practices. Integrated Lighting Shell for residential buildings comprises lighting (solid state and energy star CFLs), windows, and envelope technologies activities described in the Multi-Year Program Plan; for commercial buildings it is comprised of just windows and solid state lighting activities. For Building Technologies activity details, refer to the Multi-Year Program Plan 2008. Many of the technologies and practices resulting from BT activities have increasing market penetration and investment levels through the year 2025. Thus, the energy savings levels for many of the activities are expected to increase after 2025. By the end of the period shown in Table 2.1, total annual savings have substantially exceeded total annual investments, and are continuing to accelerate. Investments as a group have begun to flatten out by 2025. Some of the incremental adoption of the technologies and the energy investments due to the activities accelerates an adoption process that would have occurred later, anyway. In other cases, it can be argued that the technology or practice never would have been developed without the BT activity; therefore, the investment and savings would not have been overtaken in the marketplace. For details, see Elliott et al. (2004).

2.3
Table 2.1. Investment Cost and Savings from Building Technologies Activities (Millions of 2007 Dollars)
Fiscal Year
Code and Category 2009 2015 2025
124 Commercial Research & Development
Investment $0.0 $5,583.4 $896.6 Savings $0.0 $1,283.1 $3,559.6
136 TVMI: Energy Smart Schools and Hospitals Investment $91.5 $229.4 $16.9 Savings $8.1 $147.7 $186.5
137 TVMI: Commercial Lighting Initiative Investment $925.4 $3,652.4 $934.5 Savings $24.1 $342.5 $762.8
138 TVMI: Building Application Centers Investment $0.0 $29.0 $7.5 Savings $0.0 $6.2 $19.6
139 TVMI: Builders Challenge Investment $57.9 $219.5 $40.0 Savings $12.5 $227.1 $487.4
145 Analysis Tools and Design Investment $0.0 $475.8 $121.1 Savings $0.0 $124.1 $700.3
508 Building Energy Codes Investment $160.0 $826.5 $1,014.2 Savings $32.0 $796.7 $2,759.4
1151 Residential R&D: New Investment $0.0 $553.8 $3,509.7 Savings $0.0 $214.5 $1,907.7
1152 Residential R&D: Existing Investment $0.0 $66.9 $15.1 Savings $0.0 $17.7 $41.7
3808 Space Cond R&D: Thermotunneling Based Cooling Investment $0.0 $0.0 $139.4 Savings $0.0 $46.7 $805.2
3901 Space Cond R&D: Integrated Heat Pump Investment $0.0 $29.9 $1,059.4 Savings $0.0 $7.6 $1,046.7
3903 Space Cond R&D: Condensing Gas Water Heater Investment $0.0 $25.6 $109.4 Savings $0.0 $7.8 $422.5
4229 Energy Star: Home Performance Investment $113.6 $1,438.7 $38.6 Savings $10.0 $440.9 $868.4
0000 Integrated Lighting Shell Investment $2,302.9 $8,620.8 $6,767.0 Savings $2.0 $10,711.8 $31,258.4 Total Investment $3,651.3 $21,751.5 $14,669.4 Savings $88.8 $14,374.4 $44,826.3

2.4
2.2 Results
The investments and energy savings attributable to the penetration of BT Activities in the market-place will result in substantial macroeconomic effects. The following tables summarize these effects. Table 2.2 shows the impact of the energy savings alone on potential national employment on an activity-by activity basis. The employment effects are called potential here because this estimate is really of the change in demand for workers. Actual employment effects could include changes in wage rates and also would be affected by changes in labor supply conditions. Table 2.3 shows the comparable effects on national earned income. Before accounting for investment costs, the effects of savings alone in the year 2025 are an increase of about 281,000 potential jobs and $3.8 billion in national earned income. As was previously discussed, obtaining these energy savings benefits requires a substantial national investment in energy efficient technologies and practices. For the most part, this incremental national investment will be made in manufacturing sectors that are relatively capital intensive to produce new and better equipment. We assume the source of the investment capital will be the U.S. economy as a whole, which is less capital intensive on average than is manufacturing. Many of the energy efficiency investments will tend to reduce national employment while they are occurring, because they divert investment into capital-intensive sectors. Therefore, Table 2.4, which combines the employment effects of the required energy efficiency investments and the employment effects of the required savings, shows lower employment impacts than does Table 2.2, which includes only the effects of the energy and non-energy savings and ignores the investment effects. By 2025, Table 2.4 shows potential net employment increases of about 257,500 jobs, about 92 percent of the level in Table 2.2. Comparing the effects on national earned income in Tables 2.3 and 2.5 produces a similar but slightly more mixed picture. The net effect on earned income of the required investment, combined with the effect of resulting energy and non-energy savings, is a mixed effect because many of the jobs created in the capital-intensive manufacturing sectors as a result of Building Technologies Program-related investments are also high-wage jobs. This tends to compensate to some degree for the reduction in overall employment levels associated with the diversion of national spending into capital-intensive manufacturing activity. By 2025, Table 2.5 shows a potential net positive impact on national earned income of over $3.7 billion, about 3.1 percent lower than the level in Table 2.3. The impacts on investment and energy savings result from the interaction of four factors: 1) the size of the (usually growing) market at each point in time, which results in increasing investment and savings, 2) the increasing penetration rate for products resulting from EERE technologies and practices, based on lifetime cost savings vis-à-vis conventional technology and the associated payback period for the investment, which results in increasing investments and savings, 3) increases in the efficiency of a dollar of incremental investment, based in turn on the sales-volume-based rate of decline in the price of the technology and the higher durability of the EERE technology, which can considerably reduce investment even as the savings hold constant or increase, and 4) the market-transformation, crowding-out effects of one technology on market prospects of all of its potential competitors, which increases investment and savings due to the results of the EERE activity. Even in those cases where the EERE activity mainly accelerates market adoption of efficient technologies, it is usually assumed that the adoption is accelerated by ten years. Combined with the long lead times required to introduce commercial versions of

2.5
technologies to the marketplace and generally slow turnover rates of building stock, the result is that many technologies are still in the rapidly increasing market penetration phase of adoption in 2025. See Elliott et al. (2004) for methodological assumptions. The individual Building Technologies activities differ significantly from each other in scale, timing, and impact. Taking investment effects into account, more than 80 percent of the positive job and earnings impacts come from only three activities: Integrated Lighting Shell, Commercial R&D and Building Energy Codes. Just Integrated Lighting Shell alone accounts for 69% of the annual savings in 2025, 81% of the net savings, 73% of the net jobs, and 68% of the net earned income effects. Together, they account for 84 % of the annual savings in 2025, 96% of the net savings, 86% of the net jobs, and 87% of the net earned income effects. These activities are expected to result in products that will produce large energy savings relative to the investments required. The combined net annual savings attributable to these three activities are projected at $29 billion, even after investment costs in 2025 are subtracted. The savings alone from the results of these activities generate an estimated 241,600 potential jobs (227,200 after investment effects). The initial effect of the required investment is a short-run reduction in jobs and income in the economy, but the net effect is small. By the year 2025, the effects of energy savings already more than compensate for the effects of investment. Many Products resulting from the BT activities will have achieved only part of their ultimate market penetration at the end of the period. However, the overall positive net impact on employment (258,000 jobs) and earned income ($3.7 billion) in the year 2025 still is a significant boost to the economy, an effect that would continue to grow after 2025 as savings increase and investments are completed.

2.6
Table 2.2. Gross Effect of Energy Savings from Building Technologies Activities on Potential National Employment
Effect on Total National Employment (Thousands of
Jobs) Code Descriptor 2009 2015 2025
124 124,Commercial Research & Development 0.0 8.8 24.3 136 136,TVMI: Energy Smart Schools and Hospitals 0.1 0.9 1.1 137 137,TVMI: Commercial Lighting Initiative 0.2 3.0 7.0 138 138,TVMI: Building Application Centers 0.0 0.0 0.1 139 139,TVMI: Builders Challenge 0.1 1.4 2.9 145 145,Analysis Tools and Design 0.0 0.9 4.7 508 508,Building Energy Codes 0.2 5.2 17.1
1151 1151,Residential R&D: New 0.0 1.3 11.5 1152 1152,Residential R&D: Existing 0.0 0.1 0.2 3808 3808,Space Cond R&D: Thermotunneling Based Cooling 0.0 0.3 5.6 3901 3901,Space Cond R&D: Integrated Heat Pump 0.0 0.0 0.4 3903 3903,Space Cond R&D: Condensing Gas Water Heater 0.0 0.0 1.2 4229 4229,Energy Star: Home Performance 0.1 2.5 4.8 0000 0000,Integrated Lighting Shell 0.0 55.0 200.3
Total 0.6 79.5 281.1
2.7
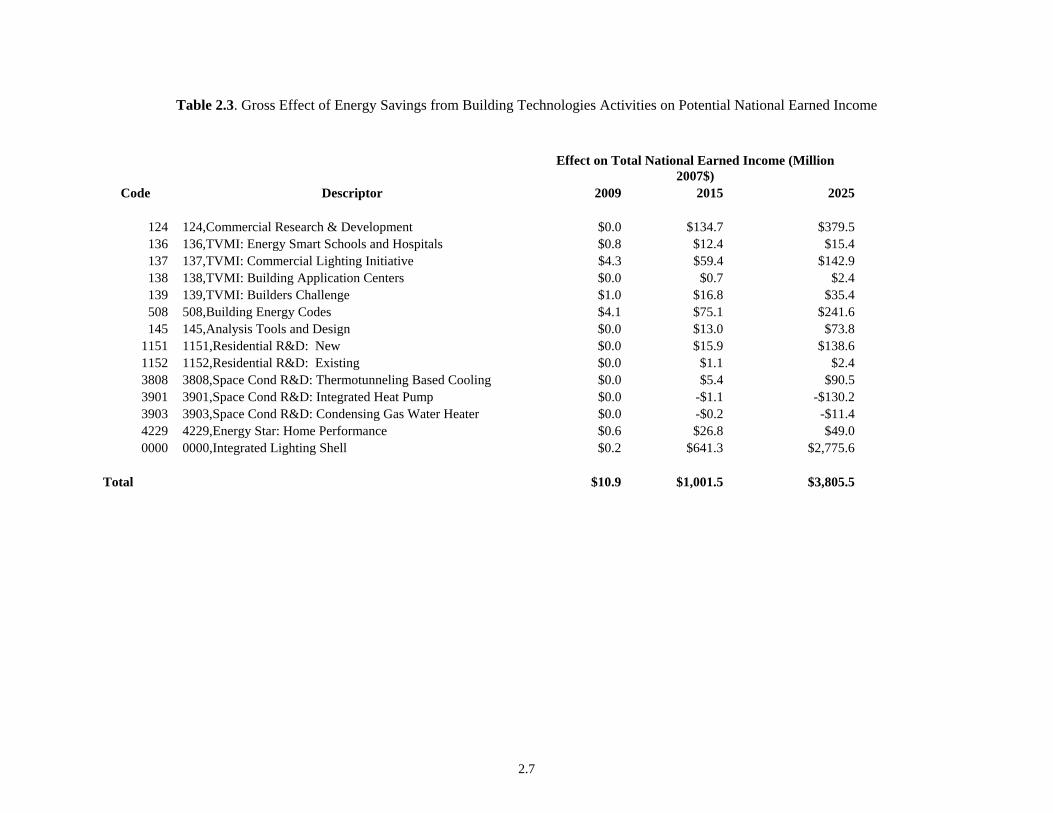
Table 2.3. Gross Effect of Energy Savings from Building Technologies Activities on Potential National Earned Income
Effect on Total National Earned Income (Million 2007$)
Code Descriptor 2009 2015 2025
124 124,Commercial Research & Development $0.0 $134.7 $379.5 136 136,TVMI: Energy Smart Schools and Hospitals $0.8 $12.4 $15.4 137 137,TVMI: Commercial Lighting Initiative $4.3 $59.4 $142.9 138 138,TVMI: Building Application Centers $0.0 $0.7 $2.4 139 139,TVMI: Builders Challenge $1.0 $16.8 $35.4 508 508,Building Energy Codes $4.1 $75.1 $241.6 145 145,Analysis Tools and Design $0.0 $13.0 $73.8
1151 1151,Residential R&D: New $0.0 $15.9 $138.6 1152 1152,Residential R&D: Existing $0.0 $1.1 $2.4 3808 3808,Space Cond R&D: Thermotunneling Based Cooling $0.0 $5.4 $90.5 3901 3901,Space Cond R&D: Integrated Heat Pump $0.0 -$1.1 -$130.2 3903 3903,Space Cond R&D: Condensing Gas Water Heater $0.0 -$0.2 -$11.4 4229 4229,Energy Star: Home Performance $0.6 $26.8 $49.0 0000 0000,Integrated Lighting Shell $0.2 $641.3 $2,775.6
Total $10.9 $1,001.5 $3,805.5
2.8
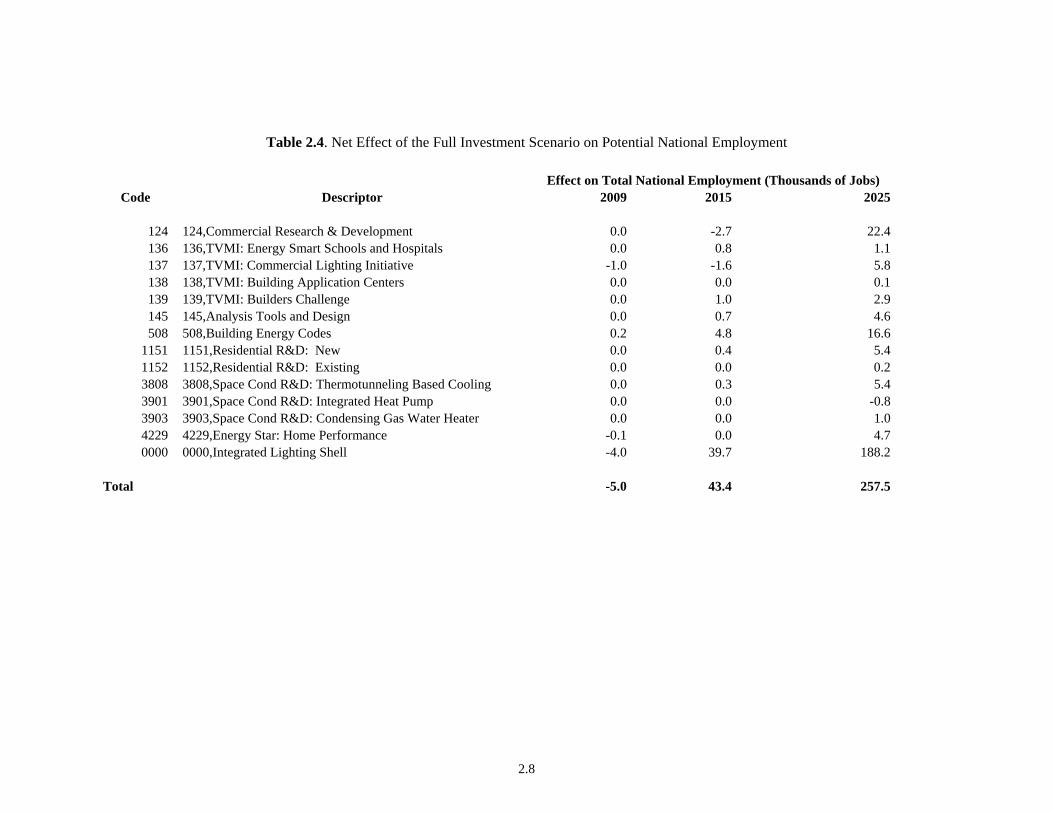
Table 2.4. Net Effect of the Full Investment Scenario on Potential National Employment
Effect on Total National Employment (Thousands of Jobs) Code Descriptor 2009 2015 2025
124 124,Commercial Research & Development 0.0 -2.7 22.4 136 136,TVMI: Energy Smart Schools and Hospitals 0.0 0.8 1.1 137 137,TVMI: Commercial Lighting Initiative -1.0 -1.6 5.8 138 138,TVMI: Building Application Centers 0.0 0.0 0.1 139 139,TVMI: Builders Challenge 0.0 1.0 2.9 145 145,Analysis Tools and Design 0.0 0.7 4.6 508 508,Building Energy Codes 0.2 4.8 16.6
1151 1151,Residential R&D: New 0.0 0.4 5.4 1152 1152,Residential R&D: Existing 0.0 0.0 0.2 3808 3808,Space Cond R&D: Thermotunneling Based Cooling 0.0 0.3 5.4 3901 3901,Space Cond R&D: Integrated Heat Pump 0.0 0.0 -0.8 3903 3903,Space Cond R&D: Condensing Gas Water Heater 0.0 0.0 1.0 4229 4229,Energy Star: Home Performance -0.1 0.0 4.7 0000 0000,Integrated Lighting Shell -4.0 39.7 188.2
Total -5.0 43.4 257.5

2.9
Table 2.5. Net Effect of the Full Investment Scenario on Potential National Earned Income
Effect on Total National Earned Income (Million 2007$)
Code Earnings (Millions $2007) 2009 2015 2025
124 124,Commercial Research & Development $0.0 $395.4 $421.5 136 136,TVMI: Energy Smart Schools and Hospitals $6.2 $26.0 $16.4 137 137,TVMI: Commercial Lighting Initiative $25.9 $144.3 $164.7 138 138,TVMI: Building Application Centers $0.0 $2.5 $2.9 139 139,TVMI: Builders Challenge $0.7 $15.9 $35.3 145 145,Analysis Tools and Design $0.0 $39.2 $105.1 508 508,Building Energy Codes $11.7 $114.8 $290.3
1151 1151,Residential R&D: New $0.0 $13.5 $123.1 1152 1152,Residential R&D: Existing $0.0 $0.8 $2.3 3808 3808,Space Cond R&D: Thermotunneling Based Cooling $0.0 $5.4 $97.6 3901 3901,Space Cond R&D: Integrated Heat Pump $0.0 -$0.6 -$112.5 3903 3903,Space Cond R&D: Condensing Gas Water Heater $0.0 -$0.9 -$14.5 4229 4229,Energy Star: Home Performance $0.1 $20.6 $48.9 0000 0000,Integrated Lighting Shell -$90.4 $299.8 $2,506.0
Total -$45.8 $1,076.7 $3,686.9

2.10
2.3 Summary of Impacts
The improvements in energy efficiency attributable to EERE’s Building Technologies Program require a significant annual capital expense of just under $3.7 billion to over $21.8 billion per year to achieve, as shown in Table 2.1. Initially, this annual investment is larger than the annual savings. However, because the stock of energy efficient equipment and practices continues to grow, the annual savings eventually outstrip the investment. By 2025 the energy savings alone, as shown in Table 2.1, are almost $49 billion per year, a significant national benefit. This does not count other obvious benefits, such as operational savings due to improved durability and efficiency of equipment, improved environmental quality from reduced burning of fossil fuels, and improved livability and increased value of structures. The impacts presented in Tables 2.2 through 2.5 illustrate the growing importance of energy efficiency through time to the U.S. economy as a result of these savings. By the year 2015, the net positive impacts are about 43,400 jobs and $1.1 billion in earnings, but by 2025 the impacts grow to around 281,000 jobs and over $3.8 billion, between three and six times larger.

3.1
3.0 References Building Technologies Multi-Year Program Plan, 2008, Energy Efficiency and Renewable Energy, U.S. Department of Energy, Washington, D.C. Accessed on the Internet on May 27, 2008 at http://www.eere.energy.gov/buildings/about/mypp.html. Bureau of Economic Analysis. 1997. Regional Multipliers: A User Handbook for the Regional Input-Output Modeling System (RIMS II). Third Edition. Washington D.C.: U.S. Department of Commerce. Elliott, D.B., D.M. Anderson, D.B. Belzer, K.A. Cort, J.A. Dirks, and D.J. Hostick. 2004. Methodological Framework for Analysis of Buildings-Related Programs: GPRA Metrics Effort. PNNL-14697. Pacific Northwest National Laboratory, Richland, Washington. Energy Information Administration (EIA). 2002. Assumptions to the Annual Energy Outlook 2002. DOE/EIA-0554(2002). Energy Information Administration, U.S. Department of Energy, Washington, D.C. Energy Information Administration (EIA). 1996. Natural Gas 1996: Issues and Trends. DOE/EIA-0560(96). Energy Information Administration, U.S. Department of Energy, Washington, D.C. Energy Information Administration (EIA). 1999. Natural Gas 1998: Issues and Trends. DOE/EIA-0560(98). Energy Information Administration, U.S. Department of Energy, Washington, D.C. Minnesota IMPLAN Group, Inc. 1997. IMPLAN Professional: Social Accounting and Impact Analysis Software. Minnesota IMPLAN Group, Inc., Stillwater, Minnesota. Roop, J. M., M. J. Scott, and R. W. Schultz. 2005. ImSET: Impact of Sector Energy Technologies. PNNL- 15273. Pacific Northwest National Laboratory, Richland, WA.

Attachment: Detailed Calculations on Building Technologies Activities

A.1
Attachment: Detailed Calculations on Building Technologies Activities
Table Notes Table A.1: This table shows the effects of individual BT activities (identified by their codes and titles) on national incremental investment in energy-efficient technology or practices in individual years. Current investment spending is reported each year because current investment spending affects current employment and earned income. Also shown for each year and activity are the effects of the accumulated previous investments on current expenditures for oil, natural gas, and electricity. (Impacts on non-energy expenditures for items such as maintenance services generally have not been estimated and are not shown.) Current spending affects current employment and earned income. In most cases, the investment is expected to reduce net fuel expenditure, but sometimes consumption of one fuel will be altered by the change in consumption of another, resulting in an increased expenditure for that fuel. Thus, for example, for Activity Code 137, TVMI: Commercial Lighting Initiative, Table A.1 shows the nation spending $ 1,045.8 million less for electricity for the commercial sector, but spending slightly more ($252.5 million) for commercial natural gas in the year 2025 than it otherwise would have. This happens because adopting more efficient electric equipment results in less unintentional heating of conditioned space in the winter from lighting, requiring that slightly more natural gas be burned. Similarly, Activity 0000, Integrated Lighting Shell, shows significant electricity savings in commercial and residential buildings for cooling, but some additional oil and natural gas is required in northern locations to provide heating during the winter because of the lower requirement for lighting. Table A.2: Purchases from different industrial sectors of the economy are associated with different inter-industry sales of goods and services and different requirements for labor (e.g., an increase in purchases of plastic-framed efficient windows will not have an identical impact to increased purchases of more efficient refrigerators; because the production processes and materials used are different). Therefore, to estimate the impact of a given investment, the investment must be allocated to the sectors from which the investing business or household buys equipment and services. This table shows how the incremental investment premium associated with each BT activity is assumed to be distributed among industrial sectors. The assumed allocation in each case was made in consultation with the PNNL researchers, based on activity information provided by DOE Technology Development Managers (TDMs) as well as the characteristics of the technologies that are expected to be adopted as a result of the activity. For example, Activity 137, TVMI: Commercial Lighting Initiative, is expected to result in incremental investments, divided one-half each to the two manufacturing sectors that will produce the equipment: Electric Lamp Bulb and Part Manufacturing and Lighting Fixture Manufacturing. Because no incremental installation cost or retail markup is expected, the entire premium results from the fact that these units are expected to be more expensive to manufacture than those with the conventional technology.

A.2
Table A.1. Building Technologies Investment Costs and Energy Expenditures, by Year
(Million $2007)
Fiscal Year Code and Category 2009 2015 2025
124 Commercial Research & Development
Investment $0.0 $5,583.4 $896.6 Expenditures on Oil, Residential $0.0 -$15.6 -$29.5 Expenditures on Oil, Commercial $0.0 -$2.3 -$5.1 Expenditures on Natural Gas, Residential $0.0 -$101.8 -$278.6 Expenditures on Natural Gas, Commercial $0.0 -$31.8 -$101.2 Expenditures on Electricity, Residential $0.0 -$384.2 -$1,003.2 Expenditures on Electricity, Commercial $0.0 -$747.5 -$2,142.0
Change in Energy Expenditures $0.0 -$1,283.1 -$3,559.6
136 TVMI: Energy Smart Schools and Hospitals Investment $91.5 $229.4 $16.9
Expenditures on Oil, Residential $0.0 $0.0 $0.0 Expenditures on Oil, Commercial -$0.1 -$2.4 -$3.1 Expenditures on Natural Gas, Residential $0.0 $0.0 $0.0 Expenditures on Natural Gas, Commercial -$1.1 -$23.3 -$34.0 Expenditures on Electricity, Residential $0.0 $0.0 $0.0 Expenditures on Electricity, Commercial -$6.9 -$122.1 -$149.5
Change in Energy Expenditures -$8.1 -$147.7 -$186.5
137 TVMI: Commercial Lighting Initiative Investment $925.4 $3,652.4 $934.5
Expenditures on Oil, Residential $0.0 $0.0 $0.0 Expenditures on Oil, Commercial $0.9 $12.5 $30.5 Expenditures on Natural Gas, Residential $0.0 $0.0 $0.0 Expenditures on Natural Gas, Commercial $6.8 $96.9 $252.5 Expenditures on Electricity, Residential $0.0 $0.0 $0.0 Expenditures on Electricity, Commercial -$31.8 -$451.9 -$1,045.8
Change in Energy Expenditures -$24.1 -$342.5 -$762.8
138 TVMI: Building Application Centers Investment $0.0 $29.0 $7.5
Expenditures on Oil, Residential $0.0 $0.0 $0.0 Expenditures on Oil, Commercial $0.0 $0.0 $0.1 Expenditures on Natural Gas, Residential $0.0 $0.0 $0.0 Expenditures on Natural Gas, Commercial $0.0 $0.1 $0.4 Expenditures on Electricity, Residential $0.0 $0.0 $0.0 Expenditures on Electricity, Commercial $0.0 -$6.3 -$20.0
Change in Energy Expenditures $0.0 -$6.2 -$19.6
139 TVMI: Builders Challenge Investment $57.9 $219.5 $40.0
Expenditures on Oil, Residential -$0.1 -$2.3 -$5.0

A.3
Fiscal Year Code and Category 2009 2015 2025
Expenditures on Oil, Commercial $0.0 $0.0 $0.0 Expenditures on Natural Gas, Residential -$4.2 -$75.1 -$168.6 Expenditures on Natural Gas, Commercial $0.0 $0.0 $0.0 Expenditures on Electricity, Residential -$8.2 -$149.7 -$313.9 Expenditures on Electricity, Commercial $0.0 $0.0 $0.0
Change in Energy Expenditures -$12.5 -$227.1 -$487.4
145 Analysis Tools and Design Investment $0.0 $475.8 $121.1
Expenditures on Oil, Residential $0.0 -$0.1 -$1.0 Expenditures on Oil, Commercial $0.0 -$0.3 -$1.5 Expenditures on Natural Gas, Residential $0.0 -$5.9 -$46.8 Expenditures on Natural Gas, Commercial $0.0 -$4.3 -$23.6 Expenditures on Electricity, Residential $0.0 -$20.8 -$137.2 Expenditures on Electricity, Commercial $0.0 -$92.6 -$490.2
Change in Energy Expenditures $0.0 -$124.1 -$700.3
508 Building Energy Codes Investment $160.0 $826.5 $1,014.2
Expenditures on Oil, Residential -$1.6 -$42.5 -$151.9 Expenditures on Oil, Commercial $0.0 $0.0 $0.0 Expenditures on Natural Gas, Residential -$4.5 -$173.1 -$653.3 Expenditures on Natural Gas, Commercial $3.8 $49.1 $93.9 Expenditures on Electricity, Residential -$7.3 -$104.1 -$324.2 Expenditures on Electricity, Commercial -$22.4 -$526.1 -$1,723.9
Change in Energy Expenditures -$32.0 -$796.7 -$2,759.4
1151 Residential R&D: New Investment $0.0 $553.8 $3,509.7
Expenditures on Oil, Residential $0.0 -$2.2 -$19.3 Expenditures on Oil, Commercial $0.0 $0.0 $0.0 Expenditures on Natural Gas, Residential $0.0 -$70.7 -$660.9 Expenditures on Natural Gas, Commercial $0.0 $0.0 $0.0 Expenditures on Electricity, Residential $0.0 -$141.6 -$1,227.5 Expenditures on Electricity, Commercial $0.0 $0.0 $0.0 Change in Energy Expenditures $0.0 -$214.5 -$1,907.7
1152 Residential R&D: Existing Investment $0.0 $66.9 $15.1
Expenditures on Oil, Residential $0.0 -$0.7 -$1.4 Expenditures on Oil, Commercial $0.0 $0.0 $0.0 Expenditures on Natural Gas, Residential $0.0 -$7.0 -$17.6 Expenditures on Natural Gas, Commercial $0.0 $0.0 $0.0 Expenditures on Electricity, Residential $0.0 -$10.1 -$22.6 Expenditures on Electricity, Commercial $0.0 $0.0 $0.0 Change in Energy Expenditures $0.0 -$17.7 -$41.7
3808 Space Cond R&D: Thermotunneling Based Cooling
Investment $0.0 $0.0 $139.4

A.4
Fiscal Year Code and Category 2009 2015 2025
Expenditures on Oil, Residential $0.0 $0.0 -$2.0 Expenditures on Oil, Commercial $0.0 $0.0 $0.0 Expenditures on Natural Gas, Residential $0.0 $0.0 -$7.6 Expenditures on Natural Gas, Commercial $0.0 $0.0 -$24.4 Expenditures on Electricity, Residential $0.0 $0.0 -$22.4 Expenditures on Electricity, Commercial $0.0 -$46.7 -$748.7
Change in Energy Expenditures $0.0 -$46.7 -$805.2
3901 Space Cond R&D: Integrated Heat Pump Investment $0.0 $29.9 $1,059.4
Expenditures on Oil, Residential $0.0 -$0.3 -$39.4 Expenditures on Oil, Commercial $0.0 $0.0 $0.0 Expenditures on Natural Gas, Residential $0.0 -$10.4 -$1,356.7 Expenditures on Natural Gas, Commercial $0.0 $0.0 $0.0 Expenditures on Electricity, Residential $0.0 $3.1 $349.4 Expenditures on Electricity, Commercial $0.0 $0.0 $0.0
Change in Energy Expenditures $0.0 -$7.6 -$1,046.7
3903 Space Cond R&D: Condensing Gas Water Heater Investment $0.0 $25.6 $109.4
Expenditures on Oil, Residential $0.0 -$1.6 -$73.9 Expenditures on Oil, Commercial $0.0 $0.0 $0.0 Expenditures on Natural Gas, Residential $0.0 -$6.2 -$348.7 Expenditures on Natural Gas, Commercial $0.0 $0.0 $0.0 Expenditures on Electricity, Residential $0.0 $0.0 $0.0 Expenditures on Electricity, Commercial $0.0 $0.0 $0.0
Change in Energy Expenditures $0.0 -$7.8 -$422.5
4229 Energy Star: Home Performance Investment $113.6 $1,438.7 $38.6
Expenditures on Oil, Residential -$0.4 -$16.2 -$30.2 Expenditures on Oil, Commercial $0.0 $0.0 $0.0 Expenditures on Natural Gas, Residential -$3.9 -$173.7 -$368.3 Expenditures on Natural Gas, Commercial $0.0 $0.0 $0.0 Expenditures on Electricity, Residential -$5.6 -$251.0 -$470.0 Expenditures on Electricity, Commercial $0.0 $0.0 $0.0
Change in Energy Expenditures -$10.0 -$440.9 -$868.4
0000 Integrated Lighting Shell Investment $2,302.9 $8,620.8 $6,767.0
Expenditures on Oil, Residential -$0.1 -$644.5 -$909.1 Expenditures on Oil, Commercial $0.1 $44.9 $124.0 Expenditures on Natural Gas, Residential -$1.1 -$5,266.1 -$8,545.2 Expenditures on Natural Gas, Commercial $0.6 $321.4 $876.5 Expenditures on Electricity, Residential -$1.1 -$4,863.5 -$15,264.6 Expenditures on Electricity, Commercial -$0.3 -$304.0 -$7,539.8
Change in Energy Expenditures -$2.0 -$10,711.8 -$31,258.4 Total

A.5
Fiscal Year Code and Category 2009 2015 2025
Investment $3,651.3 $21,751.5 $14,669.4 Expenditures on Oil, Residential -$2.3 -$725.9 -$1,262.7 Expenditures on Oil, Commercial $0.9 $52.5 $144.9 Expenditures on Natural Gas, Residential -$13.7 -$5,889.9 -$12,452.3 Expenditures on Natural Gas, Commercial $10.1 $408.1 $1,040.0 Expenditures on Electricity, Residential -$22.2 -$5,921.9 -$18,436.2 Expenditures on Electricity, Commercial -$61.4 -$2,297.3 -$13,860.1
Change in Energy Expenditures -$88.8 -$14,374.4 -$44,826.3

A.6
Table A.2. Allocation of Building Technologies Activity Investment Costs by Sector
RunNum Sector Code Sector Cap Cost
124 124,Commercial Research & Development
1 20 Commercial Building Construction 10.00% 1 90 Commercial Service Machinery Mfg. 15.00% 1 94 AC, Ref., Heat Pumps & Forced Air 15.00% 1 108 Electronic Components Mfg. 50.00% 1 116 Electric Lamp Bulb And Part Mfg. 5.00% 1 117 Lighting Fixture Manufacturing 5.00%
136 136,TVMI: Energy Smart Schools and Hospitals 2 20 Commercial Building Construction 32.50% 2 22 Other New Construction 11.40% 2 62 Iron And Steel Mills 5.40% 2 67 Nonferrous Metals Mfg. 0.30% 2 74 Fabricated Metal Mfg. 0.30% 2 80 Other Fabricated Metal Mfg. 5.10% 2 89 Misc. Industrial Machinery Mfg. 11.50% 2 90 Commercial Service Machinery Mfg. 0.30% 2 94 AC, Ref., Heat Pumps & Forced Air 10.00% 2 97 Turbines and Related Mfg. 0.20% 2 99 Power Transmission Equipment Mfg. 0.30% 2 106 Computer Products Mfg. 4.40% 2 107 Communications Eq. Mfg. 3.00% 2 109 Instruments Manufacturing 0.30% 2 110 Automatic Environmental Controls 0.30% 2 111 Ind. Process Variable Instruments 0.30% 2 112 Fluid Meters & Counting Devices 1.30% 2 142 Misc. Manufacturing 5.50% 2 143 Wholesale Trade 3.80% 2 153 Retail Trade 3.80%
RunNum Sector Code Sector Cap Cost
137 137,TVMI: Commercial Lighting Initiative
3 116 Electric Lamp Bulb And Part Mfg. 50.00% 3 117 Lighting Fixture Manufacturing 50.00%
138 138,TVMI: Building Application Centers 4 20 Commercial Building Construction 32.50% 4 22 Other New Construction 11.40% 4 62 Iron And Steel Mills 5.40% 4 67 Nonferrous Metals Mfg. 0.30% 4 74 Fabricated Metal Mfg. 0.30% 4 80 Other Fabricated Metal Mfg. 5.10% 4 89 Misc. Industrial Machinery Mfg. 11.50% 4 90 Commercial Service Machinery Mfg. 0.30% 4 94 AC, Ref., Heat Pumps & Forced Air 10.00% 4 97 Turbines and Related Mfg. 0.20% 4 99 Power Transmission Equipment Mfg. 0.30% 4 106 Computer Products Mfg. 4.40% 4 107 Communications Eq. Mfg. 3.00% 4 109 Instruments Manufacturing 0.30% 4 110 Automatic Environmental Controls 0.30% 4 111 Ind. Process Variable Instruments 0.30% 4 112 Fluid Meters & Counting Devices 1.30% 4 142 Misc. Manufacturing 5.50% 4 143 Wholesale Trade 3.80% 4 153 Retail Trade 3.80%
139 139,TVMI: Builders Challenge 5 15 New Single-Family Const. 2.00% 5 16 New Multifamily Const. 2.00%

A.7
RunNum Sector Code Sector Cap Cost
5 17 New Residential Remodeling Const. 1.00% 5 50 Plastics & Related Prod. Mfg. 5.00% 5 55 Glass and Glass Products Mfg. 5.00% 5 56 Cement Manufacturing 5.00% 5 59 Gypsum Product Manufacturing 5.00% 5 61 Mineral Wool Manufacturing 5.00% 5 76 Metal Window & Door Mfg. 5.00% 5 94 AC, Ref., Heat Pumps & Forced Air 10.00% 5 108 Electronic Components Mfg. 10.00% 5 116 Electric Lamp Bulb And Part Mfg. 10.00% 5 117 Lighting Fixture Manufacturing 10.00% 5 118 Household Eq. Mfg. 5.00% 5 119 Household Cooking Appliance Mfg. 5.00% 5 120 HH Refrigerator & Freezer Mfg. 5.00% 5 121 Household Laundry Equipment Mfg. 5.00% 5 122 Other Major HH Appliance Mfg. 5.00%
145 145,Analysis Tools and Design 6 15 New Single-Family Const. 10.00% 6 20 Commercial Building Construction 10.00% 6 94 AC, Ref., Heat Pumps & Forced Air 30.00% 6 116 Electric Lamp Bulb And Part Mfg. 10.00% 6 117 Lighting Fixture Manufacturing 10.00% 6 118 Household Eq. Mfg. 5.00% 6 119 Household Cooking Appliance Mfg. 6.00% 6 120 HH Refrigerator & Freezer Mfg. 6.00% 6 121 Household Laundry Equipment Mfg. 6.00% 6 122 Other Major HH Appliance Mfg. 7.00%
508 508,Building Energy Codes 7 15 New Single-Family Const. 5.00% 7 16 New Multifamily Const. 5.00% 7 17 New Residential Remodeling Const. 5.00%
RunNum Sector Code Sector Cap Cost
7 20 Commercial Building Construction 15.00% 7 55 Glass and Glass Products Mfg. 20.00% 7 91 Air Purification Eq. Mfg. 7.50% 7 94 AC, Ref., Heat Pumps & Forced Air 22.50% 7 108 Electronic Components Mfg. 10.00% 7 116 Electric Lamp Bulb And Part Mfg. 5.00% 7 117 Lighting Fixture Manufacturing 5.00%
1151 1151,Residential R&D: New 8 15 New Single-Family Const. 2.00% 8 16 New Multifamily Const. 2.00% 8 17 New Residential Remodeling Const. 1.00% 8 50 Plastics & Related Prod. Mfg. 5.00% 8 55 Glass and Glass Products Mfg. 5.00% 8 56 Cement Manufacturing 5.00% 8 59 Gypsum Product Manufacturing 5.00% 8 61 Mineral Wool Manufacturing 5.00% 8 76 Metal Window & Door Mfg. 5.00% 8 94 AC, Ref., Heat Pumps & Forced Air 10.00% 8 108 Electronic Components Mfg. 10.00% 8 116 Electric Lamp Bulb And Part Mfg. 10.00% 8 117 Lighting Fixture Manufacturing 10.00% 8 118 Household Eq. Mfg. 5.00% 8 119 Household Cooking Appliance Mfg. 5.00% 8 120 HH Refrigerator & Freezer Mfg. 5.00% 8 121 Household Laundry Equipment Mfg. 5.00% 8 122 Other Major HH Appliance Mfg. 5.00%
1152 1152,Residential R&D: Existing 9 14 Water/Sewer, Other Systems 9 15 New Single-Family Const. 2.00% 9 16 New Multifamily Const. 2.00% 9 17 New Residential Remodeling Const. 1.00%

A.8
RunNum Sector Code Sector Cap Cost
9 50 Plastics & Related Prod. Mfg. 5.00% 9 55 Glass and Glass Products Mfg. 5.00% 9 56 Cement Manufacturing 5.00% 9 59 Gypsum Product Manufacturing 5.00% 9 61 Mineral Wool Manufacturing 5.00% 9 76 Metal Window & Door Mfg. 5.00% 9 94 AC, Ref., Heat Pumps & Forced Air 10.00% 9 108 Electronic Components Mfg. 10.00% 9 116 Electric Lamp Bulb And Part Mfg. 10.00% 9 117 Lighting Fixture Manufacturing 10.00% 9 118 Household Eq. Mfg. 5.00% 9 119 Household Cooking Appliance Mfg. 5.00% 9 120 HH Refrigerator & Freezer Mfg. 5.00% 9 121 Household Laundry Equipment Mfg. 5.00% 9 122 Other Major HH Appliance Mfg. 5.00%
3808 3808,Space Cond R&D: Thermotunneling Based Cooling 10 94 AC, Ref., Heat Pumps & Forced Air 75.00% 10 108 Electronic Components Mfg. 25.00%
3901 3901,Space Cond R&D: Integrated Heat Pump
11 94 AC, Ref., Heat Pumps & Forced Air 50.00% 11 122 Other Major HH Appliance Mfg. 50.00%
3903 3903,Space Cond R&D: Condensing Gas Water Heater
12 122 Other Major HH Appliance Mfg. 100.00%
4229 4229,Energy Star: Home Performance 13 15 New Single-Family Const. 2.00% 13 16 New Multifamily Const. 2.00% 13 17 New Residential Remodeling Const. 1.00% 13 50 Plastics & Related Prod. Mfg. 5.00% 13 55 Glass and Glass Products Mfg. 5.00%
RunNum Sector Code Sector Cap Cost
13 56 Cement Manufacturing 5.00% 13 59 Gypsum Product Manufacturing 5.00% 13 61 Mineral Wool Manufacturing 5.00% 13 76 Metal Window & Door Mfg. 5.00% 13 94 AC, Ref., Heat Pumps & Forced Air 10.00% 13 108 Electronic Components Mfg. 10.00% 13 116 Electric Lamp Bulb And Part Mfg. 10.00% 13 117 Lighting Fixture Manufacturing 10.00% 13 118 Household Eq. Mfg. 5.00% 13 119 Household Cooking Appliance Mfg. 5.00% 13 120 HH Refrigerator & Freezer Mfg. 5.00% 13 121 Household Laundry Equipment Mfg. 5.00% 13 122 Other Major HH Appliance Mfg. 5.00%
0000 0000,Integrated Lighting Shell
14 33 Misc. Wood Product Mfg. 5.00% 14 50 Plastics & Related Prod. Mfg. 5.00% 14 55 Glass and Glass Products Mfg. 64.00% 14 59 Gypsum Product Manufacturing 5.00% 14 61 Mineral Wool Manufacturing 5.00% 14 76 Metal Window & Door Mfg. 10.00% 14 108 Electronic Components Mfg. 1.00% 14 116 Electric Lamp Bulb And Part Mfg. 2.50% 14 117 Lighting Fixture Manufacturing 2.50%

PNNL-17598
Distr.1
Distribution No. of Copies OFFSITE David Rodgers U.S. Department of Energy EERE-Building Technologies Program (EE-2J) 1000 Independence Avenue, S.W. Washington, DC 20585 Jerry Dion (5) U.S. Department of Energy EERE-Building Technologies Program (EE-2J) 1000 Independence Avenue, S.W. Washington, DC 20585 Jim Rannells U.S. Department of Energy EERE-Building Technologies Program (EE-2J) 1000 Independence Ave., S.W. Washington, DC 20585 Ed Pollock U.S. Department of Energy EERE-Building Technologies Program (EE-2J) 1000 Independence Ave., S.W. Washington, DC 20585 Tony Bouza U.S. Department of Energy EERE-Building Technologies Program (EE-2J) 1000 Independence Ave., S.W. Washington, DC 20585 Michael McCabe (3) U.S. Department of Energy EERE-Building Technologies Program (EE-2J) 1000 Independence Ave., S.W. Washington, DC 20585
Brian Card U.S. Department of Energy EERE-Office of Planning, Budget and Analysis (EE-3B) 1000 Independence Ave., S.W. Washington, DC 20585 Qonnie Laughlin U.S. Department of Energy EERE-Building Technologies Program (EE-2J) 1000 Independence Ave., S.W. Washington, DC 20585 Bryan Berringer U.S. Department of Energy EERE-Building Technologies Program (EE-2J) 1000 Independence Ave., S.W. Washington, DC 20585 Richard Orrison U.S. Department of Energy EERE-Building Technologies Program (EE-2J) 1000 Independence Ave., S.W. Washington, DC 20585 Jim Brodrick U.S. Department of Energy EERE-Building Technologies Program (EE-2J) 1000 Independence Ave., S.W. Washington, DC 20585 Sam Baldwin U.S. Department of Energy EERE-Board of Directors (EE-11) 1000 Independence Avenue, S.W. Washington, DC 20585 Darrell Beschen U.S. Department of Energy

PNNL-17598
Distr.2
EERE-Office of Planning, Budget and Analysis (EE-3B) 1000 Independence Avenue, S.W. Washington, DC 20585 David Boomsma U.S. Department of Energy EERE-Office of Planning, Budget and Analysis (EE-3B) 1000 Independence Avenue, S.W. Washington, DC 20585 Pat Booher U.S. Department of Energy EERE-Office of Planning, Budget and Analysis (EE-3B) 1000 Independence Avenue, S.W. Washington, DC 20585 Jeff Dowd U.S. Department of Energy EERE-Office of Planning, Budget and Analysis (EE-3B) 1000 Independence Avenue, S.W. Washington, DC 20585 Phil Patterson U.S. Department of Energy EERE-Office of Planning, Budget and Analysis (EE-3B) 1000 Independence Avenue, S.W. Washington, DC 20585 Peggy Podolak U.S. Department of Energy EERE-Office of Planning, Budget and Analysis (EE-3B) 1000 Independence Avenue, S.W. Washington, DC 20585 Linda Silverman U.S. Department of Energy EERE-Building Technologies Program (EE-2J) 1000 Independence Avenue, S.W. Washington, DC 20585 Randy Steer U.S. Department of Energy EERE-Office of Planning, Budget and Analysis (EE-3B)
1000 Independence Avenue, S.W. Washington, DC 20585 Brian Unruh U.S. Department of Energy EERE-Office of Planning, Budget and Analysis (EE-3B) 1000 Independence Avenue, S.W. Washington, DC 20585 Ed Barbour (3) Navigant Consulting 1801 K Street, NW Suite 500 Washington, D.C. 20006 M.D. Levine Ernest Orlando Lawrence Berkeley National Laboratory 1 Cyclotron Road, 90-R3027D Berkeley, CA 94720 T. Chan Ernest Orlando Lawrence Berkeley National Laboratory 1 Cyclotron Road, 90-R4000 Berkeley, CA 94720 L.L. Dale Ernest Orlando Lawrence Berkeley National Laboratory 1 Cyclotron Road, 90-R4000 Berkeley, CA 94720 W. Short National Renewable Energy Laboratory 617 Cole Boulevard, Mail Stop 2721 Golden, CO 80401-3393 Harvey Sachs American Council for an Energy-Efficient Economy

PNNL-17598
Distr.3
1001 Connecticut Avenue, N.W., Suite 801 Washington, DC 20036 Jeff Harris Alliance to Save Energy 120018th Street, N.W. Suite 900 Washington, DC 20036 John “Skip” Laitner Alliance to Save Energy 120018th Street, N.W. Suite 900 Washington, DC 20036 2 DOE Richland Operations Office D. L. Biancosino (2) K8-50
No. of Copies ONSITE 36 Pacific Northwest National Laboratory D. M. Anderson K6-05 R. Bartlett K6-05 D. B. Belzer K6-05 K. A. Cort K6-05 J. A. Dirks K6-10 D. B. Elliott Portland/1/OS D. J. Hostick K6-05 B. R. Kinzey BWO S. C. McDonald (10) BWO A. K. Nicholls BWO L. A. Stevenson Offsite/MA/OS J. M. Roop K6-05 T. J. Samuel K6-05 L. J. Sandahl Portland/1/OS E.G. Baker K2-20 M. J. Scott (5) K6-05 S. A. Shankle K9-01 R.W. Schultz K6-10 T. M. Weber K6-05 Information Release (2) P8-55