impact of the use of alternative fuels on clinker reactivity
TRANSCRIPT

Materiales de ConstruCCión
Vol. 67, Issue 326, April–June 2017, e120ISSN-L: 0465-2746
http://dx.doi.org/10.3989/mc.2017.08215
Impact of the use of alternative fuels on clinker reactivity
K. Serrano-González*, A. Reyes-Valdez, O. Chowaniec
Division of Engineering and Technology, Universidad de Monterrey, (Monterrey, Mexico)*[email protected]
Received 18 September 2015 Accepted 20 September 2016
Available on line 22 March 2017
ABSTRACT: The use of alternative fuels in the cement industry has increased its relevance in the past decades due to their ecological and economic benefits. In concert with the efforts to increase its use, several studies have focused on their potential impact with respect to clinker reactivity and how they could affect the expected physical and mechanical properties. This work studied the effects of five alternative fuels on the reactivity of eight industrial clinker samples, considering several analytical techniques. Differences were identified among the clinker samples after replacing the alternative fuels, mainly with simultaneous eliminations, as in samples S4, S5 and S8. The modifications were related to the polymorph, size and reactivity of tricalcium silicate and to the clinker profile during the hydration process, due to the SO3 consumption rate. These changes were expressed in the higher compressive strengths in comparison with the original reference clinker.
KEYWORDS: Portland cement; Clinker; Alternative fuels; Hydration; Emissions
Citation/Citar como: Serrano-González, K.; Reyes-Valdez, A.; Chowaniec, O. (2017) Impact of the use of alternative fuels on clinker reactivity. Mater. Construcc. 67 [326], e120. http://dx.doi.org/10.3989/mc.2017.08215.
RESUMEN: Impacto del uso de combustibles alternativos sobre la reactividad del clínker. El uso de combus-tibles alternativos en la industria cementera ha ido en incremento en las últimas décadas debido a su beneficio ecológico y económico. En línea con los esfuerzos enfocados en incrementar su uso, se han realizado distintos estudios enfocados en determinar su impacto potencial en la reactividad del clínker y en cómo pueden afectar sus propiedades físicas y mecánicas. Este trabajo estudia el efecto de cinco combustibles alternos sobre la reac-tividad de ocho muestras industriales de clínker, considerando diferentes técnicas analíticas. Se identificaron diferencias principalmente cuando se realizaron eliminaciones simultáneas de varios combustibles, como en las muestras S4, S5 y S8. Las modificaciones se basan en un cambio en el polimorfo, tamaño y reactividad del silicato tricálcico y del perfil de hidratación de los clínkeres, relacionado con el ritmo del consumo del SO3. Las modificaciones se reflejaron en un incremento en la resistencia a la compresión.
PALABRAS CLAVE: Cemento Portland; Clinker; combustibles alternativos; Hidratación; Emisiones
ORCID ID: K. Serrano-González (http://orcid.org/0000-0002-8668-2158); A. Reyes-Valdez (http://orcid.org/0000-0003-2952-0870); O. Chowaniec (http://orcid.org/0000-0001-7658-6552)
Copyright: © 2017 CSIC. This is an open-access article distributed under the terms of the Creative Commons Attribution License (CC BY) Spain 3.0.
1. INTRODUCTION
Cement production is a highly energy demandingprocess that emits large quantities of greenhouses gases (GHG) into the atmosphere. In 2010, the carbon dioxide worldwide emissions from cement
production were 1.352 GtCO2 from a total of 13.14 GtCO2 of the industrial CO2 emissions (which are 30% of total global GHG emissions) (1). According to the global initiatives in favor of environmental care, the cement industry has a special interest in reducing GHG emissions.

2 • K. Serrano et al.
Materiales de Construcción 67 (326), April–June 2017, e120. ISSN-L: 0465-2746. http://dx.doi.org/10.3989/mc.2017.08215
The use of alternative fuels has increased over the past decades. The relevance of these fuels as an eco-effective and responsible solution is represented by providing waste disposal for other industries and processes and thus being able to capture the ener-getic capacity of wastes as a substitute for fossil fuels that have an intense environmental impact.
However, even when the use of alternative fuels reduces the harmful environmental effects of the cement production process, this use also presents a potential impact on clinker reactivity, which could affect the physical and mechanical properties of clinkers.
The fossil fuel that is often used in Mexico due to its availability and cost is pet coke. In addition sev-eral wastes as potential alternative fuels have been identified, such as whole tires and tire chips, soil with hydrocarbons from petrochemical exploration and exploitation (referred to here as mass), carbon residues, oils and urban waste, designated as refuse-derived fuel (RDF). As a drawback, these materials are the wastes of other industries and have a heterogeneous compo-sition as well as a variable calorific content. To avoid a negative impact on the final cement formulation, the physical behavior and production cost of the cement, it is important to verify that the use of these alterna-tive fuels in the production of clinker does not cause significant alterations to its reactivity.
The scope of this work is to determine the changes that occur in the reactivity of industrial clinker sam-ples with the use of alternative fuels. This investiga-tion was performed through chemical, mineralogical, microscopic, calorimetric and physical evaluations to contribute to the understanding of the changes in clinker reactivity, by itself, and with the incorporation of clinker into cement and ready-mix admixtures.
2. ALTERNATIVE FUELS IN CEMENT INDUSTRY
Cement production involves the extraction and transformation of raw materials (mainly consisting of limestone, clay and iron ore) into clinker as a prod-uct of the sintering process at 1450 °C and grinding with gypsum as well as additions into cement powder that are commercially available in bags or bulk for the construction of different structures for social and eco-nomic development of communities and countries.
The alternative fuels considered in this study were incorporated at the precalciner, with the exception of carbon residue that was ground and added with pet coke in the precalciner and also in the main burner.
2.1. Benefits of the use of alternative fuels in cement industry
The use of alternative fuels in rotary kilns helps to reduce the CO2 emissions of the process by the replacement of fossil fuels preserving non-renewable
resources. Additionally, this use represents a safe alter-native to dispose of wastes that, in other conditions, could be disposed of in landfills or in waste incinera-tors, as stated by the Cembureau, European Cement Association (2). This use portrays a multidisciplinary approach to global concerns about the future of the national and international communities (3).
Using tires, rubber, paper waste, waste oils, sew-age sludge, plastics and spent solvents as alternative fuels in the cement industry maximizes the energy recovered from these materials, presents a guarantee of their safe disposal, produces an overall benefit considering the releases to air, water and land and prevents the depletion of non-renewable resources.
2.2. Effect of alternative fuels in the quality of the product
An inefficient control of alternative fuels could lead to an increase in the energy consumption of the kiln by operational changes that would be needed to assure a low level of free lime and this control could cause a series of adverse effects in clinker reactiv-ity. When the kiln is operated with excessive heat, volatiles would be released generating more possi-bilities of build-ups in the cooler parts of the kiln, usually in the preheater. The clinker obtained under these conditions has a lower porosity, with large alite crystals (C3S) that contribute to a dusty clinker rather than a nodular and more reactive clinker due to the inefficient cooling process. Additionally, this process could cause increases in the water demand and in the energy consumption during the grinding process due to the larger size of the crystals (4–6).
A change in the proportions of the main phases of the clinker and its crystalline structure would impact reactivity and solubility of clinker, and with it the rate of consumption of calcium sulfate, its balance in the system and thus its interaction as cement with chemical admixtures. As stated by Tuthill, when the aluminate reaction is accelerated the consumption of sulfates increases and the silicate hydration is affected in cements with lignin based admixtures to the point that a significant retardation effect is registered (7). Depending in the level of tricalcium aluminate (C3A) in the clinkers this could affect the sulfate balance during the reaction with the chemical admixtures (8). Low C3A clinkers are marginally under sulfated with or without admixtures. The optimum SO3 should be determined with and without the use of the admixtures to achieve the maximum performance in the field.
3. EXPERIMENTAL
3.1. Materials and preparation of samples
This investigation was focused on industrial scale clinker production to evaluate different operational factors and conditions that could modify industrial
Impact of the use of alternative fuels on clinker reactivity • 3
Materiales de Construcción 67 (326), April–June 2017, e120. ISSN-L: 0465-2746. http://dx.doi.org/10.3989/mc.2017.08215
clinker formation and reactivity rather than labora-tory-produced clinkers. Alternative fuel selection for each plant, in Mexico or any other country, depends on the available sources of generation and the dis-position of industrial wastes near each facility, and the public or private infrastructure and organization that promotes waste collection must be able to com-pile and classify all of these residues and make them available to several industrial sectors, as in this case cement producers.
A combination with five alternative fuels (bio-mass, mass, carbon residue, tires and RDF-refuse derived fuel) led to seven modified clinker sam-ples in addition to the reference: S1-with all the alternative fuels, S2-without Biomass, S3-without RDF, S4-without Biomass-Tires-Mass, S5-without Biomass-Mass-RDF, S6-without Biomass-Tires, S7-without Carbon Residue and S8-without Mass.
3.2. Analytical techniques
An 80 kg sample of clinker was collected directly from the output of the cooler of an industrial rotary kiln with each combination of alternative fuels. The clinkers were prepared by isolating the fraction between 3/8” and mesh 10, for the complete analysis. The characterization of the clinker includes chemi-cal analysis, morphology, mineralogy, mechanical evaluation and isothermal calorimetry. The clinker analyses and treatments were guided by the Quality Manual from CEMEX, based on national and inter-national standards (9–11).
Clinkers were analyzed using the following equipment: X-ray fluorescence spectroscopy, Philips Model PW 2400/00 for chemical analysis, X-ray dif-fraction powder spectroscopy, Philips PW 3040/00 for mineralogical analysis, optical microscopy, Leica Model DMRXA2 for microstructural analysis, and an isothermal calorimeter, TAM Air Thermostat for the determination of the hydration profile.
The cement hydration profile was determined by isothermal calorimetry over a 24 hour period, for the samples without admixtures, and over a 60 hour period, for the cement or ready-mix admixtures. The compressive strength of mortar cubes was deter-mined at 1, 3, 7 and 28 days with constant w/c ratio (0.485), as specified for ordinary Portland cements in ASTM-C-109 and NMX-C-414-ONNCCE, the American and Mexican cement standards.
4. ANALYSIS AND DISCUSSION OF RESULTS
4.1. Chemical and Mineralogical Analysis
Chemical composition, control modules and Bogue potential phases of the eight samples are presented in Table 1. These results show that the clinkers were chemically equivalent. Further com-parisons were focused on their mineralogy and
microstructure. This study was centered on the changes of the clinker crystals, their phase forma-tion and the impacts on the clinker reactivity as determined by isothermal calorimetry.
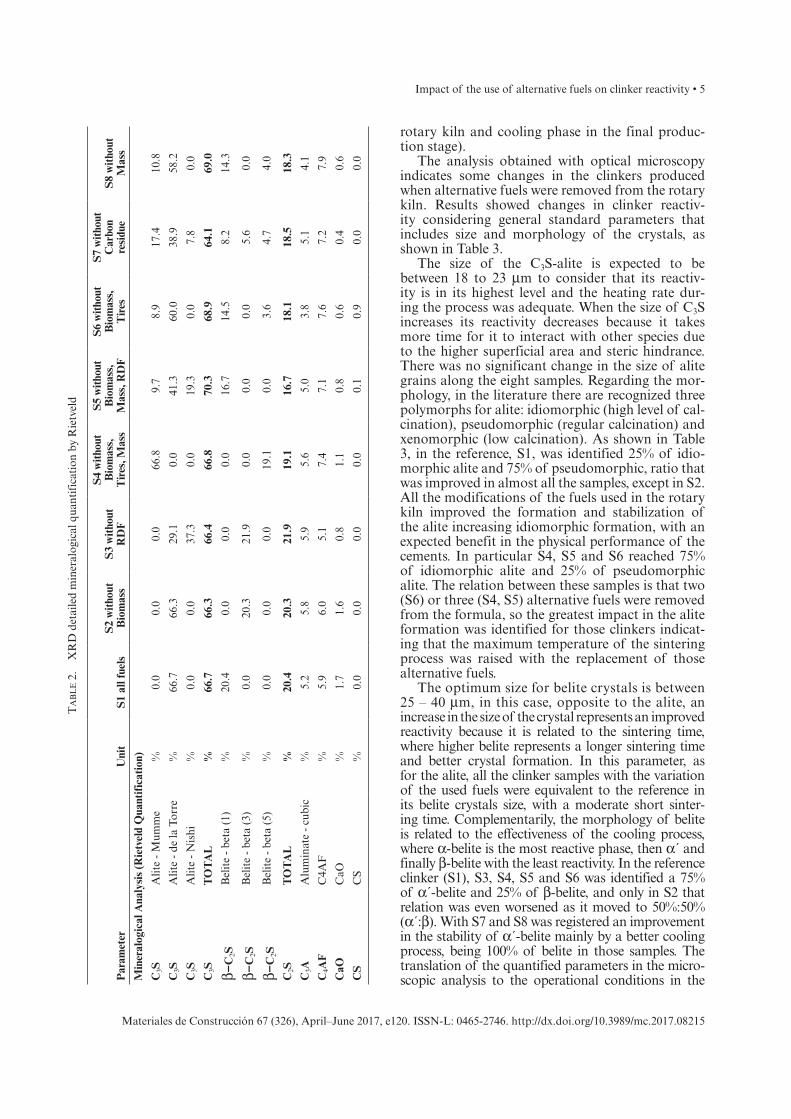
The mineralogical information of the sam-ples, shown in the Table 2, indicates that the gen-eral distribution between silicates and aluminates remained within the same range among all of the different clinker samples. However, considering the specific crystalline structure of the stabilized silicates, some differences were identified. Three alite structures were identified in the samples: de la Torre, Nishi and Mumme. Although all of these are monoclinical, with different lengths in their crystal-line structure and two of three angles of 90°, their differences correspond to the size of the crystal unit cell. The de la Torre volume is the largest (4325.214 Å3), the Nishi is second (1128.031 Å3) and finally, Mumme (720.174 Å3). A higher reactivity of this phase is expected in the smaller crystalline structure of Mumme. The crystalline system of these phases in combination with the size of the alite grains determines the phase reactivity during the hydra-tion process. In S2, in which biomass was elimi-nated, the alite remained without any change, as in the reference. In S3 or S8, in which RDF or mass was removed, some alite changed from de la Torre to Nishi or Mumme, decreasing the size of the alite and increasing its reactivity. The largest changes were registered in S7, in which the carbon residue was replaced, and the removal of 2 or 3 alternative fuels, as in S4, S5 and S6, in which the presence of Mumme alite was identified in combination with the other alite structures, decreasing the overall bal-ance for the volume of alite. Changes in the propor-tion of aluminates were also identified, from 5% of C3A in the reference to 3.8% and 4.1% in S6 and S8, respectively.
To obtain a more detailed mineralogical phase description, a silicate extraction of each clinker type was performed. These results indicated that ferroaluminate (C4AF) increased from 5.9% in S1 to 7.9% in S8. The C4AF content also increased in S4, S5, S6, S7 and S8 (samples that also presented a change in the crystalline formation of the alite). Both changes are expected to affect the hydration process (in its early and later ages), their sulfate demand and, as a consequence, their interaction with chemical admixtures.
4.2. Microstructural Analysis
Microscopy is an analytical technique that com-plements other procedures to determine the size, form and distribution of the crystals, information related with the thermal profile and physical con-ditions at which the raw materials were exposed during the complete production process (since dehy-dration in the preheater tower, sinterization in the

4 • K. Serrano et al.
Materiales de Construcción 67 (326), April–June 2017, e120. ISSN-L: 0465-2746. http://dx.doi.org/10.3989/mc.2017.08215
Ta
bl
e 1
. C
linke
r ch
emic
al c
ompo
siti
on (
XR
F)
Par
amet
erU
nit
S1
al
l fue
lsS
2 w
itho
ut
Bio
mas
sS
3 w
itho
ut
RD
F
S4
wit
hout
B
iom
ass,
Tir
es,
Mas
s
S5
wit
hout
B
iom
ass,
Mas
s,
RD
FS
6 w
itho
ut
Bio
mas
s, T
ires
S7
wit
hout
C
arbo
n re
sidu
eS
8
wit
hout
Mas
s
Che
mic
al A
naly
sis
SiO
2%
20.6
20.3
20.5
20.8
20.6
20.7
20.3
20.8
Al 2O
3%
5.2
5.3
5.2
5.1
5.1
5.2
5.0
5.1
Fe2O
3%
1.9
1.9
1.9
2.0
2.0
2.1
2.0
2.1
CaO
%64
.264
.264
.464
.764
.564
.564
.264
.6
MgO
%1.
71.
81.
61.
61.
61.
81.
61.
7
SO
3%
3.3
3.3
3.3
2.9
3.2
2.8
3.8
2.9
Na 2
O%
0.6
0.7
0.6
0.6
0.6
0.6
0.6
0.6
K2O
%0.
81.
00.
80.
80.
90.
80.
90.
8
TiO
2%
0.2
0.2
0.2
0.2
0.2
0.2
0.2
0.2
Fre
e L
ime
%0.
81.
30.
91.
11.
21.
11.
20.
9
Con
trol
Mod
ules
LS
F
98.8
100.
099
.398
.999
.298
.610
0.4
98.2
SR
2.
92.
82.
92.
92.
92.
82.
92.
9
AR
2.
72.
82.
82.
52.
52.
42.
52.
5
Bog
ue P
hase
s
C3S
%58
6059
6060
5960
59
C2S
%15
1314
1414
1413
15
C3A
%11
1111
1010
1010
10
C4A
F%
66
66
67
66
Impact of the use of alternative fuels on clinker reactivity • 5
Materiales de Construcción 67 (326), April–June 2017, e120. ISSN-L: 0465-2746. http://dx.doi.org/10.3989/mc.2017.08215
rotary kiln and cooling phase in the final produc-tion stage).
The analysis obtained with optical microscopy indicates some changes in the clinkers produced when alternative fuels were removed from the rotary kiln. Results showed changes in clinker reactiv-ity considering general standard parameters that includes size and morphology of the crystals, as shown in Table 3.
The size of the C3S-alite is expected to be between 18 to 23 μm to consider that its reactiv-ity is in its highest level and the heating rate dur-ing the process was adequate. When the size of C3S increases its reactivity decreases because it takes more time for it to interact with other species due to the higher superficial area and steric hindrance. There was no significant change in the size of alite grains along the eight samples. Regarding the mor-phology, in the literature there are recognized three polymorphs for alite: idiomorphic (high level of cal-cination), pseudomorphic (regular calcination) and xenomorphic (low calcination). As shown in Table 3, in the reference, S1, was identified 25% of idio-morphic alite and 75% of pseudomorphic, ratio that was improved in almost all the samples, except in S2. All the modifications of the fuels used in the rotary kiln improved the formation and stabilization of the alite increasing idiomorphic formation, with an expected benefit in the physical performance of the cements. In particular S4, S5 and S6 reached 75% of idiomorphic alite and 25% of pseudomorphic alite. The relation between these samples is that two (S6) or three (S4, S5) alternative fuels were removed from the formula, so the greatest impact in the alite formation was identified for those clinkers indicat-ing that the maximum temperature of the sintering process was raised with the replacement of those alternative fuels.
The optimum size for belite crystals is between 25 – 40 μm, in this case, opposite to the alite, an increase in the size of the crystal represents an improved reactivity because it is related to the sintering time, where higher belite represents a longer sintering time and better crystal formation. In this parameter, as for the alite, all the clinker samples with the variation of the used fuels were equivalent to the reference in its belite crystals size, with a moderate short sinter-ing time. Complementarily, the morphology of belite is related to the effectiveness of the cooling process, where a-belite is the most reactive phase, then a´ and finally b-belite with the least reactivity. In the reference clinker (S1), S3, S4, S5 and S6 was identified a 75% of a´-belite and 25% of b-belite, and only in S2 that relation was even worsened as it moved to 50%:50% (a´:b). With S7 and S8 was registered an improvement in the stability of a´-belite mainly by a better cooling process, being 100% of belite in those samples. The translation of the quantified parameters in the micro-scopic analysis to the operational conditions in the
Ta
bl
e 2
. X
RD
det
aile
d m
iner
alog
ical
qua
ntif
icat
ion
by R
ietv
eld
Par
amet
erU
nit
S1
all f
uels
S2
wit
hout
B
iom
ass
S3
wit
hout
R
DF
S4
with
out
Bio
mas
s,
Tir
es, M
ass
S5 w
ithou
t B
iom
ass,
M
ass,
RD
F
S6 w
ithou
t B
iom
ass,
T
ires
S7
with
out
Car
bon
resi
due
S8
wit
hout
M
ass
Min
eral
ogic
al A
naly
sis
(Rie
tvel
d Q
uant
ific
atio
n)
C3S
Alit
e -
Mum
me
%0.
00.
00.
066
.89.
78.
917
.410
.8
C3S
Alit
e -
de la
Tor
re%
66.7
66.3
29.1
0.0
41.3
60.0
38.9
58.2
C3S
Alit
e -
Nis
hi%
0.0
0.0
37.3
0.0
19.3
0.0
7.8
0.0
C3S
TO
TA
L%
66.7
66.3
66.4
66.8
70.3
68.9
64.1
69.0
b−C
2SB
elit
e -
beta
(1)
%20
.40.
00.
00.
016
.714
.58.
214
.3
b−C
2SB
elit
e -
beta
(3)
%0.
020
.321
.90.
00.
00.
05.
60.
0
b−C
2SB
elit
e -
beta
(5)
%0.
00.
00.
019
.10.
03.
64.
74.
0
C2S
TO
TA
L%
20.4
20.3
21.9
19.1
16.7
18.1
18.5
18.3
C3A
Alu
min
ate
- cu
bic
%5.
25.
85.
95.
65.
03.
85.
14.
1
C4A
FC
4AF
%5.
96.
05.
17.
47.
17.
67.
27.
9
CaO
CaO
%1.
71.
60.
81.
10.
80.
60.
40.
6
CS
CS
%0.
00.
00.
00.
00.
10.
90.
00.
0

6 • K. Serrano et al.
Materiales de Construcción 67 (326), April–June 2017, e120. ISSN-L: 0465-2746. http://dx.doi.org/10.3989/mc.2017.08215
Ta
bl
e 3
. Mic
rost
ruct
ural
det
aile
d in
form
atio
n of
clin
ker
sam
ples
Par
amet
erO
ptim
umU
nits
S1
al
l fue
ls
S2
w
itho
ut
Bio
mas
s
S3
w
itho
ut
RD
F
S4
wit
hout
B
iom
ass,
T
ires
, Mas
s
S5
wit
hout
B
iom
ass,
M
ass,
RD
F
S6
wit
hout
B
iom
ass,
T
ires
S7
wit
hout
C
arbo
n re
sidu
e
S8
w
itho
ut
Mas
s
Opt
ical
Mic
rosc
opy
Ana
lysi
s
Alit
e Si
ze (
AS)
18 -
24
μm22
.933
.125
.727
.729
.225
.629
.926
.0
Sco
re
3.
02.
63.
53.
33.
03.
63.
03.
5
Alit
e M
orph
olog
y (A
M)
Idio
mor
phic
%25
.025
.050
.075
.075
.075
.050
.050
.0
Pse
ufom
orph
ic%
75.0
75.0
50.0
25.0
25.0
25.0
50.0
50.0
Xen
omor
phic
%0.
00.
00.
00.
00.
00.
00.
00.
0
Sco
re
3.
03.
03.
33.
53.
53.
53.
33.
3
Bel
ite
Size
(B
S)25
- 4
0μm
14.4
15.5
15.4
14.8
15.4
17.3
15.0
17.9
Sco
re
1.5
1.7
1.7
1.6
1.7
2.0
1.6
2.2
Bel
ite
Mor
phol
ogy
(BM
)A
lfa
(a)
%0.
00.
00.
00.
00.
00.
00.
00.
0
Alf
a pr
ime
(a´)
%75
.050
.075
.075
.075
.075
.010
0.0
100.
0
Bet
a (b
)%
25.0
50.0
25.0
25.0
25.0
25.0
0.0
0.0
Sco
re
2.
82.
52.
82.
82.
82.
83.
03.
0
Bel
ite
Clo
iste
r
μm18
.423
6.3
202.
519
1.8
171.
321
2.0
203.
521
3.3
Fre
e L
ime
Clo
iste
r (a
mou
nt)
6.0
6.0
5.0
11.0
8.0
13.0
8.0
2.0
Fre
e L
ime
Clo
iste
r (s
ize)
μm
85.0
163.
314
9.0
152.
612
3.1
136.
611
8.1
200.
0
Alu
min
ate
Typ
e
C
ubic
(fi
ne
and
coar
se)
Cub
ic (
fine
an
d co
arse
)C
ubic
(fi
ne
and
coar
se)
Cub
ic (
fine
an
d co
arse
)C
ubic
(fi
ne
and
coar
se)
Cub
ic (
fine
an
d co
arse
)C
ubic
(fi
ne
and
coar
se)
Cub
ic (
fine
an
d co
arse
)
Fer
rite
Ref
lect
ivit
y
M
ediu
mM
ediu
mM
ediu
mM
ediu
mM
ediu
mM
ediu
mM
ediu
mM
ediu
m
Red
ucin
g C
ondi
tion
Yes
Yes
Yes
Yes
No
No
Yes
Yes
Per
icla
se
N
oN
oN
oN
oN
oN
oN
oN
o
TO
TA
L S
CO
RE
69.4
63.1
71.3
71.7
71.0
75.8
69.4
75.4
Impact of the use of alternative fuels on clinker reactivity • 7
Materiales de Construcción 67 (326), April–June 2017, e120. ISSN-L: 0465-2746. http://dx.doi.org/10.3989/mc.2017.08215
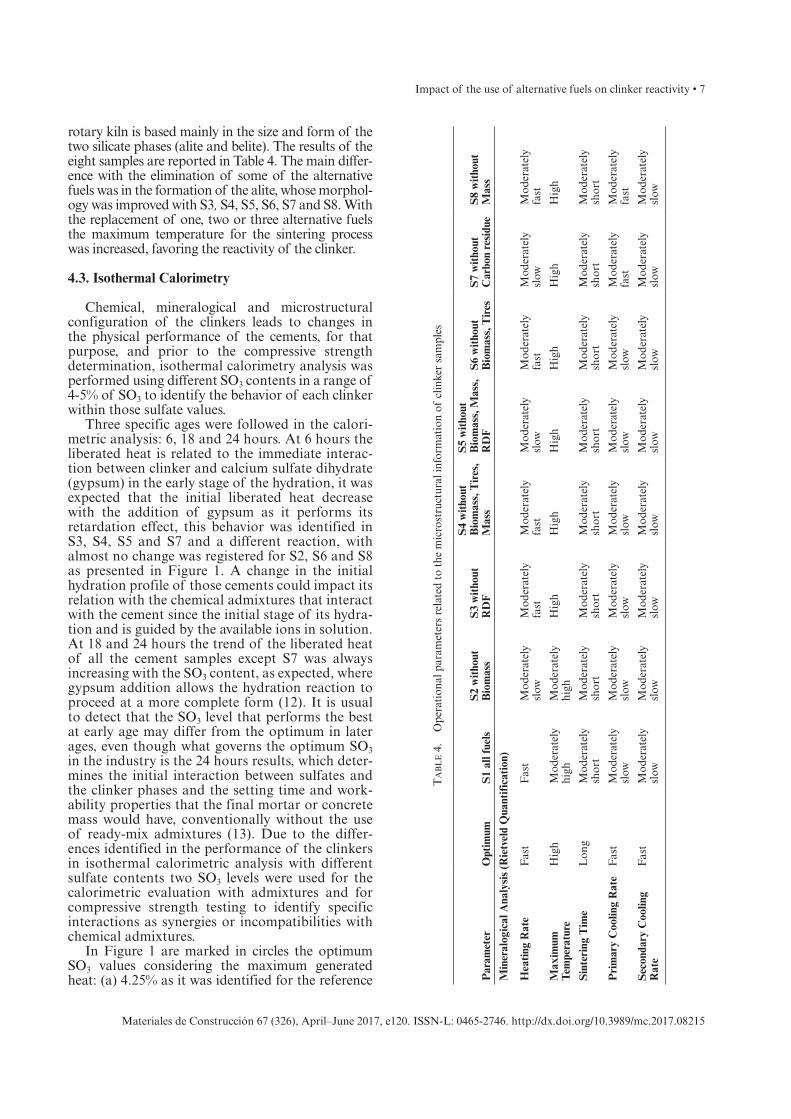
rotary kiln is based mainly in the size and form of the two silicate phases (alite and belite). The results of the eight samples are reported in Table 4. The main differ-ence with the elimination of some of the alternative fuels was in the formation of the alite, whose morphol-ogy was improved with S3, S4, S5, S6, S7 and S8. With the replacement of one, two or three alternative fuels the maximum temperature for the sintering process was increased, favoring the reactivity of the clinker.
4.3. Isothermal Calorimetry
Chemical, mineralogical and microstructural configuration of the clinkers leads to changes in the physical performance of the cements, for that purpose, and prior to the compressive strength determination, isothermal calorimetry analysis was performed using different SO3 contents in a range of 4-5% of SO3 to identify the behavior of each clinker within those sulfate values.
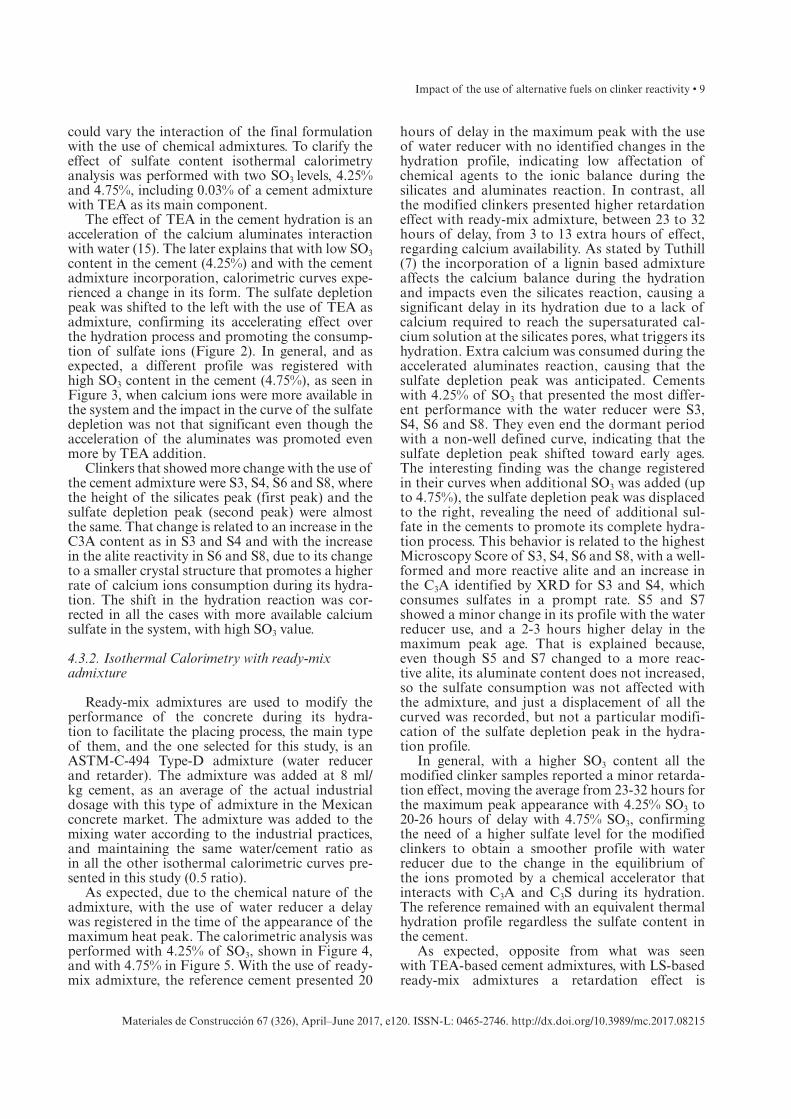
Three specific ages were followed in the calori-metric analysis: 6, 18 and 24 hours. At 6 hours the liberated heat is related to the immediate interac-tion between clinker and calcium sulfate dihydrate (gypsum) in the early stage of the hydration, it was expected that the initial liberated heat decrease with the addition of gypsum as it performs its retardation effect, this behavior was identified in S3, S4, S5 and S7 and a different reaction, with almost no change was registered for S2, S6 and S8 as presented in Figure 1. A change in the initial hydration profile of those cements could impact its relation with the chemical admixtures that interact with the cement since the initial stage of its hydra-tion and is guided by the available ions in solution. At 18 and 24 hours the trend of the liberated heat of all the cement samples except S7 was always increasing with the SO3 content, as expected, where gypsum addition allows the hydration reaction to proceed at a more complete form (12). It is usual to detect that the SO3 level that performs the best at early age may differ from the optimum in later ages, even though what governs the optimum SO3 in the industry is the 24 hours results, which deter-mines the initial interaction between sulfates and the clinker phases and the setting time and work-ability properties that the final mortar or concrete mass would have, conventionally without the use of ready-mix admixtures (13). Due to the differ-ences identified in the performance of the clinkers in isothermal calorimetric analysis with different sulfate contents two SO3 levels were used for the calorimetric evaluation with admixtures and for compressive strength testing to identify specific interactions as synergies or incompatibilities with chemical admixtures.
In Figure 1 are marked in circles the optimum SO3 values considering the maximum generated heat: (a) 4.25% as it was identified for the reference
Ta
bl
e 4
. O
pera
tion
al p
aram
eter
s re
late
d to
the
mic
rost
ruct
ural
info
rmat
ion
of c
linke
r sa
mpl
es
Par
amet
erO
ptim
umS
1 al
l fue
lsS
2 w
itho
ut
Bio
mas
sS
3 w
itho
ut
RD
F
S4
wit
hout
B
iom
ass,
Tir
es,
Mas
s
S5
wit
hout
B
iom
ass,
Mas
s,
RD
FS
6 w
itho
ut
Bio
mas
s, T
ires
S7
wit
hout
C
arbo
n re
sidu
eS
8 w
itho
ut
Mas
s
Min
eral
ogic
al A
naly
sis
(Rie
tvel
d Q
uant
ific
atio
n)
Hea
ting
Rat
eF
ast
Fas
tM
oder
atel
y sl
owM
oder
atel
y fa
stM
oder
atel
y fa
stM
oder
atel
y sl
owM
oder
atel
y fa
stM
oder
atel
y sl
owM
oder
atel
y fa
st
Max
imum
Te
mpe
ratu
reH
igh
Mod
erat
ely
high
Mod
erat
ely
high
Hig
hH
igh
Hig
hH
igh
Hig
hH
igh
Sin
teri
ng T
ime
Lon
gM
oder
atel
y sh
ort
Mod
erat
ely
shor
tM
oder
atel
y sh
ort
Mod
erat
ely
shor
tM
oder
atel
y sh
ort
Mod
erat
ely
shor
tM
oder
atel
y sh
ort
Mod
erat
ely
shor
t
Pri
mar
y C
oolin
g R
ate
Fas
tM
oder
atel
y sl
owM
oder
atel
y sl
owM
oder
atel
y sl
owM
oder
atel
y sl
owM
oder
atel
y sl
owM
oder
atel
y sl
owM
oder
atel
y fa
stM
oder
atel
y fa
st
Sec
onda
ry C
oolin
g R
ate
Fas
tM
oder
atel
y sl
owM
oder
atel
y sl
owM
oder
atel
y sl
owM
oder
atel
y sl
owM
oder
atel
y sl
owM
oder
atel
y sl
owM
oder
atel
y sl
owM
oder
atel
y sl
ow

8 • K. Serrano et al.
Materiales de Construcción 67 (326), April–June 2017, e120. ISSN-L: 0465-2746. http://dx.doi.org/10.3989/mc.2017.08215
(S1), S2, S6 , S7 and S8 and (b) 4.75% for S3 and S5. In particular, it is highlighted that S4 was not that sensitive to sulfate variation in the isothermal calo-rimetry test at 24 hours as shown in the graphic, it was not registered a significant change in the gener-ated heat with different sulfate levels.
4.3.1. Isothermal Calorimetry with cement admixture
In cement production some chemical admix-tures could be used during the grinding process to improve the hydration reaction of cement (14). The clinker composition and SO3 level of the cement
Figure 1. Isothermal Calorimetry at 23 °C of original clinker samples with different SO3 levels (circles indicates the selected SO3 as the optimum for each case).
2.50 3.50 4.50 5.50
SO3 (%)
2.50 3.50 4.50 5.50
SO3 (%)
2.50 3.50 4.50 5.50
SO3 (%)
2.50 3.50 4.50 5.50
SO3 (%)
2.50 3.50 4.50 5.50
SO3 (%)
2.50 3.50 4.50 5.50
SO3 (%)
2.50 3.50 4.50 5.50
SO3 (%)
2.50
100Sample 1 (with all the alternative fuels) Sample 2 (without Biomass)
Sample 4 (without Mass, Biomass, RDF)
Sample 6 (without Biomass, Tires)
Sample 8 (without Mass)
Sample 3 (without RDF)
Sample 5 (without Tires, Mass, RDF)
Sample 7 (without Carbon Residue)
Nor
mal
ized
Lib
erat
ed H
eat
(J/g
) at
6H
Nor
mal
ized
Lib
erat
ed H
eat
(J/g
) at
6H
Nor
mal
ized
Lib
erat
ed H
eat
(J/g
) at
6H
Nor
mal
ized
Lib
erat
ed H
eat
(J/g
) at
6H
Nor
mal
ized
Lib
erat
ed H
eat
(J/g
) at
6H
Nor
mal
ized
Lib
erat
ed H
eat
(J/g
) at
6H
Nor
mal
ized
Lib
erat
ed H
eat
(J/g
) at
6H
Nor
mal
ized
Lib
erat
ed H
eat
(J/g
) at
6H
at 1
8H a
nd 2
4Hat
18H
and
24H
at 1
8H a
nd 2
4Hat
18H
and
24H
at 1
8H a
nd 2
4Hat
18H
and
24H
at 1
8H a
nd 2
4Hat
18H
and
24H
Generated Heat @ 6H
Generated Heat @ 18H
Generated Heat @ 24H
Generated Heat @ 6HGenerated Heat @ 18HGenerated Heat @ 24H
Generated Heat @ 6HGenerated Heat @ 18HGenerated Heat @ 24H
Generated Heat @ 6HGenerated Heat @ 18HGenerated Heat @ 24H
Generated Heat @ 6HGenerated Heat @ 18HGenerated Heat @ 24H
Generated Heat @ 6HGenerated Heat @ 18HGenerated Heat @ 24H
Generated Heat @ 6HGenerated Heat @ 18HGenerated Heat @ 24H
Generated Heat @ 6HGenerated Heat @ 18HGenerated Heat @ 24H
90
80
70
60
50
40
30
20
10
0
100
90
80
70
60
50
40
30
20
10
0
100
90
80
70
60
50
40
30
20
10
0
100
90
80
70
60
50
40
30
20
10
0
100
90
80
70
60
50
40
30
20
10
0
100
90
80
70
60
50
40
30
20
10
0
100
90
80
70
60
50
40
30
20
10
0
100
90
80
70
60
50
40
30
20
10
0
300
280
260
240
220
200
180
160
140
120
100
300
280
260
240
220
200
180
160
140
120
100
300
280
260
240
220
200
180
160
140
120
100
300
280
260
240
220
200
180
160
140
120
100
300
280
260
240
220
200
180
160
140
120
100
300
280
260
240
220
200
180
160
140
120
100
300
280
260
240
220
200
180
160
140
120
100
300
280
260
240
220
200
180
160
140
120
1003.50 4.50 5.50
SO3 (%)
Impact of the use of alternative fuels on clinker reactivity • 9
Materiales de Construcción 67 (326), April–June 2017, e120. ISSN-L: 0465-2746. http://dx.doi.org/10.3989/mc.2017.08215
could vary the interaction of the final formulation with the use of chemical admixtures. To clarify the effect of sulfate content isothermal calorimetry analysis was performed with two SO3 levels, 4.25% and 4.75%, including 0.03% of a cement admixture with TEA as its main component.
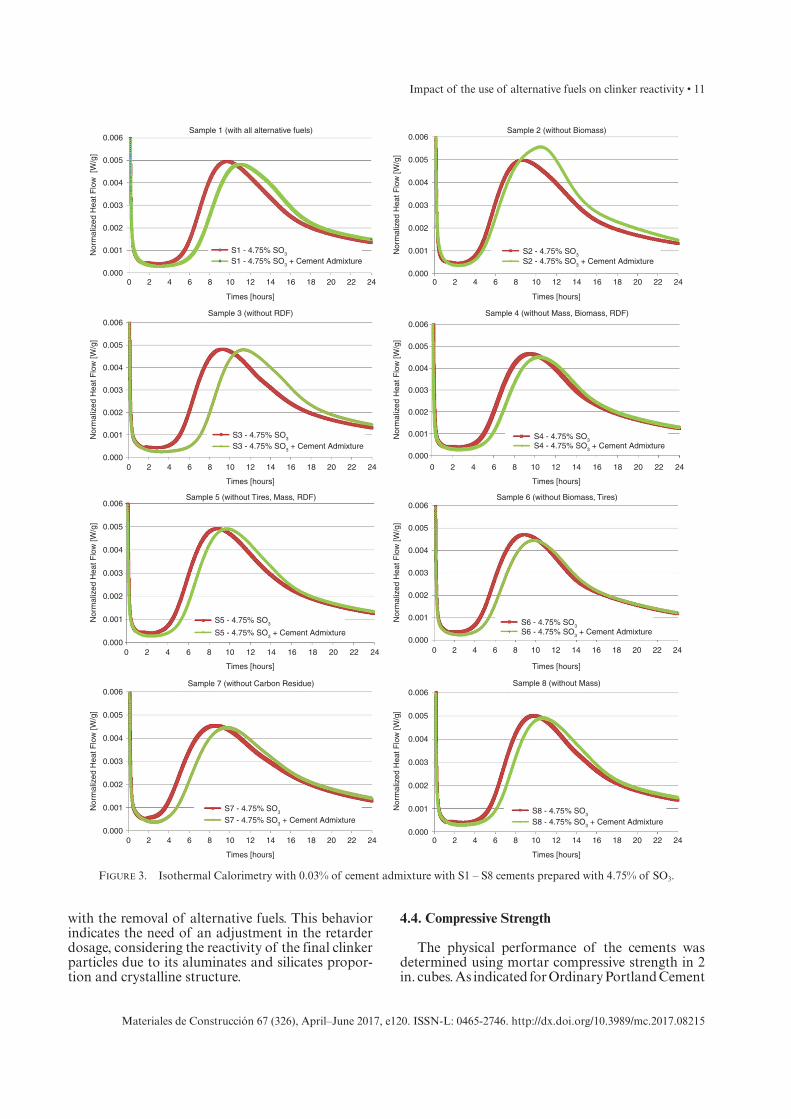
The effect of TEA in the cement hydration is an acceleration of the calcium aluminates interaction with water (15). The later explains that with low SO3 content in the cement (4.25%) and with the cement admixture incorporation, calorimetric curves expe-rienced a change in its form. The sulfate depletion peak was shifted to the left with the use of TEA as admixture, confirming its accelerating effect over the hydration process and promoting the consump-tion of sulfate ions (Figure 2). In general, and as expected, a different profile was registered with high SO3 content in the cement (4.75%), as seen in Figure 3, when calcium ions were more available in the system and the impact in the curve of the sulfate depletion was not that significant even though the acceleration of the aluminates was promoted even more by TEA addition.
Clinkers that showed more change with the use of the cement admixture were S3, S4, S6 and S8, where the height of the silicates peak (first peak) and the sulfate depletion peak (second peak) were almost the same. That change is related to an increase in the C3A content as in S3 and S4 and with the increase in the alite reactivity in S6 and S8, due to its change to a smaller crystal structure that promotes a higher rate of calcium ions consumption during its hydra-tion. The shift in the hydration reaction was cor-rected in all the cases with more available calcium sulfate in the system, with high SO3 value.
4.3.2. Isothermal Calorimetry with ready-mix admixture
Ready-mix admixtures are used to modify the performance of the concrete during its hydra-tion to facilitate the placing process, the main type of them, and the one selected for this study, is an ASTM-C-494 Type-D admixture (water reducer and retarder). The admixture was added at 8 ml/kg cement, as an average of the actual industrial dosage with this type of admixture in the Mexican concrete market. The admixture was added to the mixing water according to the industrial practices, and maintaining the same water/cement ratio as in all the other isothermal calorimetric curves pre-sented in this study (0.5 ratio).
As expected, due to the chemical nature of the admixture, with the use of water reducer a delay was registered in the time of the appearance of the maximum heat peak. The calorimetric analysis was performed with 4.25% of SO3, shown in Figure 4, and with 4.75% in Figure 5. With the use of ready-mix admixture, the reference cement presented 20
hours of delay in the maximum peak with the use of water reducer with no identified changes in the hydration profile, indicating low affectation of chemical agents to the ionic balance during the silicates and aluminates reaction. In contrast, all the modified clinkers presented higher retardation effect with ready-mix admixture, between 23 to 32 hours of delay, from 3 to 13 extra hours of effect, regarding calcium availability. As stated by Tuthill (7) the incorporation of a lignin based admixture affects the calcium balance during the hydration and impacts even the silicates reaction, causing a significant delay in its hydration due to a lack of calcium required to reach the supersaturated cal-cium solution at the silicates pores, what triggers its hydration. Extra calcium was consumed during the accelerated aluminates reaction, causing that the sulfate depletion peak was anticipated. Cements with 4.25% of SO3 that presented the most differ-ent performance with the water reducer were S3, S4, S6 and S8. They even end the dormant period with a non-well defined curve, indicating that the sulfate depletion peak shifted toward early ages. The interesting finding was the change registered in their curves when additional SO3 was added (up to 4.75%), the sulfate depletion peak was displaced to the right, revealing the need of additional sul-fate in the cements to promote its complete hydra-tion process. This behavior is related to the highest Microscopy Score of S3, S4, S6 and S8, with a well-formed and more reactive alite and an increase in the C3A identified by XRD for S3 and S4, which consumes sulfates in a prompt rate. S5 and S7 showed a minor change in its profile with the water reducer use, and a 2-3 hours higher delay in the maximum peak age. That is explained because, even though S5 and S7 changed to a more reac-tive alite, its aluminate content does not increased, so the sulfate consumption was not affected with the admixture, and just a displacement of all the curved was recorded, but not a particular modifi-cation of the sulfate depletion peak in the hydra-tion profile.
In general, with a higher SO3 content all the modified clinker samples reported a minor retarda-tion effect, moving the average from 23-32 hours for the maximum peak appearance with 4.25% SO3 to 20-26 hours of delay with 4.75% SO3, confirming the need of a higher sulfate level for the modified clinkers to obtain a smoother profile with water reducer due to the change in the equilibrium of the ions promoted by a chemical accelerator that interacts with C3A and C3S during its hydration. The reference remained with an equivalent thermal hydration profile regardless the sulfate content in the cement.
As expected, opposite from what was seen with TEA-based cement admixtures, with LS-based ready-mix admixtures a retardation effect is

10 • K. Serrano et al.
Materiales de Construcción 67 (326), April–June 2017, e120. ISSN-L: 0465-2746. http://dx.doi.org/10.3989/mc.2017.08215
promoted. The retardation effect is caused by a chemical reaction between lignosulfonate par-ticles and dry cement particles forming a physical coat over anhydrous particles that prevents further contact with water, and a variation in the sulfate
consumption due to the change in the calcium ions balance in the media, accelerating it by the alumi-nate reaction and finally affecting the silicate hydra-tion. Increased efficiency of the admixture could be related to the surface and reactivity of the particles
Figure 2. Isothermal Calorimetry with 0.03% of cement admixture with S1 – S8 cements prepared with 4.25% of SO3.
0.006
Nor
mal
ized
Hea
t Flo
w [W
/g]
Nor
mal
ized
Hea
t Flo
w [W
/g]
Nor
mal
ized
Hea
t Flo
w [W
/g]
Sample 1 (with all alternative fuels)
Sample 3 (without RDF) Sample 4 (without Mass, Biomass, RDF)
Sample 4 (without Biomass, Tires)Sample 5 (without Tires, Mass, RDF)
Sample 8 (without Mass)Sample 7 (without Carbon Residue)
0 2 4 6 8 10 12 14
Time [hours]
16 18 20 22 24
0 2 4 6 8 10 12 14 16 18 20 22 24
0 2 4 6 8 10 12 14
Time [hours]Time [hours]
16 18 20 22 24
Sample 2 (without Biomass)
0.005
S1 - 4.25% SO3
S1 - 4.25% SO3 + Cement Admixture
S3 - 4.25% SO3 + Cement Admixture
S2 - 4.25% SO3
S2 - 4.25% Cement Admixture
S3 - 4.25% SO3
S5 - 4.25% SO3 + Cement Admixture
S5 - 4.25% SO3
S7 - 4.25% SO3 + Cement AdmixtureS7 - 4.25% SO3
S4 - 4.25% SO3 + Cement AdmixtureS4 - 4.25% SO3
S6 - 4.25% SO3 + Cement AdmixtureS6 - 4.25% SO3
S8 - 4.25% SO3 + Cement AdmixtureS8 - 4.25% SO3
0.004
0.003
0.002
0.001
0.000
0.006
0.005
0.004
0.003
0.002
0.001
0.000
Nor
mal
ized
Hea
t Flo
w [W
/g]
Time [hours]
0 2 4 6 8 10 12 14 16 18 20 22 24
0.006
0.005
0.004
0.003
0.002
0.001
0.000
Nor
mal
ized
Hea
t Flo
w [W
/g]
Time [hours]
0 2 4 6 8 10 12 14 16 18 20 22 24
0.006
0.005
0.004
0.003
0.002
0.001
0.000
Nor
mal
ized
Hea
t Flo
w [W
/g]
Time [hours]
0 2 4 6 8 10 12 14 16 18 20 22 24
0.006
0.005
0.004
0.003
0.002
0.001
0.000
Nor
mal
ized
Hea
t Flo
w [W
/g]
Time [hours]
0 2 4 6 8 10 12 14 16 18 20 22 24
0.006
0.005
0.004
0.003
0.002
0.001
0.000
0.006
Nor
mal
ized
Hea
t Flo
w [W
/g] 0.005
0.004
0.003
0.002
0.001
0.000
0 2 4 6 8 10 12 14
Time [hours]
16 18 20 22 24
0.006
0.005
0.004
0.003
0.002
0.001
0.000
Impact of the use of alternative fuels on clinker reactivity • 11
Materiales de Construcción 67 (326), April–June 2017, e120. ISSN-L: 0465-2746. http://dx.doi.org/10.3989/mc.2017.08215
with the removal of alternative fuels. This behavior indicates the need of an adjustment in the retarder dosage, considering the reactivity of the final clinker particles due to its aluminates and silicates propor-tion and crystalline structure.
4.4. Compressive Strength
The physical performance of the cements was determined using mortar compressive strength in 2 in. cubes. As indicated for Ordinary Portland Cement
Figure 3. Isothermal Calorimetry with 0.03% of cement admixture with S1 – S8 cements prepared with 4.75% of SO3.
0.006Sample 1 (with all alternative fuels)
Nor
mal
ized
Hea
t Flo
w [
W/g
]N
orm
aliz
ed H
eat F
low
[W/g
]N
orm
aliz
ed H
eat F
low
[W/g
]N
orm
aliz
ed H
eat F
low
[W/g
]
Nor
mal
ized
Hea
t Flo
w [W
/g]
Nor
mal
ized
Hea
t Flo
w [W
/g]
Nor
mal
ized
Hea
t Flo
w [W
/g]
Nor
mal
ized
Hea
t Flo
w [W
/g]
Sample 3 (without RDF)
Sample 5 (without Tires, Mass, RDF)
Sample 7 (without Carbon Residue) Sample 8 (without Mass)
Sample 6 (without Biomass, Tires)
Times [hours]
Times [hours] Times [hours]
Times [hours] Times [hours]
Times [hours]Times [hours]
S1 - 4.75% SO3
S1 - 4.75% SO3 + Cement AdmixtureS2 - 4.75% SO3
S2 - 4.75% SO3 + Cement Admixture
S3 - 4.75% SO3
S3 - 4.75% SO3 + Cement AdmixtureS4 - 4.75% SO3S4 - 4.75% SO3 + Cement Admixture
S5 - 4.75% SO3
S5 - 4.75% SO3 + Cement AdmixtureS6 - 4.75% SO3
S6 - 4.75% SO3 + Cement Admixture
S7 - 4.75% SO3
S7 - 4.75% SO3 + Cement AdmixtureS8 - 4.75% SO3
S8 - 4.75% SO3 + Cement Admixture
Times [hours]
Sample 2 (without Biomass)
Sample 4 (without Mass, Biomass, RDF)
0.005
0.004
0.003
0.002
0.001
0.0000 4 6 8 10 12 14 16 18 20 22 242
0.006
0.005
0.004
0.003
0.002
0.001
0.0000 4 6 8 10 12 14 16 18 20 22 242
0.006
0.005
0.004
0.003
0.002
0.001
0.0000 4 6 8 10 12 14 16 18 20 22 242
0.006
0.005
0.004
0.003
0.002
0.001
0.0000 4 6 8 10 12 14 16 18 20 22 242
0.006
0.005
0.004
0.003
0.002
0.001
0.0000 4 6 8 10 12 14 16 18 20 22 242
0.006
0.005
0.004
0.003
0.002
0.001
0.0000 4 6 8 10 12 14 16 18 20 22 242
0.006
0.005
0.004
0.003
0.002
0.001
0.0000 4 6 8 10 12 14 16 18 20 22 242
0.006
0.005
0.004
0.003
0.002
0.001
0.0000 4 6 8 10 12 14 16 18 20 22 242

12 • K. Serrano et al.
Materiales de Construcción 67 (326), April–June 2017, e120. ISSN-L: 0465-2746. http://dx.doi.org/10.3989/mc.2017.08215
(OPC) the water/cement ratio remained constant as stated in the American norm ASTM-C-109 and Mexican norm NMX-C-414-ONNCCE, at 0.485 in all the cases. The results are shown in Figure 5 and in Figure 6. It is important to highlight that the
physical testing of the cements did not include the use of cement or ready-mix admixture.
As identified in the calorimetric study, reference cement did not show a significant change in the early compressive strength with a variation in the
Figure 4. Isothermal Calorimetry with 0.03% of ready-mix admixture with S1 – S8 cements prepared with 4.25% of SO3.
0.006
0.007Sample 1 (with all alternative fuels)
Nor
mal
ized
Hea
t Flo
w [W
/g]
S1 - 4.25% SO3
S1 - 4.25% SO3 + Ready-mix Admixture
0.005
0.004
0.003
0.002
0.001
0.000
Time [hours]
0 8 12 16 20 24 28 32 36 40 44 48 52 56 604
Time [hours]
0 8 12 16 20 24 28 32 36 40 44 48 52 56 604
Time [hours]
0 8 12 16 20 24 28 32 36 40 44 48 52 56 604
Time [hours]
0 8 12 16 20 24 28 32 36 40 44 48 52 56 604
Time [hours]
0 8 12 16 20 24 28 32 36 40 44 48 52 56 604
Sample 6 (without Biomass, Tires)
S6 - 4.25% SO3
0.006
0.007Sample 2 (without Biomass)
Nor
mal
ized
Hea
t Flo
w [W
/g]
0.005
0.004
0.003
0.002
0.001
0.000
Time [hours]
0 8 12 16 20 24 28 32 36 40 44 48 52 56 604
Time [hours]
0 8 12 16 20 24 28 32 36 40 44 48 52 56 604
Time [hours]
0 8 12 16 20 24 28 32 36 40 44 48 52 56 604
S2 - 4.25% SO3
S2 - 4.25% SO3 + Cement Admixture
S4 - 4.25% SO3 + Ready-mix Admixture
S6 - 4.25% SO3 + Ready-mix Admixture
S7 - 4.25% SO3 + Ready-mix AdmixtureS8 - 4.25% SO3 + Ready-mix Admixture
S5 - 4.25% SO3 + Ready-mix Admixture
Nor
mal
ized
Hea
t Flo
w [W
/g]
Sample 3 (without RDF)
Sample 5 (without Tires, Mass, RDF)
S3 - 4.25% SO3
S3 - 4.25% SO3 + Cement Admixture0.006
0.007
0.005
0.004
0.003
0.002
0.001
0.000
Nor
mal
ized
Hea
t Flo
w [W
/g] 0.006
0.007
0.005
0.004
0.003
0.002
0.001
0.000
Nor
mal
ized
Hea
t Flo
w [W
/g] 0.006
0.007
0.005
0.004
0.003
0.002
0.001
0.000
Nor
mal
ized
Hea
t Flo
w [W
/g] 0.006
0.007
0.005
0.004
0.003
0.002
0.001
0.000
Nor
mal
ized
Hea
t Flo
w [W
/g] 0.006
0.007
0.005
0.004
0.003
0.002
0.001
Nor
mal
ized
Hea
t Flo
w [W
/g] 0.006
0.007
0.005
0.004
0.003
0.002
0.001
0.000
Sample 4 (without Mass, Biomass, RDF)
S4 - 4.25% SO3
S5 - 4.25% SO3
Sample 7 (without Carbon Residue) Sample 8 (without Mass)
S7 - 4.25% SO3S8 - 4.25% SO3
Impact of the use of alternative fuels on clinker reactivity • 13
Materiales de Construcción 67 (326), April–June 2017, e120. ISSN-L: 0465-2746. http://dx.doi.org/10.3989/mc.2017.08215
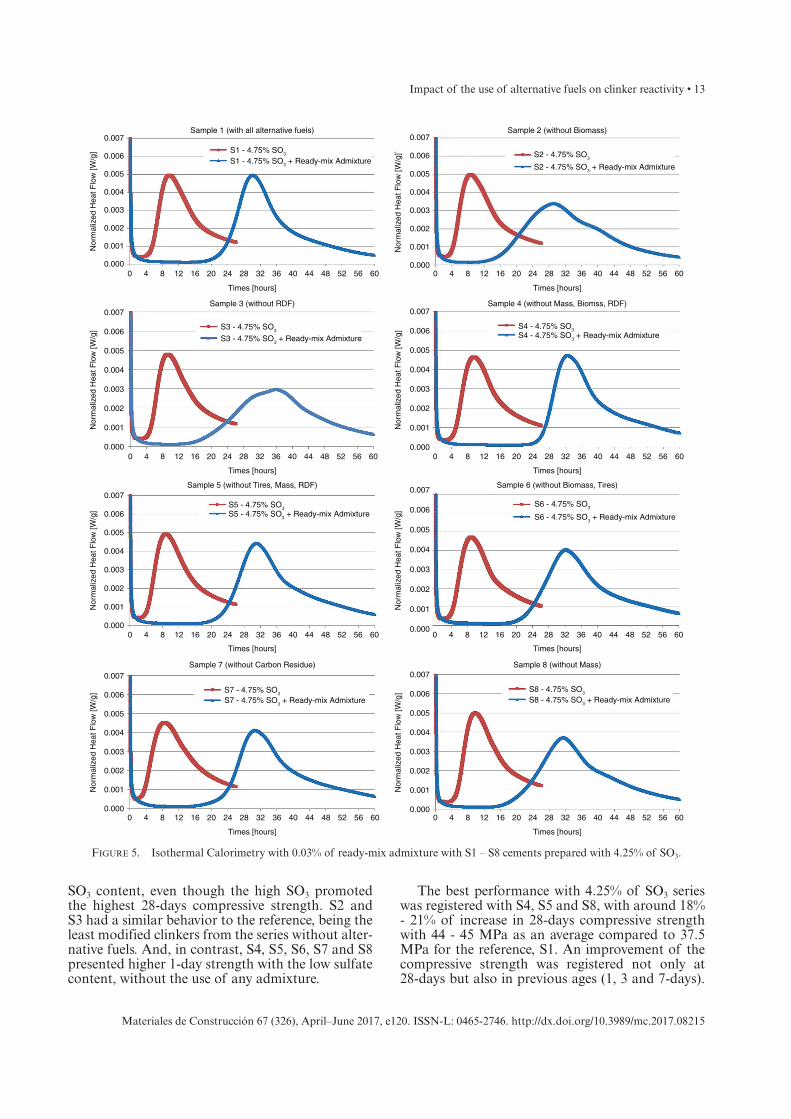
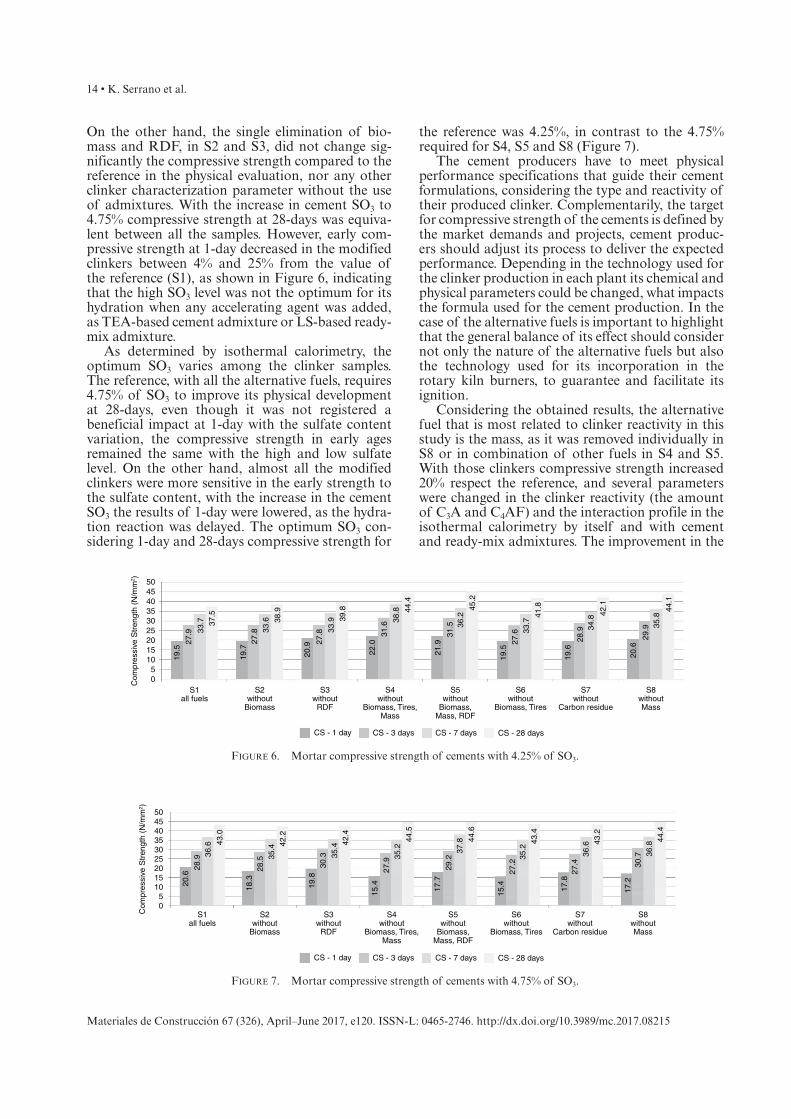
SO3 content, even though the high SO3 promoted the highest 28-days compressive strength. S2 and S3 had a similar behavior to the reference, being the least modified clinkers from the series without alter-native fuels. And, in contrast, S4, S5, S6, S7 and S8 presented higher 1-day strength with the low sulfate content, without the use of any admixture.
The best performance with 4.25% of SO3 series was registered with S4, S5 and S8, with around 18% - 21% of increase in 28-days compressive strength with 44 - 45 MPa as an average compared to 37.5 MPa for the reference, S1. An improvement of the compressive strength was registered not only at 28-days but also in previous ages (1, 3 and 7-days).
Figure 5. Isothermal Calorimetry with 0.03% of ready-mix admixture with S1 – S8 cements prepared with 4.25% of SO3.
0.006
0.007
Nor
mal
ized
Hea
t Flo
w [W
/g]
0.005
0.004
0.003
0.002
0.001
0.000
0.006
0.007
Nor
mal
ized
Hea
t Flo
w [W
/g]
0.005
0.004
0.003
0.002
0.001
0.000
0.006
0.007
Nor
mal
ized
Hea
t Flo
w [W
/g]
0.005
0.004
0.003
0.002
0.001
0.000
0.006
0.007
Nor
mal
ized
Hea
t Flo
w [W
/g]
0.005
0.004
0.003
0.002
0.001
0.000
0.006
0.007
Nor
mal
ized
Hea
t Flo
w [W
/g]
0.005
0.004
0.003
0.002
0.001
0.000
0.006
0.007
Nor
mal
ized
Hea
t Flo
w [W
/g]
0.005
0.004
0.003
0.002
0.001
0.000
0.006
0.007
Nor
mal
ized
Hea
t Flo
w [W
/g]
0.005
0.004
0.003
0.002
0.001
0.000
0.006
0.007
Nor
mal
ized
Hea
t Flo
w [W
/g]`
0.005
0.004
0.003
0.002
0.001
0.000
Times [hours]
0 8 12 16 20 24 28 32 36 40 44 48 52 56 604
Times [hours]
0 8 12 16 20 24 28 32 36 40 44 48 52 56 604
Times [hours]
0 8 12 16 20 24 28 32 36 40 44 48 52 56 604
Times [hours]
0 8 12 16 20 24 28 32 36 40 44 48 52 56 604
Times [hours]
0 8 12 16 20 24 28 32 36 40 44 48 52 56 604
Times [hours]
0 8 12 16 20 24 28 32 36 40 44 48 52 56 604
Times [hours]
0 8 12 16 20 24 28 32 36 40 44 48 52 56 604
Times [hours]
0 8 12 16 20 24 28 32 36 40 44 48 52 56 604
Sample 1 (with all alternative fuels)
Sample 6 (without Biomass, Tires)
Sample 2 (without Biomass)
Sample 3 (without RDF)
Sample 5 (without Tires, Mass, RDF)
Sample 7 (without Carbon Residue) Sample 8 (without Mass)
Sample 4 (without Mass, Biomss, RDF)
S1 - 4.75% SO3
S1 - 4.75% SO3 + Ready-mix AdmixtureS2 - 4.75% SO3 + Ready-mix Admixture
S3 - 4.75% SO3 + Ready-mix Admixture
S2 - 4.75% SO3
S4 - 4.75% SO3 + Ready-mix AdmixtureS3 - 4.75% SO3
S5 - 4.75% SO3 + Ready-mix Admixture S6 - 4.75% SO3 + Ready-mix Admixture
S5 - 4.75% SO3S6 - 4.75% SO3
S8 - 4.75% SO3 + Ready-mix AdmixtureS8 - 4.75% SO3
S7 - 4.75% SO3 + Ready-mix AdmixtureS7 - 4.75% SO3
S4 - 4.75% SO3
14 • K. Serrano et al.
Materiales de Construcción 67 (326), April–June 2017, e120. ISSN-L: 0465-2746. http://dx.doi.org/10.3989/mc.2017.08215
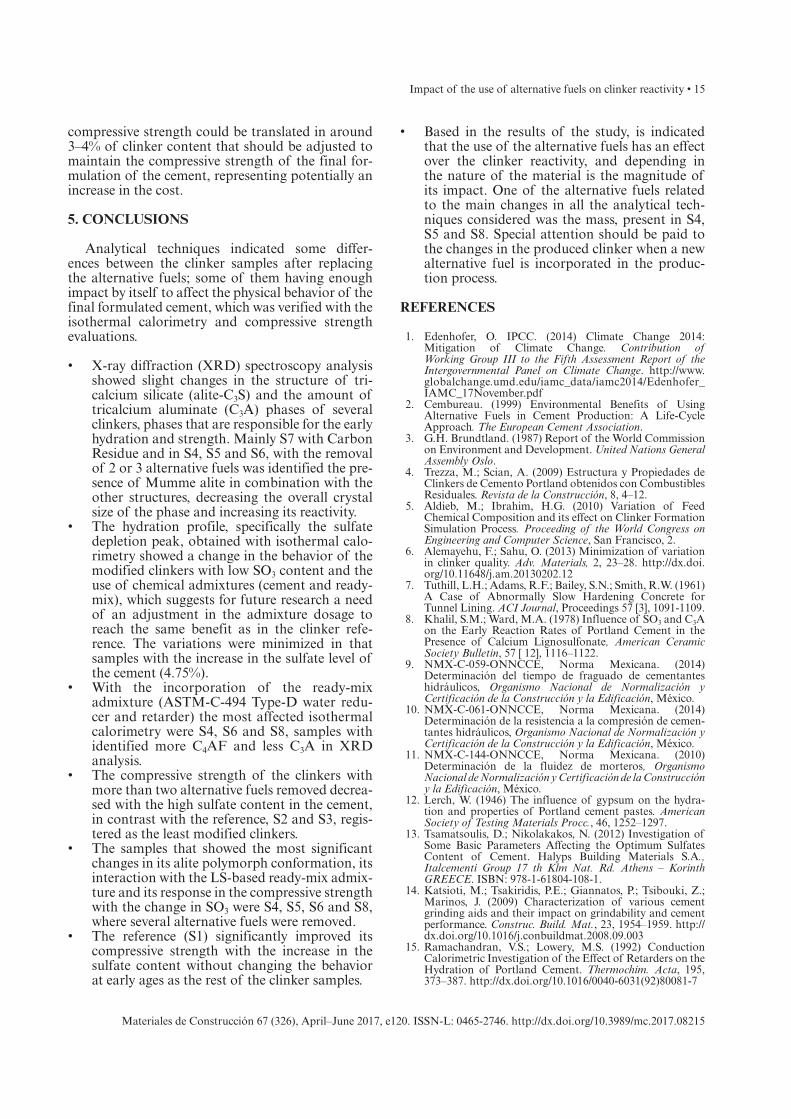
On the other hand, the single elimination of bio-mass and RDF, in S2 and S3, did not change sig-nificantly the compressive strength compared to the reference in the physical evaluation, nor any other clinker characterization parameter without the use of admixtures. With the increase in cement SO3 to 4.75% compressive strength at 28-days was equiva-lent between all the samples. However, early com-pressive strength at 1-day decreased in the modified clinkers between 4% and 25% from the value of the reference (S1), as shown in Figure 6, indicating that the high SO3 level was not the optimum for its hydration when any accelerating agent was added, as TEA-based cement admixture or LS-based ready-mix admixture.
As determined by isothermal calorimetry, the optimum SO3 varies among the clinker samples. The reference, with all the alternative fuels, requires 4.75% of SO3 to improve its physical development at 28-days, even though it was not registered a beneficial impact at 1-day with the sulfate content variation, the compressive strength in early ages remained the same with the high and low sulfate level. On the other hand, almost all the modified clinkers were more sensitive in the early strength to the sulfate content, with the increase in the cement SO3 the results of 1-day were lowered, as the hydra-tion reaction was delayed. The optimum SO3 con-sidering 1-day and 28-days compressive strength for
the reference was 4.25%, in contrast to the 4.75% required for S4, S5 and S8 (Figure 7).
The cement producers have to meet physical performance specifications that guide their cement formulations, considering the type and reactivity of their produced clinker. Complementarily, the target for compressive strength of the cements is defined by the market demands and projects, cement produc-ers should adjust its process to deliver the expected performance. Depending in the technology used for the clinker production in each plant its chemical and physical parameters could be changed, what impacts the formula used for the cement production. In the case of the alternative fuels is important to highlight that the general balance of its effect should consider not only the nature of the alternative fuels but also the technology used for its incorporation in the rotary kiln burners, to guarantee and facilitate its ignition.
Considering the obtained results, the alternative fuel that is most related to clinker reactivity in this study is the mass, as it was removed individually in S8 or in combination of other fuels in S4 and S5. With those clinkers compressive strength increased 20% respect the reference, and several parameters were changed in the clinker reactivity (the amount of C3A and C4AF) and the interaction profile in the isothermal calorimetry by itself and with cement and ready-mix admixtures. The improvement in the
Figure 6. Mortar compressive strength of cements with 4.25% of SO3.
50454035302520151050C
ompr
essi
ve S
tren
gth
(N/m
m2 )
S1all fuels
19.5
19.7
27.9
27.833
.7
33.6 38
.9
20.9 27
.8 33.9 39
.8
22.0
31.6
38.8 44
.4
21.9
31.5 36
.2
45.2
19.5
27.6 33
.7
41.8
19.6
28.9 34
.8
42.1
20.6
29.9 35
.8
44.1
37.5
S2without
Biomass
S3without
RDF
S4without
Biomass, Tires,Mass
S5without
Biomass,Mass, RDF
S6without
Biomass, Tires
S7without
Carbon residue
S8withoutMass
CS - 1 day CS - 3 days CS - 7 days CS - 28 days
Figure 7. Mortar compressive strength of cements with 4.75% of SO3.
50454035302520151050
Com
pres
sive
Str
engt
h (N
/mm
2 )
S1all fuels
20.6
28.9 36
.6 43.0
18.3
28.5 35
.4 42.2
19.8
30.3 35
.4 42.4
15.4
27.9
35.2
44.5
17.7
29.2
37.8 44
.6
15.4
27.2
35.2
43.4
17.8
27.4
36.6 43
.2
17.2
30.7 36
.844
.4
S2without
Biomass
S3without
RDF
S4without
Biomass, Tires,Mass
S5without
Biomass,Mass, RDF
S6without
Biomass, Tires
S7without
Carbon residue
S8withoutMass
CS - 1 day CS - 3 days CS - 7 days CS - 28 days
Impact of the use of alternative fuels on clinker reactivity • 15
Materiales de Construcción 67 (326), April–June 2017, e120. ISSN-L: 0465-2746. http://dx.doi.org/10.3989/mc.2017.08215
compressive strength could be translated in around 3–4% of clinker content that should be adjusted to maintain the compressive strength of the final for-mulation of the cement, representing potentially an increase in the cost.
5. CONCLUSIONS
Analytical techniques indicated some differ-ences between the clinker samples after replacing the alternative fuels; some of them having enough impact by itself to affect the physical behavior of the final formulated cement, which was verified with the isothermal calorimetry and compressive strength evaluations.
• X-ray diffraction (XRD) spectroscopy analysis showed slight changes in the structure of tri-calcium silicate (alite-C3S) and the amount of tricalcium aluminate (C3A) phases of several clinkers, phases that are responsible for the early hydration and strength. Mainly S7 with Carbon Residue and in S4, S5 and S6, with the removal of 2 or 3 alternative fuels was identified the pre-sence of Mumme alite in combination with the other structures, decreasing the overall crystal size of the phase and increasing its reactivity.
• The hydration profile, specifically the sulfate depletion peak, obtained with isothermal calo-rimetry showed a change in the behavior of the modified clinkers with low SO3 content and the use of chemical admixtures (cement and ready-mix), which suggests for future research a need of an adjustment in the admixture dosage to reach the same benefit as in the clinker refe-rence. The variations were minimized in that samples with the increase in the sulfate level of the cement (4.75%).
• With the incorporation of the ready-mix admixture (ASTM-C-494 Type-D water redu-cer and retarder) the most affected isothermal calorimetry were S4, S6 and S8, samples with identified more C4AF and less C3A in XRD analysis.
• The compressive strength of the clinkers with more than two alternative fuels removed decrea-sed with the high sulfate content in the cement, in contrast with the reference, S2 and S3, regis-tered as the least modified clinkers.
• The samples that showed the most significant changes in its alite polymorph conformation, its interaction with the LS-based ready-mix admix-ture and its response in the compressive strength with the change in SO3 were S4, S5, S6 and S8, where several alternative fuels were removed.
• The reference (S1) significantly improved its compressive strength with the increase in the sulfate content without changing the behavior at early ages as the rest of the clinker samples.
• Based in the results of the study, is indicated that the use of the alternative fuels has an effect over the clinker reactivity, and depending in the nature of the material is the magnitude of its impact. One of the alternative fuels related to the main changes in all the analytical tech-niques considered was the mass, present in S4, S5 and S8. Special attention should be paid to the changes in the produced clinker when a new alternative fuel is incorporated in the produc-tion process.
REFERENCES
1. Edenhofer, O. IPCC. (2014) Climate Change 2014: Mitigation of Climate Change. Contribution of Working Group III to the Fifth Assessment Report of the Intergovernmental Panel on Climate Change. http://www.globalchange.umd.edu/iamc_data/iamc2014/Edenhofer_IAMC_17November.pdf
2. Cembureau. (1999) Environmental Benefits of Using Alternative Fuels in Cement Production: A Life-Cycle Approach. The European Cement Association.
3. G.H. Brundtland. (1987) Report of the World Commission on Environment and Development. United Nations General Assembly Oslo.
4. Trezza, M.; Scian, A. (2009) Estructura y Propiedades de Clinkers de Cemento Portland obtenidos con Combustibles Residuales. Revista de la Construcción, 8, 4–12.
5. Aldieb, M.; Ibrahim, H.G. (2010) Variation of Feed Chemical Composition and its effect on Clinker Formation Simulation Process. Proceeding of the World Congress on Engineering and Computer Science, San Francisco, 2.
6. Alemayehu, F.; Sahu, O. (2013) Minimization of variation in clinker quality. Adv. Materials, 2, 23–28. http://dx.doi.org/10.11648/j.am.20130202.12
7. Tuthill, L.H.; Adams, R.F.; Bailey, S.N.; Smith, R.W. (1961) A Case of Abnormally Slow Hardening Concrete for Tunnel Lining. ACI Journal, Proceedings 57 [3], 1091-1109.
8. Khalil, S.M.; Ward, M.A. (1978) Influence of SO3 and C3A on the Early Reaction Rates of Portland Cement in the Presence of Calcium Lignosulfonate, American Ceramic Society Bulletin, 57 [ 12], 1116–1122.
9. NMX-C-059-ONNCCE, Norma Mexicana. (2014) Determinación del tiempo de fraguado de cementantes hidráulicos, Organismo Nacional de Normalización y Certificación de la Construcción y la Edificación, México.
10. NMX-C-061-ONNCCE, Norma Mexicana. (2014) Determinación de la resistencia a la compresión de cemen-tantes hidráulicos, Organismo Nacional de Normalización y Certificación de la Construcción y la Edificación, México.
11. NMX-C-144-ONNCCE, Norma Mexicana. (2010) Determinación de la fluidez de morteros, Organismo Nacional de Normalización y Certificación de la Construcción y la Edificación, México.
12. Lerch, W. (1946) The influence of gypsum on the hydra-tion and properties of Portland cement pastes. American Society of Testing Materials Procc., 46, 1252–1297.
13. Tsamatsoulis, D.; Nikolakakos, N. (2012) Investigation of Some Basic Parameters Affecting the Optimum Sulfates Content of Cement. Halyps Building Materials S.A., Italcementi Group 17 th Klm Nat. Rd. Athens – Korinth GREECE. ISBN: 978-1-61804-108-1.
14. Katsioti, M.; Tsakiridis, P.E.; Giannatos, P.; Tsibouki, Z.; Marinos, J. (2009) Characterization of various cement grinding aids and their impact on grindability and cement performance. Construc. Build. Mat., 23, 1954–1959. http://dx.doi.org/10.1016/j.conbuildmat.2008.09.003
15. Ramachandran, V.S.; Lowery, M.S. (1992) Conduction Calorimetric Investigation of the Effect of Retarders on the Hydration of Portland Cement. Thermochim. Acta, 195, 373–387. http://dx.doi.org/10.1016/0040-6031(92)80081-7