impact of traffic geolocation errors on self-organizing
TRANSCRIPT

Impact of Traffic Geolocation Errors onSelf-Organizing Network Performance
Felix Kirsten, Henrik Klessig, and Gerhard FettweisVodafone Chair Mobile Communications Systems
Dresden University of Technology, GermanyEmail: {felix.kirsten, henrik.klessig, fettweis}@tu-dresden.de
Andreas Hecker and Jens VoigtActix GmbH
Dresden, GermanyEmail: {andreas.hecker, jens.voigt}@amdocs.com
Abstract—In recent years, research on flexible algorithmsfor self-organizing networks has been a significant part of thedevelopment of wireless network technologies, such as LongTerm Evolution. In this paper, we focus on modeling specificerror types related to input data, i. e., to mobile data trafficmaps, and investigate their impact on self-organizing networkalgorithm and network performance. We develop traffic maperror patterns, which are able to reproduce erroneous geolocationof mobile users, e. g., by methods like (Enhanced) Cell-ID,Observed Time Difference of Arrival, or Global PositioningSystem. Furthermore, we model errors that occur when calltraces and performance measurement counters are used todetermine user locations. We find that self-organizing networkperformance may be robust to systematic distortions of userand traffic distributions, provided that 1) the overall traffic inthe network is estimated accurately, i. e., regions without trafficinformation are avoided, 2) performance measurement countersin the base stations provide additional information on imperfectgeolocation data, and 3) a certain degree of correlation betweenoriginal heterogeneous user distributions and distorted maps ismaintained to identify traffic hot spots.
Index Terms—mobile traffic geolocation; error modeling; self-organizing network; network optimization; wireless network;performance evaluation; system modeling
I. INTRODUCTION
SON (Self-Organizing Networks) is a 3rd Generation Part-nership Project (3GPP) concept for an advanced managementand technology scheme that includes automated planning,optimization, and healing of cellular radio networks [1]. Basedon a current network state (input) and aiming at achievinguser-defined targets (load balancing, energy efficiency, etc.),SON adapts the network configuration (result) by means offlexible optimization algorithms. Algorithm performance andapplicability of results depend on their input data. Hence,any deterioration in data quality affects the optimal resultdetermined. To quantify this influence is the goal of our paper.
A loss in quality is similar to a degradation in accuracy.The accuracy of input data is generally limited according to1) limitations of data sources available and 2) the reductionin granularity and precision in subsequent aggregation andestimation processes.
Data sources on the network side are performance mea-surement (PM) counters and call traces (CTs). PM coun-ters comprise numerous event statistics related to networkelements with temporal resolutions of hours and days [2].
CTs include detailed measurement reports [3] between userequipments (UEs) and the network elements. They are eitherprovided from the Minimization of Drive Test NGMN/3GPPinitiative [4] via a Trace Collection Entity [5] or are proprietaryvendor solutions, like some PM counters.
Spatial distributions of user demands represent a type ofinput data that is frequently required. They are composed ofinformation about user locations and user generated trafficvolume. Aggregated to so-called traffic maps, they are usedin reference scenarios to (re-)create user demands and traf-fic volumes as input for algorithms and, subsequently, theirvalidation. In contrast to a fixed scenario with an existingtraffic map, a real network collects user demands and eventswithout explicit knowledge about a user’s location. Therefore,locations have to be estimated in order to generate traffic maps.
Typical applications of localization methods [6] assign thesite location (CID, Cell-ID), consider signal delay measure-ments (ECID, Enhanced CID), and include power measure-ments (AECID, Adaptive ECID) to improve results. Theaccuracy of these methods range from several tens of me-ters to several hundred meters. Other methods like OTDOA(Observed Time Difference Of Arrival) or GNSS (GlobalNavigation Satellite Systems) promise an even higher accuracy(10 to 60 m).
The choice of a localization method strongly depends on thedata sources available and, therefore, determines the accuracyof the resulting input data. Furthermore, the data sourcesmight be insufficient to reproduce complete knowledge aboutthe actual traffic distribution. E. g., if measurement reportscollected in CTs are only triggered by handover (HO) events,localization will be limited to HO regions, while conditions incell centers are mostly unknown.
In this paper, we focus on quality loss of input data bymeans of specific error types with respect to a spatial userdemand distribution. These error types are related to inaccuratelocalization and incomplete knowledge of network traffic. Weinvestigate the impact of those errors on SON algorithms andthe resulting network performance. As reference, we use theSON use cases Mobility Load Balancing (MLB) and Coverageand Capacity Optimization (CCO) as described in [7]. The airinterface technology of the reference network is LTE (LongTerm Evolution), for which SON has been a topic of discussionwithin 3GPP [8], [9].
978-1-4799-4482-8/14/$31.00 ©2014 IEEE

The outline of this paper is as follows: Section II showsthe error models to define the error characteristic of thissurvey. Section III describes the framework for our evaluation.Section IV presents the numerical results. Finally, Section Vends with the conclusions.
II. MODELING GEOLOCATION ERRORS
In this section, we develop two error models (one withregular characteristic, the other with respect to incompleteinformation) that reproduce geolocation error pattern on areference traffic map.
A. Mobile Network and Traffic Model
Throughout the paper, we consider the downlink of acellular network consisting of N ∈ N base stations cover-ing a compact region L ⊆ R
2. Furthermore, we introducecorresponding cell areas Li ⊂ L with
⋃i Li = L.
We assume mobile users to be spatially distributed accord-ing to some arbitrary distribution δ(·) with
∫L δ(u) du = 1.
Network traffic is modeled on flow level, where elastic flowsrepresent individual data transfers of web pages, video, audio,or general data files [10]. We assume that the arrival of flowrequests to the network takes place according to a Poissonprocess with intensity λ [11]. Flow sizes are assumed tobe exponentially distributed with mean Ω. The terms λ, Ω,and δ(u) determine the traffic intensity distribution κ(u) :=λΩδ(u) in Mbps/km2, which is represented by a spatial trafficintensity map. The reference traffic scenario chosen for ourinvestigations represents a heterogeneous user distribution inthe metropolitan area of a large North-American city and isdepicted in Fig. 1 (a).
B. Accuracy Error Model [F-1]
In order to consider regular error patterns of geolocationtechniques in LTE, we resort to a simple, yet realistic, model.We assume that user locations are determined independentlywith Gaussian error in both spatial dimensions around theactual UE position. By varying the standard deviation σ of theresulting circular Gaussian distribution between 0 to 300 mand applying it as a filter to the reference map, we areable to emulate techniques like Assisted-GPS, OTDOA, orECID, which are typical for different localization proceduresand network environments (urban density, indoor or outdoorlocation, antenna or satellite visibility, etc.). In the following,this error model is referred to as [F-1-GAUSS].
The resulting traffic maps show decrease in heterogeneityof user demand distribution (cf. Fig. 1 (b)). Traffic hot spotsbecome less peaky. With standard deviation σ tending toinfinity, the resulting traffic map represents a homogeneousdistribution in L. In the remainder of the paper, this specialcase is denoted as [F-1-GAUSS-∞].
C. Incomplete Measurement Data [F-2]
In addition, we model errors originating from incompletemeasurement data. We consider typical data corruption causedby a lack of UE measurement reports at locations withdominant primary cell reception, i. e., in cell centers.
(a) (b)
Reference Map [F-1-GAUSS], = 150 m
Fig. 1. (a) Reference traffic distribution κ(u) at peak traffic hour and (b)traffic map resulting from geolocation error [F-1-GAUSS]
With this assumption, user traffic information is reduced tohandover (HO) areas, where UEs are likely to perform HOsfrom one cell to another. To investigate different variations inthe resulting fragmented maps, we introduce a HO-parameterΔp which is used as follows: We define the HO area LHO ⊂L as the set of locations, where pi,prim ≤ pj,sec + Δp holdsfor all j �= i. The quantities pi,prim, pi,sec, and Δp denotethe Reference Signal Received Power (RSRP) values of theprimary cell i and the second strongest cell j at location u,and the so-called HO-margin, respectively.
This method divides the cell areas Li into cell centers Li,ctr
and cell edge regions Li,HO. We assume the traffic distribu-tion κ(u) at cell edge locations u ∈ Li,HO to be ideally andaccurately determined, and consider two strategies to handlethe traffic within cell centers Li,ctr:
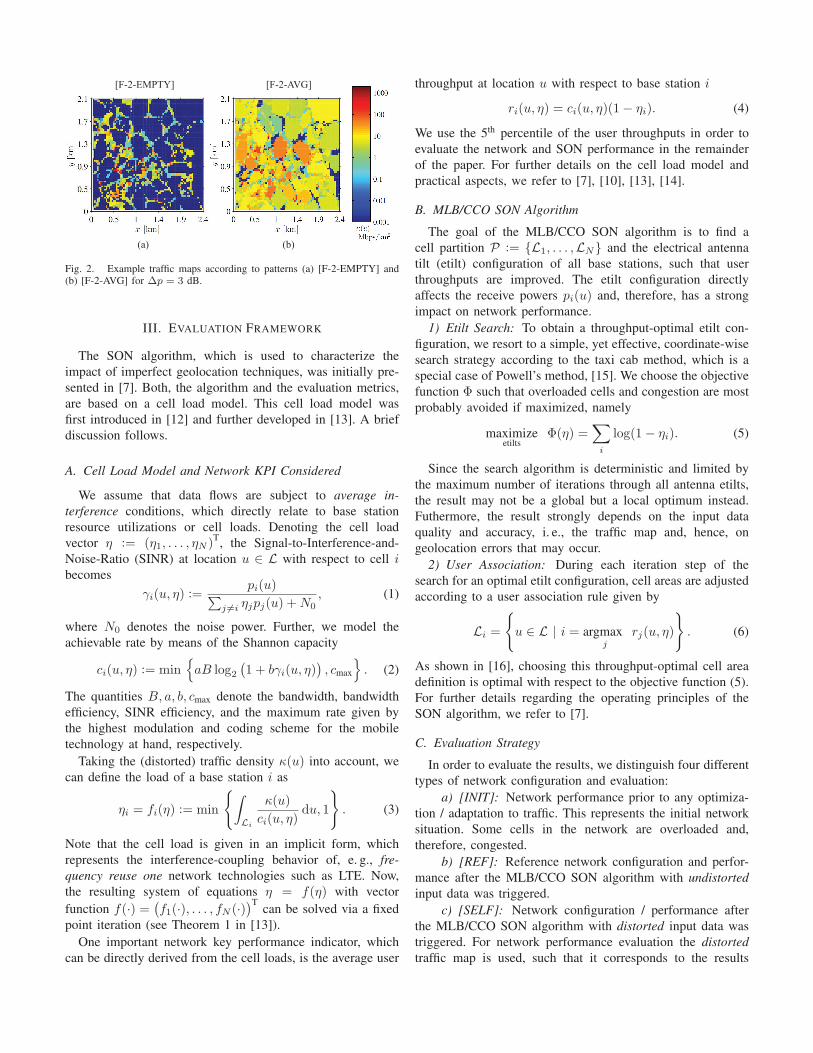
1) Users at cell center locations u ∈ Li,ctr cannot belocalized and are, therefore, untraceable for traffic mapgeneration. All values κ(u) are set to 0 for u ∈ Li,ctr.Consequently, the overall traffic in L decreases witha decrease in Δp. This error model is referred to as[F-2-EMPTY] and illustrated in Fig. 2 (a).
2) To obtain the overall network traffic distribution in Lmore accurately, additional measurements may be con-sidered (e. g., PM counters). These measurements can beused to fill the gaps in the traffic maps obtained from[F-2-EMPTY]. Traffic in Li,HO is subtracted from theoverall traffic in a cell Li, which is obtained from PMcounters, and then distributed evenly over the cell centerregion Li,ctr. We denote this approach by [F-2-AVG]. Anexample traffic map is depicted in Fig. 2 (b).
The error patterns according to [F-2-EMPTY] and[F-2-AVG] represent a lack of information about the correctdistribution of user traffic. For the maps depicted in Fig. 2,with Δp = 3 dB, only 33 % of the overall user traffic islocalized correctly. The pattern [F-2-AVG] provides a moreaccurate determination of overall traffic. However, the userdistribution is still assumed to be evenly distributed within thecell centers Li,ctr. With a HO margin Δp = 0 dB, the resultingtraffic map exhibits homogeneous traffic distributions withineach cell Li.
(a) (b)
[F-2-EMPTY] [F-2-AVG]
Fig. 2. Example traffic maps according to patterns (a) [F-2-EMPTY] and(b) [F-2-AVG] for Δp = 3 dB.
III. EVALUATION FRAMEWORK
The SON algorithm, which is used to characterize theimpact of imperfect geolocation techniques, was initially pre-sented in [7]. Both, the algorithm and the evaluation metrics,are based on a cell load model. This cell load model wasfirst introduced in [12] and further developed in [13]. A briefdiscussion follows.
A. Cell Load Model and Network KPI Considered
We assume that data flows are subject to average in-terference conditions, which directly relate to base stationresource utilizations or cell loads. Denoting the cell loadvector η := (η1, . . . , ηN )T, the Signal-to-Interference-and-Noise-Ratio (SINR) at location u ∈ L with respect to cell ibecomes
γi(u, η) :=pi(u)∑
j �=i ηjpj(u) + N0, (1)
where N0 denotes the noise power. Further, we model theachievable rate by means of the Shannon capacity
ci(u, η) := min{
aB log2
(1 + bγi(u, η)
), cmax
}. (2)
The quantities B, a, b, cmax denote the bandwidth, bandwidthefficiency, SINR efficiency, and the maximum rate given bythe highest modulation and coding scheme for the mobiletechnology at hand, respectively.
Taking the (distorted) traffic density κ(u) into account, wecan define the load of a base station i as
ηi = fi(η) := min
{∫Li
κ(u)ci(u, η)
du, 1
}. (3)
Note that the cell load is given in an implicit form, whichrepresents the interference-coupling behavior of, e. g., fre-quency reuse one network technologies such as LTE. Now,the resulting system of equations η = f(η) with vectorfunction f(·) =
(f1(·), . . . , fN (·))T
can be solved via a fixedpoint iteration (see Theorem 1 in [13]).
One important network key performance indicator, whichcan be directly derived from the cell loads, is the average user
throughput at location u with respect to base station i
ri(u, η) = ci(u, η)(1 − ηi). (4)
We use the 5th percentile of the user throughputs in order toevaluate the network and SON performance in the remainderof the paper. For further details on the cell load model andpractical aspects, we refer to [7], [10], [13], [14].
B. MLB/CCO SON Algorithm
The goal of the MLB/CCO SON algorithm is to find acell partition P := {L1, . . . ,LN} and the electrical antennatilt (etilt) configuration of all base stations, such that userthroughputs are improved. The etilt configuration directlyaffects the receive powers pi(u) and, therefore, has a strongimpact on network performance.
1) Etilt Search: To obtain a throughput-optimal etilt con-figuration, we resort to a simple, yet effective, coordinate-wisesearch strategy according to the taxi cab method, which is aspecial case of Powell’s method, [15]. We choose the objectivefunction Φ such that overloaded cells and congestion are mostprobably avoided if maximized, namely
maximizeetilts
Φ(η) =∑
i
log(1 − ηi). (5)
Since the search algorithm is deterministic and limited bythe maximum number of iterations through all antenna etilts,the result may not be a global but a local optimum instead.Futhermore, the result strongly depends on the input dataquality and accuracy, i. e., the traffic map and, hence, ongeolocation errors that may occur.
2) User Association: During each iteration step of thesearch for an optimal etilt configuration, cell areas are adjustedaccording to a user association rule given by
Li =
{u ∈ L | i = argmax
jrj(u, η)
}. (6)
As shown in [16], choosing this throughput-optimal cell areadefinition is optimal with respect to the objective function (5).For further details regarding the operating principles of theSON algorithm, we refer to [7].
C. Evaluation Strategy
In order to evaluate the results, we distinguish four differenttypes of network configuration and evaluation:
a) [INIT]: Network performance prior to any optimiza-tion / adaptation to traffic. This represents the initial networksituation. Some cells in the network are overloaded and,therefore, congested.
b) [REF]: Reference network configuration and perfor-mance after the MLB/CCO SON algorithm with undistortedinput data was triggered.
c) [SELF]: Network configuration / performance afterthe MLB/CCO SON algorithm with distorted input data wastriggered. For network performance evaluation the distortedtraffic map is used, such that it corresponds to the results

which are obtained if the distorted traffic map is assumed tobe correct (algorithm self-evaluation).
d) [NET]: Network configuration / performance afterthe MLB/CCO SON algorithm with distorted input data wastriggered. For network performance evaluation the undistortedtraffic map is used, such that the results represent the realnetwork behavior after optimization (algorithm network eval-uation).
The evaluation scenario under consideration represents anLTE network deployed in the metropolitan area of a largeNorth-American city. 55 base stations are irregularly deployedat 19 sites in total. Each base station employs a bandwidth of10 MHz. For ease of computation, we numerically evaluatethe SON and network performance according to the modelpresented before. However, the model is quite accurate inpredicting real network performance, as shown in [17].
IV. NUMERICAL RESULTS
In this section, we present numerical results obtained bymeans of the evaluation framework explained above. We useflow throughput 5-percentiles as indicators of user satisfactionand illustrate the effects of geolocation errors according to[F-1] and [F-2] on SON performance.
A. Accuracy Error Model
The performance of the SON algorithm using the accuracyerror pattern [F-1-GAUSS] is depicted in Fig. 3. Prior toany optimization, network performance is poor due to anoverload situation at the peak traffic hour ([INIT]). Note that,according to our model, an overload situation in a cell impliesan indefinitely growing number of users and, therefore, zerothroughput in the long run. Remarkable improvements from 0to 5.7 Mbps can be achieved, if the user distribution, i. e., thealgorithm’s input data, is accurately localized ([REF]). How-ever, [NET] indicates, that the results based on increasinglydistorted traffic maps show similar optimization gains. TheMLB/CCO algorithm proves quite robust to inaccurate trafficmeasurements, i. e., less heterogeneity in spatial distribution.Interestingly, a homogeneous traffic distribution, provided bypattern [F-1-GAUSS-∞], did not considerably lower the SONoptimization gains in the scenario at hand.
The difference between the results for self-evaluation([SELF]) and network evaluation ([NET]) reveals a self-estimation error, which is caused by user traffic that is in-accurately allocated to individual cells. The more uniform thetraffic distribution among the cells, the greater is the tendencyof the algorithm to underestimate network performance. Thisis a consequence of distributing traffic in space by the regularerror pattern. The results are a degradation of the interferencesituation in the network and, hence, an underestimation ofperformance.
Additionally, standard deviations σ between 0 and 120 mcaused by A-GPS, ECID, or OTDOA localization techniques,significantly improve optimization gains by up to 22 %. Thereason for this gain is an increase in algorithm performancecaused by the spatial traffic smoothing characteristic of the
0
1
2
3
4
5
6
7
8
9
10
0 30 60 90 120 150 180 210 240 270 300
Thro
ughp
ut 5
-per
cent
ile [M
bps]
Standard deviation [m]
[INIT] [REF] [SELF] [NET]
[F-1-GAUSS- ]
GPS
OTD
OA ECID Geotagging algorithms Cell-ID
Fig. 3. User throughput 5-percentiles obtained with error pattern [F-1-GAUSS] for increasing standard deviation σ.
error pattern investigated. The SON algorithm requires alimitation of iteration steps resulting in a probability to obtaina less suitable etilt configuration. This probability is high withtraffic peaks being small in terms of area, because they aremore difficult to detect in a limited amount of steps. Now,this drawback is partly compensated by a redistribution ofuser traffic peaks. This results in a more efficient search foran optimal etilt configuration and, thereby, improves networkand SON performance.
B. Incomplete Measurement Data
Fig. 4 depicts the results obtained with traffic maps distortedby error models [F-2-AVG] (evenly distributed traffic in cellcenters) and [F-2-EMPTY] (cell centers not considered). Ref-erence results ([REF]) are higher compared with the networkevaluation and erroneous input ([NET]). However, [F-2-AVG]still provides acceptable results for HO margins up to 3.5 dB,which refers to 37 % of overall traffic being localized correctly.Lower margins Δp result in smaller HO areas. Therefore, lesstraffic is localized correctly which eventually results in loweroptimization gains.
[F-2-AVG] [F-2-EMPTY]
0
1
2
3
4
5
6
7
5 3,5 2,5 1,5 0,5
Thro
ughp
ut5-
perc
entil
e [M
bps]
HO margin ¢p [dB](a)
[INIT] [REF] [SELF] [NET]
¢p 0
0
2
4
6
8
10
12
14
5,5 4,5 3,5 2,5 1,5 0,5
Thro
ughp
ut5-
perc
entil
e [M
bps]
HO margin ¢p [dB](b)
[INIT] [REF] [SELF] [NET]
Fig. 4. User throughput 5-percentiles obtained with (a) error patterns [F-2-AVG] and (b) [F-2-EMPTY] for decreasing HO margin Δp.
Fig. 4 (a) shows that algorithm performance is underes-timated with [F-2-AVG]. However, the opposite is observedwhen the traffic map is distorted by [F-2-EMPTY], seeFig. 4 (b). A significant overestimation is caused by disre-garding traffic at the cell center areas, since cell loads areunderestimated. Moreover, algorithm performance in case ofpattern [F-2-AVG] is more accurate compared to the perfor-mance in case that pattern [F-2-EMPTY] is considered. This isdue to a more accurate representation of absolute traffic and,hence, a more accurate prediction of cell loads.
V. CONCLUSIONS AND OUTLOOK
In this paper, we focused on modeling specific error typesrelated to input data, more specifically to mobile data trafficmaps, and investigated their impact on SON algorithm andnetwork performance. The results presented highlight a certainrobustness of SON optimization gains to systematic distortionsof user and traffic distributions that are determined by methodslike (Enhanced) cell-ID, Observed Time Difference of Arrival,or Global Positioning System. These optimization gains cor-relate with traffic map accuracy up to a certain extent. Theycan be achieved by three major factors:
1) Overall traffic in multiple cells has to be estimatedaccurately in absolute numbers. In this regard, perfor-mance measurement counters are an important sourceof information.
2) A certain degree of correlation between originally het-erogeneous user distributions and distorted maps has tobe maintained in order to locate traffic hot spots correctlyand, likewise, areas of low demand.
3) Further, an increase in spatial traffic resolution doesnot necessarily yield larger optimization gains. On thecontrary, performance may be increased by smoothinghighly heterogeneous traffic maps for algorithms basedon search strategies as in the algorithm used in thiscontribution.
The results presented are achieved by investigating onespecific traffic and network scenario, which offers all charac-teristics of a typical dense urban mobile network. However, theresults should be validated by further investigations utilizingdifferent network configurations, or SON use cases, such asmobility robustness optimization or energy saving manage-ment.
ACKNOWLEDGMENT
The work presented in this paper was sponsored by thegovernment of the Free State of Saxony, Germany, and bythe European Regional Development Fund (ERDF) within theCool Silicon Cluster of Excellence under contracts 31529/2794and 29908/2794.
REFERENCES
[1] L. C. Schmelz, H. van den Berg, et al., “Framework for the developmentof self-organisation methods,” INFSO-ICT-216284 SOCRATES, Tech.Rep. D2.4, Sep 2008.
[2] 3GPP, “3rd Generation Partnership Project; Technical SpecificationGroup Services and System Aspects; Telecommunication management;Performance Management (PM); Performance measurements EvolvedUniversal Terrestrial Radio Access Network (E-UTRAN) (Release 12),”TS 32.425, 2013.
[3] ——, “3rd Generation Partnership Project; Technical SpecificationGroup Radio Access Network; Evolved Universal TerrestrialRadio Access (E-UTRA); Radio Resource Control (RRC); Protocolspecification (Release 12),” TS 36.331, 2013.
[4] ——, “3rd Generation Partnership Project; Technical SpecificationGroup Radio Access Network; Universal Terrestrial Radio Access(UTRA) and Evolved Universal Terrestrial Radio Access (E-UTRA);Radio measurement collection for Minimization of Drive Tests (MDT);Overall description; Stage 2,” TS 37.320, Mar. 2013.
[5] ——, “3rd Generation Partnership Project; Technical SpecificationGroup Services and System Aspects; Telecommunication management;Subscriber and equipment trace; Trace concepts and requirements,” TS32.421, 2013.
[6] A. Kangas, I. Siomina, and T. Wigren, “Positioning in LTE,” in Hand-book of Position Location: Theory, Practixe, and Advances, 2012, pp.1081–1127.
[7] A. Fehske, H. Klessig, J. Voigt, and G. Fettweis, “Concurrent load-awareadjustment of user association and antenna tilts in self-organizing radionetworks,” Vehicular Technology, IEEE Transactions on, vol. 62, no. 5,pp. 1974–1988, 2013.
[8] 3GPP, “Evolved Universal Terrestrial Radio Access (E-UTRA) andEvolved Universal Terrestrial Radio Access (E-UTRAN); Overalldescription; Stage 2,” 3rd Generation Partnership Project (3GPP), TS36.300, Sep. 2013.
[9] ——, “3rd Generation Partnership Project; Technical SpecificationGroup Radio Access Network; Evolved Universal Terrestrial RadioAccess Network (E-UTRAN); Self-configuring and self-optimizingnetwork (SON) use cases and solutions,” 3rd Generation PartnershipProject (3GPP), TR 36.902, Mar. 2011.
[10] S. Ben Fredj, T. Bonald, A. Proutiere, G. Régnié, and J. W. Roberts,“Statistical bandwidth sharing: A study of congestion on flow level,”in Proceedings of the 2001 conference on Applications, technologies,architectures, and protocols for computer communications - SIGCOMM’01, vol. 31, no. 4. New York, New York, USA: ACM Press, Aug.2001, pp. 111–122.
[11] T. Bonald, “The Erlang model with non-poisson call arrivals,” ACMSIGMETRICS Performance Evaluation Review, vol. 34, no. 1, p. 276,Jun. 2006.
[12] K. Majewski and M. Koonert, “Conservative Cell Load Approximationfor Radio Networks with Shannon Channels and its Application to LTENetwork Planning,” in 2010 Sixth Advanced International Conferenceon Telecommunications. IEEE, 2010, pp. 219–225.
[13] A. J. Fehske and G. P. Fettweis, “On flow level modeling of multi-cellwireless networks,” in 2013 11th International Symposium on Modeling& Optimization in Mobile, Ad Hoc & Wireless Networks (WiOpt),Tsukuba City, 13-17 May 2013.
[14] P. Mogensen, W. Na, I. Z. Kovacs, F. Frederiksen, A. Pokhariyal,K. I. Pedersen, T. Kolding, K. Hugl, and M. Kuusela, “LTE CapacityCompared to the Shannon Bound,” in 2007 IEEE 65th VehicularTechnology Conference - VTC2007-Spring, no. 1. IEEE, Apr. 2007,pp. 1234–1238.
[15] M. J. D. Powell, “An efficient method for finding the minimum ofa function of several variables without calculating derivatives,” TheComputer Journal, no. 7(2), pp. 155–162, 1964.
[16] H. Kim, G. de Veciana, X. Yang, and M. Venkatachalam, “DistributedAlpha-Optimal User Association and Cell Load Balancing in WirelessNetworks,” IEEE ACM Transactions on Networking, vol. 20, no. 1, pp.177–190, Feb. 2012.
[17] A. Fehske, H. Klessig, J. Voigt, and G. Fettweis, “Flow-level models forcapacity planning and management in interference-coupled wireless datanetworks,” IEEE Communications Magazine, vol. 52, no. 2, February2014.