impact of virginia public libraries summer reading program · 2015-03-13 · viii executive summary...
TRANSCRIPT

Impact of Virginia Public Libraries’
Summer Reading Program Library of Virginia Year 2 Report March 2015
McREL Kimberly Good, Ph.D. Hsiang-Yeh Ho, Ph.D. Consultant: Analytica, Inc. Michèle Muñoz-Miller, Ph.D. Mackson Ncube, M.S. Herbert M. Turner III, Ph.D.
500 Virginia Street, East, Suite 500
Charleston, WV 25301
424 Church Street – Suite 2000
Nashville, TN 37219
800.624.9120 · mcrel.org

ii
Founded in 1966, McREL International is a not-for-profit corporation with offices in Denver, Colorado; Honolulu, Hawaii; Nashville, Tennessee; Charleston, West Virginia; and Melbourne, Australia. McREL delivers high quality program evaluation services and develops award-winning reports to provide clients with timely information to improve their programs and document their successes. McREL staff members work collaboratively with clients to build their planning, data, and program evaluation capacity through just-in-time consulting and training. McREL’s evaluation services are grounded in the latest research methods and evaluation best practices.
For information about McREL’s research, products, or services, contact
4601 DTC Boulevard, Suite 500 • Denver, CO 80237 • 303.337.0990 •fax 303.337.3005 1003 Bishop Street, Suite 2200 • Honolulu, HI 96813 • 808.664.8175 • fax 808.664.8190 P.O. Box 1348, Charleston, WV 25325 • 304.347.0400 • 800.624.9120 • fax 304.347.0487 424 Church Street, Suite 2000, Nashville, TN 37219 • 615.565.0101 • fax 615.565.0112 112 Trenerry Crescent, Abbotsford, Australia 3067 • 011.61.409442579 (from the U.S.)
[email protected] • www.mcrel.org
This project was made possible in part by the Institute of Museum and Library Services (IMLS) grant number
LS00-14.0047-14, under federal funding to the Library of Virginia. Its contents do not necessarily reflect the positions or policies of the IMLS, Library of Virginia, or any other agency of the U.S. government, and you should not assume endorsement by the federal government.
McREL is an equal employment opportunity/affirmative action employer.
iii
Table of Contents
List of Tables ...................................................................................................................................................... v
List of Figures ..................................................................................................................................................... v
Glossary of Statistical Terms ........................................................................................................................... vi
Executive Summary ........................................................................................................................................ viii
Introduction ........................................................................................................................................................ 1
Impact Study Purpose and Questions ............................................................................................................ 3
Study Design and Methods .............................................................................................................................. 5
Study Sample ................................................................................................................................................ 5
Data Collection Methods ........................................................................................................................... 8
Data Analysis ............................................................................................................................................... 9
Findings ............................................................................................................................................................. 16
What effect does the summer reading program have on participants’ reading outcomes? ........... 16
What was the change in reading outcomes from before participation in the 2013 Summer Reading Program to after participation for children and teens? ................................................. 16
What is the effect of the summer reading program on participants’ reading outcomes as compared to their nonparticipating peers? ..................................................................................... 17
To what extent does participation in the program moderate participants’ reading trajectory (gain versus loss) in comparison to their nonparticipating peers?............................. 18
Does the effect of the summer reading program on reading outcomes differ for children and teens of different backgrounds (e.g., grade, gender, and economically disadvantaged status, minority status, and limited English proficiency status)? .................................................................... 20
Did the effect of the 2013 Summer Reading Program differ by grade (i.e., K, 1-2, 3-5, 6-8, and 9-12)? .................................................................................................................................... 20
Did the effect of the 2013 Summer Reading Program differ by gender? .................................. 23
Did the effect of the 2013 Summer Reading Program differ by economically disadvantaged status? ......................................................................................................................... 24
Did the effect of the 2013 Summer Reading Program differ by limited English proficiency status? .............................................................................................................................. 25
Did the effect of the 2013 Summer Reading Program differ by minority status? .................... 26

iv
Summary of Key Findings .............................................................................................................................. 28
Overall Findings for Study Question 1: What effect does the summer reading program have on participants’ reading outcomes? ........................................................................................................ 28
Overall Findings for Study Question 2: Does the effect of the summer reading program on reading outcomes differ for children and teens of different backgrounds (e.g., grade, gender, economically disadvantaged status, minority status, and limited English proficiency status)? ...... 29
Conclusions and Recommendations ............................................................................................................. 32
References ......................................................................................................................................................... 33
Appendices
Appendix A: Summary of Propensity Score Matching Results
Appendix B: Results of Power Analysis for Individual Library System Impact Studies
Appendix C: Individual Library Systems Impact Analysis
v
List of Tables
Table 1. Library of Virginia Summer Reading Program Impact Study Participating Library Systems . 6
Table 2. Sample Demographic Characteristics by Groups .......................................................................... 7
Table 3. 2012-2013 Assessment Scores by Groups ...................................................................................... 8
Table 4. Selected Library Systems for Individual Impact Analysis ............................................................. 9
Table 5. Outcomes Analysis Contrasts ......................................................................................................... 10
Table 6. Impact Analysis Contrasts ............................................................................................................... 12
Table 7. Gain Score Analysis Contrasts ........................................................................................................ 13
Table 8. Impact Analysis with Interaction Contrasts ................................................................................. 14
Table 9. Gain Scores on Grades K-2 PALS for Summer Reading Program Participants .................... 16
Table 10. Gain Scores on Grades 3-12 SOL for Summer Reading Program Participants ................... 17
Table 11. Comparison of Grades K-2 PALS Posttests: Participants vs. Nonparticipants ................... 17
Table 12. Comparison of Grades 3-12 SOL Posttests: Participants vs. Nonparticipants ..................... 18
Table 13. Comparison of Grades K-2 PALS Reading Gains: Participants vs. Nonparticipants ......... 19
Table 14. Comparison of Grades 3-12 SOL Reading Gains: Participants vs. Nonparticipants........... 19
Table 15. Comparison of Kindergarten PALS Posttests: Participants vs. Nonparticipants ................. 20
Table 16. Comparison of Grades 1-2 PALS Posttests: Participants vs. Nonparticipants ..................... 20
Table 17. Comparison of Grades 3-5 SOL Posttests: Participants vs. Nonparticipants ....................... 21
Table 18. Comparison of Grades 6-8 SOL Posttests: Participants vs. Nonparticipants ....................... 21
Table 19. Comparison of Kindergarten PALS Reading Gains: Participants vs. Nonparticipants ....... 22
Table 20. Comparison of Grades 1-2 PALS Reading Gains: Participants vs. Nonparticipants ........... 22
Table 21. Grades 3-5 SOL Average Reading Gain by Group ................................................................... 23
Table 22. Grades 6-8 SOL Average Reading Gain by Group ................................................................... 23
Table 23. Gender Interaction Effects for Grades K-2 PALS ................................................................... 24
Table 24. Gender Interaction Effects for Grades 3-12 SOL .................................................................... 24
Table 25. Economically Disadvantaged Status Interaction Effect for Grades 3-12 SOL..................... 25
Table 26. Limited English Proficiency Status Interaction Effects for Grades K-2 PALS .................... 26
Table 27. Minority Status Interaction Effects for Grades K-2 PALS ...................................................... 26
Table 28. Minority Status Interaction Effects for Grades 3-12 SOL ....................................................... 27
Table 29. Overall Findings for Study Question 1 ....................................................................................... 29
Table 30. Overall Findings for Study Question 2 – PALS (Grades K-2) ................................................ 31
Table 31. Overall Findings for Study Question 2 – SOL (Grades 3-12) ................................................. 31
List of Figures
Figure. Interaction effect of minority status and program participation on the SOL Comprehension of Fiction outcome ...................................................................................... 27

vi
Glossary of Statistical Terms
Analysis of covariance (ANCOVA) – A statistical technique to control the effects of variables one
does not want to examine in a study. For example, in the Library of Virginia Impact Study, the
variables that were controlled when examining the differences in outcomes for participants and
comparisons included gender, minority status, limited English proficiency, and pretest scores.
Covariate – A variable that is controlled in a study such as gender, minority status, limited English
proficiency, and pretest scores so that the outcomes (e.g., posttest scores) may be examined.
Dependent variable – A variable in which the values are predicted by an independent variable. For
example, performance on reading achievement tests is a dependent variable predicted by the
independent variable (e.g., participation or no participation in the Library of Virginia Summer
Reading Program).
Effect size – Measure of the strength of a relationship and most often referred to as a measure of
practical significance. It is calculated by taking the difference between the participant and
comparison groups’ means and dividing that difference by the standard deviation of the comparison
group’s scores or by the standard deviation of the aggregated scores of both groups.
Hierarchical linear modeling – Statistical modeling used when data are found in nested categories
or levels such as Library of Virginia Summer Reading Program participants in public library systems.
Independent variable – The variable that can be used to predict or explain the values of another
variable. For example, whether or not an individual participated in the Library of Virginia Summer
Reading Program is an individual value and can be used to predict or explain whether there are
differences in performance on achievement tests.
N – The upper case N refers to the number of subjects or cases in a study or the number of
individuals in a population.
n – The lower case n refers the number in a sample (as contrasted with the number in a population)
or the number of cases in a subgroup.
Mean (M) – The arithmetic average which is calculated by adding the values for each case and
dividing by the total number of cases.
p value – This term refers to the probability value or, in other words, the probability that a statistic
could occur by chance or sampling error if the null hypothesis (i.e., no difference) is true.
Power – In the statistical sense, this refers to the ability of a statistical test to detect effects of a
specific size. It takes into account the variance and sample size of a study.

vii
Propensity score matching – A method used to identify a group of comparisons and ensures
baseline equivalence on the observable variables that are known to be associated with the main
outcomes of interest (i.e., reading achievement).
Statistical significance – A finding is said to have statistical significance when the value or measure
of a value is significantly larger or smaller than would be expected by chance alone.
Standard deviation (SD) – This is a descriptive measure of variability or spread of scores around
the mean. The wider the scores are spread, the larger the standard deviation. The standard
deviation is calculated by taking the square root of the variance.
Standard error of the mean (SE) – This statistic indicates how great the mean score of a single
sample is likely to be different from the mean score of the population. It is the standard deviation
of a sample distribution of the mean. The standard error of the mean shows how much the sample
mean differs from the expected value.
Student’s t distribution (t) – A test for statistical significance that uses tables of a statistical
distribution called Student’s t distribution. It is referred to as Student’s t as the author of the article
that made this distribution well known used the pen name “Student.” In articles and reports, it is
often referred to as simply “t.”
t-test – A test of statistical significance which shows the differences between two group means.
z-score (z) – A measure of relative location in a distribution. It provides in standard deviation units
the distance from the mean of a particular score.
References:
Stuart, E. A., & Rubin, D. B. (2007). Best Practices in Quasi-Experimental Designs: Matching
methods for causal inference. In J. Osborne (Ed.), Best Practices in Quantitative Social Science
(Vol. 11, pp. 155-176). Thousand Oaks, CA: Sage.
Vogt, W. P. (1999). Dictionary of statistics and methodology (2nd ed.). Thousand Oaks, CA: Sage.

viii
Executive Summary
McREL International was contracted by the Library of Virginia in April 2013 to study the
impact of the 2013 Summer Reading Program offered by Virginia public libraries to children and
teens and, to a lesser extent, young children (i.e., preschool age and below) who participate. The
study will provide crucial information for public library systems in Virginia to help them understand
the impact of summer reading programs on their school-age patrons and to provide insights for
improving future programming.
Overall, the main purposes of this 33-month study are to: (1) understand how young
children, children, and teens use the summer reading program; (2) understand how the summer
reading program influences reading skills and outcomes; (3) understand how the summer reading
program may differentially impact different groups of participants, and (4) examine the long-term
impact on reading outcomes for participants. The Year 2 report specifically focuses on two main
impact questions:
1. What effect does the summer reading program have on participants’ reading outcomes?
2. Does the effect of the summer reading program on reading outcomes differ for children
and teens of different backgrounds (e.g., grade, gender, economically disadvantaged
status, minority status, and limited English proficiency status)?
The two data sources used for the study included the (1) 2013 and 2014 summer reading
program participant lists available through the EvancedTM Summer Reader database; and (2) student
demographic and achievement data (i.e., the Virginia Standards of Learning 1 and the Phonological
Awareness Literacy Screening 2) supplied by the Virginia Department of Education for the
2012-2013 and 2013-2014 school years. It should be noted that, after data cleaning3 and data
merging between the EvancedTM Summer Reader database and the Virginia Department of
Education database, 4,598 (31.6%) 2013 Summer Reading Program participants remained in the
study.
1 Standards of Learning tests in reading, writing, mathematics, science, and history/social science measure the success of
students in meeting the Virginia Board of Education’s expectations for learning and achievement. All items on the Standards of
Learning tests are reviewed by Virginia classroom teachers for accuracy and fairness. Teachers also assist the state Board of
Education in setting proficiency standards for the tests. More detail about the Standards of Learning tests can be found at
http://www.doe.virginia.gov/testing/index.shtml.
2 Phonological Awareness Literacy Screening is a scientifically based screening that measures young children’s developing
knowledge of important literacy fundamentals and offers guidance to teachers for tailoring instruction to each child’s specific
needs. More detail about the Phonological Awareness Literacy Screening can be found at http://pals.virginia.edu.
3 Within the EvancedTM Summer Reader database, participant data were entered in a variety of ways, which may result in a
participant having multiple records based on the number of books read. Hence, it was necessary for the researchers to clean
and restructure the dataset so that each participant had only one record that included basic demographic information and the
number of books read for the analyses. Initially, researchers received a total of 520,075 records from Evanced Solutions. After
a series of data cleaning (i.e., removed the records without book titles, with invalid or missing birthdays, and that were outside
of the 62 school districts in which the participating library systems serve), 183,146 (35.2%) records remained in the dataset,
which represented 14,575 individuals across 40 library systems and 59 school districts. More details about the data cleaning and
merging were reported in the Impact of Virginia Public Libraries’ Summer Reading Program: Library of Virginia Year 1 Report (Good,
Ho, & Fryman, 2014).
ix
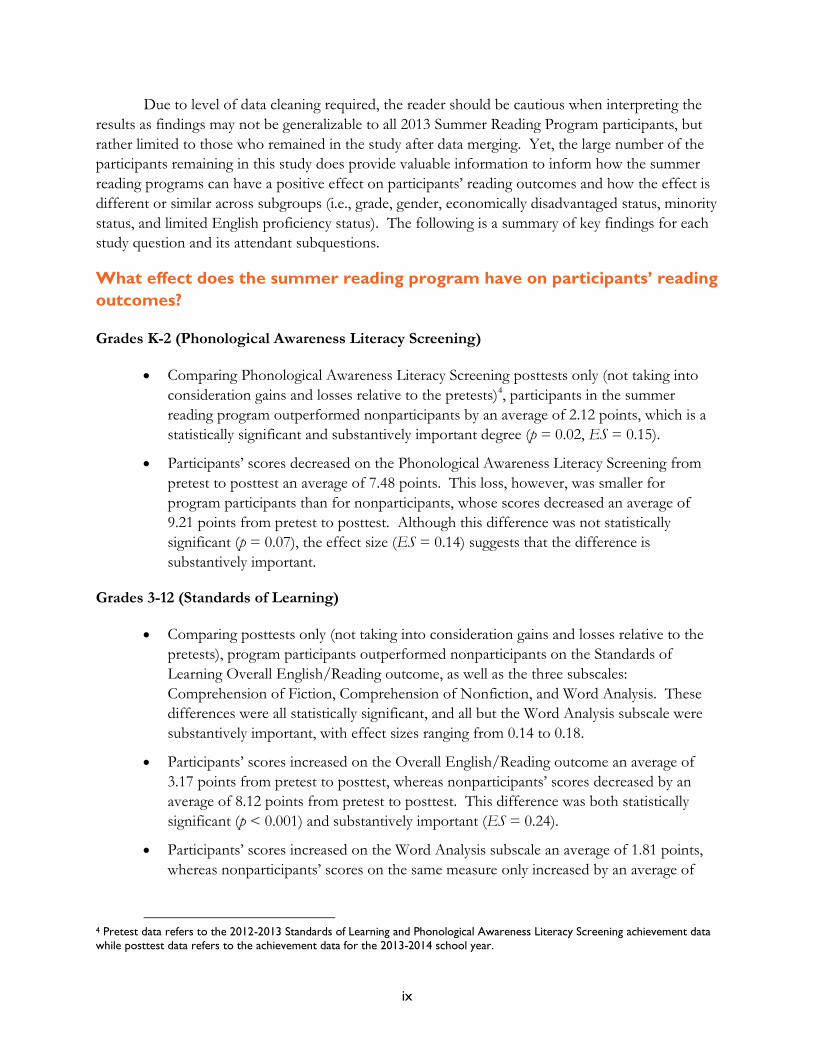
Due to level of data cleaning required, the reader should be cautious when interpreting the
results as findings may not be generalizable to all 2013 Summer Reading Program participants, but
rather limited to those who remained in the study after data merging. Yet, the large number of the
participants remaining in this study does provide valuable information to inform how the summer
reading programs can have a positive effect on participants’ reading outcomes and how the effect is
different or similar across subgroups (i.e., grade, gender, economically disadvantaged status, minority
status, and limited English proficiency status). The following is a summary of key findings for each
study question and its attendant subquestions.
What effect does the summer reading program have on participants’ reading
outcomes?
Grades K-2 (Phonological Awareness Literacy Screening)
Comparing Phonological Awareness Literacy Screening posttests only (not taking into
consideration gains and losses relative to the pretests)4, participants in the summer
reading program outperformed nonparticipants by an average of 2.12 points, which is a
statistically significant and substantively important degree (p = 0.02, ES = 0.15).
Participants’ scores decreased on the Phonological Awareness Literacy Screening from
pretest to posttest an average of 7.48 points. This loss, however, was smaller for
program participants than for nonparticipants, whose scores decreased an average of
9.21 points from pretest to posttest. Although this difference was not statistically
significant (p = 0.07), the effect size (ES = 0.14) suggests that the difference is
substantively important.
Grades 3-12 (Standards of Learning)
Comparing posttests only (not taking into consideration gains and losses relative to the
pretests), program participants outperformed nonparticipants on the Standards of
Learning Overall English/Reading outcome, as well as the three subscales:
Comprehension of Fiction, Comprehension of Nonfiction, and Word Analysis. These
differences were all statistically significant, and all but the Word Analysis subscale were
substantively important, with effect sizes ranging from 0.14 to 0.18.
Participants’ scores increased on the Overall English/Reading outcome an average of
3.17 points from pretest to posttest, whereas nonparticipants’ scores decreased by an
average of 8.12 points from pretest to posttest. This difference was both statistically
significant (p < 0.001) and substantively important (ES = 0.24).
Participants’ scores increased on the Word Analysis subscale an average of 1.81 points,
whereas nonparticipants’ scores on the same measure only increased by an average of
4 Pretest data refers to the 2012-2013 Standards of Learning and Phonological Awareness Literacy Screening achievement data
while posttest data refers to the achievement data for the 2013-2014 school year.

x
0.75 points. This difference was statistically significant (p < 0.001) and substantively
important (ES = 0.13).
Does the effect of the summer reading program on reading outcomes differ
for children and teens of different backgrounds (e.g., grade, gender,
economically disadvantaged status, minority status, and limited English
proficiency status)?
Grades K-2 (Phonological Awareness Literacy Screening)
Comparing Phonological Awareness Literacy Screening posttests only (not taking into
consideration gains and losses relative to the pretests), kindergarten participants
outperformed their nonparticipant peers by an average of 2.28 points. This difference
was statistically significant (p = 0.03) and substantively important (ES = 0.16). First and
second grade participants also outperformed their nonparticipant peers on the posttest
by an average of 1.29 points. This difference, however, was not statistically significant
(p = 0.38), nor was it substantively important (ES = 0.09).
Kindergarten participants’ scores decreased on the Phonological Awareness Literacy
Screening from pretest to posttest by an average of 12.54 points. This loss, however,
was smaller for program participants than their nonparticipant peers whose scores
decreased an average of 14.46 points from pretest to posttest. This difference was not
statistically significant (p = 0.07) but was substantively important (ES = 0.19).
First and second grade participants’ scores also decreased on the Phonological
Awareness Literacy Screening from pretest to posttest by an average of 1.05 points. This
loss was also smaller for participants than their nonparticipant peers whose scores
decreased an average of 2.36 points from pretest to posttest. This difference was not
statistically significant (p = 0.40), nor was it substantively important (ES = 0.09).
There were no interaction effects found for gender, limited English proficiency status, or
minority status.
Grades 3-12 (Standards of Learning)
Comparing the scores of the Standards of Learning Overall English/Reading outcome
and the three subscales (Comprehension of Fiction, Comprehension of Nonfiction, and
Word Analysis) from posttests only (not taking into consideration gains and losses
relative to the pretests), participants in grades 3-5 and 6-8 outperformed their
nonparticipant peers. All of the differences were statistically significant. The effect sizes
ranged from 0.13 to 0.19 for grades 3-5 and 0.10 to 0.18 for grades 6-8.
Grades 3-5 participants’ scores increased on the Overall English/Reading outcome an
average of 4.78 points from pretest to posttest, whereas their nonparticipant peers’
scores decreased by an average of 7.97 points from pretest to posttest. This difference
was both statistically significant (p < 0.001) and educationally meaningful (ES = 0.26).

xi
Grades 3-5 participants’ scores also increased on the Word Analysis subscale an average
of 2.12 points from pretest to posttest, whereas their nonparticipant peers’ scores only
increased by an average of 0.86 points. This difference was both statistically significant
(p < 0.001) and substantively important (ES = 0.15).
Grades 6-8 participants’ scores decreased on the Overall English/Reading outcome an
average of 1.03 points from pretest to posttest. However, their nonparticipant peers’
scores decreased even more, by an average of 9.21 points from pretest to posttest. This
difference was both statistically significant (p < 0.001) and substantively important
(ES = 0.19).
Grades 6-8 participants’ scores increased on the Word Analysis subscale an average of
1.02 points from pretest to posttest, whereas their nonparticipant peers’ scores only
increased by an average of 0.21 points. Although this difference was statistically
significant (p = 0.03), the small effect size suggests that it was not substantively
important (ES = 0.10).
There was no interaction effect of gender or economically disadvantaged status.
There was an interaction effect of minority status on the Comprehension of Fiction
subscale scores for program participants. Although nonminority students generally
outperformed minority students in both conditions, minority students’ scores improved
to a significantly greater degree by participating in the summer reading program.
Overall, findings of this study are encouraging as it is a large-scale study design involving a
total of 35 public library systems across the state of Virginia. Specifically, findings from this study
suggests that students who attended the summer reading programs offered by Virginia’s library
systems performed better academically and experienced greater gains in their academic performance
than their nonparticipating peers. Participants outperformed nonparticipants on posttests across all
measures and all grade groups (i.e., K-2, 3-5, and 6-8). While the youngest students in the sample
(grades K-2) demonstrated losses from pretest to posttest, those losses were even greater for
nonparticipants. The effect of the summer reading program did not differ by gender, limited
English proficiency status, or economically disadvantaged status. However, there was some
differentiation for minority students in grades 3-12. Specifically, the summer reading program
demonstrated a greater effect for minority students than nonminority students for the
Comprehension of Fiction subscore.
Taken together, these findings suggest that summer reading programs may prevent summer
reading loss or even facilitate learning gains when schools are not in session. Summer reading
programs may also serve as an alternative avenue to close achievement gaps between minority
groups and their White counterparts. To investigate how and why summer reading programs work
to support student reading outcomes, future research is warranted. For instance, what are the key
ingredients of summer reading programs that support student achievement? Such a study may
advance the field to identify the evidence-based practices that support student reading outcomes.

1
Introduction
McREL International was contracted by the Library of Virginia in April 2013 to study the
impact of the 2013 Summer Reading Program offered by Virginia public libraries to children and
teens and, to a lesser extent, young children (i.e., preschool age and below) who participate. The
study provides information for public library systems in Virginia to help them understand the impact
of summer reading programs on their school-age patrons. Further, the study contributes to the
larger collection of research literature about the impact of summer reading programs on students’
academic achievement. Funding for the study is provided by the Library of Virginia through the
Institute of Museum and Library Services, which serves as the primary source of federal support for
the nation’s 123,000 libraries and 17,500 museums.
To encourage summer reading and prevent summer reading loss, the Library of Virginia
provides support and materials for the summer reading program to each of the 91 public library
systems in the Commonwealth of Virginia. The summer reading program is offered for four target
populations: young children (birth to age 5), children (ages 6 to 12), teens (ages 13 to 17), and adults
(age 18 and older)5. The goals of the summer reading program are to
encourage children and teens to continue reading during the summer with the hope that
they will discover that reading can be fun and enjoyable;
provide safe and fun activities for children and teens to enjoy while they are out of
school; and
build healthy communities by offering programs and services to develop the
“40 Developmental Assets” as defined by the Search Institute (2007).
Research indicates that the summer months when children are not involved in formal
education are particularly critical to students’ reading achievement. For instance, Matthews (2010)
reports that the difference in reading gains between low- and high-income students does not occur
during the school year, but rather during the summer months. Cooper, Nye, Charlton, Lindsay, and
Greathouse (1996) conducted a meta-analysis of 39 studies and indicated that the achievement loss
occurring over summer break is equivalent to one month of grade-level instruction. McGill-Franzen
and Allington (2004) discovered that summer reading loss during the elementary grades accumulates
to an achievement gap of 18 months by the end of sixth grade, and such a lag accumulates to two or
more years in reading achievement by the end of middle school. Other researchers have found that
achievement gains in reading were significantly higher from fall to spring than from spring to spring
when the summer months are included in analyses, indicating the presence of summer reading loss
(Borman & D’Agostino, 1996). Furthermore, summer learning loss is even greater for low-
achieving students and students from economically disadvantaged backgrounds, such as those whose
parents did not pursue postsecondary education and those with limited access to reading materials at
home (Matthews, 2010; McGill-Franzen & Allington, 2004; Mraz & Rasinski, 2007).
5 Although adults are encouraged to participate in the summer reading program, they are not the main population of interest
for this study.

2
The research on summer reading loss supports the need to provide students—particularly
low-achieving students from low-income families—with opportunities to engage in reading and have
access to reading materials during the summer months. These findings have led stakeholders to
consider alternative solutions that attempt to level the playing field for reading achievement and
prevent reading loss over the summer months. The research on these alternatives indicates that
summer reading programs offered by public libraries have positive impacts on students’ reading
skills and enthusiasm about reading (Matthews, 2010). An experimental study comparing library
summer reading programs to traditional summer camps without a reading component suggests that
students in summer reading programs read significantly better than students attending summer
programs not focused on reading (Celano & Neuman, 2001), indicating that library time enhances
students’ reading achievement and skills more than recreational types of summer programs.
Another study that investigated the effects of a school-based summer reading program for
kindergarten and first-grade students at risk for poor reading achievement found significant results
favoring summer reading programs (Luftig, 2003).
Although the literacy community strongly encourages and advocates the use of summer
reading programs, more studies are needed to understand program effectiveness and the impact on
children from various backgrounds (e.g., those students with varying socioeconomic status or
achievement status) and grade levels (e.g., K-12), and whether program effects are moderated by
these demographic and achievement differences. The study commissioned by the Library of
Virginia is designed to further the research in this area.

3
Impact Study Purpose and Questions
Overall, the main purposes of this 33-month impact study are to: (1) understand how young
children, children, and teens use the summer reading program; (2) understand how the summer
reading program influences reading skills and outcomes; (3) understand how the summer reading
program may differentially impact different groups of participants, and (4) examine the long-term
impact on reading outcomes for participants. Four primary study questions and several
subquestions guide the study being conducted by McREL:
1. How do children and teens participate in the summer reading program sponsored by
Virginia public libraries?
a. How many books do participating children and teens read during the summer
reading program timeframe?
b. What are the reading levels of the books read by summer reading program
participants? To what extent are participants reading books at or above their age
level?
2. What effect does the summer reading program have on participants’ reading outcomes?
a. What was the change in reading outcomes from before participation in the
2013 Summer Reading Program to after participation for children and teens?
b. What is the effect of the summer reading program on participants’ reading outcomes
as compared to their nonparticipating peers?
c. To what extent does participation in the program moderate participants’ reading
trajectory (gain versus loss) in comparison to their nonparticipating peers?
3. Does the effect of the summer reading program on reading outcomes differ for children
and teens of different backgrounds (e.g., grade, gender, economically disadvantaged
status, minority status and limited English proficiency status)?6
a. Did the effect of the 2013 Summer Reading Program differ by grade?
b. Did the effect of the 2013 Summer Reading Program differ by gender?
c. Did the effect of the 2013 Summer Reading Program differ by economically
disadvantaged status?
d. Did the effect of the 2013 Summer Reading Program differ by students’ minority
status?
e. Did the effect of the 2013 Summer Reading Program differ by students’ limited
English proficiency status?
6 In the original impact study plan, McREL evaluators intended to address the question: Do children and teens of different
backgrounds (e.g., age, gender, and socioeconomic status) experience the program and its outcomes differently? However, this study
will only focus on understanding group differences in outcomes; questions related to subgroup differences in program
experiences cannot be answered because such data were not collected via the EvancedTM Summer Reader database. Hence,
research question #3 was revised to reflect this limitation.
4
4. What is the long-term impact of participation in the summer reading program on
children’s and teens’ reading outcomes?
a. Does the program’s impact on reading outcomes last more than one year following
participation?
b. How many children participate in the summer reading program for more than one
year, and what are the characteristics of these repeat participants?
c. How do the reading outcomes and growth patterns of repeat participants differ from
nonparticipants and from those participating only during a single summer?
Findings related to the first study question are reported in the Impact of Virginia Public
Libraries’ Summer Reading Program: Library of Virginia Year 1 Report (Good, Ho, & Fryman, 2014). This
Year 2 report focuses on the second and third study questions. Specifically, the second question is
the crux of the study. McREL researchers used this question to document and explore reading
achievement and outcomes for participants. Additionally, the extent to which participants have
better reading outcomes than their nonparticipating peers and the extent to which participation
mitigates summer reading loss were also examined by the researchers. To answer study question 2,
McREL researchers relied on achievement and assessment data collected and compiled by the
Virginia Department of Education as part of their regular performance and accountability measures.
The third question aims to understand the extent to which participant outcomes differ within
subgroups compared to their nonparticipating peers. Specifically, were the effects of summer
reading program participation stronger for some groups than for others?
Findings for study question 4 will be reported in the third and final report, which will focus
on the longitudinal investigation of the extent to which the summer reading program may have a
long-term impact on children’s reading outcomes and trajectories. This final report is scheduled to
be delivered to the Library of Virginia in December 2015.

5
Study Design and Methods
During the summer of 2013, a total of 46 public library systems (20 county, 15 city, and
11 multi-jurisdictional) agreed to participate in the Library of Virginia summer reading program
impact study. These 46 public library systems include 180 buildings (60 county, 66 city, and
54 multi-jurisdictional) that are participating in the study. Each participating public library system
executed a memorandum of agreement with the Library of Virginia that documented the
requirements for participation in the study.
To examine the effect of the 2013 Summer Reading Program on participant outcomes,
McREL’s researchers conducted a quasi-experimental study using propensity score matching
methods to identify a group of comparisons who are from the same school districts as participants
and who share similar student-level attributes (e.g., race, gender, age, economically disadvantaged
status, limited English proficiency status, and achievement level) prior to program participation
(Stuart & Rubin, 2007). The propensity score matching methods ensure baseline equivalence on the
observable variables that are known to be associated with the main outcomes of interest (i.e., reading
achievement) (Stuart & Rubin, 2007). In the field of educational research where random assignment
is not feasible, propensity score matching has been used increasingly to help researchers draw causal
inferences for programs like the 2013 Summer Reading Program (Stuart, 2010).
Study Sample
As part of the study, the Library of Virginia utilized the EvancedTM Summer Reader database,
an online tracking system developed by Evanced Solutions LLC to track student participation status,
and collaborated with the Virginia Department of Education to secure student achievement data for
the main outcomes of interest. Because the EvancedTM Summer Reader database and the
Department’s database are two independent databases, McREL researchers conducted data cleaning
and a data merging process to link participant data with the Virginia Department of Education’s
data. According to the EvancedTM Summer Reader database, a total of 14,575 children between the
ages of zero and 17 participated in the 2013 Summer Reading Program. After the data cleaning and
merging process, a total of 4,598 participants between kindergarten and 12th grade remained in the
dataset and were included in this study.7 The data represented a total of 35 public library systems
(Table 1)8. More details about the data cleaning and merging process are available in the Impact of
Virginia Public Libraries’ Summer Reading Program: Library of Virginia Year 1 Report (Good et al., 2014).
7 Before merging the Virginia Department of Education’s data with the EvancedTM Summer Reader data, participants who were
homeschooled or in preschool or younger were removed from the dataset because the Department’s data were only available
for children in kindergarten and above.
In addition, in the Year 1 report, there were 4,657 participants left after the merging; however, there was need to remove
59 more participants for the Year 2 study due to missing demographic information or Phonological Awareness Literacy Screening data. Since propensity score matching requires complete information, any cases missing key demographic
information were removed. However, the majority of these cases were removed because Phonological Awareness Literacy
Screening data were unavailable for those participants.
8 Eleven public library systems that agreed to be a part of the original study did not have any participants remaining following
the data cleaning and merging process; thus, the reason for only 35 public library systems being listed as participating in the
impact study.

6
Table 1. Library of Virginia Summer Reading Program Impact Study Participating Library
Systems
COUNTY
(building numbers)
CITY
(building numbers)
MULTI-JURISDICTIONAL (REGIONAL)
(building numbers)
Allegheny County (1)
Amherst County (2)
Augusta County (5)
Bedford County (6)
Buchanan County (1)
Campbell County (4)
Caroline County (4)
Chesterfield County (9)
Essex County (1)
Orange County (3)
Pittsylvania County (5)
Powhatan County (1)
Pulaski County (2)
Roanoke County (6)
Russell County (2)
Alexandria City (5)
Chesapeake City (7)
Hampton City (4)
Newport News City (4)
Norfolk City (12)
Petersburg City (1)
Poquoson City (1)
Portsmouth City (4)
Radford City (1)
Roanoke City (7)
Salem City (1)
Staunton City (1)
City of Virginia Beach (9)
Waynesboro City (1)
Albemarle County, Greene County, Louisa County, Nelson County, Charlottesville City (8)
Brunswick County, Greensville County,
Emporia City (2)
Clarke County, Frederick County,
Winchester City (3)
Floyd County, Montgomery County (4)
Goochland County, Hanover County, King and Queen County, King William County (10)
Prince George County, Dinwiddie County, Hopewell City (7)
Stafford County, Westmoreland County,
Spotsylvania County, Fredericksburg City (8)
Number = 14 (52) Number = 14 (58) Number = 7 (42)
While requesting data from the Virginia Department of Education for participants in the
summer reading program, researchers also requested data for all other students who were from the
same school districts as the participating students. Using this data pool, McREL researchers
conducted propensity score matching to identify a group of 4,598 comparisons who were similar to
the participating group (n = 4,598) in the following characteristics:
Demographic characteristics
o Gender (i.e., male or female)
o Race (i.e., White, African American, Hispanic, Asian, Hawaiian or other Pacific
Islander, American Indian, or multiracial)
o Grade
o Economically disadvantaged status (i.e., free or reduced-price meal eligible, receives
Temporary Assistance for Needy Families, Medicaid eligible, and/or identified as
experiencing homelessness)
o Limited English proficiency status9
2012-2013 achievement data (assessment scores before participation in the 2013 Summer
Reading Program)
o Kindergarten group: Phonological Awareness Literacy Screening rhyme awareness
and beginning sounds awareness scores
9 Limited English proficiency data were only available within the Phonological Awareness Literacy Screening dataset.
7
o Grades 1-3: Phonological Awareness Literacy Screening Entry Level Sum Score,
instructional reading level, and above/below benchmark status
o Grades 3-12: Virginia Standards of Learning scaled score, Comprehension of Printed
Materials subscale score, Word Analysis Strategies and Information Resources
subscale score, and proficiency level.
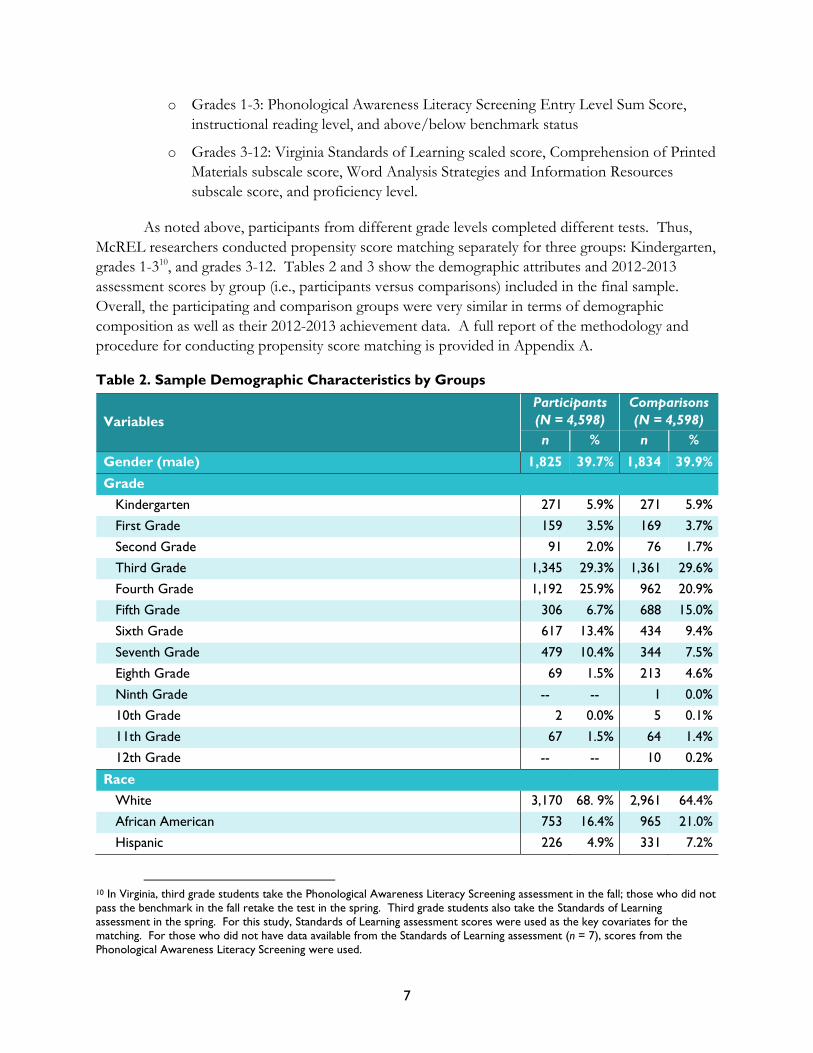
As noted above, participants from different grade levels completed different tests. Thus,
McREL researchers conducted propensity score matching separately for three groups: Kindergarten,
grades 1-310, and grades 3-12. Tables 2 and 3 show the demographic attributes and 2012-2013
assessment scores by group (i.e., participants versus comparisons) included in the final sample.
Overall, the participating and comparison groups were very similar in terms of demographic
composition as well as their 2012-2013 achievement data. A full report of the methodology and
procedure for conducting propensity score matching is provided in Appendix A.
Table 2. Sample Demographic Characteristics by Groups
Variables
Participants
(N = 4,598)
Comparisons
(N = 4,598)
n % n %
Gender (male) 1,825 39.7% 1,834 39.9%
Grade
Kindergarten 271 5.9% 271 5.9%
First Grade 159 3.5% 169 3.7%
Second Grade 91 2.0% 76 1.7%
Third Grade 1,345 29.3% 1,361 29.6%
Fourth Grade 1,192 25.9% 962 20.9%
Fifth Grade 306 6.7% 688 15.0%
Sixth Grade 617 13.4% 434 9.4%
Seventh Grade 479 10.4% 344 7.5%
Eighth Grade 69 1.5% 213 4.6%
Ninth Grade -- -- 1 0.0%
10th Grade 2 0.0% 5 0.1%
11th Grade 67 1.5% 64 1.4%
12th Grade -- -- 10 0.2%
Race
White 3,170 68. 9% 2,961 64.4%
African American 753 16.4% 965 21.0%
Hispanic 226 4.9% 331 7.2%
10 In Virginia, third grade students take the Phonological Awareness Literacy Screening assessment in the fall; those who did not
pass the benchmark in the fall retake the test in the spring. Third grade students also take the Standards of Learning
assessment in the spring. For this study, Standards of Learning assessment scores were used as the key covariates for the
matching. For those who did not have data available from the Standards of Learning assessment (n = 7), scores from the
Phonological Awareness Literacy Screening were used.

8
Variables
Participants
(N = 4,598)
Comparisons
(N = 4,598)
n % n %
Asian 215 4.7% 119 2.6%
Hawaiian or Other Pacific Islander 11 0.2% 12 0.3%
American Indian 5 0.1% 13 0.3%
Multiracial 218 4.7% 197 4.3%
Disadvantaged Status 1,157 25.2% 1,194 26.0%
Limited English Proficiency (limited English proficiency) a 13 0.3% 14 0.3% a Limited English proficiency data were only available for children from kindergarten to third grade (e.g., Phonological
Awareness Literacy Screening data).
Table 3. 2012-2013 Assessment Scores by Groups
Variables Participants Comparisons t-test
p value n M SD n M SD
PALS Entry Level Sum Score 528 68.19 18.62 528 67.94 19.48 0.834
Below PALS benchmark 528 0.04 0.20 528 0.04 0.20 0.876
PALS Rhyme Awareness Score 271 8.90 1.86 271 8.90 2.01 0.982
PALS Beginning Sound Awareness Score 271 9.22 1.66 271 9.12 1.89 0.514
Instructional Reading Level a 257 7.20 3.99 257 7.18 4.11 0.939
SOL Scaled Score 4,070 467.08 62.56 4,070 466.23 64.25 0.545
SOL Comprehension of Printed Materials
subscale score 4,070 36.49 6.78 4,070 36.42 6.92 0.624
SOL Word Analysis Strategies and
Information Resources subscale score 4,070 36.51 6.65 4,070 36.40 6.77 0.471
SOL Proficiency level b 4,070 4.18 0.66 4,070 4.17 0.70 0.494
Note. PALS = Phonological Awareness Literacy Screening; SOL = Standards of Learning a Instructional Reading Level: 1 = Readiness; 2 = Between readiness and preprimer; 3 = Preprimer; 4 = Between preprimer
and primer; 5 = Primer; 6 = Between primer and first grade; 7 = First grade; 8 = Between first and second grade; 9 = Second
grade; 10 = Between second and third grade; 11 = Third grade; 12 = Between third and fourth grade; 13 = Fourth grade; 14 = Between fourth and fifth grade; 15 = Fifth grade; 16 = Between fifth and sixth grade; 17 = Sixth grade; 18 = Not enough
information to designate level integer. b Proficiency level was coded into six categories: 1 = Fail/Does Not Meet; 2 = Fail/Below Basic; 3 = Fail/Basic;
4 = Pass/Proficient; 5 = Pass/Advanced; 6 = Advanced/College Path.
Data Collection Methods
Two data sources were used in the Year 2 study. First, in the fall of 2013, McREL
researchers secured the list of 2013 Summer Reading Program participants via the EvancedTM
Summer Reader database. 11 More information about the EvancedTM Summer Reader database is
described in the Year 1 report (see Good et al., 2014).
11 Not all of the 2013 Summer Reading Program participants were retained in this study. Only the participants who remained
in the dataset after merging the EvancedTM Summer Reader and Virginia Department of Education databases were included in
this study (see the Study Sample section for more detail).

9
Second, in fall 2013, researchers requested students’ demographic and 2012-2013 Standards
of Learning and Phonological Awareness Literacy Screening achievement data (referred as pretest
data hereinafter) from the Virginia Department of Education for the purpose of conducting
propensity score matching to identify a group of comparisons. The list of variables supplied by the
Department is described in the Study Sample section (p. 5). In the fall of 2014, the researchers
requested student achievement data from the 2013-2014 Standards of Learning and Phonological
Awareness Literacy Screening (i.e., posttest data) for the outcome analysis, including this data for all
students from the same school districts in which the 2013 Summer Reading Program participants
were located. Using this data pool, the researchers were able to link participant and comparison data
with their respective posttest data.
Data Analysis
In addition to examining the overall impact of the 2013 Summer Reading Program on
participants, the Library of Virginia is also interested in examining the impact of the summer reading
program on individual library systems. Towards that end, researchers conducted a power analysis to
identify a list of library systems that had sufficient numbers of participants and comparisons to
provide enough power to detect any meaningful effects within individual library systems. The
results of the power analysis identified 10 library systems that were included in further individual
library system level analyses (see Table 4). A summary of the power analysis is provided in
Appendix B. The results of the impact level analyses conducted for these 10 library systems are
contained in Appendix C.
Table 4. Selected Library Systems for Individual Impact Analysis
Library System Number of Participants
Number of Comparisons
Total Number of Subjects
Hampton City 106 121 227
Bedford County 192 69 261
Clarke County, Frederick County, Winchester City 154 145 299
Albemarle County, Greene County, Louisa County, Nelson County, Charlottesville City
67 233 300
Roanoke County 246 107 353
Goochland County, Hanover County, King and
Queen County, King William County 137 217 354
Chesapeake City 503 293 796
Stafford County, Westmoreland County,
Spotsylvania County, Fredericksburg City 670 444 1,114
Chesterfield County 720 489 1,209
City of Virginia Beach 873 567 1,440
To answer the Year 2 study questions, McREL researchers used STATA 13, a data analysis
and statistical software package, to complete the analyses. The analyses included computing
unadjusted means and standard deviations, two-level hierarchical linear modeling, and regression.
All analyses were conducted on complete cases, meaning that any student with missing data on any
of the variables included in the analysis model were removed. Complete case analysis is a simple and

10
straightforward method for dealing with missing data that can be as effective as more sophisticated
methods when the data are missing at random (Allison, 2001). This method was appropriate to use
here due to the study’s design, outcome measures, and the nature of missing data on demographic
variables. First, being that this study was a quasi-experimental design, it would be inappropriate to
impute outcome scores. For this reason, observations with missing posttest data were deleted.
Another issue with the data was observations with missing pretests. These observations were
removed because in gain score analyses, pretest measures were used to construct the gain scores. As
such, removing observations with missing pretest scores across the analyses helped to maintain
comparable sample sizes. The last reason for using complete case analysis was that demographic
variables either had too much missing data to use (i.e., disadvantaged status at grades K-2 and
limited English proficiency at grades 3-12) or very little missing data. After removing demographic
variables with large amounts of missing data, removing observations with missing data on the
remaining demographic variables did not significantly decrease the sample size. The following
section describes the analysis model and contrasts for each of the study questions that were
addressed in the Year 2 study.
1. What effect does the summer reading program have on participants’ reading outcomes?
a. What was the change in reading outcomes from before participation in the
2013 Summer Reading Program to after participation for children and teens?
In order to answer this study question, the researchers compared raw unadjusted means and
standard deviations of students participating in the 2013 Summer Reading Program before and after
program participation. Reading outcomes for the participants were described by computing the
pretest and posttest means and standard deviations for each outcome of interest. Then, the reading
gain was created by computing the difference between the pretest and posttest scores to produce a
gain score for each program participant in the analysis, and then computing the average gain score
across participants. There was no comparison group used for this question and results are
descriptive only. As shown in Table 5, students in grades K-2 and 3-12 were analyzed separately due
to different assessments being administered at the different grade levels. The table also shows which
outcomes the researchers used for each sample.
Table 5. Outcomes Analysis Contrasts
Contrasts
Program participants before and after program participation.
Sample Pretest Posttest
Grades K-2 PALS Entry Level Sum Score 2013 PALS Entry Level Sum Score 2014
Grades 3-12 SOL Scaled Score 2013 SOL Scaled Score 2014
Grades 3-12 SOL Word Analysis 2013 SOL Word Analysis 2014
Note. PALS = Phonological Awareness Literacy Screening; SOL = Standards of Learning
11
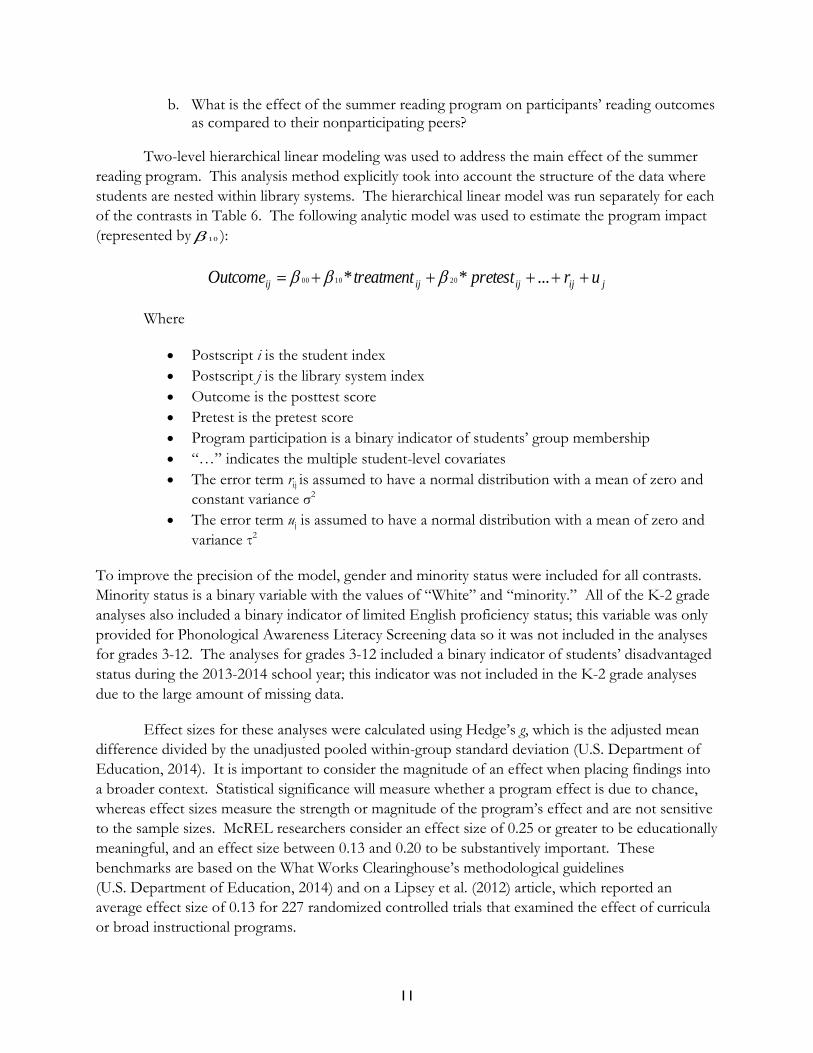
b. What is the effect of the summer reading program on participants’ reading outcomes as compared to their nonparticipating peers?
Two-level hierarchical linear modeling was used to address the main effect of the summer
reading program. This analysis method explicitly took into account the structure of the data where
students are nested within library systems. The hierarchical linear model was run separately for each
of the contrasts in Table 6. The following analytic model was used to estimate the program impact
(represented by 10 ):
jijijijij urpretesttreatmentOutcome ...** 201000
Where
Postscript i is the student index
Postscript j is the library system index
Outcome is the posttest score
Pretest is the pretest score
Program participation is a binary indicator of students’ group membership
“…” indicates the multiple student-level covariates
The error term rij is assumed to have a normal distribution with a mean of zero and
constant variance σ2
The error term uj is assumed to have a normal distribution with a mean of zero and
variance τ2
To improve the precision of the model, gender and minority status were included for all contrasts.
Minority status is a binary variable with the values of “White” and “minority.” All of the K-2 grade
analyses also included a binary indicator of limited English proficiency status; this variable was only
provided for Phonological Awareness Literacy Screening data so it was not included in the analyses
for grades 3-12. The analyses for grades 3-12 included a binary indicator of students’ disadvantaged
status during the 2013-2014 school year; this indicator was not included in the K-2 grade analyses
due to the large amount of missing data.
Effect sizes for these analyses were calculated using Hedge’s g, which is the adjusted mean
difference divided by the unadjusted pooled within-group standard deviation (U.S. Department of
Education, 2014). It is important to consider the magnitude of an effect when placing findings into
a broader context. Statistical significance will measure whether a program effect is due to chance,
whereas effect sizes measure the strength or magnitude of the program’s effect and are not sensitive
to the sample sizes. McREL researchers consider an effect size of 0.25 or greater to be educationally
meaningful, and an effect size between 0.13 and 0.20 to be substantively important. These
benchmarks are based on the What Works Clearinghouse’s methodological guidelines
(U.S. Department of Education, 2014) and on a Lipsey et al. (2012) article, which reported an
average effect size of 0.13 for 227 randomized controlled trials that examined the effect of curricula
or broad instructional programs.

12
In addition to the main impact models listed in Table 6 below, impacts were also estimated
for the following grade level subgroups: K, 1-2, 3-5, and 6-8. Impacts were not estimated for the
Grades 9-12 subgroup due to an insufficient sample size.
Table 6. Impact Analysis Contrasts
Contrasts
Program participants versus matched comparison students at the posttest assessment.
Sample Outcome Measure Covariates
Grades K-2 PALS Entry Level Sum Score 2014
PALS Entry Level Sum Score 2013
Gender
Minority
Limited English Proficiency
Grades 3-12 SOL Scaled Score 2014
SOL Scaled Score 2013
Gender
Minority
Economically Disadvantaged
Grades 3-12 SOL Demonstrated Comprehension of Fiction Texts 2014
SOL Comprehension of Printed Materials 2013
Gender
Minority
Economically Disadvantaged
Grades 3-12 SOL Demonstrated Comprehension of
Nonfiction Texts 2014
SOL Comprehension of Printed Materials 2013
Gender
Minority
Economically Disadvantaged
Grades 3-12 SOL Word Analysis 2014
SOL Word Analysis 2013
Gender
Minority
Economically Disadvantaged
Note. PALS = Phonological Awareness Literacy Screening; SOL = Standards of Learning
c. To what extent does participation in the program moderate participants’ reading
trajectory (gain versus loss) in comparison to their nonparticipating peers?
Two-level hierarchical linear modeling with gain scores was used as the dependent variable
to answer this question (see contrasts in Table 7). Each student’s gain score was the difference
between the outcome measure and pretest measure. The statistical model was similar to the one
used to measure the main impact, however, the model used to answer this study question used the
pretest to form the gain score instead of using the pretest as an independent variable as was done in
the main model. The analytic model utilized was as follows:
jijijij urtreatmentGainScore ..*1000
Where
Gain score = posttest measure – pretest measure
Postscript i is the student index
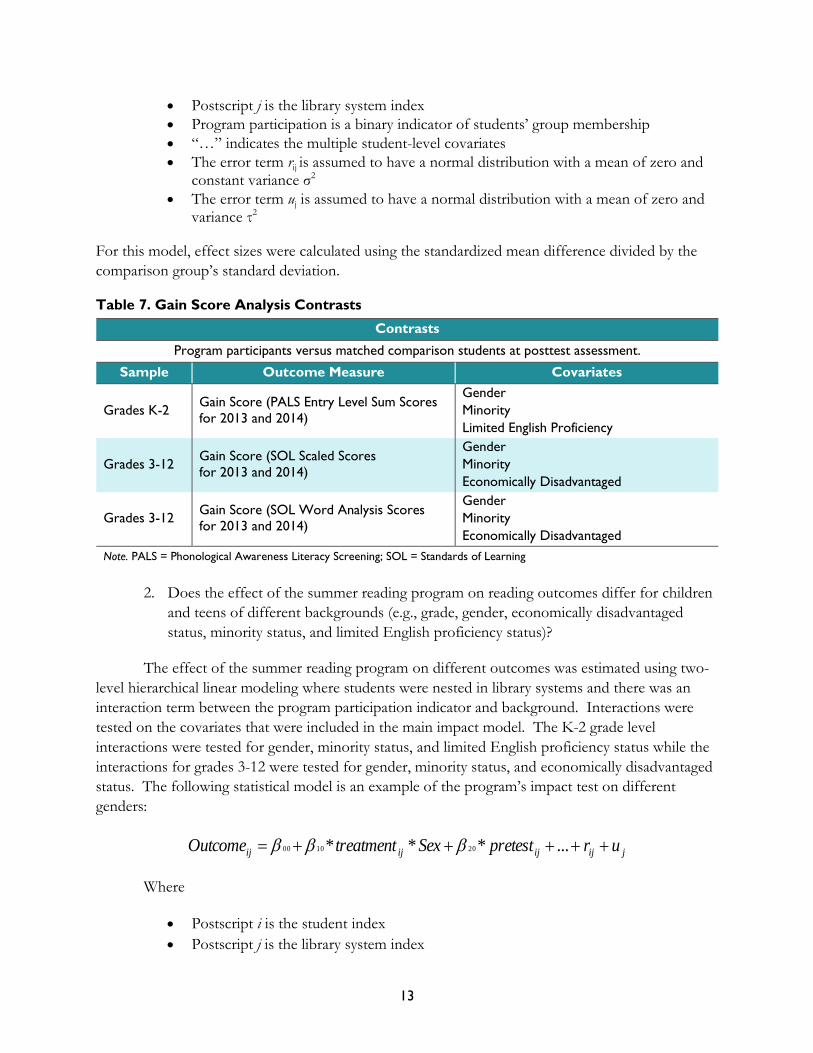
13
Postscript j is the library system index
Program participation is a binary indicator of students’ group membership
“…” indicates the multiple student-level covariates
The error term rij is assumed to have a normal distribution with a mean of zero and constant variance σ2
The error term uj is assumed to have a normal distribution with a mean of zero and variance τ2
For this model, effect sizes were calculated using the standardized mean difference divided by the
comparison group’s standard deviation.
Table 7. Gain Score Analysis Contrasts
Contrasts
Program participants versus matched comparison students at posttest assessment.
Sample Outcome Measure Covariates
Grades K-2 Gain Score (PALS Entry Level Sum Scores
for 2013 and 2014)
Gender
Minority
Limited English Proficiency
Grades 3-12 Gain Score (SOL Scaled Scores
for 2013 and 2014)
Gender
Minority
Economically Disadvantaged
Grades 3-12 Gain Score (SOL Word Analysis Scores for 2013 and 2014)
Gender
Minority
Economically Disadvantaged
Note. PALS = Phonological Awareness Literacy Screening; SOL = Standards of Learning
2. Does the effect of the summer reading program on reading outcomes differ for children
and teens of different backgrounds (e.g., grade, gender, economically disadvantaged
status, minority status, and limited English proficiency status)?
The effect of the summer reading program on different outcomes was estimated using two-
level hierarchical linear modeling where students were nested in library systems and there was an
interaction term between the program participation indicator and background. Interactions were
tested on the covariates that were included in the main impact model. The K-2 grade level
interactions were tested for gender, minority status, and limited English proficiency status while the
interactions for grades 3-12 were tested for gender, minority status, and economically disadvantaged
status. The following statistical model is an example of the program’s impact test on different
genders:
jijijijij urpretestSextreatmentOutcome ...*** 201000
Where
Postscript i is the student index
Postscript j is the library system index
14
Outcome is the posttest score
Pretest is the pretest score
Program participation is a binary indicator of students’ group membership
Gender is a binary indicator with values of male and female
“…” indicates student-level covariates
The error term rij is assumed to have a normal distribution with a mean of zero and
constant variance σ2
The error term uj is assumed to have a normal distribution with a mean of zero and
variance τ2
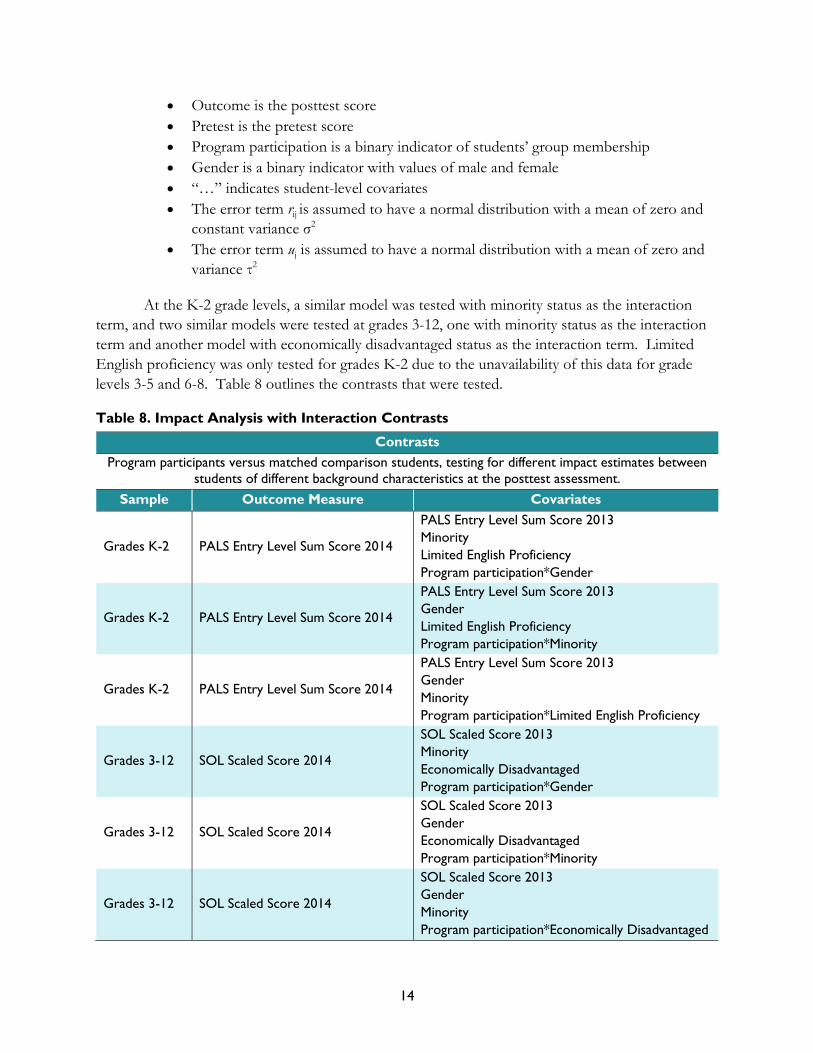
At the K-2 grade levels, a similar model was tested with minority status as the interaction
term, and two similar models were tested at grades 3-12, one with minority status as the interaction
term and another model with economically disadvantaged status as the interaction term. Limited
English proficiency was only tested for grades K-2 due to the unavailability of this data for grade
levels 3-5 and 6-8. Table 8 outlines the contrasts that were tested.
Table 8. Impact Analysis with Interaction Contrasts
Contrasts
Program participants versus matched comparison students, testing for different impact estimates between
students of different background characteristics at the posttest assessment.
Sample Outcome Measure Covariates
Grades K-2 PALS Entry Level Sum Score 2014
PALS Entry Level Sum Score 2013
Minority
Limited English Proficiency
Program participation*Gender
Grades K-2 PALS Entry Level Sum Score 2014
PALS Entry Level Sum Score 2013
Gender
Limited English Proficiency
Program participation*Minority
Grades K-2 PALS Entry Level Sum Score 2014
PALS Entry Level Sum Score 2013
Gender
Minority
Program participation*Limited English Proficiency
Grades 3-12 SOL Scaled Score 2014
SOL Scaled Score 2013
Minority
Economically Disadvantaged
Program participation*Gender
Grades 3-12 SOL Scaled Score 2014
SOL Scaled Score 2013
Gender
Economically Disadvantaged
Program participation*Minority
Grades 3-12 SOL Scaled Score 2014
SOL Scaled Score 2013
Gender
Minority
Program participation*Economically Disadvantaged

15
Contrasts
Program participants versus matched comparison students, testing for different impact estimates between
students of different background characteristics at the posttest assessment.
Sample Outcome Measure Covariates
Grades 3-12 SOL Demonstrated Comprehension
of Fiction Texts 2014
SOL Comprehension of Printed Materials 2013
Minority
Economically Disadvantaged
Program participation*Gender
Grades 3-12 SOL Demonstrated Comprehension
of Fiction Texts 2014
SOL Comprehension of Printed Materials 2013
Gender
Economically Disadvantaged
Program participation*Minority
Grades 3-12 SOL Demonstrated Comprehension of Fiction Texts 2014
SOL Comprehension of Printed Materials 2013
Gender
Minority
Program participation*Economically Disadvantaged
Grades 3-12 SOL Demonstrated Comprehension
of Nonfiction Texts 2014
SOL Comprehension of Printed Materials 2013
Minority
Economically Disadvantaged
Program participation*Gender
Grades 3-12 SOL Demonstrated Comprehension of Nonfiction Texts 2014
SOL Comprehension of Printed Materials 2013
Gender
Economically Disadvantaged
Program participation*Minority
Grades 3-12 SOL Demonstrated Comprehension
of Nonfiction Texts 2014
SOL Comprehension of Printed Materials 2013
Gender
Minority
Program participation*Economically Disadvantaged
Grades 3-12 SOL Word Analysis 2014
SOL Word Analysis 2013
Minority
Economically Disadvantaged
Program participation*Gender
Grades 3-12 SOL Word Analysis 2014
SOL Word Analysis 2013
Gender
Economically Disadvantaged
Program participation* Minority
Grades 3-12 SOL Word Analysis 2014
SOL Word Analysis 2013
Gender
Minority
Program participation*Economically Disadvantaged
Note. PALS = Phonological Awareness Literacy Screening; SOL = Standards of Learning

16
Findings
Findings of this report are organized by the primary impact study questions. Findings of
each subquestion are presented, as applicable, within the primary questions.
What effect does the summer reading program have on participants’ reading
outcomes?
What was the change in reading outcomes from before participation in the
2013 Summer Reading Program to after participation for children and teens?
To address this question, descriptive analyses using gain scores (the posttest scores minus
the pretest scores) were conducted at the K-2 and 3-12 grade levels for the Phonological Awareness
Literacy Screening and Standards of Learning outcomes, respectively.
Grades K-2 (Phonological Awareness Literacy Screening)
At the K-2 grade level, the Entry Level Sum Score from the Phonological Awareness
Literacy Screening was used to compare students’ reading scores before participating in the
2013 Summer Reading Program and after participating in the program in order to calculate a simple
gain score. Before receiving the intervention, study participants in grades K-2 had a 68.86 average
while the score was 61.38 after the intervention, a decrease of 7.48 points in reading (Table 9).
Using a paired samples t-test, this change was found to be statistically significant (p < 0.001) with an
important effect size of -0.50.
It is important to keep in mind what this loss of reading means with respect to summer
reading loss. One of the goals of the Library of Virginia’s 2013 Summer Reading Program was to
prevent summer reading loss; as such, subsequent research questions will take into account the
summer reading loss of a matched comparison sample of students.
Table 9. Gain Scores on Grades K-2 PALS for Summer Reading Program Participants
Outcome: PALS
(N = 454)
Unadjusted
Pretest
Mean (SD)
Unadjusted
Posttest
Mean (SD)
Gain/Loss t p ES
Entry Level Sum Score 68.86
(19.06)
61.38
(13.65) -7.48 -9.48 0.00 -0.50
Note. PALS = Phonological Awareness Literacy Screening
Grades 3-12 (Standards of Learning)
Table 10 presents the findings for this question for grades 3-12. For this grade group, the
Standards of Learning Overall English/Reading score and subscale scores were used to compare
students’ reading scores before participation in the 2013 Summer Reading Program and after
participation in the program in order to calculate a simple gain score. Before receiving the
intervention, study participants in grades 3-12 had an average Overall English/Reading Score of

17
468.00, while the average overall score after the intervention was 471.17, representing a gain of
3.17 points. There was a similar pattern for the Word Analysis subscale, with students gaining an
average of 1.81 points. Using a paired samples t-test, both of these gains were found to be
statistically significant (p < 0.001). The small effect size for the Overall English/Reading scale
suggests that it was not substantively important (ES = 0.09), whereas a substantively important
effect size (ES = 0.30) was observed for the Word Analysis subscale. It was not possible to
calculate gain scores for the Comprehension of Fiction and Comprehension of Nonfiction subscales
as there were no pretests collected for those subscales providing an exact match; rather, the
2013 Standards of Learning measure included only a single Comprehension of Printed Material
subscale.
Table 10. Gain Scores on Grades 3-12 SOL for Summer Reading Program Participants
Outcome: SOL
(N = 3,802)
Unadjusted
Pretest
Mean (SD)
Unadjusted
Posttest
Mean (SD)
Gain/Loss t p ES
Overall English/
Reading Score
468.00
(62.92)
471.17
(64.25) +3.17 4.04 0.00 0.09
Word Analysis Score 36.54
(6.64)
38.35
(9.25) +1.81 13.10 0.00 0.30
Note. SOL = Standards of Learning
What is the effect of the summer reading program on participants’ reading outcomes as
compared to their nonparticipating peers?
Grades K-2 (Phonological Awareness Literacy Screening)
Researchers examined the impact of the Library of Virginia’s 2013 Summer Reading
Program on the K-2 grade level group by comparing the differences in outcomes between program
participants and matched comparisons while controlling for individual demographic characteristics
(i.e., gender and minority status) and pretest scores. As presented in Table 11, results indicated that
summer reading program participants outperformed comparison students by 2.12 points,
a statistically significant result, while controlling for all covariates (z = 2.32, p = 0.02). This
difference was also substantively important with an effect size of 0.15.
Table 11. Comparison of Grades K-2 PALS Posttests: Participants vs. Nonparticipants
Outcome: PALS
Participants
(N = 454)
Unadjusted Posttest
Mean (SD)
Comparisons
(N = 454)
Unadjusted Posttest
Mean (SD)
Coeff
(SE) z p ES
Entry Level Sum Score 61.38
(13.65)
59.65
(15.41)
2.12
(0.91) 2.32 0.02 0.15
Note. PALS = Phonological Awareness Literacy Screening

18
Grades 3-12 (Standards of Learning)
Researchers examined the impact of the Library of Virginia’s 2013 Summer Reading
Program on the 3-12 grade level group by comparing the differences in outcomes between program
participants and matched comparisons while controlling for individual demographic characteristics
(i.e., gender, minority status, and economically disadvantaged status) and pretest scores using a two-
level regression model. Using an analytic sample that includes all elementary and middle school
students with Standards of Learning data, statistically significant main effects of the summer reading
program across all Standards of Learning outcomes were found. As presented in Table 12, students
who participated in the summer reading program performed better overall on all Standards of
Learning scores for the 2013-2014 school year than students who did not participate in the summer
reading program, controlling for pretest and demographic variables (i.e., gender, minority status, and
economically disadvantaged status). All of these differences in Standards of Learning outcomes
were statistically significant (Overall English/Reading Score, z = 10.45, p < 0.001; Comprehension
of Fiction subscale, z = 7.18, p < 0.001; Comprehension of Nonfiction subscale, z = 7.91, p < 0.001;
and Word Analysis subscale, z = 5.61 p < 0.001). The effect sizes suggest that the effects for all but
the Word Analysis subscale were substantively important, with sizes ranging from 0.14 to 0.18.
Table 12. Comparison of Grades 3-12 SOL Posttests: Participants vs. Nonparticipants
Outcome: SOL
Participants
(N = 3,802)
Unadjusted Posttest
Mean (SD)
Comparisons
(N = 3,539a)
Unadjusted Posttest
Mean (SD)
Coeff
(SE) z p ES
Overall English/
Reading Score
471.17
(64.25)
459.35
(62.76)
11.14
(1.07) 10.45 0.00 0.18
Comprehension of
Fiction Score
37.15
(7.03)
36.06
(7.16)
1.02
(1.42) 7.18 0.00 0.14
Comprehension of
Nonfiction Score
36.69
(6.72)
35.56
(6.52)
1.03
(0.13) 7.91 0.00 0.16
Word Analysis Score 38.35
(9.25)
37.15
(8.99)
1.09
(0.19) 5.61 0.00 0.12
Note. SOL = Standards of Learning a N = 3,537 for the Word Analysis comparison group sample.
To what extent does participation in the program moderate participants’ reading
trajectory (gain versus loss) in comparison to their nonparticipating peers?
Grades K-2 (Phonological Awareness Literacy Screening)
As previously stated, one of the goals of the reading program was to prevent summer
reading loss. To aid in determining whether this goal was being met, gain scores were examined
after controlling for student clustering within the library system, pretest differences, and background
characteristics. Two-level hierarchical linear modeling with student gain scores as the dependent
variable found that summer reading program participants outperformed nonparticipants by an
average of 2.30 points on the Entry Level Sum Score on the Phonological Awareness Literacy
Screening when adjusted for covariates. This represented a positive program effect. However, the

19
program participation coefficient had a p-value of 0.07 (z = 1.84) which is not statistically significant
at the 0.05 alpha level (see Table 13). The effect size (ES = 0.14) indicates that the difference is
substantively important even if it did not reach statistical significance.
Table 13. Comparison of Grades K-2 PALS Reading Gains: Participants vs. Nonparticipants
Outcome: PALS
Participants
(N = 454)
Unadjusted Mean Gain Score (SD)
Comparisons
(N = 454)
Unadjusted Mean Gain Score (SD)
Coeff
(SE) z p ES
Entry Level Sum Score -7.48
(16.79)
-9.21
(17.01)
2.30
(1.25) 1.84 0.07 0.14
Note. PALS = Phonological Awareness Literacy Screening
Grades 3-12 (Standards of Learning)
As was done for the Phonological Awareness Literacy Screening data, differences in
Standards of Learning gain scores between participants and nonparticipants were compared after
controlling for student clustering within the library system, pretest differences, and background
characteristics. Two-level hierarchical linear modeling with student gain scores as the dependent
variable found that summer reading program participants outperformed nonparticipants to a
statistically significant degree with their Overall English/Reading scores as well as their Word
Analysis subscale scores. Specifically, participants demonstrated a gain of 3.17 points on the Overall
English/Reading score and a gain of 1.81 points on the Word Analysis subscale (see Table 14).
Nonparticipants, on the other hand, demonstrated a loss of 8.12 points on the Overall
English/Reading score and a slight gain of 0.75 points on the Word Analysis subscale. These
differences are statistically significant and substantively important for both the Overall
English/Reading score and Word Analysis subscale score (p < 0.001, ES = 0.24; and p < 0.001,
ES = 0.13, respectively). As noted earlier, a gain score could not be calculated for the
Comprehension of Fiction or Comprehension of Nonfiction subscales.
Table 14. Comparison of Grades 3-12 SOL Reading Gains: Participants vs. Nonparticipants
Outcome: SOL
Participants
(N = 3,802)
Unadjusted Mean Gain Score (SD)
Comparisons
(N = 3,539a)
Unadjusted Mean Gain Score (SD)
Coeff
(SE) z p ES
Overall English/ Reading Score
3.17
(48.41)
-8.12
(48.89)
11.48
(1.15) 9.95 0.00 0.24
Word Analysis Score 1.81
(8.53)
0.75
(8.46)
1.12
(0.20) 5.48 0.00 0.13
Note. SOL = Standards of Learning a N = 3,537 for the Word Analysis comparison group sample.
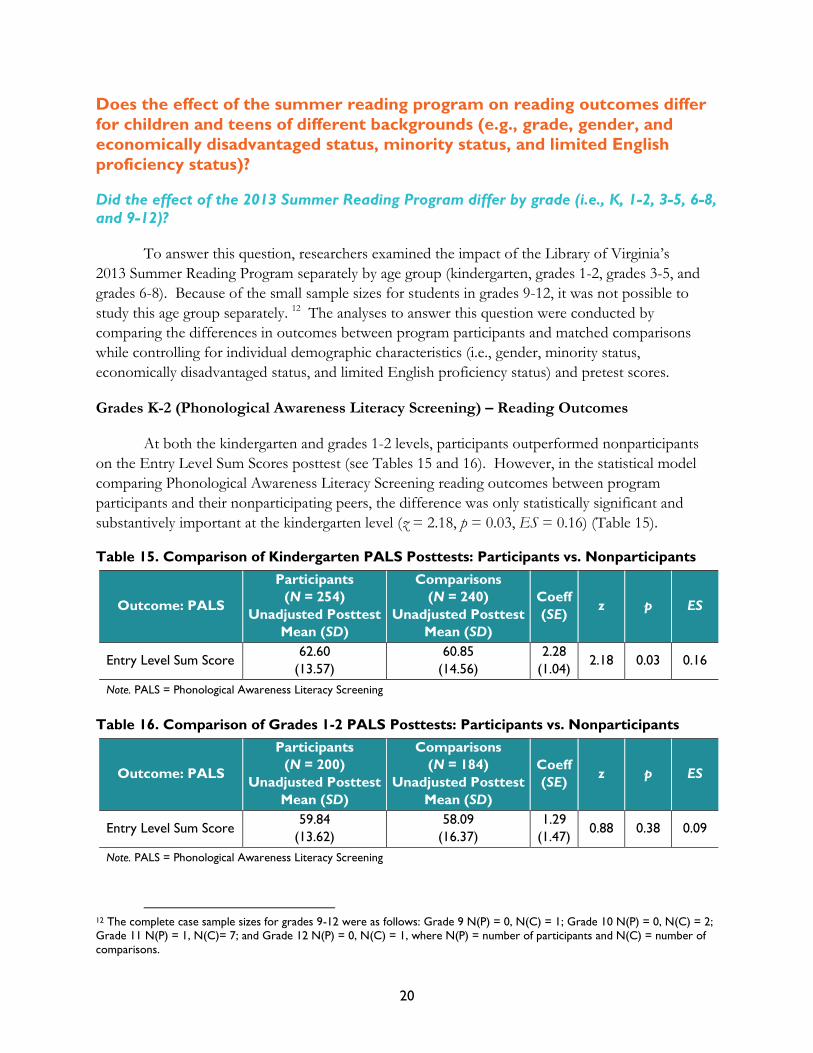
20
Does the effect of the summer reading program on reading outcomes differ
for children and teens of different backgrounds (e.g., grade, gender, and
economically disadvantaged status, minority status, and limited English
proficiency status)?
Did the effect of the 2013 Summer Reading Program differ by grade (i.e., K, 1-2, 3-5, 6-8, and 9-12)?
To answer this question, researchers examined the impact of the Library of Virginia’s
2013 Summer Reading Program separately by age group (kindergarten, grades 1-2, grades 3-5, and
grades 6-8). Because of the small sample sizes for students in grades 9-12, it was not possible to
study this age group separately. 12 The analyses to answer this question were conducted by
comparing the differences in outcomes between program participants and matched comparisons
while controlling for individual demographic characteristics (i.e., gender, minority status,
economically disadvantaged status, and limited English proficiency status) and pretest scores.
Grades K-2 (Phonological Awareness Literacy Screening) – Reading Outcomes
At both the kindergarten and grades 1-2 levels, participants outperformed nonparticipants
on the Entry Level Sum Scores posttest (see Tables 15 and 16). However, in the statistical model
comparing Phonological Awareness Literacy Screening reading outcomes between program
participants and their nonparticipating peers, the difference was only statistically significant and
substantively important at the kindergarten level (z = 2.18, p = 0.03, ES = 0.16) (Table 15).
Table 15. Comparison of Kindergarten PALS Posttests: Participants vs. Nonparticipants
Outcome: PALS
Participants
(N = 254)
Unadjusted Posttest
Mean (SD)
Comparisons
(N = 240)
Unadjusted Posttest
Mean (SD)
Coeff
(SE) z p ES
Entry Level Sum Score 62.60
(13.57)
60.85
(14.56)
2.28
(1.04) 2.18 0.03 0.16
Note. PALS = Phonological Awareness Literacy Screening
Table 16. Comparison of Grades 1-2 PALS Posttests: Participants vs. Nonparticipants
Outcome: PALS
Participants
(N = 200)
Unadjusted Posttest
Mean (SD)
Comparisons
(N = 184)
Unadjusted Posttest
Mean (SD)
Coeff
(SE) z p ES
Entry Level Sum Score 59.84
(13.62)
58.09
(16.37)
1.29
(1.47) 0.88 0.38 0.09
Note. PALS = Phonological Awareness Literacy Screening
12 The complete case sample sizes for grades 9-12 were as follows: Grade 9 N(P) = 0, N(C) = 1; Grade 10 N(P) = 0, N(C) = 2;
Grade 11 N(P) = 1, N(C)= 7; and Grade 12 N(P) = 0, N(C) = 1, where N(P) = number of participants and N(C) = number of
comparisons.
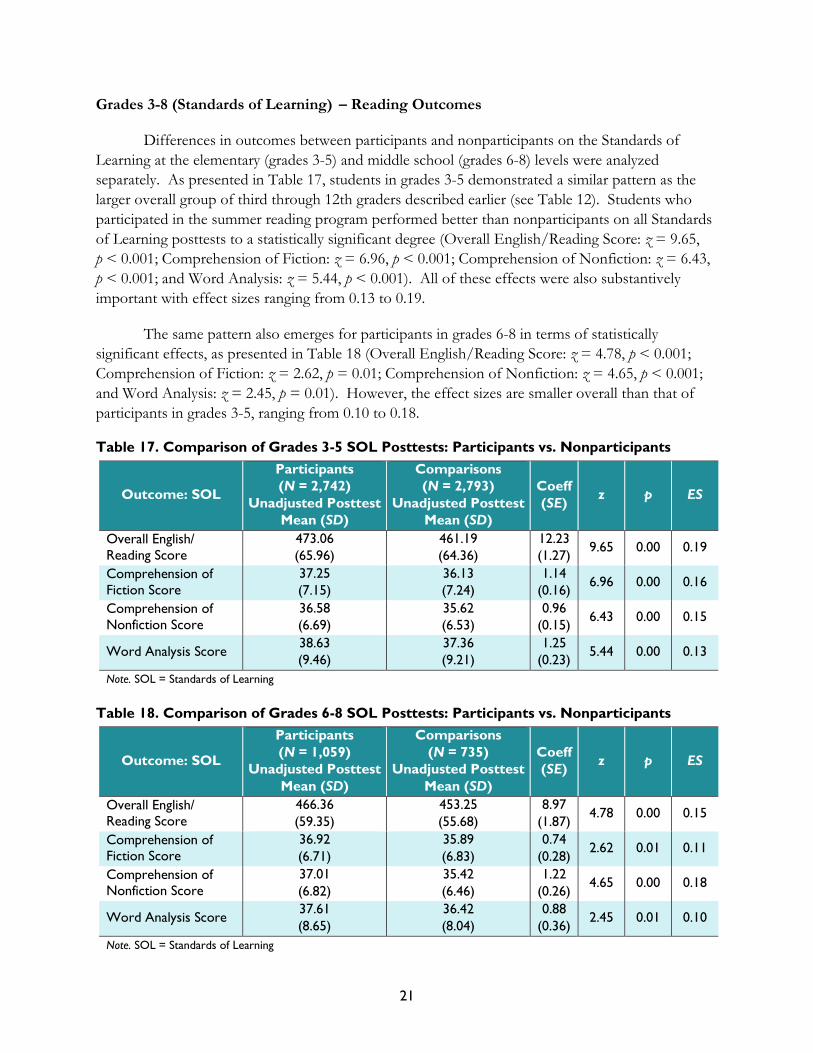
21
Grades 3-8 (Standards of Learning) – Reading Outcomes
Differences in outcomes between participants and nonparticipants on the Standards of
Learning at the elementary (grades 3-5) and middle school (grades 6-8) levels were analyzed
separately. As presented in Table 17, students in grades 3-5 demonstrated a similar pattern as the
larger overall group of third through 12th graders described earlier (see Table 12). Students who
participated in the summer reading program performed better than nonparticipants on all Standards
of Learning posttests to a statistically significant degree (Overall English/Reading Score: z = 9.65,
p < 0.001; Comprehension of Fiction: z = 6.96, p < 0.001; Comprehension of Nonfiction: z = 6.43,
p < 0.001; and Word Analysis: z = 5.44, p < 0.001). All of these effects were also substantively
important with effect sizes ranging from 0.13 to 0.19.
The same pattern also emerges for participants in grades 6-8 in terms of statistically
significant effects, as presented in Table 18 (Overall English/Reading Score: z = 4.78, p < 0.001;
Comprehension of Fiction: z = 2.62, p = 0.01; Comprehension of Nonfiction: z = 4.65, p < 0.001;
and Word Analysis: z = 2.45, p = 0.01). However, the effect sizes are smaller overall than that of
participants in grades 3-5, ranging from 0.10 to 0.18.
Table 17. Comparison of Grades 3-5 SOL Posttests: Participants vs. Nonparticipants
Outcome: SOL
Participants
(N = 2,742)
Unadjusted Posttest
Mean (SD)
Comparisons
(N = 2,793)
Unadjusted Posttest
Mean (SD)
Coeff
(SE) z p ES
Overall English/
Reading Score
473.06
(65.96)
461.19
(64.36)
12.23
(1.27) 9.65 0.00 0.19
Comprehension of
Fiction Score
37.25
(7.15)
36.13
(7.24)
1.14
(0.16) 6.96 0.00 0.16
Comprehension of
Nonfiction Score
36.58
(6.69)
35.62
(6.53)
0.96
(0.15) 6.43 0.00 0.15
Word Analysis Score 38.63
(9.46)
37.36
(9.21)
1.25
(0.23) 5.44 0.00 0.13
Note. SOL = Standards of Learning
Table 18. Comparison of Grades 6-8 SOL Posttests: Participants vs. Nonparticipants
Outcome: SOL
Participants
(N = 1,059)
Unadjusted Posttest
Mean (SD)
Comparisons
(N = 735)
Unadjusted Posttest
Mean (SD)
Coeff
(SE) z p ES
Overall English/ Reading Score
466.36
(59.35)
453.25
(55.68)
8.97
(1.87) 4.78 0.00 0.15
Comprehension of Fiction Score
36.92
(6.71)
35.89
(6.83)
0.74
(0.28) 2.62 0.01 0.11
Comprehension of Nonfiction Score
37.01
(6.82)
35.42
(6.46)
1.22
(0.26) 4.65 0.00 0.18
Word Analysis Score 37.61
(8.65)
36.42
(8.04)
0.88
(0.36) 2.45 0.01 0.10
Note. SOL = Standards of Learning

22
Grades K-2 (Phonological Awareness Literacy Screening) – Reading Gains
When analyzing the Phonological Awareness Literacy Screening gain scores by grade level
(i.e., kindergarten and grades 1-2), the reading gains showed similar trends to the overall analysis in
which grades K-2 were analyzed together (see Table 13). At both levels, comparison students had
larger reading losses than students who participated in the summer reading program. As shown in
Tables 19 and 20, the statistical analyses of reading gains when controlled for gender, minority
status, and student clustering within the library system showed that program participants
outperformed comparison students but not by a statistically significant margin (Kindergarten:
z = 1.84, p = 0.07; Grades 1-2: z = 0.83, p = 0.40). Taking into account the effect sizes, however,
the difference in reading gains at the kindergarten level between participants and nonparticipants is
substantively important (ES = 0.19).
Table 19. Comparison of Kindergarten PALS Reading Gains: Participants vs.
Nonparticipants
Outcome: PALS
Participants
(N = 254)
Unadjusted Mean Gain Score (SD)
Comparisons
(N = 240)
Unadjusted Mean Gain Score (SD)
Coeff
(SE) z p ES
Entry Level Sum Score -12.54
(17.46)
-14.46
(15.21)
2.87
(1.56) 1.84 0.07 0.19
Note. PALS = Phonological Awareness Literacy Screening
Table 20. Comparison of Grades 1-2 PALS Reading Gains: Participants vs. Nonparticipants
Outcome: PALS
Participants
(N = 200)
Unadjusted Mean Gain Score (SD)
Comparisons
(N = 184)
Unadjusted Mean Gain Score (SD)
Coeff
(SE) z p ES
Entry Level Sum Score -1.05
(13.41)
-2.36
(16.83)
1.40
(1.67) 0.83 0.40 0.09
Note. PALS = Phonological Awareness Literacy Screening
Grades 3-8 (Standards of Learning) – Reading Gains
The gain scores from students in grades 3-5 demonstrate a similar pattern as the larger group
of third through 12th graders (see Table 14), with participating students demonstrating greater gains
on Standards of Learning scores than comparison students. Specifically, as shown in Table 21, while
comparison students performed better on the Word Analysis outcome in 2014 than they did in
2013, they did not do so to the same degree as participating students (z = 5.52, p < 0.001,
ES = 0.15). Participants also demonstrated statistically significant higher gains in the Overall
English/Reading scores than nonparticipants; nonparticipants actually demonstrated a loss of
7.97 points from pretest to posttest (z = 9.45, p < 0.001). The 0.26 effect size for this difference
suggests that it is educationally meaningful.

23
Table 21. Grades 3-5 SOL Average Reading Gain by Group
Outcome: SOL
Participants
(N = 2,742)
Unadjusted Mean
Gain Score (SD)
Comparisons
(N = 2,793)
Unadjusted Mean
Gain Score (SD)
Coeff
(SE) z p ES
Overall English/
Reading Score
4.78
(50.56)
-7.97
(50.64)
13.12
(1.39) 9.45 0.00 0.26
Word Analysis Score 2.12
(8.75)
0.86
(8.68)
1.34
(0.24) 5.52 0.00 0.15
Note. SOL = Standards of Learning
As presented in Table 22, scores for students in grades 6-8 demonstrate a similar pattern as
well, with participants demonstrating more favorable results on the Overall English/Reading score
(z = 3.99, p < 0.001, ES = 0.19) and on Word Analysis (z = 2.12, p = 0.03, ES = 0.10).
Table 22. Grades 6-8 SOL Average Reading Gain by Group
Outcome: SOL
Participants
(N = 1,059)
Unadjusted Mean Gain Score (SD)
Comparisons
(N = 735)
Unadjusted Mean Gain Score (SD)
Coeff
(SE) z p ES
Overall English/
Reading Score
-1.03
(42.11)
-9.21
(41.31)
8.10
(2.03) 3.99 0.00 0.19
Word Analysis Score 1.02
(7.89)
0.21
(7.49)
0.79
(0.37) 2.12 0.03 0.10
Note. SOL = Standards of Learning
Did the effect of the 2013 Summer Reading Program differ by gender?
Grades K-2 (Phonological Awareness Literacy Screening)
To test whether the effect of the summer reading program differed for boys and girls in
kindergarten through second grade, two 2-level models were run that included an interaction effect
between their program participation status and gender. The first model included the Entry Level
Sum Score from the Phonological Awareness Literacy Screening posttest as the dependent variable
and the second model included the Entry Level Sum gain scores as the dependent variable. As
presented in Table 23, there were no statistically significant interactions between gender and
program participation status for either the outcome analysis (z = 0.38, p = 0.71) or the gain score
analysis (z = -0.49, p = 0.63). These findings indicate that the program effect did not differ for boys
and girls.
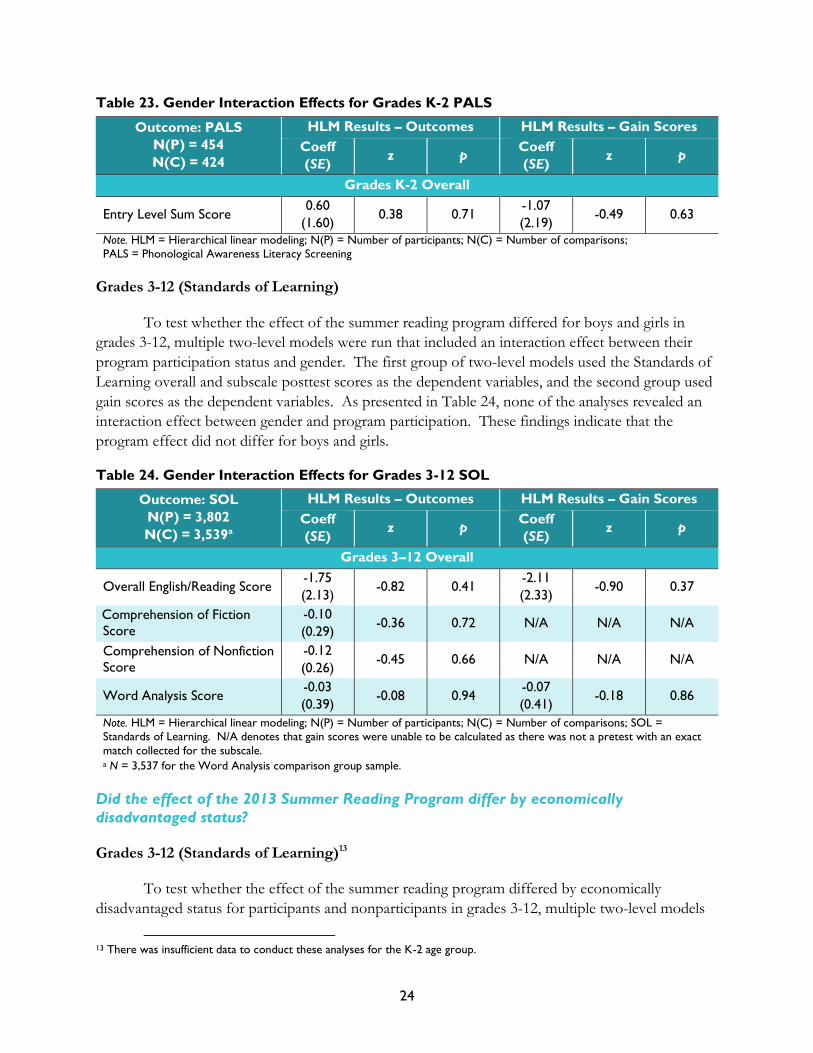
24
Table 23. Gender Interaction Effects for Grades K-2 PALS
Outcome: PALS
N(P) = 454
N(C) = 424
HLM Results – Outcomes HLM Results – Gain Scores
Coeff
(SE) z p
Coeff
(SE) z p
Grades K-2 Overall
Entry Level Sum Score 0.60
(1.60) 0.38 0.71
-1.07
(2.19) -0.49 0.63
Note. HLM = Hierarchical linear modeling; N(P) = Number of participants; N(C) = Number of comparisons;
PALS = Phonological Awareness Literacy Screening
Grades 3-12 (Standards of Learning)
To test whether the effect of the summer reading program differed for boys and girls in
grades 3-12, multiple two-level models were run that included an interaction effect between their
program participation status and gender. The first group of two-level models used the Standards of
Learning overall and subscale posttest scores as the dependent variables, and the second group used
gain scores as the dependent variables. As presented in Table 24, none of the analyses revealed an
interaction effect between gender and program participation. These findings indicate that the
program effect did not differ for boys and girls.
Table 24. Gender Interaction Effects for Grades 3-12 SOL
Outcome: SOL
N(P) = 3,802
N(C) = 3,539a
HLM Results – Outcomes HLM Results – Gain Scores
Coeff
(SE) z p
Coeff
(SE) z p
Grades 3–12 Overall
Overall English/Reading Score -1.75
(2.13) -0.82 0.41
-2.11
(2.33) -0.90 0.37
Comprehension of Fiction
Score
-0.10
(0.29) -0.36 0.72 N/A N/A N/A
Comprehension of Nonfiction
Score
-0.12
(0.26) -0.45 0.66 N/A N/A N/A
Word Analysis Score -0.03
(0.39) -0.08 0.94
-0.07
(0.41) -0.18 0.86
Note. HLM = Hierarchical linear modeling; N(P) = Number of participants; N(C) = Number of comparisons; SOL = Standards of Learning. N/A denotes that gain scores were unable to be calculated as there was not a pretest with an exact
match collected for the subscale. a N = 3,537 for the Word Analysis comparison group sample.
Did the effect of the 2013 Summer Reading Program differ by economically
disadvantaged status?
Grades 3-12 (Standards of Learning)13
To test whether the effect of the summer reading program differed by economically
disadvantaged status for participants and nonparticipants in grades 3-12, multiple two-level models
13 There was insufficient data to conduct these analyses for the K-2 age group.
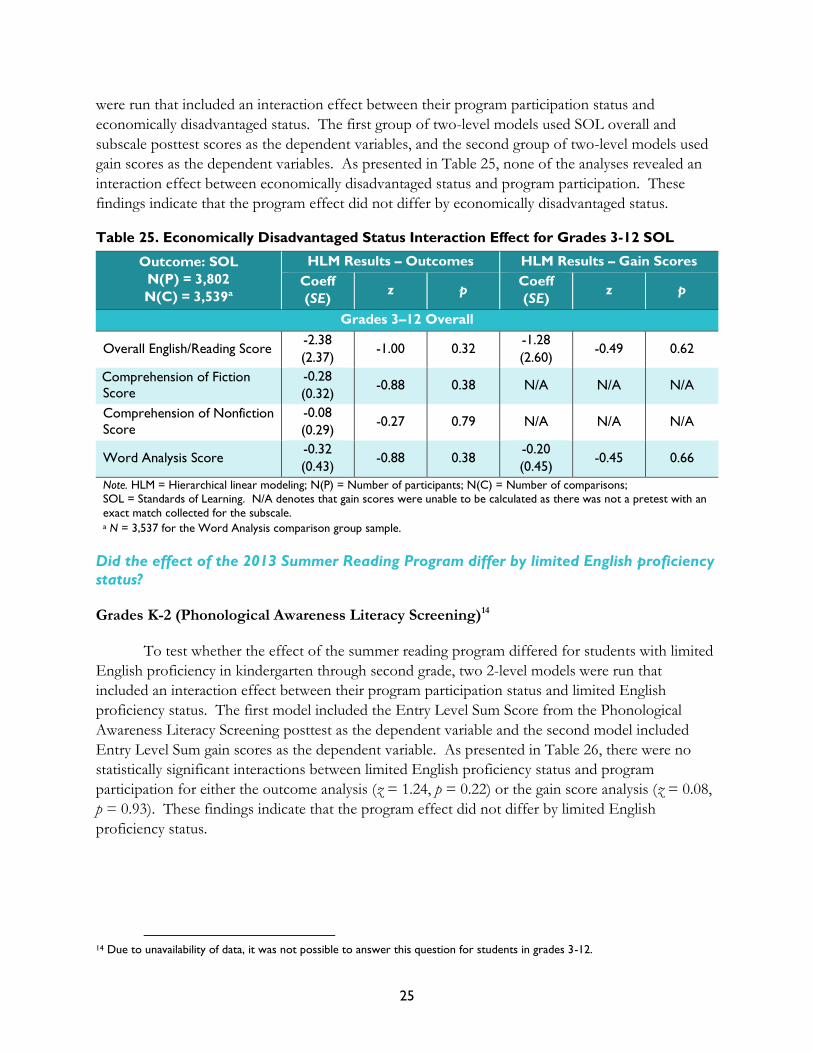
25
were run that included an interaction effect between their program participation status and
economically disadvantaged status. The first group of two-level models used SOL overall and
subscale posttest scores as the dependent variables, and the second group of two-level models used
gain scores as the dependent variables. As presented in Table 25, none of the analyses revealed an
interaction effect between economically disadvantaged status and program participation. These
findings indicate that the program effect did not differ by economically disadvantaged status.
Table 25. Economically Disadvantaged Status Interaction Effect for Grades 3-12 SOL
Outcome: SOL
N(P) = 3,802
N(C) = 3,539a
HLM Results – Outcomes HLM Results – Gain Scores
Coeff
(SE) z p
Coeff
(SE) z p
Grades 3–12 Overall
Overall English/Reading Score -2.38
(2.37) -1.00 0.32
-1.28
(2.60) -0.49 0.62
Comprehension of Fiction Score
-0.28
(0.32) -0.88 0.38 N/A N/A N/A
Comprehension of Nonfiction
Score
-0.08
(0.29) -0.27 0.79 N/A N/A N/A
Word Analysis Score -0.32
(0.43) -0.88 0.38
-0.20
(0.45) -0.45 0.66
Note. HLM = Hierarchical linear modeling; N(P) = Number of participants; N(C) = Number of comparisons;
SOL = Standards of Learning. N/A denotes that gain scores were unable to be calculated as there was not a pretest with an
exact match collected for the subscale. a N = 3,537 for the Word Analysis comparison group sample.
Did the effect of the 2013 Summer Reading Program differ by limited English proficiency
status?
Grades K-2 (Phonological Awareness Literacy Screening)14
To test whether the effect of the summer reading program differed for students with limited
English proficiency in kindergarten through second grade, two 2-level models were run that
included an interaction effect between their program participation status and limited English
proficiency status. The first model included the Entry Level Sum Score from the Phonological
Awareness Literacy Screening posttest as the dependent variable and the second model included
Entry Level Sum gain scores as the dependent variable. As presented in Table 26, there were no
statistically significant interactions between limited English proficiency status and program
participation for either the outcome analysis (z = 1.24, p = 0.22) or the gain score analysis (z = 0.08,
p = 0.93). These findings indicate that the program effect did not differ by limited English
proficiency status.
14 Due to unavailability of data, it was not possible to answer this question for students in grades 3-12.

26
Table 26. Limited English Proficiency Status Interaction Effects for Grades K-2 PALS
Outcome: PALS
N(P) = 454
N(C) = 424
HLM Results – Outcomes HLM Results – Gain Scores
Coeff
(SE) z p
Coeff
(SE) z p
Grades K-2 Overall
Entry Level Sum Score 5.94
(4.80) 1.24 0.22
0.55
(6.59) 0.08 0.93
Note. HLM = Hierarchical linear modeling; N(P) = Number of participants; N(C) = Number of comparisons;
PALS = Phonological Awareness Literacy Screening
Did the effect of the 2013 Summer Reading Program differ by minority status?
Grades K-2 (Phonological Awareness Literacy Screening)
To test whether the effect of the summer reading program differed for minority students in
kindergarten through second grade, two 2-level models were run that included an interaction effect
between their program participation status and minority status. The first model included the Entry
Level Sum Score from the Phonological Awareness Literacy Screening posttest as the dependent
variable and the second model included the Entry Level Sum gain scores as the dependent variable.
As presented in Table 27, there were no statistically significant interactions between minority status
and program participation status for either the outcome analysis (z = 0.49, p = 0.63) or the gain
score analysis (z = 0.08, p = 0.94). These findings indicate that the program effect did not differ by
minority status.
Table 27. Minority Status Interaction Effects for Grades K-2 PALS
Outcome: PALS
N(P) = 454
N(C) = 424
HLM Results – Outcomes HLM Results – Gain Scores
Coeff
(SE) z p
Coeff
(SE) z p
Grades K-2 Overall
Entry Level Sum Score 0.87
(1.77) 0.49 0.63
0.19
(2.43) 0.08 0.94
Note. HLM = Hierarchical linear modeling; N(P) = Number of participants; N(C) = Number of comparisons;
PALS = Phonological Awareness Literacy Screening
Grades 3-12 (Standards of Learning)
To test whether the effect of the summer reading program differed by minority status for
students in grades 3-12, multiple two-level models were run that included an interaction effect
between their program participation status and minority status. The first group of two-level models
used the Standards of Learning overall and subscale posttest scores as the dependent variables, and
the second group of two-level models used gain scores as the dependent variables. As shown in
Table 28, the analyses revealed a significant interaction effect between minority status and program
participation on participants’ Comprehension of Fiction outcomes (gain scores were not able to be
computed for this measure). Specifically, minority status positively moderated the effect of the
summer reading program, with minority students demonstrating higher posttest scores on the

27
Comprehension of Fiction subscale than nonminority students within the program participation
group (z = 2.56, p = 0.01).
Table 28. Minority Status Interaction Effects for Grades 3-12 SOL
Outcome: SOL
N(P) = 3,802
N(C) = 3,539a
HLM Results – Outcomes HLM Results – Gain Scores
Coeff
(SE) z p
Coeff
(SE) z p
Grades 3–12 Overall
Overall English/Reading Score 4.22
(2.22) 1.90 0.06
3.02
(2.43) 1.24 0.21
Comprehension of Fiction Score
0.77
(0.30) 2.56 0.01 N/A N/A N/A
Comprehension of Nonfiction
Score
0.48
(0.27) 1.74 0.08 N/A N/A N/A
Word Analysis Score 0.54
(0.40) 1.34 0.18
0.35
(0.42) 0.82 0.41
Note. HLM = Hierarchical linear modeling; N(P) = Number of participants; N(C) = Number of comparisons;
SOL = Standards of Learning. N/A denotes that gain scores were unable to be calculated as there was not a pretest with an
exact match collected for the subscale. a N = 3,537 for the Word Analysis comparison group sample.
The Figure below illustrates this interaction effect by showing that the slopes for minority
and nonminority status differ significantly from one another, thus demonstrating that the treatment
effect is greater for minority students than nonminority students. Despite the fact that nonminority
students outperform minority students overall for participants and nonparticipants (as indicated by
the line representing nonminority scores being higher on the graph), minority students participating
in the summer reading program increased their scores to a greater degree than nonminority students.
There were no other interaction effects of minority status found.
Figure. Interaction effect of minority status and program participation on the SOL
Comprehension of Fiction outcome
34.14
35.85
37.08 37.71
30
31
32
33
34
35
36
37
38
39
40
Co
mp
reh
en
sio
n o
f F
icti
on
Sco
re
Minority
Non-Minority
Participants Comparisons

28
Summary of Key Findings
The following is a summary of the key findings described in this report. It is presented by
each study question addressed.
Overall Findings for Study Question 1: What effect does the summer reading
program have on participants’ reading outcomes?
Grades K-2 (Phonological Awareness Literacy Screening)
Comparing the Phonological Awareness Literacy Screening posttests only (not taking
into consideration gains and losses relative to the pretests), participants in the summer
reading program outperformed nonparticipants by an average of 2.12 points, which is a
statistically significant and substantively important degree (p = 0.02, ES = 0.15).
Participants’ scores decreased on the Phonological Awareness Literacy Screening from
pretest to posttest an average of 7.48 points. This loss, however, was smaller for
program participants than for nonparticipants, whose scores decreased an average of
9.21 points from pretest to posttest. Although this difference was not statistically
significant (p = 0.07), the effect size (ES = 0.14) suggests that the difference is
substantively important.
Grades 3-12 (Standards of Learning)
Comparing posttests only (not taking into consideration gains and losses relative to the
pretests), program participants outperformed nonparticipants on the Standards of
Learning Overall English/Reading outcome, as well as the three subscales:
Comprehension of Fiction, Comprehension of Nonfiction, and Word Analysis. These
differences were all statistically significant, and all but the Word Analysis subscale were
substantively important, with effect sizes ranging from 0.14 to 0.18.
Participants’ scores increased on the Overall English/Reading outcome an average of
3.17 points from pretest to posttest, whereas nonparticipants’ scores decreased by an
average of 8.12 points from pretest to posttest. This difference was both statistically
significant (p < 0.001) and substantively important (ES = 0.24).
Participants’ scores increased on the Word Analysis subscale an average of 1.81 points,
whereas nonparticipants’ scores on the same measure only increased by an average of
0.75 points. This difference was statistically significant (p < 0.001) and substantively
important (ES = 0.13).
Table 28 portrays a visual summary of the overall findings for study question 1. Findings are
organized into two categories: (1) participants demonstrated better outcomes than comparisons and
(2) participants demonstrated greater gains or smaller losses than did comparisons. For all three
categories, an “X” represents findings that are statistically significant.

29
Table 29. Overall Findings for Study Question 1
Participants Demonstrated
Better Outcomes than
Comparisons
Participants Demonstrated
Greater Gains or Smaller Losses
than Comparisons
PALS X
SOL – Overall English/Reading X X
SOL Subscale –
Comprehension of Fiction X N/A
SOL Subscale –
Comprehension of Nonfiction X N/A
SOL Subscale – Word Analysis X X
Note. PALS = Phonological Awareness Literacy Screening; SOL = Standards of Learning. N/A denotes that gain scores were
unable to be calculated as there was not a pretest with an exact match collected for the subscale.
Overall Findings for Study Question 2: Does the effect of the summer
reading program on reading outcomes differ for children and teens of
different backgrounds (e.g., grade, gender, economically disadvantaged
status, minority status, and limited English proficiency status)?
Grades K-2 (Phonological Awareness Literacy Screening)
Comparing the Phonological Awareness Literacy Screening posttests only (not taking
into consideration gains and losses relative to the pretests), kindergarten participants
outperformed their nonparticipant peers by an average of 2.28 points. This difference
was statistically significant (p = 0.03) and substantively important (ES = 0.16). First and
second grade participants also outperformed their nonparticipant peers on the
Phonological Awareness Literacy Screening posttest by an average of 1.29 points. This
difference, however, was not statistically significant (p = 0.38), nor was it substantively
important (ES = 0.09).
Kindergarten participants’ scores decreased on the Phonological Awareness Literacy
Screening from pretest to posttest by an average of 12.54 points. This loss, however,
was smaller for program participants than their nonparticipant peers whose scores
decreased an average of 14.46 points from pretest to posttest. This difference was not
statistically significant (p = 0.07) but was substantively important (ES = 0.19).
First and second grade participants’ scores also decreased on the Phonological
Awareness Literacy Screening from pretest to posttest by an average of 1.05 points. This
loss was also smaller for participants than their nonparticipant peers whose scores
decreased an average of 2.36 points from pretest to posttest. This difference was not
statistically significant (p = 0.40), nor was it substantively important (ES = 0.09).
There were no interaction effects found for gender, limited English proficiency status, or
minority status.

30
Grades 3-12 (Standards of Learning)
Comparing the scores of the Standards of Learning Overall English/Reading outcome
and the three subscales (Comprehension of Fiction, Comprehension of Nonfiction, and
Word Analysis) from posttests only (not taking into consideration gains and losses
relative to the pretests), participants in grades 3-5 and 6-8 outperformed their
nonparticipant peers. All of the differences were statistically significant. The effect sizes
ranged from 0.13 to 0.19 for grades 3-5 and 0.10 to 0.18 for grades 6-8.
Grades 3-5 participants’ scores increased on the Overall English/Reading outcome an
average of 4.78 points from pretest to posttest, whereas their nonparticipant peers’
scores decreased by an average of 7.97 points from pretest to posttest. This difference
was both statistically significant (p < 0.001) and educationally meaningful (ES = 0.26).
Grades 3-5 participants’ scores also increased on the Word Analysis subscale an average
of 2.12 points from pretest to posttest, whereas their nonparticipant peers’ scores only
increased by an average of 0.86 points. This difference was both statistically significant
(p < 0.001) and substantively important (ES = 0.15).
Grades 6-8 participants’ scores decreased on the Overall English/Reading outcome an
average of 1.03 points from pretest to posttest. However, their nonparticipant peers’
scores decreased even more, by an average of 9.21 points from pretest to posttest. This
difference was both statistically significant (p < 0.001) and substantively important
(ES = 0.19).
Grades 6-8 participants’ scores increased on the Word Analysis subscale an average of
1.02 points from pretest to posttest, whereas their nonparticipant peers’ scores only
increased by an average of 0.21 points. Although this difference was statistically
significant (p = 0.03), the small effect size suggests that it was not substantively
important (ES = 0.10).
There were no interaction effects found for gender or economically disadvantaged status.
There was an interaction effect of minority status on the Comprehension of Fiction
subscale scores for program participants. Although nonminority students generally
outperformed minority students in both conditions, minority students’ scores improved
to a significantly greater degree by participating in the summer reading program.
Tables 30 and 31 presents a graphical summary of the overall findings for study question 2.
Findings are organized by the main effects in outcomes and gains for overall grade levels and grade
level bands (i.e., K, 1-2, 3-5, and 6-8), as well as interaction effects for background characteristics
(i.e., gender, economically disadvantaged status, limited English proficiency status, and minority
status). An “X” represents findings that are statistically significant.
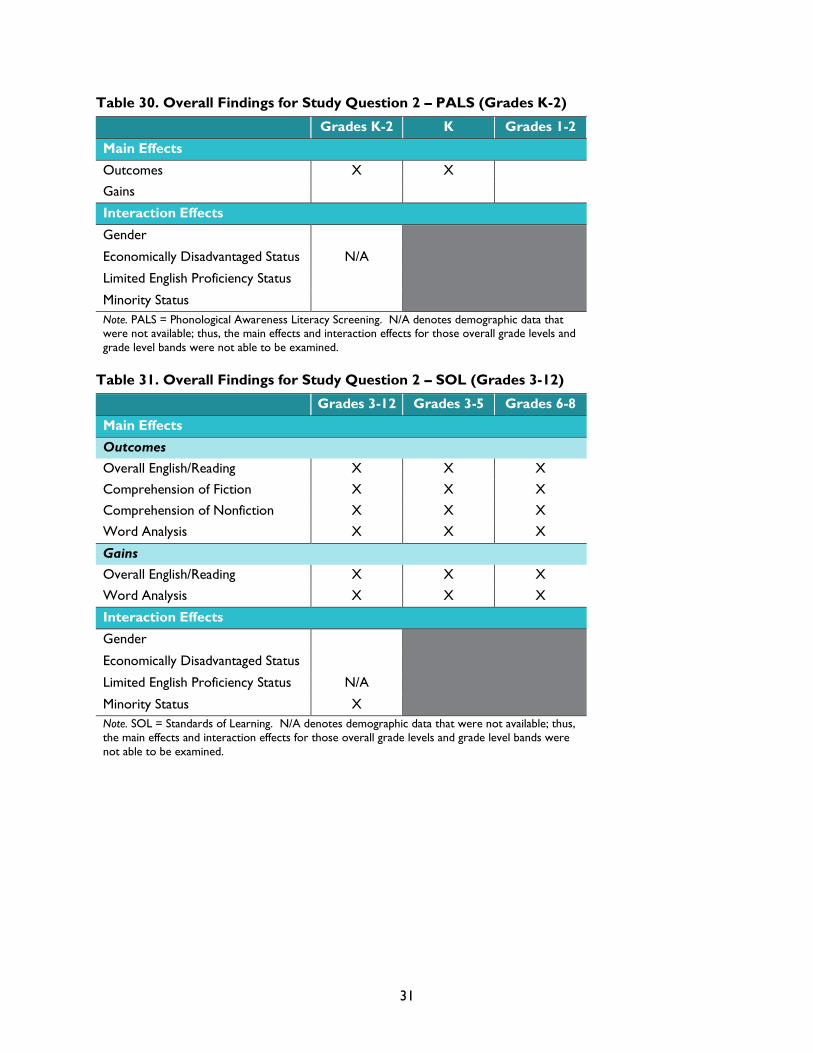
31
Table 30. Overall Findings for Study Question 2 – PALS (Grades K-2)
Grades K-2 K Grades 1-2
Main Effects
Outcomes X X
Gains
Interaction Effects
Gender
Economically Disadvantaged Status N/A
Limited English Proficiency Status
Minority Status
Note. PALS = Phonological Awareness Literacy Screening. N/A denotes demographic data that were not available; thus, the main effects and interaction effects for those overall grade levels and
grade level bands were not able to be examined.
Table 31. Overall Findings for Study Question 2 – SOL (Grades 3-12)
Grades 3-12 Grades 3-5 Grades 6-8
Main Effects
Outcomes
Overall English/Reading X X X
Comprehension of Fiction X X X
Comprehension of Nonfiction X X X
Word Analysis X X X
Gains
Overall English/Reading X X X
Word Analysis X X X
Interaction Effects
Gender
Economically Disadvantaged Status
Limited English Proficiency Status N/A
Minority Status X
Note. SOL = Standards of Learning. N/A denotes demographic data that were not available; thus,
the main effects and interaction effects for those overall grade levels and grade level bands were
not able to be examined.

32
Conclusions and Recommendations
Overall, findings of this study are encouraging as it is a large-scale study design involving a
total of 35 library systems across the state of Virginia. Specifically, findings from this study suggests
that students who attended the summer reading programs offered by Virginia’s library systems
performed better academically and experienced greater gains in their academic performance than
their nonparticipating peers. Participants outperformed nonparticipants on posttests across all
measures and all grade groups (i.e., K-2, 3-5, and 6-8). Additionally, in most cases, participants (i.e.,
students in grades 3-5 and 6-8) demonstrated greater gains in outcomes in comparison to
nonparticipants. Although the youngest students in the sample (i.e., students in grades K-2)
demonstrated losses from pretest to posttest, those losses were even greater for nonparticipants.
These findings are consistent with existing research literature that demonstrates that, while children
tend to demonstrate reading loss during the summer months, student participation in summer
reading programs seem to mitigate the loss as they provide students with access to reading materials
and activities that encourage reading (Mraz & Rasinski, 2007). Additionally, based on the Year 1
findings, some Virginia public library systems are implementing practices that have been found to be
positively associated with student reading outcomes, such as collaborating with local schools;
providing age-appropriate reading lists; and involving partners in program activities (Good, Ho, &
Fryman, 2014). Future research is warranted to investigate whether students from the libraries that
implement evidence-based practices outperform students from the other libraries that are not
implementing these practices.
Additionally, the effect of the summer reading program did not differ by gender, limited
English proficiency status, or economically disadvantaged status. However, there was some
differentiation for minority students in grades 3-12. Specifically, the 2013 Summer Reading Program
demonstrated a greater effect for minority students than nonminority students for the
Comprehension of Fiction subscore.
Taken together, these findings suggest that summer reading programs may prevent summer
reading loss or even facilitate learning gains when schools are not in session. Summer reading
programs may also serve as an alternative avenue to close achievement gaps between minority
groups and their White counterparts. To investigate how and why summer reading programs work
to support student reading outcomes, further research is warranted. For instance, what are the key
ingredients of summer reading programs that support student achievement? Such a study may
provide additional research for the field as to the evidence-based practices that best support student
reading outcomes.

33
References
Allison, P. (2001). Missing data. Thousand Oaks, CA: Sage.
Borman, G. D., & D’Agostino, J. V. (1996). Title I and student achievement: A meta-analysis of
federal results. Educational Evaluation and Policy Analysis, 18, 309-326.
Celano, D., & Neuman, S. (2001). The role of public libraries in children’s literacy development: An evaluation
report. Harrisburg, PA: Pennsylvania Library Association.
Cohen, J. (1977). Statistical power analysis for behavioral sciences. New York, NY: Academic Press.
Cook, T. D. (2005). Emergent principles for the design, implementation, and analysis of cluster-
based experiments in social science. ANNALS of the American Academy of Political and Social
Science, 599, 176-198.
Cooper, H., Nye, B., Charlton, K., Lindsay, J., & Greathouse, S. (1996). The effects of summer
vacation on achievement test scores: A narrative and meta-analytic review. Review of
Educational Research, 66(3), 227-227.
Good, K., Ho, H., & Fryman, M. (2014). Impact of Virginia Public Libraries’ Summer Reading Program:
Library of Virginia Year 1 Report. Charleston, WV: McREL International.
Hedges, L. V., & Hedberg, E. C. (2007). Intraclass correlations for planning group randomized
experiments in rural education. Journal of Research in Rural Education, 22(10), 1-15.
Konstantopoulos, S. (2011). Optimal sampling of units in three-level cluster randomized designs: an
ANCOVA framework. Educational and Psychological Measurement, 71(5), 798-813.
Lipsey, M. W., Puzio, K., Yun, C., Hebert, M. A., Steinka-Fry, K., Cole, M. W., Roberts, M.,
Anthony, K. S., & Busick, M. D. (2012). Translating the statistical representation of the effects of
education interventions into more readily interpretable forms (NCSER 2013-3000). Washington, DC:
National Center for Special Education Research, Institute of Education Sciences,
U.S. Department of Education.
Luftig, R. L. (2003). When a little bit means a lot: The effects of a short-term reading program on
economically disadvantaged elementary schoolers. Reading Research and Instruction, 42(4), 1-13.
Matthews, J. (2010). Evaluating summer reading programs: Suggested improvements. Public Libraries,
49, 34-40.
McGill-Franzen, A., & Allington, R. (2004). Lost summers: Few books and few opportunities to read.
Retrieved from http://www.readingrockets.org/article/394/

34
Moerbeek, M., van Breukelen, G. J. P., & Berger, M. P. F. (2000). Design issues for experiments in
multilevel populations. Journal of Educational and Behavioral Statistics, 25(3), 271-284.
Mraz, M., & Rasinski, T. V. (2007). Summer reading loss. The Reading Teacher, 60(8), 784-789.
Rubin, D. B. (2001). Using propensity scores to help design observational studies: Application to the
tobacco litigation. Health Services & Outcomes Research Methodology, 2, 169-188.
Search Institute. (2007). 40 Developmental Assets for Adolescents. Minneapolis, MN: Author. Retrieved
from http://www.search-institute.org/content/40-developmental-assets-adolescents-ages-
12-18
Spybrook, J., Bloom, H., Congdon, R., Hill, C., Martinez, A., & Raudenbush, S. (2011). Optimal design
plus empirical evidence: Documentation for the "Optimal Design" software. Chicago, MI.
Stuart, E. A. (2010). Matching methods for causal inference: A review and a look forward. Statistical
Science, 25, 1-21.
Stuart, E. A., & Rubin, D. B. (2007). Best Practices in Quasi-Experimental Designs: Matching
methods for causal inference. In J. Osborne (Ed.), Best Practices in Quantitative Social Science
(Vol. 11, pp. 155-176). Thousand Oaks, CA: Sage.
U.S. Department of Education. (2014). What Works Clearinghouse Procedures and Standards Handbook,
Ver. 3.0. Washington, DC: U.S. Department of Education, Institute of Education Sciences,
National Center for Education Evaluation and Regional Assistance, What Works
Clearinghouse. Retrieved from http://ies.ed.gov/ncee/wwc/DocumentSum.aspx?sid=19
Appendix A-1
Appendix A: Summary of Propensity Score Matching Results
McREL researchers conducted propensity score matching to identify a group of
4,498 comparisons who were similar to the participant group (n = 4,598) in the following
characteristics:
Demographic characteristics
o Gender (i.e., male or female)
o Race (i.e., White, African American, Hispanic, Asian, Hawaiian or Other Pacific
Islander, American-Indian, or multiracial)
o Grade
o Economically disadvantaged status (i.e., free or reduced-price meal status, receives
Temporary Assistance for Needy Families, Medicaid eligible, and/or identified as
experiencing homelessness)
o Limited English proficiency status15
2012-2013 achievement data (assessment scores before participation in the 2013 Summer
Reading Program)
o Kindergarten group: Phonological Awareness Literacy Screening rhyme awareness
and beginning sounds awareness scores
o Grades 1-3: Phonological Awareness Literacy Screen Entry Level Sum Score,
instructional reading level, and above/below benchmark status.
o Grades 3-12: Virginia Standards of Learning scaled score, Comprehension of Printed
Materials subscale score, Word Analysis Strategies and Information Resources
subscale score, and proficiency level.
Because participants from different grade levels took different tests, researchers conducted
propensity score matching separately for three groups: Kindergarten, grades 1-316, and grades 3-12.
After the matching process was complete, balance diagnostics were conducted to check the quality
of the matches. It was expected that the selected comparison group would be similar to the
participating group on all covariates being used for the propensity score matching process (Rubin,
2001). As shown in Figure A1, an examination of the distribution of propensity scores was first
conducted to assess common support via a graphic diagnostic; then, three numerical balance
measures were used to check covariate balances at the student level (Rubin, 2001):
15 Limited English proficiency data were only available within the Phonological Awareness Literacy Screening dataset.
16 In Virginia, third grade students take the Phonological Awareness Literacy Screening assessment in the fall; those who did not
pass the benchmark in the fall retake the test in the spring. Third grade students also take the Standards of Learning
assessment in the spring. For this study, Standards of Learning assessment scores were used as the key covariates for
propensity score matching. For those who did not have data available from the Standards of Learning assessment (n = 7),
scores from the Phonological Awareness Literacy Screening were used.
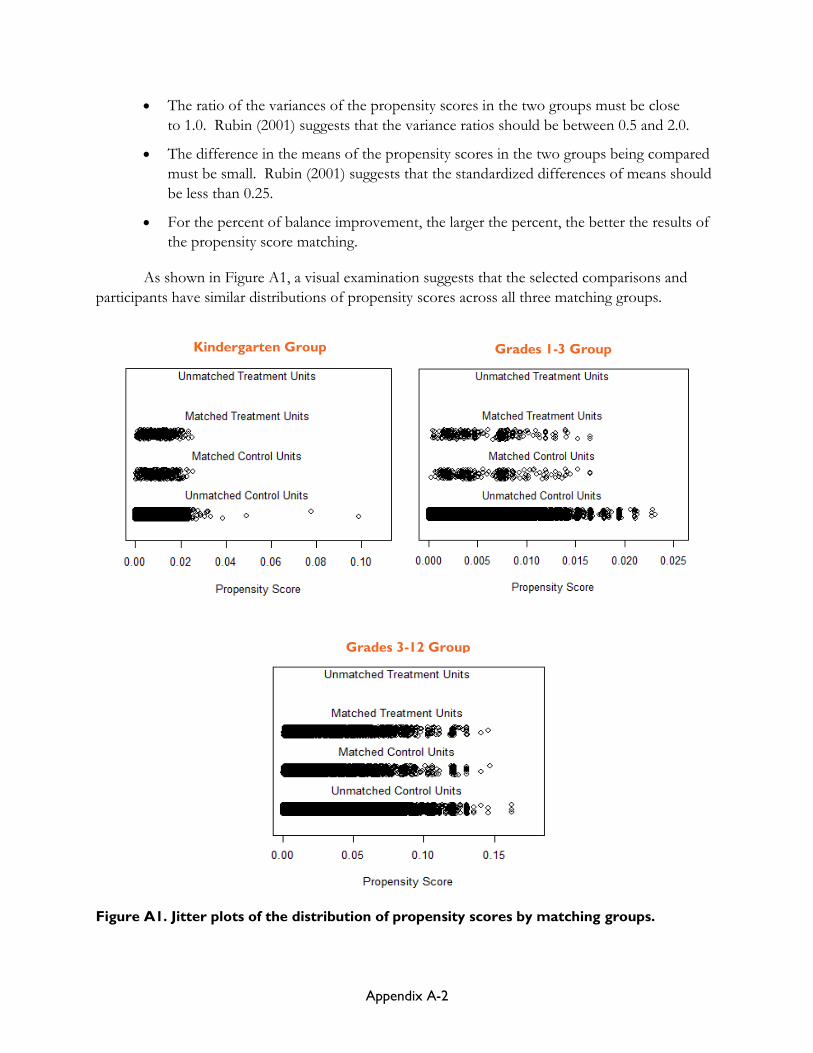
Appendix A-2
Kindergarten Group Grades 1-3 Group
Grades 3-12 Group
The ratio of the variances of the propensity scores in the two groups must be close
to 1.0. Rubin (2001) suggests that the variance ratios should be between 0.5 and 2.0.
The difference in the means of the propensity scores in the two groups being compared
must be small. Rubin (2001) suggests that the standardized differences of means should
be less than 0.25.
For the percent of balance improvement, the larger the percent, the better the results of
the propensity score matching.
As shown in Figure A1, a visual examination suggests that the selected comparisons and
participants have similar distributions of propensity scores across all three matching groups.
Figure A1. Jitter plots of the distribution of propensity scores by matching groups.

Appendix A-3
As shown in Table A1, the ratio of the variances of the propensity scores equals 1.00 across
all three matching groups, as suggested by Rubin (2001). The analyses of standard mean differences
suggest that the matching procedures have significantly minimized the group mean differences
between the participant and comparison groups across all three matching groups. Most importantly,
after the propensity score matching process, the majority of the covariates had a standardized mean
difference smaller than 0.1, which is much smaller than the value of 0.25 suggested by Rubin (2001).
The percent of balance improvement ranged from 13% to 100% across all matching groups. Taken
together, these diagnostic criteria suggest that the participants and selected comparisons were similar
by key demographics as well as assessment covariates before the 2013 Summer Reading Program.

Appendix A-4
Table A1. Balance Diagnosis Before and After the Propensity Score Matching Process17
Variables
Participants Comparison Balance Diagnosis
Before After Variance
Ratio
Standard Mean
Differences % Balance
Improvement M SD M SD M SD Before After
Kindergarten Group
Propensity Score 0.01 0.01 0.01 0.01 0.01 0.01 1.00 0.79 0.03 96.4
Gender 0.51 0.50 0.51 0.50 0.51 0.50 0.01 0.01 12.8
Race 1.65 1.38 1.93 1.48 1.63 1.33 0.21 0.01 96.2
Economically Disadvantaged Status 0.22 0.42 0.51 0.50 0.21 0.41 0.69 0.03 94.8
Limited English Proficiency Status 0.02 0.13 0.07 0.25 0.02 0.15 0.35 0.03 92.2
PALS Entry Level Sum Score 75.27 19.78 60.54 24.64 75.13 21.14 0.74 0.01 99.0
Below PALS Benchmark 0.03 0.16 0.13 0.34 0.04 0.20 0.65 0.09 85.7
PALS Rhyme Awareness Score 8.90 0.00 8.02 2.41 8.90 2.00 0.47 0.02 99.6
PALS Beginning Sound Awareness Score 9.22 1.86 8.29 2.41 9.12 1.89 0.56 0.06 89.2
Grades 1-3
Propensity Score 0.01 0.004 0.003 0.003 0.01 0.004 1.00 0.75 0.01 98.3
Grade 1.41 0.55 1.84 0.79 1.39 0.58 0.79 0.04 95.5
Gender 0.47 0.50 0.52 0.50 0.49 0.50 0.10 0.04 60.3
Race 1.68 1.35 1.89 1.40 1.59 1.22 0.15 0.07 52.1
Economically Disadvantaged Status 0.25 0.44 0.53 0.50 0.30 0.46 0.64 0.10 84.6
Limited English Proficiency Status 0.03 0.17 0.63 0.24 0.03 0.17 0.18 0.00 100.0
PALS Entry Level Sum Score 60.71 13.86 54.37 16.49 60.35 14.05 0.46 0.03 94.3
Below PALS Benchmark 0.05 0.23 0.19 0.39 0.04 0.20 0.58 0.05 91.1
Instructional Reading Level 7.20 3.99 7.48 4.21 7.18 4.11 0.07 0.01 90.3
17 Balance diagnosis is a process to determine whether baseline equivalence is established.

Appendix A-5
Variables
Participants Comparison Balance Diagnosis
Before After Variance
Ratio
Standard Mean
Differences % Balance
Improvement M SD M SD M SD Before After
Grades 3-12
Propensity Score 0.03 0.02 0.01 0.01 0.03 0.02 1.00 0.71 0.01 98.0
Grade 4.59 1.68 6.18 2.40 4.65 1.75 0.94 0.04 96.0
Gender 0.39 0.49 0.51 0.50 0.39 0.49 0.26 0.01 99.6
Race 1.71 1.44 1.82 1.38 1.73 1.38 0.08 0.01 83.2
Economically Disadvantaged Status 0.25 0.44 0.44 0.50 0.26 0.44 0.42 0.01 96.0
SOL Scaled Score 467.08 62.56 429.34 63.17 466.23 64.25 0.60 0.01 97.7
SOL Comprehension of Printed Materials
Subscale Score 36.49 6.78 33.58 18.82 36.42 6.92
0.43 0.01 97.4
SOL Word Analysis Strategies and Information Resources Subscale Score
36.51 6.65 33.47 18.88 36.40 6.77
0.45 0.02 96.5
Proficiency Level 4.18 0.66 3.78 0.79 4.17 0.70 0.60 0.02 97.4
Note. PALS = Phonological Awareness Literacy Screening; SOL = Standards of Learning
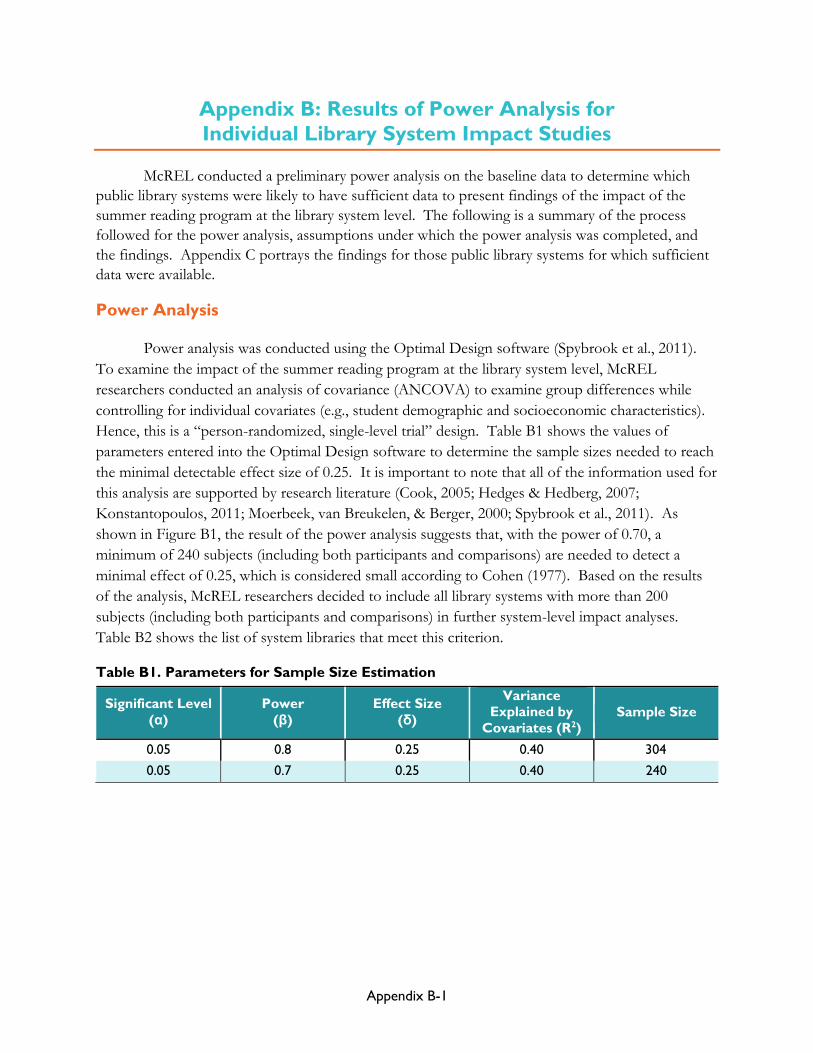
Appendix B-1
Appendix B: Results of Power Analysis for
Individual Library System Impact Studies
McREL conducted a preliminary power analysis on the baseline data to determine which
public library systems were likely to have sufficient data to present findings of the impact of the
summer reading program at the library system level. The following is a summary of the process
followed for the power analysis, assumptions under which the power analysis was completed, and
the findings. Appendix C portrays the findings for those public library systems for which sufficient
data were available.
Power Analysis
Power analysis was conducted using the Optimal Design software (Spybrook et al., 2011).
To examine the impact of the summer reading program at the library system level, McREL
researchers conducted an analysis of covariance (ANCOVA) to examine group differences while
controlling for individual covariates (e.g., student demographic and socioeconomic characteristics).
Hence, this is a “person-randomized, single-level trial” design. Table B1 shows the values of
parameters entered into the Optimal Design software to determine the sample sizes needed to reach
the minimal detectable effect size of 0.25. It is important to note that all of the information used for
this analysis are supported by research literature (Cook, 2005; Hedges & Hedberg, 2007;
Konstantopoulos, 2011; Moerbeek, van Breukelen, & Berger, 2000; Spybrook et al., 2011). As
shown in Figure B1, the result of the power analysis suggests that, with the power of 0.70, a
minimum of 240 subjects (including both participants and comparisons) are needed to detect a
minimal effect of 0.25, which is considered small according to Cohen (1977). Based on the results
of the analysis, McREL researchers decided to include all library systems with more than 200
subjects (including both participants and comparisons) in further system-level impact analyses.
Table B2 shows the list of system libraries that meet this criterion.
Table B1. Parameters for Sample Size Estimation
Significant Level
(α)
Power
(β)
Effect Size
(δ)
Variance Explained by
Covariates (R2) Sample Size
0.05 0.8 0.25 0.40 304
0.05 0.7 0.25 0.40 240

Appendix B-2
Figure B1. Power vs. sample sizes
Table B2. Selected Library Systems
Library System Number of
Participants
Number of
Comparisons
Total Number
of Subjects
Hampton Public Library 106 121 227
Bedford Public Library System 192 69 261
Handley Regional Library System 154 145 299
Jefferson-Madison Regional Library 67 233 300
Roanoke County Public Library 246 107 353
Pamunkey Regional Library 137 217 354
Chesapeake Public Library 503 293 796
Central Rappahannock Regional Library 670 444 1,114
Chesterfield County Public Library 720 489 1,209
Virginia Beach Public Library 873 567 1,440
Total number of subjects
Power
180 260 340 420 500
0.1
0.2
0.3
0.4
0.5
0.6
0.7
0.8
0.9
1.0 = 0.050
= 0.25,R2L2
= 0.40
Appendix C-1
Appendix C: Individual Library Systems Impact Analysis
The effect of the summer reading program was tested on 10 individual public library systems
for which there were sufficient sample sizes available to detect minimal effect sizes (see Appendix B
for more detail about this process). The individual library systems impact analysis was conducted
using regression with the post-intervention measure (i.e., 2013-2014 Phonological Awareness
Literacy Screening or Standards of Learning scores) as the dependent variable and the pretest (i.e.,
2012-2013 Phonological Awareness Literacy Screening or Standards of Learning scores) and
background characteristics as covariates; the treatment indicator was the coefficient of interest.
Each of the main impact model contrasts (see Table C1) were tested. Although for this part
of the study, instead of contrasts with the full sample in the impact estimation, there were separate
impact estimations made for each of the 10 library systems. In the outcome model below, 1 was
the coefficient of interest.
iiii rpretesttreatmentOutcome ...** 210
Where
Postscript i is the student index
Outcome is the posttest score
Pretest is the pretest score
Program participation is a binary indicator of students’ group membership
“…” indicates student-level covariates
The error term ri is assumed to have a normal distribution with a mean of zero and
constant variance σ2
For the gain score model below, the coefficient of interest was 1 :
iii rtreatmentGainScore ..*10
Where
Gain Score = posttest measure – pretest measure
Postscript i is the student index
Program participation is a binary indicator of students’ group membership
“…” indicates the multiple student level covariates
The error term ri is assumed to have a normal distribution with a mean of zero and
constant variance σ2
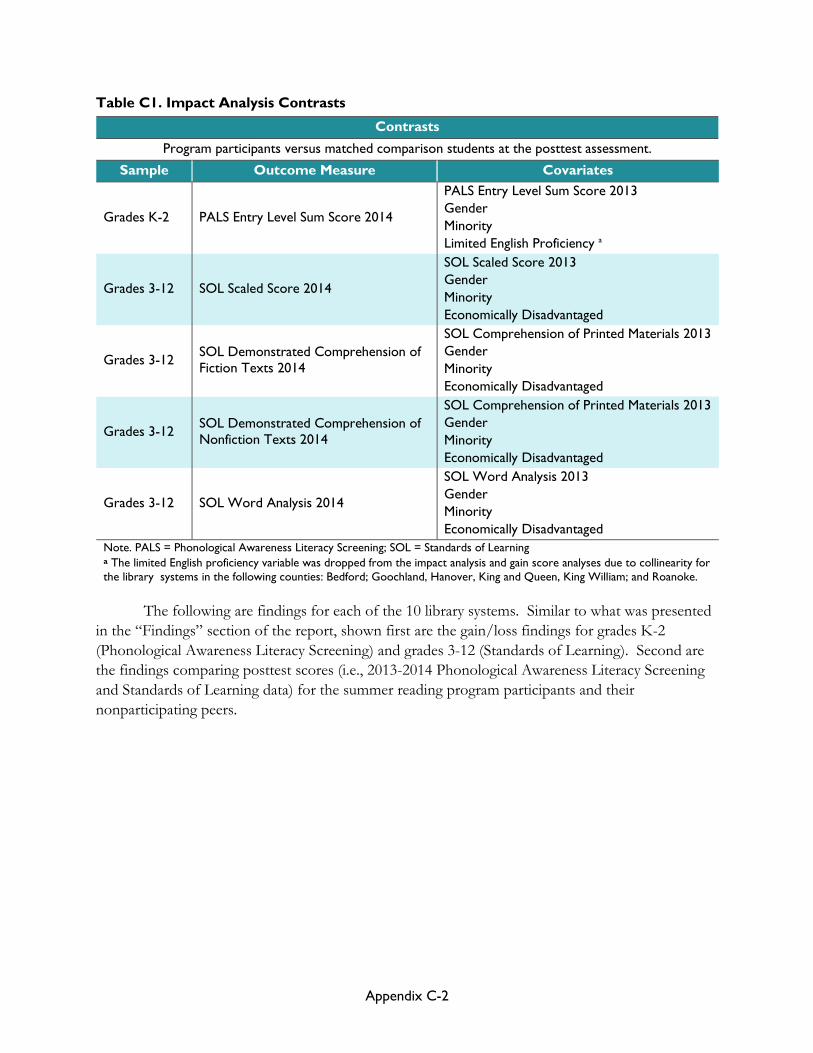
Appendix C-2
Table C1. Impact Analysis Contrasts
Contrasts
Program participants versus matched comparison students at the posttest assessment.
Sample Outcome Measure Covariates
Grades K-2 PALS Entry Level Sum Score 2014
PALS Entry Level Sum Score 2013
Gender
Minority
Limited English Proficiency a
Grades 3-12 SOL Scaled Score 2014
SOL Scaled Score 2013
Gender
Minority
Economically Disadvantaged
Grades 3-12 SOL Demonstrated Comprehension of
Fiction Texts 2014
SOL Comprehension of Printed Materials 2013
Gender
Minority
Economically Disadvantaged
Grades 3-12 SOL Demonstrated Comprehension of
Nonfiction Texts 2014
SOL Comprehension of Printed Materials 2013
Gender
Minority
Economically Disadvantaged
Grades 3-12 SOL Word Analysis 2014
SOL Word Analysis 2013
Gender
Minority
Economically Disadvantaged
Note. PALS = Phonological Awareness Literacy Screening; SOL = Standards of Learning a The limited English proficiency variable was dropped from the impact analysis and gain score analyses due to collinearity for
the library systems in the following counties: Bedford; Goochland, Hanover, King and Queen, King William; and Roanoke.
The following are findings for each of the 10 library systems. Similar to what was presented
in the “Findings” section of the report, shown first are the gain/loss findings for grades K-2
(Phonological Awareness Literacy Screening) and grades 3-12 (Standards of Learning). Second are
the findings comparing posttest scores (i.e., 2013-2014 Phonological Awareness Literacy Screening
and Standards of Learning data) for the summer reading program participants and their
nonparticipating peers.
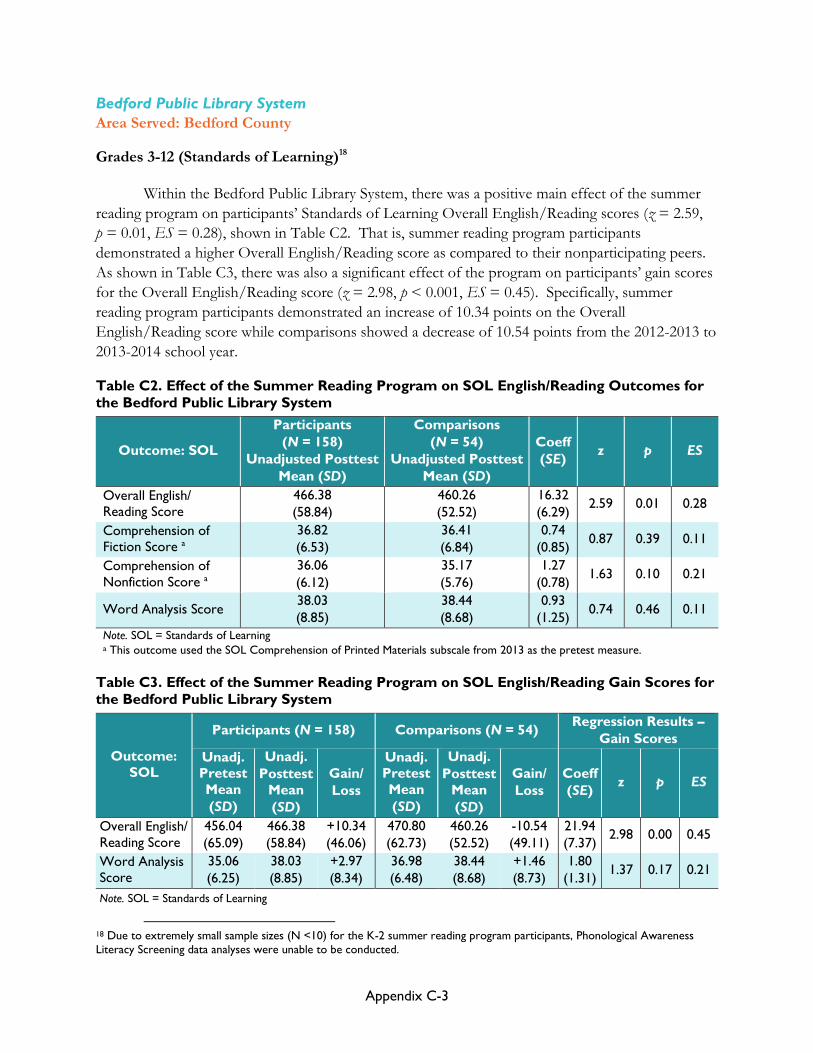
Appendix C-3
Bedford Public Library System
Area Served: Bedford County
Grades 3-12 (Standards of Learning)18
Within the Bedford Public Library System, there was a positive main effect of the summer
reading program on participants’ Standards of Learning Overall English/Reading scores (z = 2.59,
p = 0.01, ES = 0.28), shown in Table C2. That is, summer reading program participants
demonstrated a higher Overall English/Reading score as compared to their nonparticipating peers.
As shown in Table C3, there was also a significant effect of the program on participants’ gain scores
for the Overall English/Reading score (z = 2.98, p < 0.001, ES = 0.45). Specifically, summer
reading program participants demonstrated an increase of 10.34 points on the Overall
English/Reading score while comparisons showed a decrease of 10.54 points from the 2012-2013 to
2013-2014 school year.
Table C2. Effect of the Summer Reading Program on SOL English/Reading Outcomes for
the Bedford Public Library System
Outcome: SOL
Participants
(N = 158)
Unadjusted Posttest
Mean (SD)
Comparisons
(N = 54)
Unadjusted Posttest
Mean (SD)
Coeff
(SE) z p ES
Overall English/ Reading Score
466.38
(58.84)
460.26
(52.52)
16.32
(6.29) 2.59 0.01 0.28
Comprehension of Fiction Score a
36.82
(6.53)
36.41
(6.84)
0.74
(0.85) 0.87 0.39 0.11
Comprehension of
Nonfiction Score a
36.06
(6.12)
35.17
(5.76)
1.27
(0.78) 1.63 0.10 0.21
Word Analysis Score 38.03
(8.85)
38.44
(8.68)
0.93
(1.25) 0.74 0.46 0.11
Note. SOL = Standards of Learning a This outcome used the SOL Comprehension of Printed Materials subscale from 2013 as the pretest measure.
Table C3. Effect of the Summer Reading Program on SOL English/Reading Gain Scores for
the Bedford Public Library System
Outcome:
SOL
Participants (N = 158) Comparisons (N = 54) Regression Results –
Gain Scores
Unadj. Pretest
Mean
(SD)
Unadj.
Posttest
Mean
(SD)
Gain/
Loss
Unadj. Pretest
Mean
(SD)
Unadj.
Posttest
Mean
(SD)
Gain/
Loss
Coeff
(SE) z p ES
Overall English/
Reading Score
456.04
(65.09)
466.38
(58.84)
+10.34
(46.06)
470.80
(62.73)
460.26
(52.52)
-10.54
(49.11)
21.94
(7.37) 2.98 0.00 0.45
Word Analysis Score
35.06
(6.25)
38.03
(8.85)
+2.97
(8.34)
36.98
(6.48)
38.44
(8.68)
+1.46
(8.73)
1.80
(1.31) 1.37 0.17 0.21
Note. SOL = Standards of Learning
18 Due to extremely small sample sizes (N <10) for the K-2 summer reading program participants, Phonological Awareness
Literacy Screening data analyses were unable to be conducted.

Appendix C-4
Central Rappahannock Regional Library
Areas Served: Stafford County, Westmoreland County, Spotsylvania County, and Fredericksburg City
Grades K-2 (Phonological Awareness Literacy Screening)
Within the Central Rappahannock Regional Library, program participants outperformed
comparison students by a small, but statistically significant margin for posttest outcomes (z = 2.75,
p = 0.01, ES = 0.42) (Table C4). As shown in Table C5, while both participants and comparisons
demonstrated reading losses, the loss was much smaller for participants than for comparisons
(z = 3.12, p < 0.001, ES = 0.56).
Table C4. Effect of the Summer Reading Program on PALS Outcomes for the Central
Rappahannock Regional Library
Outcome: PALS
Participants
(N = 87)
Unadjusted Posttest
Mean (SD)
Comparisons
(N = 47)
Unadjusted Posttest
Mean (SD)
Coeff
(SE) z p ES
Entry Level Sum Score 64.54
(11.72)
61.83
(13.13)
5.09
(1.85) 2.75 0.01 0.42
Note. PALS = Phonological Awareness Literacy Screening
Table C5. Effect of the Summer Reading Program on PALS Gain Scores for the Central
Rappahannock Regional Library
Outcome:
PALS
Participants (N = 87) Comparisons (N = 47) Regression Results –
Gain Scores
Unadj. Pretest
Mean
(SD)
Unadj.
Posttest Mean
(SD)
Gain/
Loss
Unadj. Pretest
Mean
(SD)
Unadj.
Posttest Mean
(SD)
Gain/
Loss
Coeff
(SE) z p ES
Entry Level
Sum Score
64.60
(18.85)
64.54
(11.72)
-0.06
(16.39)
70.85
(18.95)
61.83
(13.13)
-9.02
(16.15)
8.98
(2.87) 3.12 0.00 0.56
Note. PALS = Phonological Awareness Literacy Screening
Grades 3-12 (Standards of Learning)
There were also statistically significant positive effects of the summer reading program on
students’ Standards of Learning Overall English/Reading scores (z = 5.42, p < 0.001, ES = 0.27),
Comprehension of Fiction subscale scores (z = 2.61, p = 0.01, ES = 0.16), Comprehension of
Nonfiction subscale scores (z = 3.91, p < 0.001, ES = 0.24), and Word Analysis subscale scores
(z = 3.55, p < 0.001, ES = 0.22) (Table C6). As shown in Table C7, there were similar positive
effects of the program on students’ gain scores for the Overall English/Reading score (z = 5.31,
p < 0.001, ES = 0.38) and Word Analysis subscale (z = 3.62, p < 0.001, ES =0.25). In particular, for
both sets of scores, the participants showed increases and the comparisons showed decreases.

Appendix C-5
Table C6. Effect of the Summer Reading Program on SOL English/Reading Outcomes for
the Central Rappahannock Regional Library
Outcome: SOL Participants
(N = 517)
Comparisons
(N = 321)
Unadjusted Posttest
Mean (SD)
Coeff
(SE) z p ES
Overall English/ Reading Score
473.57
(65.74)
458.19
(61.76)
17.51
(3.23) 5.42 0.00 0.27
Comprehension of Fiction Score a
37.27
(6.91)
36.16
(7.07)
1.13
(0.43) 2.61 0.01 0.16
Comprehension of Nonfiction Score a
37.09
(6.77)
35.50
(6.44)
1.57
(0.40) 3.91 0.00 0.24
Word Analysis Score 38.37
(9.29)
36.54
(8.72)
2.03
(0.57) 3.55 0.00 0.22
Note. SOL = Standards of Learning a This outcome used the SOL Comprehension of Printed Materials subscale from 2013 as the pretest measure.
Table C7. Effect of the Summer Reading Program on SOL English/Reading Gain Scores for
the Central Rappahannock Regional Library
Outcome:
SOL
Participants (N = 517) Comparisons (N = 321) Regression Results –
Gain Scores
Unadj.
Pretest
Mean
(SD)
Unadj.
Posttest
Mean
(SD)
Gain/
Loss
Unadj.
Pretest
Mean
(SD)
Unadj.
Posttest
Mean
(SD)
Gain/
Loss
Coeff
(SE) z p ES
Overall English/ Reading Score
467.67
(60.54)
473.57
(65.74)
+5.91
(48.91)
470.32
(62.57)
458.19
(61.76)
-12.12
(47.88)
18.29
(3.44) 5.31 0.00 0.38
Word Analysis Score
36.53
(6.31)
38.37
(9.29)
+1.84
(8.27)
36.89
(6.78)
36.54
(8.72)
-0.35
(8.74)
2.17
(0.60) 3.62 0.00 0.25
Note. SOL = Standards of Learning

Appendix C-6
Chesterfield County Public Library
Area Served: Chesterfield County
Grades K-2 (Phonological Awareness Literacy Screening)
Within the Chesterfield County Public Library, there were no significant effects of the
summer reading program on the posttests (z = -0.11, p = 0.91, ES = -0.03) or gain scores (z = -0.59,
p = 0.56, ES = -0.18) as measured by the Phonological Awareness Literacy Screening (Tables C8
and C9).
Table C8. Effect of the Summer Reading Program on PALS Outcomes for the Chesterfield
County Public Library
Outcome: PALS
Participants
(N = 33)
Unadjusted Posttest
Mean (SD)
Comparisons
(N = 26)
Unadjusted Posttest
Mean (SD)
Coeff
(SE) z p ES
Entry Level Sum Score 56.03
(13.11)
55.50
(12.86)
-0.37
(3.32) -0.11 0.91 -0.03
Note. PALS = Phonological Awareness Literacy Screening
Table C9. Effect of the Summer Reading Program on PALS Reading Gain Scores for the
Chesterfield County Public Library
Outcome: PALS
Participants (N = 33) Comparisons (N = 26) Regression Results –
Gain Scores
Unadj.
Pretest Mean
(SD)
Unadj.
Posttest Mean
(SD)
Gain/
Loss
Unadj.
Pretest Mean
(SD)
Unadj.
Posttest Mean
(SD)
Gain/
Loss
Coeff
(SE) z p ES
Entry Level
Sum Score 71.70
(21.13)
56.03
(13.11)
-15.67
(21.85)
67.96
(19.21)
55.50
(12.86)
-12.46
(17.88)
-3.16
(5.37) -0.59 0.56 -0.18
Note. PALS = Phonological Awareness Literacy Screening
Grades 3-12 (Standards of Learning)
There were also statistically significant positive effects of the summer reading program on
students’ Standards of Learning Overall English/Reading scores (z = 4.51, p < 0.001, ES = 0.19)
and Comprehension of Fiction subscale scores (z = 3.76, p < 0.001, ES = 0.20) (Table C10). As
shown in Table C11, there were similar positive effects of the program on students’ gain scores for
the Overall English/Reading score (z = 5.12, p < 0.001, ES = 0.30). Specifically, while participants
demonstrated a gain in the Overall English/Reading outcome (1.25), comparisons showed a loss
(-13.48).

Appendix C-7
Table C10. Effect of the Summer Reading Program on SOL English/Reading Outcomes for
the Chesterfield County Public Library
Outcome: SOL
Participants
(N = 669)
Unadjusted Posttest
Mean (SD)
Comparisons
(N = 418)
Unadjusted Posttest
Mean (SD)
Coeff
(SE) z p ES
Overall English/ Reading Score
469.92
(61.47)
462.79
(59.72)
11.60
(2.57) 4.51 0.00 0.19
Comprehension of Fiction Score a
37.28
(6.87)
36.08
(6.90)
1.37
(0.37) 3.76 0.00 0.20
Comprehension of Nonfiction Score a
36.43
(6.72)
36.01
(6.40)
0.60
(0.34) 1.76 0.08 0.09
Word Analysis Score 37.88
(9.02)
37.80
(9.15)
0.34
(0.49) 0.68 0.50 0.04
Note. SOL = Standards of Learning a This outcome used the SOL Comprehension of Printed Materials subscale from 2013 as the pretest measure.
Table C11. Effect of the Summer Reading Program on SOL English/Reading Gain Scores
for the Chesterfield County Public Library
Outcome:
SOL
Participants (N = 669) Comparisons (N = 418) Regression Results –
Gain Scores
Unadj.
Pretest
Mean
(SD)
Unadj.
Posttest
Mean
(SD)
Gain/
Loss
Unadj.
Pretest
Mean
(SD)
Unadj.
Posttest
Mean
(SD)
Gain/
Loss
Coeff
(SE) z p ES
Overall English/
Reading Score
468.67
(61.82)
469.92
(61.47)
+1.25
(43.77)
476.28
(67.97)
462.79
(59.72)
-13.48
(49.81)
14.78
(2.89) 5.12 0.00 0.30
Word Analysis
Score
36.86
(6.66)
37.88
(9.02)
+1.02
(8.47)
37.50
(7.10)
37.80
(9.15)
+0.31
(8.07)
0.65
(0.52) 1.25 0.21 0.08

Appendix C-8
Chesapeake Public Library
Area Served: Chesapeake City
Grades K-2 (Phonological Awareness Literacy Screening)
Within the Chesapeake Public Library, there were no significant effects of the summer
reading program on the posttests (z = 1.37, p = 0.17, ES = 0.18) or gain scores (z = 1.70, p = 0.09,
ES = 0.27) measured by the Phonological Awareness Literacy Screening (Tables C12 and C13).
Table C12. Effect of the Summer Reading Program on PALS Outcomes for the
Chesapeake Public Library
Outcome: PALS
Participants
(N = 116)
Unadjusted Posttest
Mean (SD)
Comparisons
(N = 35)
Unadjusted Posttest
Mean (SD)
Coeff
(SE) z p ES
Entry Level Sum Score 62.25
(14.49)
61.66
(13.79)
2.55
(1.87) 1.37 0.17 0.18
Note. PALS = Phonological Awareness Literacy Screening
Table C13. Effect of the Summer Reading Program on PALS Gain Scores for the
Chesapeake Public Library
Outcome:
PALS
Participants (N = 116) Comparisons (N = 35) Regression Results –
Gain Scores
Unadj. Pretest
Mean
(SD)
Unadj.
Posttest Mean
(SD)
Gain/
Loss
Unadj. Pretest
Mean
(SD)
Unadj.
Posttest Mean
(SD)
Gain/
Loss
Coeff
(SE) z p ES
Entry Level Sum Score
70.39 (16.91)
62.25 (14.49)
-814 (10.94)
73.46 (17.30)
61.66 (13.79)
-11.80 (13.83)
3.80 (2.23)
1.70 0.09 0.27
Note. PALS = Phonological Awareness Literacy Screening
Grades 3-12 (Standards of Learning)
There were also statistically significant positive effects of the summer reading program on
students’ Standards of Learning Overall English/Reading scores (z = 3.71, p < 0.001, ES = 0.23);
Comprehension of Nonfiction subscale scores (z = 3.80, p < 0.001, ES = 0.28), and Word Analysis
subscale scores (z = 2.87, p < 0.001, ES = 0.22) (Table C14). As shown in Table C15, there were
similar positive effects of the program on students’ gain scores for the Overall English/Reading
score (z = 2.71, p = 0.01, ES = 0.24) and Word Analysis subscale (z = 2.28, p = 0.02, ES = 0.21).
Specifically, while participants demonstrated gains in the Overall English/Reading score (4.41),
comparisons had losses (-6.96). While both participants and comparisons demonstrated gains on
the Word Analysis subscale, participants showed greater gains (2.75) compared to the comparisons
(1.03).

Appendix C-9
Table C14. Effect of the Summer Reading Program on SOL English/Reading Outcomes for
the Chesapeake Public Library
Outcome: SOL
Participants
(N = 336)
Unadjusted Posttest
Mean (SD)
Comparisons
(N = 213)
Unadjusted Posttest
Mean (SD)
Coeff
(SE) z p ES
Overall English/ Reading Score
476.47
(63.68)
452.74
(63.44)
14.70
(3.96) 3.71 0.00 0.23
Comprehension of Fiction Score a
37.15
(6.96)
35.38
(7.28)
1.03
(0.53) 1.94 0.05 0.15
Comprehension of Nonfiction Score a
37.43
(6.61)
34.93
(6.55)
1.83
(0.48) 3.80 0.00 0.28
Word Analysis Score 39.76
(9.42)
36.96
(8.84)
2.03
(0.71) 2.87 0.00 0.22
Note. SOL = Standards of Learning a This outcome used the SOL Comprehension of Printed Materials subscale from 2013 as the pretest measure.
Table C15. Effect of the Summer Reading Program on SOL English/Reading Gain Scores
for the Chesapeake Public Library
Outcome: SOL
Participants (N = 336) Comparisons (N = 213) Regression Results –
Gain Scores
Unadj.
Pretest Mean
(SD)
Unadj.
Posttest Mean
(SD)
Gain/
Loss
Unadj.
Pretest Mean
(SD)
Unadj.
Posttest Mean
(SD)
Gain/
Loss
Coeff
(SE) z p ES
Overall English/
Reading Score
472.06
(60.29)
476.47
(63.68)
+4.41
(49.06)
459.70
(61.05)
452.74
(63.44)
-6.96
(46.71)
11.42
(4.22) 2.71 0.01 0.24
Word Analysis
Score
37.01
(6.30)
39.76
(9.42)
+2.75
(8.55)
35.93
(6.18)
36.96
(8.84)
+1.03
(8.14)
1.67
(0.73) 2.28 0.02 0.21
Note. SOL = Standards of Learning

Appendix C-10
Hampton Public Library
Area Served: Hampton City
Grades 3-12 (Standards of Learning)19
Within the Hampton Public Library, analyses revealed no main effects of the summer
reading program on students’ Standards of Learning posttests (Table C16). However, as shown in
Table C17, there was a statistically significant positive effect of the program on participants’ gain
scores for the Standards of Learning Overall English/Reading outcome (z = 2.18, p = 0.03,
ES = 0.31) as students demonstrated greater gains. Specifically, the summer reading program
participants showed an increase of 3.98 points and comparisons showed a decrease of 9.67 points.
Table C16. Effect of the Summer Reading Program on SOL English/Reading Outcomes for
the Hampton Public Library
Outcome: SOL Participants
(N = 90)
Comparisons
(N = 95)
Unadjusted Posttest
Mean (SD)
Coeff
(SE) z p ES
Overall English/
Reading Score
440.26
(58.35)
453.09
(67.71)
7.23
(6.42) 1.13 0.26 0.11
Comprehension of
Fiction Score a
34.42
(6.50)
35.22
(7.70)
0.96
(0.85) 1.12 0.26 0.13
Comprehension of
Nonfiction Score a
33.91
(6.05)
34.97
(6.28)
0.36
(0.73) 0.50 0.62 0.06
Word Analysis Score 34.69
(8.43)
37.01
(9.77)
-1.34
(1.18) -1.13 0.26 -0.15
Note. SOL = Standards of Learning a This outcome used the SOL Comprehension of Printed Materials subscale from 2013 as the pretest measure.
Table C17. Effect of the Summer Reading Program on SOL English/Reading Gain Scores
for the Hampton Public Library
Outcome:
SOL
Participants (N = 90) Comparisons (N = 95) Regression Results –
Gain Scores
Unadj. Pretest
Mean
(SD)
Unadj.
Posttest Mean
(SD)
Gain/
Loss
Unadj. Pretest
Mean
(SD)
Unadj.
Posttest Mean
(SD)
Gain/
Loss
Coeff
(SE) z p ES
Overall English/
Reading Score
436.28
(58.28)
440.26
(58.35)
+3.98
(46.22)
462.77
(63.46)
453.09
(67.71)
-9.67
(47.08)
14.55
(6.68) 2.18 0.03 0.31
Word Analysis
Score
34.00
(6.41)
34.69
(8.43)
+0.69
(7.65)
36.00
(6.64)
37.01
(9.77)
+1.01
(9.14)
-0.53
(1.22) -0.44 0.66 -0.06
Note. SOL = Standards of Learning
19 Due to extremely small sample sizes (N <10) for the summer reading program participants in grades K-2, data analyses on
the Phonological Awareness Literacy Screening were unable to be conducted.

Appendix C-11
Handley Regional Library System
Areas Served: Clarke County, Frederick County, and Winchester City
Grades 3-12 (Standards of Learning)20
Within the Handley Regional Library System, there was a statistically significant positive
effect of the summer reading program on students’ scores on the Standards of Learning
Comprehension of Nonfiction subscale (z = 2.16, p = 0.03, ES = 0.22) (Table C18). As shown in
Table C19, there were no program effects on students’ gain scores across all Standards of Learning
English/Reading outcomes.
Table C18. Effect of the Summer Reading Program on SOL English/Reading Outcomes for
the Handley Regional Library System
Outcome: SOL Participants
(N = 139)
Comparisons
(N = 111)
Unadjusted Posttest
Mean (SD)
Coeff
(SE) z p ES
Overall English/
Reading Score
473.61
(65.26)
459.05
(67.25)
4.68
(5.62) 0.83 0.41 0.07
Comprehension of
Fiction Score a
36.78
(7.34)
35.81
(7.68)
0.27
(0.75) 0.36 0.72 0.04
Comprehension of
Nonfiction Score a
37.21
(6.42)
35.20
(6.81)
1.43
(0.66) 2.16 0.03 0.22
Word Analysis Score 38.96
(9.40)
38.40
(9.53)
-0.36
(1.07) -0.34 0.74 -0.04
Note. SOL = Standards of Learning a This outcome used the SOL Comprehension of Printed Materials subscale from 2013 as the pretest measure.
Table C19. Effect of the Summer Reading Program on SOL English/Reading Gain Scores
for the Handley Regional Library System
Outcome: SOL
Participants (N = 139) Comparisons (N = 111) Regression Results –
Gain Scores
Unadj.
Pretest Mean
(SD)
Unadj.
Posttest Mean
(SD)
Gain/
Loss
Unadj.
Pretest Mean
(SD)
Unadj.
Posttest Mean
(SD)
Gain/
Loss
Coeff
(SE) z p ES
Overall English/
Reading Score
477.09
(63.58)
473.61
(65.26)
-3.47
(46.64)
465.46
(62.85)
459.05
(67.25)
-6.41
(49.47)
1.86
(5.99) 0.31 0.76 0.04
Word Analysis
Score
37.56
(6.65)
38.96
(9.40)
+1.40
(8.19)
36.07
(6.56)
38.40
(9.53)
+2.32
(9.49)
-0.91
(1.12) -0.82 0.41 -0.10
Note. SOL = Standards of Learning
20 Due to extremely small sample sizes (N <10) for the summer reading program participants in grades K-2, data analyses for
the Phonological Awareness Literacy Screening were unable to be conducted.

Appendix C-12
Jefferson-Madison Regional Library
Areas Served: Albemarle County, Greene County, Louisa County, Nelson County, and Charlottesville City
Grades 3-12 (Standards of Learning)21
Within the Jefferson-Madison Regional Library, there was a statistically significant positive
effect on students’ scores on the Standards of Learning Word Analysis subscale (z = 2.31, p = 0.02,
ES = 0.32) for those participating in the summer reading program (see Table C20). There were no
program effects on students’ gain scores across all Standards of Learning English/Reading outcomes
(see Table C21).
Table C20. Effect of the Summer Reading Program on SOL English/Reading Outcomes for
the Jefferson-Madison Regional Library
Outcome: SOL
Participants
(N = 55)
Unadjusted Posttest
Mean (SD)
Comparisons
(N = 179)
Unadjusted Posttest
Mean (SD)
Coeff
(SE) z p ES
Overall English/
Reading Score
489.56
(92.27)
472.34
(59.44)
11.31
(8.33) 1.36 0.17 0.16
Comprehension of Fiction Score a
38.64
(8.55)
37.19
(6.21)
1.63
(0.92) 1.78 0.08 0.24
Comprehension of Nonfiction Score a
38.47
(8.24)
37.12
(6.62)
1.43
(0.94) 1.53 0.13 0.20
Word Analysis Score 41.60
(10.78)
37.80
(9.19)
3.12
(1.35) 2.31 0.02 0.32
Note. SOL = Standards of Learning a This outcome used the SOL Comprehension of Printed Materials subscale from 2013 as the pretest measure.
Table C21. Effect of the Summer Reading Program on SOL English/Reading Gain Scores
for the Jefferson-Madison Regional Library
Outcome:
SOL
Participants (N = 55) Comparisons (N = 179) Regression Results –
Gain Scores
Unadj.
Pretest
Mean
(SD)
Unadj.
Posttest
Mean
(SD)
Gain/
Loss
Unadj.
Pretest
Mean
(SD)
Unadj.
Posttest
Mean
(SD)
Gain/
Loss
Coeff
(SE) z p ES
Overall English/
Reading Score
483.22
(53.85)
489.56
(92.27)
+6.35
(80.03)
474.86
(59.19)
472.34
(59.44)
-2.51
(47.79)
8.86
(8.75) 1.01 0.31 0.19
Word Analysis Score
38.12
(6.15)
41.60
(10.78)
+3.49
(9.97)
36.80
(6.38)
37.80
(9.19)
+1.00
(9.06)
2.53
(1.42) 1.79 0.07 0.28
Note. SOL = Standards of Learning
21 Due to extremely small sample sizes (N <10) for the summer reading program participants in grades K-2, data analyses for
the Phonological Awareness Literacy Screening were unable to be conducted.

Appendix C-13
Pamunkey Regional Library
Areas Served: Goochland County, Hanover County, King and Queen County, and King William County
Grades K-2 (Phonological Awareness Literacy Screening)
Within the Pamunkey Regional Library, there were no significant effects of the summer
reading program on the posttests (z = 0.13, p = 0.90, ES = 0.03) or gain scores (z = -0.56, p = 0.58,
ES = -0.15) measured by the Phonological Awareness Literacy Screening (Tables C22 and C23).
Table C22. Effect of the Summer Reading Program on PALS Outcomes for the Pamunkey
Regional Library
Outcome: PALS
Participants
(N = 16)
Unadjusted Posttest
Mean (SD)
Comparisons
(N = 23)
Unadjusted Posttest
Mean (SD)
Coeff
(SE) z p ES
Entry Level Sum Score 73.00
(10.81)
69.57
(11.99)
0.32
(2.53) 0.13 0.90 0.03
Note. PALS = Phonological Awareness Literacy Screening
Table C23. Effect of the Summer Reading Program on PALS Gain Scores for the
Pamunkey Regional Library
Outcome:
PALS
Participants (N = 16) Comparisons (N = 23) Regression Results –
Gain Scores
Unadj.
Pretest Mean
(SD)
Unadj.
Posttest
Mean
(SD)
Gain/
Loss
Unadj.
Pretest Mean
(SD)
Unadj.
Posttest
Mean
(SD)
Gain/
Loss
Coeff
(SE) z p ES
Entry Level
Sum Score 78.94
(13.91)
73.00
(10.81)
-5.94
(7.21)
73.61
(16.53)
69.57
(11.99)
-4.04
(12.50)
-1.89
(3.41) -0.56 0.58 -0.15
Note. PALS = Phonological Awareness Literacy Screening
Grades 3-12 (Standards of Learning)
There was also a statistically significant positive effect of the summer reading program on
students’ Standards of Learning Overall English/Reading scores (z = 2.27, p = 0.02, ES = 0.20)
(Table C24). As shown in Table C25, both participants and comparisons demonstrated losses in
their Overall English/Reading scores; yet, the loss was significantly greater for comparisons
(z = 2.69, p = 0.01, ES = 0.32).

Appendix C-14
Table C24. Effect of the Summer Reading Program on SOL English/Reading Outcomes for
the Pamunkey Regional Library
Outcome: SOL Participants
(N = 111)
Comparisons
(N = 172)
Unadjusted Posttest
Mean (SD)
Coeff
(SE) z p ES
Overall English/ Reading Score
473.49
(63.26)
469.11
(55.37)
11.45
(5.04) 2.27 0.02 0.20
Comprehension of Fiction Score a
37.39
(8.12)
36.41
(6.36)
1.21
(0.73) 1.65 0.10 0.17
Comprehension of Nonfiction Score a
36.16
(5.97)
36.62
(5.97)
-0.32
(0.63) -0.51 0.61 -0.05
Word Analysis Score 39.86
(9.37)
39.22
(9.17)
1.47
(1.03) 1.43 0.15 0.16
Note. SOL = Standards of Learning a This outcome used the SOL Comprehension of Printed Materials subscale from 2013 as the pretest measure.
Table C25. Effect of the Summer Reading Program on SOL English/Reading Gain Scores
for the Pamunkey Regional Library
Outcome:
SOL
Participants (N = 111) Comparisons (N = 172) Regression Results –
Gain Scores
Unadj.
Pretest
Mean
(SD)
Unadj.
Posttest
Mean
(SD)
Gain/
Loss
Unadj.
Pretest
Mean
(SD)
Unadj.
Posttest
Mean
(SD)
Gain/
Loss
Coeff
(SE) z p ES
Overall English/ Reading Score
474.61
(60.62)
473.49
(63.26)
-1.13
(45.75)
484.74
(62.03)
469.11
(55.37)
-15.63
(46.62)
15.06
(5.60) 2.69 0.01 0.32
Word Analysis Score
36.78
(6.47)
39.86
(9.37)
+3.08
(8.20)
37.99
(6.36)
39.22
(9.17)
+1.22
(9.25)
2.01
(1.07) 1.88 0.06 0.22
Note. SOL = Standards of Learning

Appendix C-15
Roanoke County Public Library
Area Served: Roanoke County
Grades 3-12 (Standards of Learning)22
Within the Roanoke County Public Library, there was a statistically significant positive effect
for the Standards of Learning Word Analysis outcome (z = 2.54, p = 0.01, ES = 0.28) (Table C26).
There was also a statistically significant effect on the Word Analysis gain scores (z = 2.59, p = 0.01,
ES = 0.30) (Table C27).
Table C26. Effect of the Summer Reading Program on SOL English/Reading Outcomes for
the Roanoke County Public Library
Outcome: SOL Participants
(N = 225)
Comparisons
(N = 81)
Unadjusted Posttest
Mean (SD)
Coeff
(SE) z p ES
Overall English/ Reading Score
486.70
(66.03)
475.14
(69.16)
10.26
(5.74) 1.79 0.07 0.15
Comprehension of
Fiction Score a
38.60
(7.14)
38.14
(7.76)
-0.28
(0.82) -0.34 0.74 -0.04
Comprehension of
Nonfiction Score a
38.03
(6.94)
36.47
(6.50)
0.88
(0.70) 1.25 0.21 0.13
Word Analysis Score 40.29
(8.87)
38.00
(8.87)
2.48
(0.98) 2.54 0.01 0.28
Note. SOL = Standards of Learning a This outcome used the SOL Comprehension of Printed Materials subscale from 2013 as the pretest measure.
Table C27. Effect of the Summer Reading Program on SOL English/Reading Gain Scores
for the Roanoke County Public Library
Outcome:
SOL
Participants (N = 225) Comparisons (N = 81) Regression Results –
Gain Scores
Unadj.
Pretest Mean
(SD)
Unadj.
Posttest
Mean
(SD)
Gain/
Loss
Unadj.
Pretest Mean
(SD)
Unadj.
Posttest
Mean
(SD)
Gain/
Loss
Coeff
(SE) z p ES
Overall English/
Reading Score
480.02
(59.35)
486.70
(66.03)
+6.68
(46.59)
479.96
(67.10)
475.14
(69.16)
-4.83
(46.44)
10.32
(5.97) 1.73 0.08 0.22
Word Analysis
Score
37.28
(6.26)
40.29
(8.87)
+3.02
(8.15)
37.65
(6.89)
38.00
(8.87)
+0.35
(6.93)
2.63
(1.01) 2.59 0.01 0.30
Note. SOL = Standards of Learning
22 Due to extremely small sample sizes (N <10) for the summer reading program participants in grades K-2, data analyses for
the Phonological Awareness Literacy Screening were unable to be conducted.

Appendix C-16
Virginia Beach Public Library
Area Served: City of Virginia Beach
Grades K-2 (Phonological Awareness Literacy Screening)
Within the Virginia Beach Public Library, there were no significant effects of the summer
reading program on the posttests (z = -0.06, p = 0.88, ES = -0.04) or gain scores (z = -0.32,
p = 0.75, ES = -0.08) as measured by the Phonological Awareness Literacy Screening (Tables C28
and C29).
Table C28. Effect of the Summer Reading Program on PALS Outcomes for the Virginia
Beach Public Library
Outcome: PALS
Participants
(N = 66)
Unadjusted Posttest
Mean (SD)
Comparisons
(N = 16)
Unadjusted Posttest
Mean (SD)
Coeff
(SE) z p ES
Entry Level Sum Score 57.59
(10.80)
57.94
(10.13)
-0.41
(2.70) -0.15 0.88 -0.04
Note. PALS = Phonological Awareness Literacy Screening
Table C29. Effect of the Summer Reading Program on PALS Gain Scores for the Virginia
Beach Public Library
Outcome:
PALS
Participants (N = 66) Comparisons (N = 16) Regression Results –
Gain Scores
Unadj.
Pretest
Mean
(SD)
Unadj.
Posttest
Mean
(SD)
Gain/
Loss
Unadj.
Pretest
Mean
(SD)
Unadj.
Posttest
Mean
(SD)
Gain/
Loss
Coeff
(SE) z p ES
Entry Level
Sum Score
74.76
(16.50)
57.59
(10.80)
-17.17
(15.70)
75.25
(22.46)
57.94
(10.13)
-17.31
(18.57)
-1.45
(4.50) -0.32 0.75 -0.08
Note. PALS = Phonological Awareness Literacy Screening
Grades 3-12 (Standards of Learning)
There were also statistically significant positive effects of the summer reading program on
students’ Standards of Learning Overall English/Reading scores (z = 4.73, p < 0.001, ES = 0.20);
Comprehension of Fiction subscale scores (z = 3.84, p < 0.001, ES = 0.20); Comprehension of
Nonfiction subscale scores (z = 3.75, p < 0.001, ES= 0.19); and Word Analysis subscale scores
(z = 2.39, p = 0.02, ES = 0.13) (Table C30). As shown in Table C31, there were similar positive
effects of the program on students’ gain scores for the Overall English/Reading score (z = 4.11,
p < 0.001, ES = 0.23). Specifically, participants demonstrated a gain in the Overall English/Reading
outcome (3.56) and comparisons showed a loss (-8.06).

Appendix C-17
Table C30. Effect of the Summer Reading Program on SOL English/Reading Outcomes for
the Virginia Beach Public Library
Outcome: SOL Participants
(N = 737)
Comparisons
(N = 469a)
Unadjusted Posttest
Mean (SD)
Coeff
(SE) z p ES
Overall English/ Reading Score
473.19
(61.80)
462.23
(57.30)
11.87
(2.51) 4.73 0.00 0.20
Comprehension of Fiction Score b
37.50
(7.00)
36.40
(6.90)
1.37
(0.36) 3.84 0.00 0.20
Comprehension of Nonfiction Score b
37.02
(6.64)
36.09
(5.98)
1.19
(0.32) 3.75 0.00 0.19
Word Analysis Score 37.89
(9.08)
36.72
(8.71)
1.12
(0.47) 2.39 0.02 0.13
Note. SOL = Standards of Learning a N = 468 for the Word Analysis sample
b This outcome used the SOL Comprehension of Printed Materials subscale from 2013 as the pretest measure.
Table C31. Effect of the Summer Reading Program on SOL English/Reading Gain Scores
for the Virginia Beach Public Library
Outcome:
SOL
Participants (N = 737) Comparisons (N = 469a) Regression Results –
Gain Scores
Unadj. Pretest
Mean
(SD)
Unadj.
Posttest Mean
(SD)
Gain/
Loss
Unadj. Pretest
Mean
(SD)
Unadj.
Posttest Mean
(SD)
Gain/
Loss
Coeff
(SE) z p ES
Overall English/
Reading Score
469.62
(62.33)
473.19
(61.80)
+3.56
(46.10)
470.30
(64.78)
462.23
(57.30)
-8.06
(50.96)
11.68
(2.84) 4.11 0.00 0.23
Word Analysis
Score
36.87
(6.67)
37.89
(9.08)
+1.02
(8.60)
36.64
(6.81)
36.72
(8.71)
+0.08
(8.31)
0.98
(0.50) 1.95 0.05 0.12
Note. SOL = Standards of Learning a N = 468 for Word Analysis sample

Appendix C-18
Summary of Findings
Table C32 summarizes the key findings across all 10 library systems. Findings are organized
into four categories:
1. Participants demonstrated better Phonological Awareness Literacy Screening outcomes
than comparisons
2. Participants demonstrated greater gains or smaller losses in the Phonological Awareness
Literacy Screening outcomes than did comparisons
3. Participants demonstrated better Standards of Learning outcomes than comparisons
4. Participants demonstrated greater gains or smaller losses in Standards of Learning
outcomes than did comparisons
For all categories, an “X” represents findings that are statistically significant.
Table C32. Snapshot of the Key Findings across All 10 Library Systems
Library System Name Participants
Demonstrated
Better PALS Outcomes than
Comparisons
Participants
Demonstrated Greater Gains or
Smaller Losses in PALS Outcomes
than Comparisons
Participants Demonstrated
Better SOL Outcomes than
Comparisons
Participants Demonstrated
Greater Gains or Smaller Losses in
SOL Outcomes than
Comparisons
Bedford Public Library System
N/A N/A X X
Central Rappahannock Regional Library
X X X X
Chesapeake Public Library
X X
Chesterfield County Public Library
X X
Hampton Public Library N/A N/A X
Handley Regional Library System
N/A N/A X
Jefferson-Madison Regional Library
N/A N/A X
Pamunkey Regional Library
X X
Roanoke County Public Library
N/A N/A X X
Virginia Beach Public Library
X X