impact of water commercial losses
TRANSCRIPT

-The Water and Waste Services Regulation Authority -
PORTUGAL

9th IWA World Water Congress & Exhibition
Lisbon, 24 September 2014
• A. Filipe Ruivo Maria J. Moinante
Economic and Financial Analysis Department at ERSAR Engineering Department at ERSAR

INDEX
1
METHODOLOGY
INTRODUCTION
2
RESULTS AND DISCUSSION 3
CONCLUSIONS AND RECOMENDATIONS 4
1. INTRODUCTION
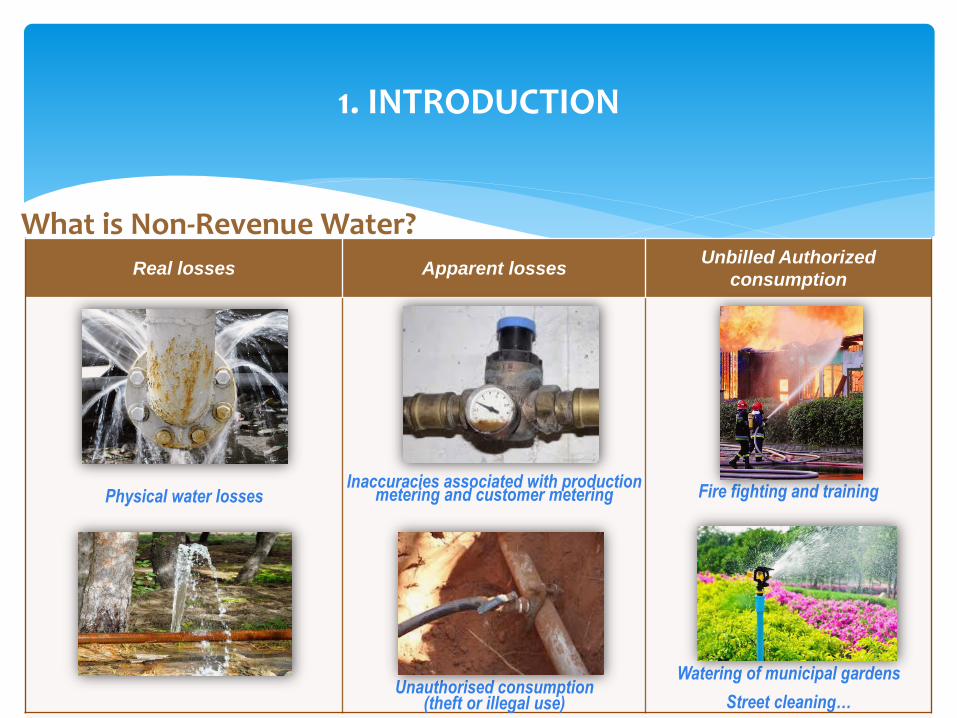
Real losses Apparent losses Unbilled Authorized
consumption
Physical water losses
Inaccuracies associated with production metering and customer metering
Unauthorised consumption (theft or illegal use)
Fire fighting and training
Watering of municipal gardens
Street cleaning…
What is Non-Revenue Water?

Wat
erin
take
Wat
erin
take
Tre
atm
ent
oper
atio
nal
cons
umpt
ion
and
loss
esT
reat
men
tT
reat
men
t
M
M
M
M M M
M
M M M
M
Tra
nsm
issi
onT
rans
mis
sion
Tra
nsm
issi
on
cons
umpt
ion
and
loss
es
Stor
age
Stor
age
Stor
age
tank
s op
erat
iona
l
cons
umpt
ion
and
loss
es
District
metering
MIm
port
ed tr
eate
d
wat
er (
**)
M
Exp
orte
d tr
eate
d
wat
er (
**)
M
Wat
er a
bstr
acte
d
M
Wat
er p
rodu
ced
M
Dis
trib
utio
nin
put
Point of measurement for water balance
purposesM
M
Impo
rted
raw
wat
er(*
)
M
Tra
nsm
issi
onin
put
M
Wat
er s
uppl
ied
M
Tre
atm
ent
inpu
t
(*) - can be located anywhere between the water intake and the treatment
(**) - can be located anywhere downstream treatment
Raw
wat
er m
ains
Raw
wat
er m
ains
Raw
wat
er c
onsu
mpt
ion
and
loss
es
Dis
trib
utio
n
cons
umpt
ion
and
loss
esD
istr
ibut
ion
Dis
trib
utio
n
M
Exp
orte
d ra
w w
ater
(*)
1. INTRODUCTION
DISTRIBUTION AND
COMMERCIALIZATION
ABSTRACTION
AND TREATMENT
Components of the water balance
RETAIL OPERATORS
Where can appear Non-Revenue Water ?
Since Until
Municipalities
Local-owned companies
Public partnerships between the State and municipalities
Private concessionaires of municipal systems
State-owned
company
Multimunicipal concessionaire (Participation of State
and municipalities in
the share capital of the
concessions)
STATE OWNED
SYSTEMS MUNICIPAL OR
INTERMUNICIPAL
OWNED SYSTEMS:
Different ways of fixing prices,
accounting, and calculation the costs
of the service. !
BULK OPERATORS
≅ ≅
1. INTRODUCTION
0%
10%
20%
30%
40%
50%
60%
70%
80%
90%
100%
Bulk Operators (15) Retail operators (248)
5%
Limit of technical efficiency (good service)
20%
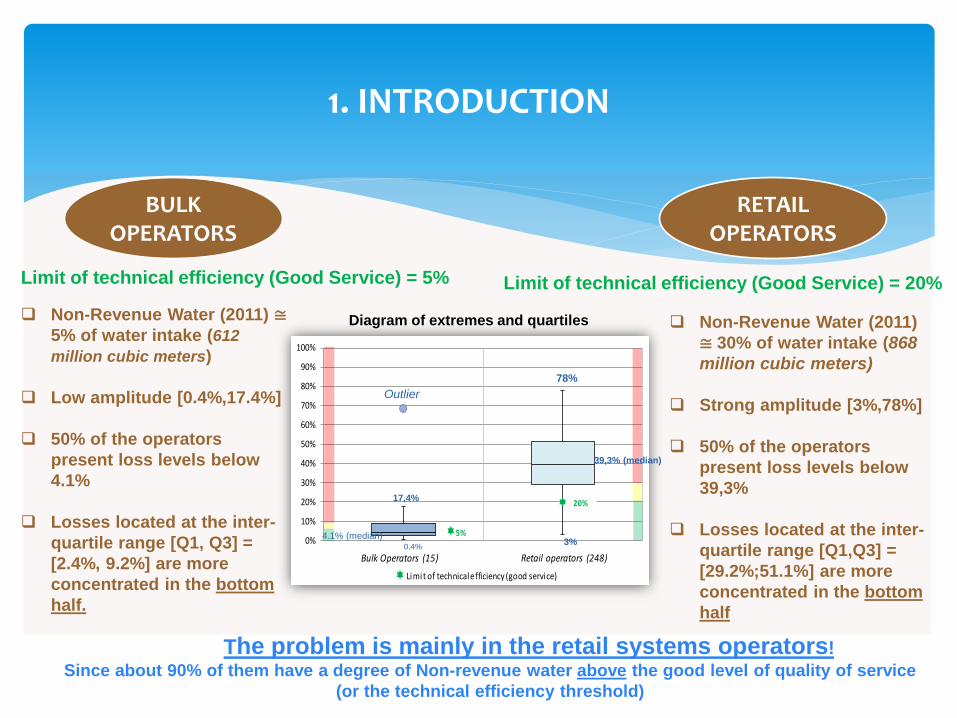
Diagram of extremes and quartiles
BULK OPERATORS
RETAIL OPERATORS
Outlier
17,4%
78%
3% 0,4%
39,3% (median)
4.1% (median)
Non-Revenue Water (2011) ≅
5% of water intake (612
million cubic meters)
Low amplitude [0.4%,17.4%]
50% of the operators
present loss levels below
4.1%
Losses located at the inter-
quartile range [Q1, Q3] =
[2.4%, 9.2%] are more
concentrated in the bottom
half.
Non-Revenue Water (2011)
≅ 30% of water intake (868
million cubic meters)
Strong amplitude [3%,78%]
50% of the operators
present loss levels below
39,3%
Losses located at the inter-
quartile range [Q1,Q3] =
[29.2%;51.1%] are more
concentrated in the bottom
half
Limit of technical efficiency (Good Service) = 20% Limit of technical efficiency (Good Service) = 5%
The problem is mainly in the retail systems operators!
Since about 90% of them have a degree of Non-revenue water above the good level of quality of service
(or the technical efficiency threshold)

1. INTRODUCTION
0%
20%
40%
60%
80%
100%
1 2 3 4 5 6 7 8 9 10 11 12 13 14 15
Real losses average (72,6%)
(%)
0%
20%
40%
60%
80%
100%
1 7 13 19 25 31 37 43
49 55 61
67 73 79 85 91
97
103
109
115
121
127
133
139
145
151
157
163
169
175
181
Real losses average (71,8%)
(%)
BULK OPERATORS
RETAIL OPERATORS
Total Non-Revenue Water (2011) ≅ 300 million cubic meters ( About 10% of Useful capacity of the lake Alqueva 3.150 million m3 - The largest artificial lake in Western Europe )
Different dimensions in both types of operators but the main problem are the REAL LOSSES:
Real losses 72,6%
Aparent losses 5,1%
Unbilled authorized consumption 22,3%
Average (15 operators):
Real losses 71,8%
Aparent losses 13,5%
Unbilled authorized consumption 14,7%
Average (186 operators):
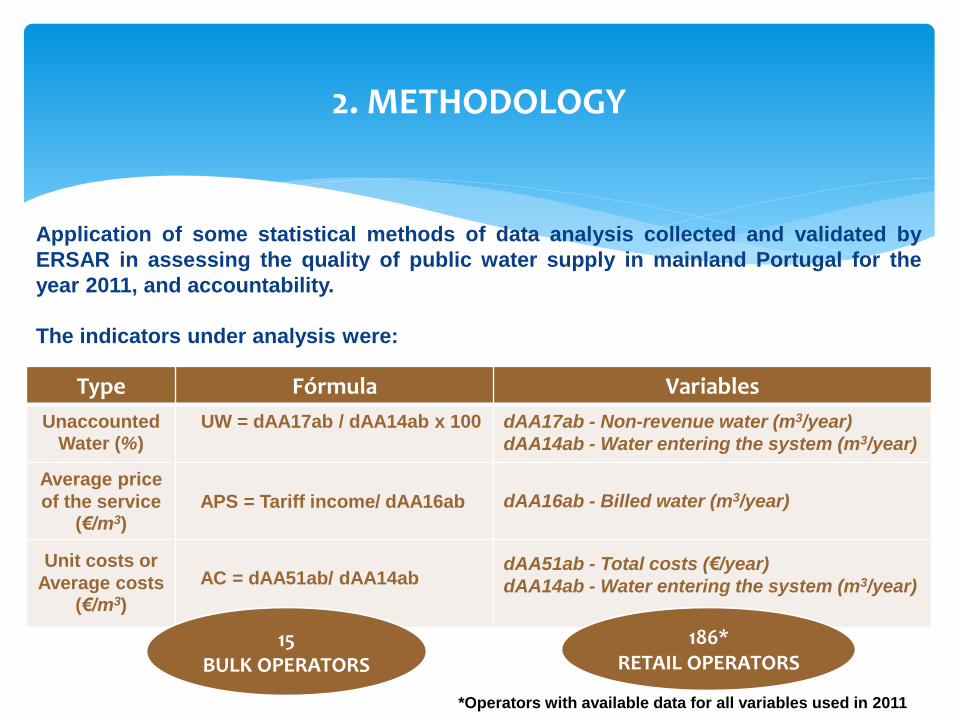
Application of some statistical methods of data analysis collected and validated by
ERSAR in assessing the quality of public water supply in mainland Portugal for the
year 2011, and accountability.
The indicators under analysis were:
2. METHODOLOGY
Type Fórmula Variables
Unaccounted Water (%)
UW = dAA17ab / dAA14ab x 100
dAA17ab - Non-revenue water (m3/year)
dAA14ab - Water entering the system (m3/year)
Average price
of the service (€/m3)
APS = Tariff income/ dAA16ab
dAA16ab - Billed water (m3/year)
Unit costs or
Average costs (€/m3)
AC = dAA51ab/ dAA14ab
dAA51ab - Total costs (€/year)
dAA14ab - Water entering the system (m3/year)
15 BULK OPERATORS
186* RETAIL OPERATORS
*Operators with available data for all variables used in 2011

3. RESULTS AND DISCUSSION
y = -0,2877x + 0,5032 R² = 0,1152
0,0
0,2
0,4
0,6
0,8
1,0
0% 10% 20% 30% 40% 50% 60% 70% 80% 90% 100%
Tariffs and non-revenue water
Y =
Tar
iffs
(E
uro
/ m3 )
X = Non-revenue water (%)
BULK OPERATORS
y = -0,5524x + 0,5951 R² = 0,1385
0,0
0,2
0,4
0,6
0,8
1,0
0% 10% 20% 30% 40% 50% 60% 70% 80% 90% 100%
Total unit costs and non-revenue water
Y =
To
tal u
nit
co
st (
Eu
ro/ m
3 )
X = Non-revenue water (%)
The total unit costs and tariffs have a
strong positive correlation (ρ=0.81)
BUT
The variability of these variables is less
explained by non-revenue water
(Coefficient of Determination R2 ≈0.1). Only
10% of the variability values are explained by
NRW!
THESE ARE THE EXPECTED RESULTS !!
AND WHY…?

3. RESULTS AND DISCUSSION
BULK OPERATORS
Low level of Non-Revenue water (5% of Water intake)
The tariff review cycle (annual or multiannual) involves a
critical analysis of all costs (Legal framework and
intervention of ERSAR in recent years) – consequently,
the amount of the tariff reflects the cost in some
cases.
Therefore, there are several operators that charge tariffs
below the total unit costs (the highest) and do not reflect
the actual cost in the Tariffs - not recovering the costs -
consequently, the amount of the tariff don´t reflects the
total cost in another cases.
REASONS:

3. RESULTS AND DISCUSSION
y = -0,9994x + 1,3214 R² = 0,1194
0,0
0,5
1,0
1,5
2,0
2,5
3,0
0% 20% 40% 60% 80% 100%
Total unit costs and non-revenue water
X = Non-revenue water (%)
Y =
To
tal u
nit
co
sts
(Eu
ro/
Good service
y = -1,2649x + 1,8033 R² = 0,1337
0,0
0,5
1,0
1,5
2,0
2,5
3,0
0% 20% 40% 60% 80% 100%
Price of service and non-revenue water
Y =
Pri
ce o
f se
rvic
e (
Eu
ro/
X = Non-revenue water (%)
Good service
RETAIL OPERATORS
The total unit costs and the average price of the
service have a moderate positive correlation
(ρ=0.62)
BUT
The variability of these variables is also less
explained by non-revenue water (Coefficient of
Determination R2≈0.1), despite their higher levels.
Only 10% of the variability values are explained by
NRW!
THESE ARE ALSO THE EXPECTED RESULTS !!
AND WHY…?

3. RESULTS AND DISCUSSION
RETAIL OPERATORS
Physical Losses not detected don`t originate repair costs.
Higher levels of NRW (30% of Water in take), are little
reflected in costs and prices of service.
Most operators do not have cost accounting systems in
place to ascertain accurately the real cost of the service
(Municipalities) .
The price charged for services is set administratively,
for political reasons, with little relation to costs -The power
of municipalities pricing due to local autonomy regime.
REASONS:

4. CONCLUSIONS AND RECOMENDATIONS
3. EMPIRICAL EVIDENCE: NRW has a very significant expression in retail systems, but the
variability of unit costs and price of services is less explained by this variable. In most
operators of retail systems, the price is set administratively and the total costs are not counted.
2. We all know that NRW has impact on the efficiency of operators: UNBILLED COSTS; INCREASING REPAIR COSTS and, consequently, the PRICE OF THE SERVICE.
1.
In PORTUGAL, non-revenue water (NRW) has DIFFERENT DIMENSIONS; in both types of
operators the main problem are the REAL LOSSES, and the problem is mainly in the RETAIL
OPERATORS.
4.
So, given the results we saw, what should be OUR GOAL?
- To implement a BETTER PRINCING METHODOLOY that can effectively reflect the real
costs of the services and set standards for EFFICIENCY, which should be considered
commercial losses.
- In TARIFF REGULATION UNDER CONSTRUCTION!

We only able to know the true
impact of water commercial losses
with better ways of accounting, for
determining their total costs
separately, and the PART
RECOVERD in the PRICE OF THE
SERVICE, in ALL OPERATORS !!!
THE TRUE IMPACT…?

Thank you for your attention!
Contacts:
Telefone: +351 210 052 200
Fax: +351 210 052 259
E-mail: [email protected]
Site: www.ersar.pt