impact of weather on u.s. apparel retail and …
TRANSCRIPT

IMPACT OF WEATHER ON U.S. APPAREL RETAIL AND
WHOLESALE SALES
A Thesis
Presented to the Faculty at
The University of Missouri
In Partial Fulfillment
Of the Requirements for the Degree
Master’s of Science
By
Md. Tahmidul Islam Molla
Dr. Jung E. Ha-Brookshire, Thesis Advisor
May, 2016

APPROVAL PAGE
The undersigned, appointed by the dean of the graduate school,
have examined the Thesis entitled:
IMPACT OF WEATHER ON U.S. APPAREL RETAIL AND WHOLESALE SALES
Presented by Md. Tahmidul Islam Molla
A candidate for the degree of Textile and Apparel Master’s of Science Degree, and
hereby certify that, in their opinion, it is worthy of acceptance.
Dr. Jung E. Ha-Brookshire
Dr. Pamela Norum
Dr. Hua Qin

ii
ACKNOWLEDGEMENTS
This thesis would not have been possible without the guidance and the help of
several individuals who contributed and extended their valuable assistance in the
preparation and completion of this study. I owe my gratitude to all those people who have
made this thesis possible and because of whom my graduate experience has been one that
I will cherish forever.
My deepest gratitude to my advisor Dr. Jung E. Ha-Brookshire. Dr. Ha-
Brookshire taught me how to question thoughts, express ideas, and do research. Her vast
industry experience, knowledge, patience and kindness have been invaluable to me
throughout the many questions, confusions, and obstacles of this research. I cannot
express my enough gratitude for her endless hours of assisting me in organizing my
thoughts, guiding my writing, steering me in the right direction when my steps faltered,
and offering valuable advice and suggestions without which I would not able to complete
this research. I could not have imagined having a better advisor and mentor for my
Master’s study.
I would like to thank Dr. Pamela Norum for her insightful comments and
constructive criticisms at different stages of my research were thought provoking and
they helped me focus my ideas. Her knowledge and insightful suggestions throughout
this thesis truly has been instrumental in my success.
I am grateful to Dr. Hua Qin for his time and support in my thesis, especially his
guidance in writing my research methodology. I have learned many things from his class

iii
which directly influenced my research. I am also thankful to him for reading my
submissions, commenting on my views and helping me understand and enrich my ideas.
I am very grateful for all I have received from my supervisors, mentors, staffs,
and fellow graduate students throughout the past two years. Finally, I must express my
profound gratitude to my parents and siblings for providing me with unfailing support
and continuous encouragement throughout this endeavor. This accomplishment would
not have been possible without them.
iv
TABLE OF CONTENTS
ACKNOWLEDGEMENTS…………………………………………………………… ii
LIST OF TABLES…………………………………………………………………….. v
LIST OF APPENDIXES…………………………………………………………….... vi
CHAPTER I: INTRODUCTION………………………………………………............1
Background of the study………………………………………………………..1
Purpose of the study………………………………………………………….... 2
Significance of the study………………………………………………………. 2
Key definitions present in the study…………………………………………… 3
Organization of the study……………………………………………………… 5
CHAPTER II: LITERATURE REVIEW……………………………….... 6
U.S. apparel retail and wholesale sectors…………………………………….... 6
Definitions and current status of U.S. retail trade…………………………....... 6
Definitions and current status of U.S. wholesale trade…………………………8
Market overview of U.S. apparel retail and wholesale industry……………… 11
Impact of weather on retail and wholesale sales……………………………… 16
Weather and retail sales……………………………………………………...... 16
Weather and wholesale sales………………………………………………….. 19
Research Gaps and Objectives………………………………………………… 21
CHAPTER III: RESEARCH METHODOLOGY…………………………………….. 23
Research design……………………………………………………………….. 23
Sources of study data………………………………………………………….. 23
Sampling information…………………………………………………………. 24
Data collection………………………………………………………………… 27
Data analysis…………………………………………………………………... 30
CHAPTER IV: RESULTS……………………………………………………………. 42
Results and analysis for impact of weather on U.S. apparel retail sales……… 42
Results and analysis for impact of weather on U.S. apparel wholesale sales… 51
Results of analysis for impact of weather on the
interaction between U.S. apparel retail and wholesale sales.…………………. 58
CHAPTER V: CONCLUSIONS……………………………………………………... 68
Summary of the study……………………………………………………….... 68
Discussion and implications of the major findings…………………………… 71
Contribution of findings………………………………………………………. 73
Study limitations and future research suggestions……………………………. 75
REFERENCES……………………………………………………………………….. 79
VITA…………………………………………………………………………………. 111
v
LIST OF TABLES
Table
Table 4.1: Monthly average temperature sensitivity of apparel retail sales............ 42
Table 4.2: Monthly maximum temperature sensitivity of apparel retail sales…… 45
Table 4.3: Monthly minimum temperature sensitivity of apparel retail sales......... 47
Table 4.4: Monthly precipitation sensitivity of apparel retail sales……………… 49
Table 4.5: Monthly average temperature sensitivity of apparel wholesale sales…. 51
Table 4.6: Monthly maximum temperature sensitivity of apparel wholesale sales.. 53
Table 4.7: Monthly minimum temperature sensitivity of apparel wholesale sales.. 54
Table 4.8: Monthly precipitation sensitivity of apparel wholesale sales………..... 56
Table 4.9: Monthly average temperature sensitivity on the interaction between
apparel retail and wholesale sales………………………………………………… 59
Table 4.10: Monthly maximum temperature sensitivity on the interaction between
apparel retail and wholesale sales……………………………………………….. 61
Table 4.11: Monthly minimum temperature sensitivity on the interaction between
apparel retail and wholesale sales……………………………………………….. 63
Table 4.12: Monthly precipitation sensitivity on the interaction between apparel retail
and wholesale
sales…………………………………………………………………………. 65
vi
LIST OF APPENDIXES
Appendix
A: Regression analysis of monthly apparel retail sales on weather............... 87
B: Regression analysis of monthly apparel wholesale sales on weather.….. 94
C: Regression analysis of monthly weather on interaction of monthly apparel
retail and wholesale sales………………………………………………….. 101

1
CHAPTER I: INTRODUCTION
Chapter I contains the following sections (a) background of the study, (b) purpose of the
study, (c) significance of the study, (d) key definitions present in the study, and (e)
organization of the study.
Background of the Study
The U.S. apparel retail and wholesale sales are influenced by several factors. The
sales could be influenced by transportation disruptions, labor strikes, natural disasters,
currency depreciation, and weather. Even though several studies have been done to see
how these factors influence retail and wholesale sectors, very little research has tried to
explore the impact of weather on retail and wholesale sectors, especially on sales. In fact,
no study has been done in the United States to see how weather impacts apparel retail and
wholesale sales. As climate change is aggravating climate variability, U.S. apparel retail
and wholesale sectors are increasingly exposed to unseasonal weather (Bertrand, Brusset
& Fortin, 2015). The unusual weather can change consumers’ buying behavior or might
cause disruptions in the supply chain, which eventually causes firms to end up with poor
sales and profit. Retailers and wholesalers are closely related in the apparel industry.
Wholesalers are the ones who are responsible for selling and distributing the goods to the
retailers. Therefore poor retail sales might also influence the wholesalers’ overall sales. If
the retailers expect lower demand for a particular product due to weather anomalies, they
will ask for fewer products from wholesalers which will eventually cause poor
wholesales. On the other hand, wholesalers are sometime responsible for all the activities
from production to delivery of the goods. In such cases, weather might negatively impact
the production or the distribution process and cause delay in delivery of the merchandise

2
to the retailers. This might also cause a decrease in wholesalers’ future sales. Thus, it
seems that weather has some impact on both apparel retail and wholesale sales. Further
study needs to be done to find out how and at what amount weather impacts apparel retail
and wholesale sales in the United States.
Purpose of the Study
There is a huge gap in our comprehension on the effect of the weather on U.S.
apparel retail and wholesale sales. This study tried to explain the relationship between
weather and apparel retail and wholesale sales in the United States. The main purpose of
this study was to formalize and test the mathematical relationship between U.S. apparel
retail and wholesale sales and weather in a way which will help managers gain a better
understanding of their business performance. This study was organized to develop a new
model and test it to verify the relationship between weather and sales. For this purpose,
this study was designed to quantify the impact of weather on the U.S. apparel retail and
wholesale monthly sales. Furthermore, the study tested the relationship between apparel
retail and wholesale sales and examine how weather influences that relationship.
Significance of the Study
Weather disruptions might impact the time to deliver the goods and thus the
timing of the retail sells. Now the question is why timing of selling is so important in the
apparel industry? Apparel goods are seasonal goods, which means that the selling period
of apparel is likely to be very small. Thus, careful timing of the sales of the apparel goods
is very important for retailers. For example, if the products reach the store too early, the
products will not be sold. On the other hand, if the products arrive too late, there might be

3
a shortage in demand which will force companies to reduce the price so that customers
can be motivated (Bahng and Kincade, 2012). Thus, failure to ensure that the precise
amount of goods are available at the right time will negatively impact the overall apparel
sales and revenue. To maximize sales and revenue, retailers have to scientifically
forecast the exact demand of specific product. Even though retailers take different
strategies to effectively predict customer demands, these are rarely studied in literature.
Since wholesalers are directly related to the retailers, any kind of variations on the retail
sales will directly influence wholesale sales. Thus, wholesalers must have their own
forecasting strategy to mitigate the impact of decreases in sales due to weather variation.
It would be more convenient for the wholesalers as well as the retailers to find out exactly
what amount of their sales are influenced by weather deviation and how. This study aims
to answer these questions. Therefore, the study findings will help managers to mitigate
the negative impact of the weather on business activities. Moreover, this study will help
U.S. apparel retailers and wholesalers in their strategic and financial decisions making.
Key Definitions Present in the Study
Apparel retail sector: The retail trade sector involves establishments engaged in selling
merchandise generally without transformation and provides services related to the sale of
merchandising. They directly sell merchandise to the end customers. The apparel retail
sector consists of establishments which are primarily involved in retailing new apparels.
(U.S. Census Bureau, 2015b)
Apparel Wholesale sector: The Wholesale Trade sector consists of establishments
engaged in wholesaling merchandise generally without transformation and provides
services related to the sale of merchandise. Wholesalers’ work as an intermediate
4
between manufacturers and retailers. Apparel wholesale sectors primarily engaged in
distribution of piece goods, notions, clothing, accessories, and footwear. (U.S. Census
Bureau, 2015a)
Apparel Supply chain: Supply chain is a set of three or more companies directly linked
by one or more of the upstream and downstream flows of products, services, finances,
and information from a source to a customer (Mentzer, 2004). In apparel industry,
ultimate source would be the fiber producers and the ultimate customer would be the end
customers or users of the apparel.
Consumer Price Index (CPI): Change in the prices paid by urban customers for the
consumer service and products.
NAICS: The North American Industry Classification System (NAICS) is used to define
and classify business activities in every industry sector and business type.
NCEI: National Centers for Environmental Information (NCEI) under National Centers
for Environmental Information (NOAA) is a U.S. based organization which hosts and
provides comprehensive oceanic, atmospheric, and geographical data. (National Centers
for Environmental Information, 2015a)
U.S. Census Bureau: United States Census Bureau, a part of U.S. Department of
Commerce provides comprehensive quality data about the nation’s people and economy.
(U.S. Census Bureau, 2015c)
5
Organization of the Study
This thesis is divided into five chapters. Chapter 1 presents the background, purpose,
significance of the study, as well as key terms of the study. Chapter 2 provides the
literature review introducing the definitions and current status of U.S. apparel retail and
wholesale sectors which is followed by market overview of U.S. apparel retail and
wholesale sectors. Furthermore, the existing literature on the impact of weather on U.S.
apparel retail and wholesale sectors are described. Later, research gaps and objectives are
introduced and explained. Chapter 3 presents the research methodology, including the
research design, sources of study data, sampling information, data collection, and data
analysis techniques. Chapter 4 provides results and analysis for impact of weather on
U.S. apparel retail sales, U.S. apparel wholesale sales, and the interaction between U.S.
apparel retail and wholesale sales. Chapter 5 explains the summary of the study,
discussion, implications, and contribution of the major findings. Finally, it presents study
limitations and future research suggestions.
6
CHAPTER II: LITERATURE REVIEW
Chapter II contains the following sections: (a) U.S. apparel retail and wholesale sectors,
(b) impact of weather on retail and wholesale sales, and (c) research gaps and objectives.
U.S. Apparel Retail and Wholesale Sectors
Definitions and Current Status of U.S. Retail Trade
In North America, the North American Industry Classification System (NAICS) is
used to define and classify business activities in every industry sector and business type.
NAICS uses a 2 to 6 digit hierarchical classification system to describe different industry
sectors and business types (North American Industry Classification System Association,
2015). Retail sector belongs to NAICS codes 44 and 45 while wholesale sector belongs to
NAICS code 42.
NAICS defines retailer (NAICS code 44 and 45) as a business entity who is
“engaged in retailing merchandises, generally without transformation and rendering
services incidental to the sale of merchandise. The retailing process is the final step in the
distribution of merchandise; retailers are, therefore, organized to sell merchandise in
small quantities” (U.S. Census Bureau, 2015b). Unlike industrial companies, retailers do
not tend to produce tangible goods. Instead, they buy products from manufacturers and/or
wholesalers and sell them to individual customers at a profit.
The retail sector includes motor vehicles and part dealers (441); furnishing and
home furnishing stores (442); electronics and appliances stores (443); building material
and garden equipment, and supplies dealers (444); food and beverage stores (445); health
and personal care stores (446); Gasoline Stations (447); clothing and clothing accessories
7
stores (448); Sporting goods, hobby, musical instruments, and book stores (451); general
merchandise stores (452); miscellaneous store retailers (453); and nonstore retailers
(452). The retail sector has very strong influence on the manufacturing and wholesaling
sectors as it deals with the final customers and sometime it can manipulate industries
future trends. The U.S. retail sales were approximately US $4.5 trillion in 2013 (U.S.
Census Bureau, 2015d). Some of the popular examples of retailer brands are
Amazon.com, Dell, McDonald’s, and Best Buy.
Within the retail sector, the clothing and clothing accessories sector represents
under NAICS code 448. According to NAICS, clothing and clothing accessories
marketers are defined as “retailers who sell new clothing and clothing accessories
merchandise from fixed point-of-sale locations. Establishments in this subsector have
similar display equipment and staff that is knowledgeable regarding fashion trends and
the proper match of styles, colors, and combinations of clothing and accessories to the
characteristics, and tastes of the customer” (U.S. Census Bureau, 2015e). The clothing
and clothing accessories subcategory is directly related with the fashion industry. It deals
with different fashion merchandise stores including clothing stores (4481), shoes stores
(4482), and jewelry, luggage, and leather goods (4483). In 2013, total retail sales in
clothing and clothing accessories subcategory was around US $244.5 billion (U.S.
Census Bureau, 2015f). Any kind of fashion retail stores will be under this category for
instances Nordstorm, Gucci, Louis Vuitton, and Chanel.
The next level, clothing stores listed under NAICS code 4481. This industry
group “primarily engaged in retailing new clothing” (U.S. Census Bureau, 2015g). The
retail stores which are primarily sales new clothing merchandises are described under

8
clothing stores subcategory. The clothing stores includes men’s clothing stores (44811);
women clothing stores (44812); children and infants’ clothing stores (44813); family
clothing stores (44814); clothing accessories stores (44815); and other clothing stores
(44819). In 2013, total clothing stores sales was US $178.5 billion (U.S. Census Bureau,
2015f). Some of the popular retailers under this category are Gap.Inc, JC Penney’s,
American Eagle, and Ralph Lauren.
General Merchandise stores belong to NAICS code 452. Industries in the General
Merchandise Stores are defined as “subsector retail new general merchandise from fixed
point-of-sale locations. Establishments in this subsector are unique in that they have the
equipment and staff capable of retailing a large variety of goods from a single location.
This includes a variety of display equipment and staff trained to provide information on
many lines of products.” (U.S. Census Bureau, 2015h). General merchandise stores refers
to a wide array of products commonly sold in retail stores. These includes any non-food
and non-grocery products such as dry goods, auto parts, toys, apparel and accessories,
electronics, furniture and home furnishings, small wares, hardware, and food. The general
merchandise stores have two subcategories-department stores (4521) and other general
merchandise stores (4529). In 2013, approximately US $653 billion worth of
merchandise sold in general store (U.S. Census Bureau, 2015f). Some of the popular
general merchandise stores includes Walmart, Target, K-mart, and Macy’s.
Definitions and Current Status of U.S. Wholesale Trade
Wholesale is listed under NAICS code 42. According to NAICS “the wholesale
trade sector comprises establishments engaged in wholesaling merchandise, generally
without transformation and rendering services incidental to the sale of merchandise. The
9
wholesaling process is an intermediate step in the distribution of merchandise.
Wholesalers are organized to sell or arrange the purchase or sale of (a) goods for resale
(i.e., goods sold to other wholesalers or retailers), (b) capital or durable nonconsumer
goods, and (c) raw and intermediate materials and supplies used in production (U.S.
Census Bureau, 2015a).”
The wholesale sector comprises two main types of wholesalers: (a) merchant
wholesaler type and (b) business-to-business wholesaler type. Merchant wholesaler type
“sell(s) goods on their own account are known as wholesale merchants, distributors,
jobbers, drop shippers, and import/export merchants, and manufacturer’s sales offices,
and sales branches (U.S. Census Bureau, 2015a).” Business-to-business wholesale type
“arrange(s) for the purchase or sale of goods owned by others or purchasing goods,
generally on a commission basis are known as business-to-business electronic markets,
agents, and brokers, commission merchants, import/export agents, and brokers, auction
companies, and manufacturers' representatives (U.S. Census Bureau, 2015a).” By
definition, the wholesaler sector buys large quantities of goods from manufacturers, or
owners of the goods and resells to other distributers, or retailers rather than to ultimate
customers. Wholesalers work as a middleman between retailers and manufacturers.
There are three major subcategories under wholesale trade- (a) merchant
wholesalers, durable goods (423); (b) merchant wholesalers, nondurable goods (424); and
(c) wholesale electronic markets and agents and brokers (425). Total wholesale sales
were around US $7.4 trillion in 2013 (U.S. Census Bureau, 2015i). Some of the examples
of wholesaler includes Novatech Wholesale, Continental Belt Corp., Perfume Market,
and MVP Trading Co., Inc. (Wholesalecentral.com, 2015).
10
Under the wholesale sector, the merchant wholesalers, nondurable goods listed in
NAICS code 424. They “sell nondurable goods to other businesses. Nondurable goods
are items generally with a normal life expectancy of less than three years. Nondurable
goods merchant wholesale trade establishments are engaged in wholesaling products,
such as paper and paper products, chemicals and chemical products, drugs, textiles and
textile products, apparel, footwear, groceries, farm products, petroleum and petroleum
products, alcoholic beverages, books, magazines, newspapers, flowers and nursery stock,
and tobacco products”. (U.S. Census Bureau, 2015j).
In NAICS, there are 9 sublevels under Merchant Wholesalers including
Nondurable goods including paper and paper product merchant wholesalers (4241); drug
and druggist’s sundries merchant wholesalers (4242); apparel, piece goods, and notion
merchant wholesalers (4243); grocery, and related product merchant wholesalers (4244);
Farm product raw material merchant wholesalers (4245); chemical, and allied products
merchant wholesalers (4246); petroleum, and petroleum products merchant wholesalers
(4247); beer, wine, and distilled alcoholic beverage merchant wholesalers (4248); and
miscellaneous nondurable goods merchant wholesalers (4249). The estimated sales for
Merchant wholesalers, nondurable goods in 2013 were US $4.2 trillion (U.S. Census
Bureau, 2015i). True North Trading, Cottonage.com, Maggie handbag, and Western
express, Inc. are some of the examples of nondurable goods merchant wholesalers
(Wholesalecentral.com, 2015).
Apparel, piece goods, and notions merchant wholesalers lies to NAICS code 4243
under Merchant wholesaler, nondurable goods subcategory. They are “primarily engaged
in the merchant wholesale distribution of piece goods, notions, and other dry goods;
11
men's and boys' clothing and furnishings; women's, children's, and infants' clothing and
accessories; and footwear” (U.S. Census Bureau, 2012k). In NAICS, categories include
under the Apparel, piece goods, and notions merchant wholesalers are Piece goods,
notions, and other dry goods merchant wholesalers (42431); Men’s and boy’s clothing
and furnishings merchant wholesalers (42432); Women’s, children’s, and infant’s
clothing and accessories merchant wholesalers (42433); and Footwear merchant
wholesalers (42444). In 2013, Apparel, piece goods, and notions merchant wholesale
sales were around US $158.9 billion (U.S. Census Bureau, 2015i). Seven Seas, Inc.,
InterTradeCorp.com, Nikibiki Apparel, and Spring Import are some examples of apparel,
piece goods, and notions merchant wholesalers (Wholesalecentral.com, 2015).
Market Overview of U.S. Apparel Retail and Wholesale Industry
Today, the US apparel market is the largest in the world, comprising
approximately 29% of the global apparel sales and accounted for approximately 331
billion US dollar (Statista.com, 2015). This amount is enough to describe its importance
in the U.S. economy. There has been a significant shift in the U.S. apparel industry in
recent decades and the industry has transformed from manufacturing-based to import-
based one. Unlike old market conditions, the U.S. apparel industry is now more involved
in importing, marketing and retailing activities, rather than manufacturing activities.
Reflecting this trend, apparel import volume has multiplied in the past decades (Ellis,
2007: Kunz & Garner, 2006). Moreover, over 90% of total apparel products available in
U.S. market are manufactured in and imported from other countries (Ha-Brookshire &
Dyer, 2008). It is expected that this trend will continue to increase as long as U.S. apparel
businesses benefit from foreign goods and services to meet domestic demand (Kunz &
12
Garner, 2006). This shift in the industry has greatly influenced the overall organizational,
structural, and economic conditions of U.S. apparel retail and wholesale sectors.
Recent study shows that, the retail sector is the largest employer and supports one
out of four jobs in the United States. The retail sector offers 42 million jobs, provides 1.6
trillion US dollar in labor income and contributes 2.6 trillion US dollar annually to U.S.
Gross Domestic Product (GDP) (National Retail Foundation, 2014). These figures simply
explain the tremendous impact of the retail sector in the U.S. economy.
The Retail sector has been gone through significant changes during the past few
decades in the United States (Abernathy et al, 1999). The apparel retail sector is one of
the most emerging sectors which have gone through such dramatic changes called the
“retailing revolution” (Crewe & Davenport, 1992). First, the number of large shopping
malls have increased rapidly specially at the outskirts of the cities. These shopping malls
have replaced city center department stores and boutiques (Nordas, 2004). Second, with
the radical improvement of communication systems and technologies, the retail sector is
now one of the greatest and the most profitable industries in the United States (National
Retail Foundation, 2014; Nordas, 2004). In the United States, retail sector has been
consolidated-causing larger buying power of retailers than that of suppliers (Nordas,
2004). Specifically, in the apparel retail sector, today’s retailers are now directly involved
in global manufacturing and therefore, becoming the competitors of manufacturers
(Gereffi, 2001). Today, significant portion of apparel retailers in the United States source
directly from manufacturers all over the world. In the U.S. apparel industry, the retailer
sector have become more powerful than the wholesale and manufacturing sectors and
thus have direct influence on current trends of the industry.

13
There are different types of retail channels in the United States through which
apparel products are sold. Sen (2008) explained that apparel goods are sold through five
types of retail channels. First, specialty stores, such as Gap, Inc. and The Limited, sell
accessories and apparel products in a limited range for a specific customer market.
Second, department stores, such as Nordstorm and Macy’s, have a broad category of
brands in both soft and hard goods industries. Third, a significant number of apparel sales
take place in mass merchandiser stores, for instance Target and Wal-Mart. These
merchandise stores sells different types of soft goods and hard goods along with apparel.
Fourth, apparel chain stores, for instance Sears and J.C. Penney’s, sells a broad category
of clothing merchandises. Fifth, some of the off-price stores, for instance T.J. Maxx and
Marshalls, buy additional amount of branded apparel and designer-label from producers
as well as other retailers and sell them at a reasonably lower prices in an incomplete
assortment condition. E-tailers, mail order companies, and factory outlets are some of the
examples of companies that are involved in U.S. apparel retailing.
Sen (2008) further explained that the current trends of the retail industry includes
retail consolidation, emergence of private labels, and vertical integration. First, due to
consolidation, only few strong retail firms are in a position to influence contract in favor
of them. Second, private label has been important as a major means to increase revenue
for a variety of retailers including general stores, department stores, specialty retailers,
and upscale retailers sell apparel under their own private labels. Third, more apparel
manufacturers have become retailers, suggesting vertical integration. A significant
number of manufacturers are now selling goods directly to the end customers where some

14
of them sell only excess or second-quality merchandise to the customers while they are
continuing to sell their top quality products to the off-price retailers.
Most wholesalers in the apparel industry involve with sales and administrative
activities such as marketing and branding their products to retailers, developing
relationship between retailers and manufacturers, maintaining inventory, and transporting
merchandise to the retailers. Some wholesalers are discount wholesalers who sell
merchandise on a discount prices to the customers whereas other wholesalers are apparel
wholesalers who only sell items to the retailers or other wholesalers.
Similar to the retail sector, the wholesale sector has gone through a lot of changes.
With the shift of labor-intensive jobs in the manufacturing sector to the overseas, the
wholesaling sector also expanded their business partners from domestic manufacturers to
foreign suppliers (Ha-Brookshire & Lu, 2010). Ha-Brookshire and Dyer (2008), proposed
apparel import intermediaries as a new term to explain this kind of wholesalers. They
defined apparel intermediaries as domestic service firms that connect domestic
wholesalers or retailers and foreign distributers or manufacturers. Apparel import
intermediaries perform more complex and dynamic business activities than traditional
wholesalers (Kincade & Gibson, 2010). Traditional wholesalers typically buy product in
bulk for resale to other wholesalers or retailers without design or product development
attempt. Ha-Brookshire and Dyer (2008) explained that apparel import intermediaries
generally perform four distinct sets of activities-design, marketing, sourcing, and service.
Apart from import retailers, more and more apparel import intermediaries are now
involved in import processes. Despite the active presence of large import retailers, such

15
as Wal-Mart and Target, a significant number of less-powerful and low-profile apparel
import intermediaries are the workhorses of the import process, aggregately contributing
to a major portion of U.S. imports (Gereffi, 1994; Jin, 2004). Nike, Gap.Inc., and Reebok
are some of the firms who design and import merchandise from foreign countries and sell
them in the United States. In addition to these intermediary firms, there are still some
firms in the U.S. apparel industry who perform traditional wholesale activities, for
instance Albama Wholesale Socks, Silver Stars Collection and Biki Fashion
(Wholesalecentral.com, 2015).
The changing market conditions also made negative impact on the U.S. apparel
wholesale industry. According to Newstex Trade & Industry Blogs, Newstex (2014),
notable changes in the U.S. apparel wholesale sector are, first, a negative impact of the
2008 economic recession on the U.S. apparel wholesale sector. According to the blog,
during and after the recession, retailers have offered deep discounts to customers, which
have caused wholesalers to be left with excess inventories and lower prices to move
avoid frozen stock. Second, the blog also reported that rising import penetration has
displaced the downstream demand for apparel from domestic wholesalers to international
manufacturers. Third, more and more downstream buyers are now reported to source
directly from manufacturers to cut expenses and sustain margins. As a result, the blog
shared that this trend has constrained wholesalers function in the domestic supply chain,
and eliminated many from the business. Wholesalers have forced to cut prices to remain
relevant in the global apparel supply chain.
16
Impact of Weather on Retail and Wholesale Sales
Weather and Retail Sales
With aforementioned market characteristics, the impact of weather on retail and
wholesale sales has recently been on the researchers’ radar. The impact of weather on
commercial and business activities has been largely ignored, despite its important role
(Bertrand & Sinclair-Desgagne, 2012). In recent years, weather and its potential impact
on economy have become a focus due to climate changes which increase uncertainties in
the weather sensitive business sectors (Intergovernmental Panel on Climate Change
(IPCC), 2014; World Meteorological Organization (WMO), 2013). In fact some argue
that, almost 70 % of companies in industrialized countries are affected by everyday
weather changes (Bertrand, Brusset, & Fortin, 2015; Dutton, 2002; Larsen, 2006).
The impact of weather on business activities and human behavior has been
studied in various fields for instance finance and psychology (Cao & Wei, 1998; Goeree
& Holt, 1999). However, it is well established that the weather has a “significant, but
short lived, effect on economic activity” (Bloesch & Gourio, 2015, p.17). For some
industries such as agriculture and energy, the weather plays such a vital role that it is
consider a risk factor and thus, dealt with risk management instruments (Lee & Oren,
2009). Cachon and Gallino (2012) found that, adverse weather conditions lead to a
significant reduction in automobile production. Tourism, forestry, constructions,
hospitality, utilities are another sectors which are directly affected by the weather
(Bloesch & Gourio, 2015; Cachon and Gallino, 2012).
17
Until now, many studies have been done to establish a correlation between actual
weather variables and sales focusing on how the level of sales varies with the changing
level of temperature or precipitation (Bahng & Kincade, 2012; Marteau et al, 2004). One
of the major problems with weather forecast is that the reliable temperature forecasts
become invalid within two weeks (Bertrand, Brusset & Fortin, 2015). On the other hand,
very few companies can utilize the weather forecast to adjust their supply chains within
such a short period and get benefit from such adjustments. However, the weather is still
important for apparel retail and wholesale sales but little is known about it. In the apparel
retail sector for instance, for the most efficient companies, the lead time ranges from 3 to
5 weeks, while companies that source their products from Asia or other long distance
foreign countries, the lead time might range from 3 to 5 months (Crehalet, Bertrand, &
Fortin, 2013). This manufacturing, sourcing, and transportations processes are often
conducted by wholesales or import intermediaries, adding even longer lead time from
manufacturing to retailing. Additionally, the impact of weather on consumers’ shopping
behavior is also little known despite weather conditions could affect consumers’ short-
term shopping intentions and behaviors.
Little research has been done to see the impact of weather on apparel sales,
mostly apparel retail sales (Bahng & Kincade, 2012). A few studies that exist have been
limited to restricted samples, brands, or type of garments, for a limited period of time and
in very restricted geographical areas (Bertrand, Brusset & Fortin, 2015). As sales depends
on fashion trends along with other individual causes (Cachon & Swinney, 2009), thus the
results were not sufficient to generalize to a greater population.
18
For example, Bahng and Kincade (2012) studied the relationship between weather
and retail sales of seasonal apparel. In this study, the researchers collected sales data from
a retailer of branded women’s wear in the Seul-Kyunggi area in South Korea. They
collected sales data for seasonal basic styles and for weather, they used daily and weekly
average temperature data. In their study, the authors used descriptive analysis including
graphical evaluations, correlation analysis and paired-samples t-test. In addition to that
interviews with retailer’s merchandisers were used to supplement interpretation of the
statistical datasets.
Bahng and Kincade (2012) found that temperature has a strong impact on the
sales of seasonal apparel products. They also found that when there is a drastic change in
weather occurred especially during the sales periods, more seasonal garments were sold
that time. Their findings also suggest that temperature changes from day to day or week
to week did not really affect the total sells for the whole season. The study showed the
impact of daily and weekly temperature on seasonal apparel sales, but it did not evaluate
the potential impact on the long-term effects of the weather, such as monthly, seasonal or
even annual. This pilot study was limited to the analysis of one apparel brand and one
apparel product category with 50 basic and carryover styles targeting women aged 30 to
40, from February 1, 2007 to February 29, 2008. This study was also restricted to two
cities in South Korea. Thus the authors suggested that the results cannot be generalized
due to the limitations in product category and location.
On a slightly different note, Bertrand, Brusset and Fortin (2015) studied the
impact of unexpected deviations of daily temperature from seasonal patterns on apparel
retail sales in France. In their study, the researchers applied Seasonal Trend
19
decomposition using Loess to isolate changes in sales volumes. They used a linear
regression to find the relationship between temperature and sales anomalies and construct
the historical distribution to determine sales-at-risk due to unseasonal weather. In their
research they showed how we can use weather derivatives to offset the potential loss due
to weather deviations. They found that seasons do not have the same level of sales impact
to temperature anomalies. They also claimed that the responses of men, women, and kids
apparel sales to the same weather risk were different and different distribution channels
exhibited different outcomes to the same risk. The study used monthly textile and apparel
retail sales data of several retail apparel categories and distributions channels. This study
was also restricted to a single country, France. Though this study provided a strong
correlation between temperature and retail sales, it did not cover all possible apparel
categories and distributions channels. Thus generalization of the findings were not
advised by the authors. The study also did not explain the impact of weather on other
players in supply chain such as wholesalers and manufacturers.
Weather and Wholesale Sales
As previously discussed, overall understanding of the impact of the weather on
wholesale sales in the U.S. apparel market is not clear enough. Moreover, very few
research articles discussed about the importance of the U.S. apparel wholesale sector
compared to the retail sector. The wholesale sector has strong influence on the U.S.
Apparel supply chain. Unlike the traditional wholesalers who are primarily engaged in
selling products to the other members of the supply chain, today’s wholesalers actively
participate in product transformation activities, including design, production, branding,
marketing, or even, selling products to ultimate customers (Ha-Brookshire & Dyer,
20
2008). Ha-Brookshire and Dyer (2008) explained that the U.S. apparel industry also
heavily relies on wholesalers for various important intermediary activities, such as
contracting made-to-order manufacturing, making arrangements with distributors, jointly
developing products, or contracting for ready-made garments. Therefore the success of
the apparel retailers largely depends on wholesalers. With the change in old market
conditions and introduction of new market condition, such as global manufacturing,
intense competition, fragmented manufacturing processes, and fickle, and strong
consumer demand, the role of wholesalers are becoming more and more important day by
day (Ha-Brookshire & Dyer, 2008). The most recent Economic Census indicated that the
U.S. apparel wholesale sector has generated over U.S. $160 billion on sales in 2013 (U.S.
Census Bureau, 2015i). So it is very clear that the impact of the U.S. apparel wholesale
sector on U.S. apparel industry is significant.
Wholesalers are responsible for delivering the goods to the retailers. They
design, produce or source, import, and transport the goods to the retailers. This whole
process takes long time to execute and thus, make it more vulnerable for different types
of supply chain disruptions. As wholesalers mainly perform the work on behalf of
retailers, so failure to deliver the goods on time due to various disruptions may have
negative impact on their sales. So any kind of disruptions in supply chain might impact
wholesale sales. Weather is one of the natural disasters to which wholesales are exposed,
yet we know little about whether or not weather conditions impact their sales.

21
Research Gaps and Objectives
The review of the literature suggests that apparel retail and wholesale sales may
be affected by weather conditions. There is virtually no research exists that explains the
relationship between weather conditions and retail and wholesale sales. Even if there are,
earlier research failed to draw a conclusion regarding the impact of weather on U.S.
apparel retail sales. Previous studies considered deviation of temperature as the single
most weather variable to find out a relationship between weather and sales. However,
there are several other weather variables such as precipitation, maximum temperature,
and minimum temperature which should be included in the weather-sensitive analysis
since all of them could impact on market transactions.
Thus, this study aims to fill this gap in literature by incorporating other weather
variables in addition to temperature deviation. Even though, earlier research has been
done on mostly severe impact of weather on retail sales, however, in reality, weather does
not need to be severe to impact on economic activities according to Berlage (2013).
Therefore, this study aims to capture the impact of average weather changes on both
retail and wholesale sales. Since there is not sufficient prior research on this relationship,
this study was designed in an exploratory manner.
For this exploratory purpose, the following specific research question was proposed.
Research Question 1: What are the impacts of weather conditions in general on U.S.
apparel retail sales?
The wholesale sector is also expected to be vulnerable to weather for the reasons
explained above. However, there is no research available to explain or show this
22
relationship. Therefore, the study was designed in an exploratory in nature. Specifically,
following research question would be investigated in this study.
Research Question 2: What are the impacts of weather conditions in general on U.S.
apparel wholesale sales?
As retailers and wholesalers are dependent on each other for their business
functions, there might be some kind of relationship between retail and wholesale sector in
terms of sales. Since the study looks for impact of weather on individual retail and
wholesale sales, one additional question was deigned:
Research Question 3: What are the impacts of weather on the relationship between U.S.
apparel retail and wholesale sales?

23
CHAPTER III: RESERCH METHODOLOGY
Chapter III contains the following sections: (a) research design, (b) sources of study data,
(c) sampling information, (c) data collection, and (d) data analysis.
Research Design
The aim of the study is to assess and quantify the impact of weather as well as
several weather derivatives such as maximum temperature, minimum temperature,
average temperature, and precipitation on U.S. apparel retail and wholesale sales. To
achieve this goal, multiple regression analysis with secondary data was used. Multiple
regression analysis was done to discover the effect of one variable on another.
Sources of the Study Data
In this study, the national level economics and weather data published by U.S.
Census Bureau and National Centers for Environmental Information (NCEI) were used.
In addition to that this study used secondary data. There are several benefits of using
secondary data in research. First, secondary data are popular because of their breadth. A
wide range of data irrespective of time and place can be accessed through secondary data
which could be impossible otherwise. Second, for secondary sources, the data collection
process is usually guided by time, money, expertise, and professionalism that is often
difficult to obtain for an individual researcher. Third, secondary data is publicly
accessible. With the availability of the internet, a large dataset can be easily accessed by
anyone, which makes the whole data collection method much easier. Fourth, the
secondary data involves larger samples that are more representative of the target
population, which ensures the higher quality of the datasets.
24
Numerous studies are conducted by the federal government on a national scale
which are publicly available. For this particular study, this study used the data from
sources including U.S. Census Bureau and National Centers for Environmental
Information (NCEI). One of the motivations for using data from these sources is that
these two organizations are the central organizations for all types of economic and
weather related data in the United States. Both of these government institutions are
responsible for collecting, sorting, and listing national level economic and weather data.
These data are collected by the federal government and widely used by different
government agencies and private organizations. Another reason is that, U.S. Census
Bureau performs continuous or regular surveys to collect economic data. On the other
hand, NCEI keeps track of high quality environmental data which is funded by the
federal government. Both of these organizations cover a wide range of national level
historical datasets which are very suitable for longitudinal studies, such as this study.
Sampling Information
U.S. apparel monthly retail sales, wholesale sales, and weather data were
collected and analyzed. The U.S. Census Bureau is responsible for collecting,
documenting, and updating all kinds of business data in the United States. The Census
Bureau has a wide range of historical datasets on U.S. apparel sales, both retail and
wholesale sales which are updated regularly. The Census Bureau listed apparel wholesale
sales data in subgroup apparel, piece goods, and notions merchant wholesalers under
wholesale trade category in accordance with NAICS code 4243 (U.S. Census Bureau,
2015j). Retail sales data are listed in the subgroup clothing stores (NAICS code 4481)
under retail trade in the U.S. census Bureau (U.S. Census Bureau, 2015g). All the
25
apparel retailers and wholesalers in the United States was the population of this study,
and the sample unit was month, from 1992 to 2015. In total, 300 months.
The U.S. Census Bureau (2015l) describes its sampling process on its website.
According to the U.S. Census Bureau, monthly wholesale trade sampling uses a stratified,
one-stage design with primary strata defined by industry. The primary strata are later
substratified into 4, 7, 10 or 13 annual sales size data. The largest sales size stratum
within each industry stratum consists of companies, all of which are selected with
certainty. Employer Identification Numbers (EIN) is used to populate other strata.
Sample sizes are computed to meet multiple coefficients of variation constraints on
estimated sales. The sample consists of approximately 1,200 certainty companies and
3000 EINs. Wholesale sales data are collected using survey method by mail, internet, fax,
and telephone. Surveys are sent to companies, parts of companies, and single units that
are situated in the United States, and have paid employees, and are classified as merchant
wholesalers. Questionnaires are mailed each month to the wholesale establishments and
requested data for the end of each month. Monthly sales data are requested along with
end-of-month inventories and number of establishments. After collecting, analyzing, and
classifying the data, they are adjusted for seasonal variation and trading-day differences.
The monthly retail trade survey developed by the U.S. census bureau was the
main source of monthly retail sales for this study. According to U.S. Census Bureau
(2015m), a mail-out/mail-back survey has been done on around 12,000 retail businesses
with paid employees. In addition to that supplemented estimates are made for the new
employers, non-employers, and missed employers. To create the sampling frame, the
census bureau extracts the data for all retail institutions located in the United States.
26
Business Register is the source for the sample of retail firms which enlist each and every
establishment location and Employer Identification Numbers (EINs). A stratified
sampling is done for the firms selected for the survey based on estimated sales and kind
of business. Firms which have sales higher than the minimum cutoffs and are certain, are
included in the survey. Out of 12,000 retail firms, 2,500 firms has been selected where
probability is equal to 1. EINs has been randomly selected for each stratum and classified
based on sales and major kind of business. Estimates of monthly sales are derived from
data collected in the monthly retail trade surveys and approximately six weeks after the
end of the reference month, updates are released. Each month, retail establishments
report to the census bureau the total value of their sales in the previous month. Later, the
sales data are seasonally adjusted and unadjusted, and released in two different forms
(U.S. Census Bureau, 2015n).
Weather data were collected from National Centers for Environmental
Information (NCEI) under National Oceanic and Atmospheric Administration (NOAA)
and it came from the U.S. divisional database which has data from 1895 to the present.
According to NCEI (National Centers for Environmental Information, 2015a), the NCEI
is responsible for holding and providing access to one of the most noteworthy archives on
earth which contains comprehensive atmospheric, oceanic, and geophysical data. The
NCEI uses near real-time observation of hourly, daily, monthly, and yearly temperature
and precipitation data across the country. NCEI uses most sophisticated satellite
technology to gather the information. Later, observations were adjusted and artificial
effects developed into the climate record by factors such as urbanization, station
relocation, instrument changes, and observer practice changes.
27
Data Collection
U.S. apparel monthly retail and wholesale sales were used as dependent variables
in this study. For this study, monthly U.S. apparel retail and wholesale sales data from
1992 to 2015 were collected through the U.S. Census Bureau website. Therefore, the
study introduced 24 years (1992 to 2015) of retail and wholesale sales observations to
find out the impact of weather on sales. Here, the datasets were longitudinal which means
that the same data had been collected from the same population over several different
time periods. These longitudinal datasets would help us to look at trends and changes of
the sales and weather over time. One of the reasons of using the last 24 years data was its
convenience. Since U.S. Census Bureau has digitalized and updated business data on
monthly basis starting from 1992, it was more convenient to use retail and wholesale
sales data from 1992 to simultaneously compare all data in both sectors. Another reason
was that, at the beginning of the 1990’s, the U.S. apparel industry underwent a major
shift from manufacturing based industry to more retail and wholesale sectors based
industry. Thus, it was more rational to see how weather impacted retail and wholesale
sales starting from the early 1990’s to now. Consequently, the sample unit was month:
from 1992 to 2015, for a total of 288 months.
All the weather and sales data were national level data. One of the benefits of
using national level data was that more monthly economic data are available on the
national level compared to the state level (Bloesch & Gourio, 2015). As the main purpose
of the study is to assess the impact of weather on the U.S. apparel retail and wholesale
sales, thus it was more reasonable to use national level data compared to state level or
regional data.

28
Financial sales data, or real sales data, were used to capture the change in sales
between years. The study used seasonally unadjusted datasets. In other words, the effects
of regular or seasonal patterns have not been removed from the data series. Since we are
looking for original impact of weather on sales, seasonally unadjusted datasets were more
appropriate for this study. This will help us to get the actual trends of the sales. In this
study, seasonally unadjusted data were directly retrieved from U.S. Census Bureau.
The seasonally unadjusted sales data were later normalized to eliminate the
impact of Consumer Price Index (CPI). The Bureau of Labor Statistics (Bureau of Labor
Statistics, 2015b) defines Consumer Price Index (CPI) as the change in the prices paid by
urban customers for the consumer services and products. The monthly Consumer Price
Index (CPI) was derived from Bureau of Labor Statistics, and each month of every year
data were discounted based on CPI values prior to any further analysis. The seasonally
unadjusted sales data were divided by CPI to normalize the impact of CPI on sales. In
addition, monthly data were used in this study because most previous studies used
quarterly or annual data, therefore capturing weather impacts that would otherwise
overlook using longer time intervals.
The weather data were collected from National Centers for Environmental
Information (NCEI) which is a part of National Oceanic and Atmospheric Administration
(NOAA). NCEI develops datasets which help describe the climate of the United States as
well as the trends and anomalies of weather and climate. These datasets have monthly
national measures of many weather variables, including average temperature, minimum
temperature, maximum temperature, and precipitation which were considered for this

29
particular study. No adjustment were made on the datasets, since these were real time
data and the study would like to assess the real time weather impact on sales.
In this study, the impact of the changes in temperature or precipitation on apparel
retail and wholesale sales were assessed. Apparel retail and wholesale sales were defined
as sales in millions of dollars. One of the reasons of using sales in monetary value was
that it is one of the most popular and widely used methods of evaluating economic
performance. By comparing the amount of retail sales among months, the researcher can
easily measure the actual change in sales. The temperature variables were defined by
Fahrenheit whereas precipitation was measured by inch. NCEI also defines temperature
and precipitation as Fahrenheit and inch respectively.
The control variables of the study were population and Gross Domestic Product
(GDP). Population is directly related with sales. Since population and consumer traffic
drive sales demand (Bertrand, Brusset & Fortin 2015; Parsons, 2001), the level of
population is expected to influence the impact of weather on sales. The data of population
were collected from the U.S. Census Bureau website. On the other hand, GDP or Gross
domestic product is the standard measure of the value of final goods and services
produced by a country minus the value of total imports in a particular time range
(Organization for Economic Co-operation and Development, 2015). GDP defines the
economic progress of the country (Stockhammer et al, 1997) and the increase in GDP
might positively affect the apparel retail and wholesale sales. GDP data were collected
from the Bureau of Economic Analysis under the U.S. Department of Commerce. Later,
GDP data were discounted by annual CPI. Therefore, real GDP used in this study.

30
In this study, both population and GDP were used as control variables. Therefore,
the results would eliminate the impact of these control variables, and capture only the
impact of weather on apparel retail and wholesale sales.
Data Analysis
Regression analysis method was used in this study. Regression analysis is the
statistic tool for the investigation of the relationships between variables. Regression is
widely used in the field of statistics especially economic statistics. Regression are used to
quantify the relationship between one variable and the other variables. They can also be
used to determine how close and well determined the relationship is. Since the aim of this
study is to find out the relationship between weather and sales, therefore, regression
analysis is a suitable statistical method to determine the relationship. The following
regression equations have been developed by capturing all the above variables, which is
given below.
To find out the impact of average temperature on January retail sales,
RJan.j= β0 + β1GDPj + β2POPJan.j + β3AvJan.j + έJan.j ------------(1)
Where,
RJan.j = U.S. apparel retail sales for January & year j=1992 to 2015 and measured
in millions of dollars.
GDPj = Gross Domestic Product for year j=1992 to 2015 and measured in U.S.
dollar.
POPJan.j= Population for January & year j=1992-2015 and measured in millions.
31
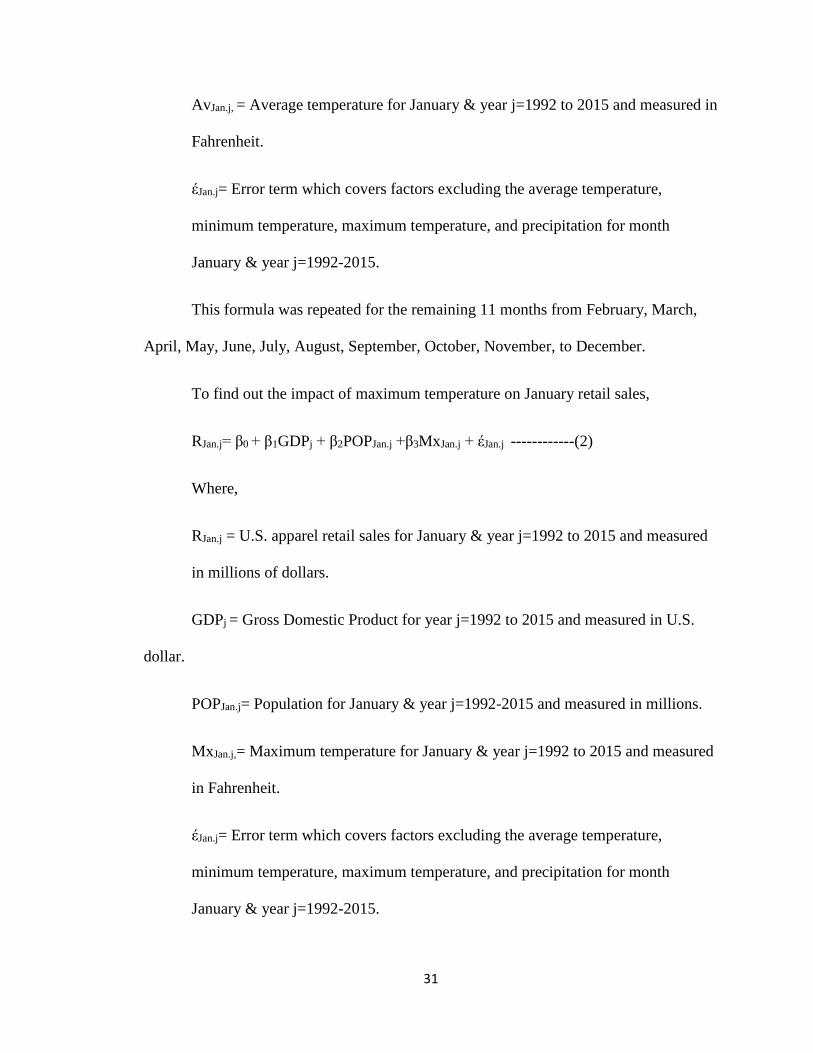
AvJan.j, = Average temperature for January & year j=1992 to 2015 and measured in
Fahrenheit.
έJan.j= Error term which covers factors excluding the average temperature,
minimum temperature, maximum temperature, and precipitation for month
January & year j=1992-2015.
This formula was repeated for the remaining 11 months from February, March,
April, May, June, July, August, September, October, November, to December.
To find out the impact of maximum temperature on January retail sales,
RJan.j= β0 + β1GDPj + β2POPJan.j +β3MxJan.j + έJan.j ------------(2)
Where,
RJan.j = U.S. apparel retail sales for January & year j=1992 to 2015 and measured
in millions of dollars.
GDPj = Gross Domestic Product for year j=1992 to 2015 and measured in U.S.
dollar.
POPJan.j= Population for January & year j=1992-2015 and measured in millions.
MxJan.j,= Maximum temperature for January & year j=1992 to 2015 and measured
in Fahrenheit.
έJan.j= Error term which covers factors excluding the average temperature,
minimum temperature, maximum temperature, and precipitation for month
January & year j=1992-2015.
32
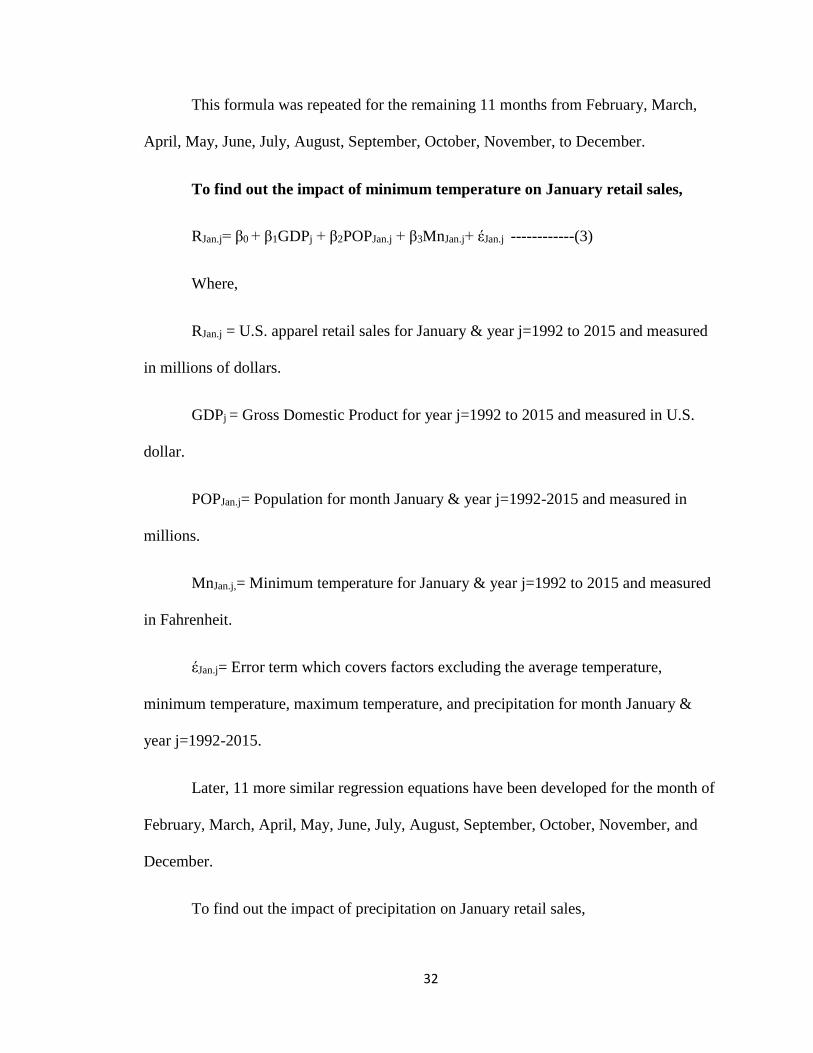
This formula was repeated for the remaining 11 months from February, March,
April, May, June, July, August, September, October, November, to December.
To find out the impact of minimum temperature on January retail sales,
RJan.j= β0 + β1GDPj + β2POPJan.j + β3MnJan.j+ έJan.j ------------(3)
Where,
RJan.j = U.S. apparel retail sales for January & year j=1992 to 2015 and measured
in millions of dollars.
GDPj = Gross Domestic Product for year j=1992 to 2015 and measured in U.S.
dollar.
POPJan.j= Population for month January & year j=1992-2015 and measured in
millions.
MnJan.j,= Minimum temperature for January & year j=1992 to 2015 and measured
in Fahrenheit.
έJan.j= Error term which covers factors excluding the average temperature,
minimum temperature, maximum temperature, and precipitation for month January &
year j=1992-2015.
Later, 11 more similar regression equations have been developed for the month of
February, March, April, May, June, July, August, September, October, November, and
December.
To find out the impact of precipitation on January retail sales,

33
RJan.j= β0 + β1GDPj + β2POPJan.j + β3PrJan.j+ έJan.j ------------(4)
Where,
RJan.j = U.S. apparel retail sales for January & year j=1992 to 2015 and measured
in millions of dollars.
GDPj = Gross Domestic Product for year j=1992 to 2015 and measured in U.S.
dollar.
POPJan.j= Population for January & year j=1992-2015 and measured in millions.
PrJan.j = Average precipitation for January & year j=1992 to 2015 and measured in
inch.
έJan.j= Error term which covers factors excluding the average temperature,
minimum temperature, maximum temperature, and precipitation for month
January & year j=1992-2015.
This formula was repeated for the remaining 11 months from February, March,
April, May, June, July, August, September, October, November, to December.
To find out the impact of average temperature on January wholesale sales,
WJan.j= β0 + β1GDPj + β2POPJan.j + β3AvJan.j + έJan.j ------------(5)
Where,
WJanj = U.S. apparel wholesale sales for January & year j=1992 to 2015 and
measured in millions of dollars.

34
GDPj = Gross Domestic Product for year j=1992 to 2015 and measured in U.S.
dollar.
POPJan.j= Population for January & year j=1992-2015 and measured in millions.
AvJan.j, = Average temperature for January & year j=1992 to 2015 and measured in
Fahrenheit.
έJan.j= Error term which covers factors excluding the average temperature,
minimum t emperature, maximum temperature, and precipitation for month
January & year j=1992-2015.
This formula was repeated for the remaining 11 months from February, March,
April, May, June, July, August, September, October, November, to December.
To find out the impact of maximum temperature on January wholesale sales,
WJan.j= β0 + β1GDPj + β2POPJan.j + β3MxJan.j+ έJan.j------------(6)
Where,
WJanj = U.S. apparel wholesale sales for January & year j=1992 to 2015 and
measured in millions of dollars.
GDPj = Gross Domestic Product for year j=1992 to 2015 and measured in U.S.
dollar.
POPJan.j= Population for January & year j=1992-2015 and measured in millions.
MxJan.j,= Maximum temperature for January & year j=1992 to 2015 and measured
in Fahrenheit.
35
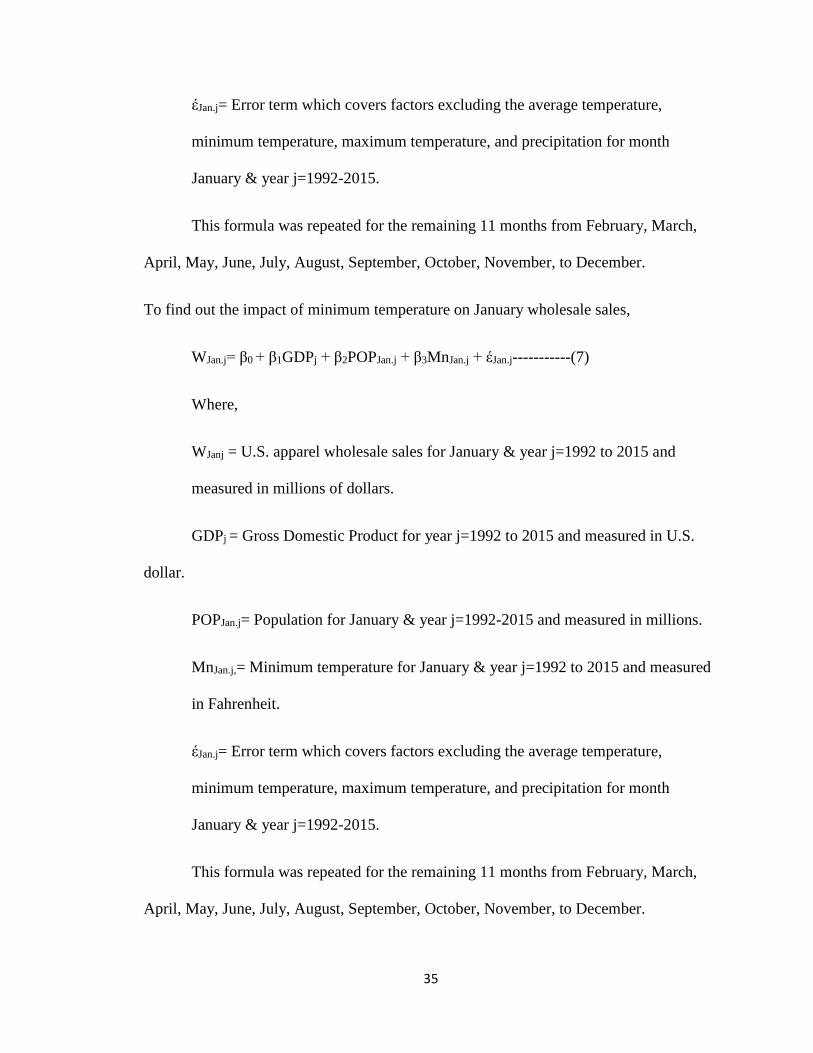
έJan.j= Error term which covers factors excluding the average temperature,
minimum temperature, maximum temperature, and precipitation for month
January & year j=1992-2015.
This formula was repeated for the remaining 11 months from February, March,
April, May, June, July, August, September, October, November, to December.
To find out the impact of minimum temperature on January wholesale sales,
WJan.j= β0 + β1GDPj + β2POPJan.j + β3MnJan.j + έJan.j-----------(7)
Where,
WJanj = U.S. apparel wholesale sales for January & year j=1992 to 2015 and
measured in millions of dollars.
GDPj = Gross Domestic Product for year j=1992 to 2015 and measured in U.S.
dollar.
POPJan.j= Population for January & year j=1992-2015 and measured in millions.
MnJan.j,= Minimum temperature for January & year j=1992 to 2015 and measured
in Fahrenheit.
έJan.j= Error term which covers factors excluding the average temperature,
minimum temperature, maximum temperature, and precipitation for month
January & year j=1992-2015.
This formula was repeated for the remaining 11 months from February, March,
April, May, June, July, August, September, October, November, to December.
36
To find out the impact of precipitation on January wholesale sales,
WJan.j= β0 + β1GDPj + β2POPJan.j + β3PrJan.j+ έJan.j -------------(8)
Where,
WJanj = U.S. apparel wholesale sales for January & year j=1992 to 2015 and
measured in millions of dollars.
GDPj = Gross Domestic Product for year j=1992 to 2015 and measured in U.S.
dollar.
POPJan.j= Population for January & year j=1992-2015 and measured in millions.
PrJan.j = Average precipitation for January & year j=1992 to 2015 and measured in
inch.
έJan.j= Error term which covers factors excluding the average temperature,
minimum temperature, maximum temperature, and precipitation for month
January & year j=1992-2015.
This formula was repeated for the remaining 11 months from February, March,
April, May, June, July, August, September, October, November, to December.
Later, this study also tried to investigate the overall impact of weather on the
relationship between retail and wholesale sales. Therefore, another set of regression
equations was developed to assess the correlation between U.S. apparel retail and
wholesale sales which is given below.
To find out the impact of average temperature on the interaction between January
retail and wholesale sales,

37
RJan.j = β0 + β1GDPj + β2POPJan.j + β3WJan.j+ β4AvJan.j+ β5WJan.jAvJan.j +έJan.j ---- (9)
Where,
RJan.j = U.S. apparel retail sales for January & year j=1992 to 2015 and measured
in millions of dollars.
GDPj = Gross Domestic Product for year j=1992 to 2015 and measured in U.S.
dollar.
POPJan.j= Population for January & year j=1992-2015 and measured in millions.
WJanj = U.S. apparel wholesale sales for January & year j=1992 to 2015 and
measured in millions of dollars.
AvJan.j, = Average temperature for January & year j=1992 to 2015 and measured in
Fahrenheit.
έJan.j= Error term which covers factors excluding the average temperature,
minimum temperature, maximum temperature, and precipitation for month
January & year j=1992-2015.
This formula was repeated for the remaining 11 months from February, March,
April, May, June, July, August, September, October, November, to December.
To find out the impact of maximum temperature on the interaction between January retail
and wholesale sales,
RJan.j = β0 + β1GDPj + β2POPJan.j + β3WJan.j+ β4MxJan.j+ β5WJan.jMxJan.j,+ έJan.j --(10)
Where,

38
RJan.j = U.S. apparel retail sales for January & year j=1992 to 2015 and measured
in millions of dollars.
GDPj = Gross Domestic Product for year j=1992 to 2015 and measured in U.S.
dollar.
POPJan.j= Population for January & year j=1992-2015 and measured in millions.
WJanj = U.S. apparel wholesale sales for January & year j=1992 to 2015 and
measured in millions of dollars.
MxJan.j,= Maximum temperature for January & year j=1992 to 2015 and measured
in Fahrenheit.
έJan.j= Error term which covers factors excluding the average temperature,
minimum temperature, maximum temperature, and precipitation for month
January & year j=1992-2015.
This formula was repeated for the remaining 11 months from February, March,
April, May, June, July, August, September, October, November, to December.
To find out the impact of minimum temperature on the interaction between
January retail and wholesale sales,
RJan.j = β0 + β1GDPj + β2POPJan.j + β3WJan.j+ β4MnJan.j+ β5WJan.jMnJan.j+ έJan.j -- (11)
Where,
RJan.j = U.S. apparel retail sales for January & year j=1992 to 2015 and measured
in millions of dollars.

39
GDPj = Gross Domestic Product for year j=1992 to 2015 and measured in U.S.
dollar.
POPJan.j= Population for January & year j=1992-2015 and measured in millions.
WJanj = U.S. apparel wholesale sales for January & year j=1992 to 2015 and
measured in millions of dollars.
MnJan.j,= Minimum temperature for January & year j=1992 to 2015 and measured
in Fahrenheit.
έJan.j= Error term which covers factors excluding the average temperature,
minimum temperature, maximum temperature, and precipitation for month
January & year j=1992-2015.
This formula was repeated for the remaining 11 months from February, March,
April, May, June, July, August, September, October, November, to December.
To find out the impact of precipitation on the interaction between January retail
and wholesale sales,
RJan.j = β0 + β1GDPj + β2POPJan.j + β3WJan.j+ β4PrJan.j+ β5WJan.jPrJan.j+ έJan.j --- (12)
Where,
RJan.j = U.S. apparel retail sales for January & year j=1992 to 2015 and measured
in millions of dollars.
GDPj = Gross Domestic Product for year j=1992 to 2015 and measured in U.S.
dollar.

40
POPJan.j= Population for January & year j=1992-2015 and measured in millions.
WJanj = U.S. apparel wholesale sales for January & year j=1992 to 2015 and
measured in millions of dollars.
PrJan.j = Average precipitation for January & year j=1992 to 2015 and measured in
inch.
έJan.j= Error term which covers factors excluding the average temperature,
minimum temperature, maximum temperature, and precipitation for month
January & year j=1992-2015.
This formula was repeated for the remaining 11 months from February, March,
April, May, June, July, August, September, October, November, to December.
The basic assumption behind these models is that all the variables are directly
related with the dependent variables, U.S. apparel retail and wholesale sales.
The computer program SPSS were used to perform all statistical analysis. Each
equation was run to assess the impact of weather on a particular month. Since there are
12 months in a year and the datasets were collected from 1992 to 2015, so each equation
were run for 12 times from January to December and the total number of sample for each
equation were 24. To analyze weather impacts on economic activities, multiple
regressions were conducted to assess the contribution of each weather factors on sales.
Several measurements were taken to ensure reliability and validity of the models.
Sample size might impact the generalizability of the results (Hair et al, 2006). Hair et al
(2006) explained that the ratio of observations to independent variables should be five or
41
higher although the desired level is 15 to 20. Given the lack of data, in this study, first
two research questions were assessed based on the monthly data (n=24) for 3 independent
variables. The last research question was assessed on the monthly data for 3 independent
variables.
Moreover, statistical analysis such as standard error, t-test, and corresponding p-
values were calculated to test the validity of the models. The model should accurately
explain the relationship between weather and sales. Further assessment were made to test
if the model is structured well and gives positive results while applying in practice.
42
CHAPTER IV: RESULTS
This chapter includes (a) results of analysis for impact of weather on U.S. apparel
retail sales, (b) results of analysis for impact of weather on U.S. apparel wholesale sales,
(c) results of analysis for impact of weather on the interaction between U.S. apparel retail
and wholesale sales.
Results of Analysis for Impact of Weather on U.S. Apparel Retail Sales
In this study, regression analysis was performed to find out the impact of weather
on retail sales. The study used monthly average temperature, maximum temperature,
minimum temperature, and precipitation as weather variables and run individual
regression analysis to explore their impact on U.S. monthly apparel retail sales.
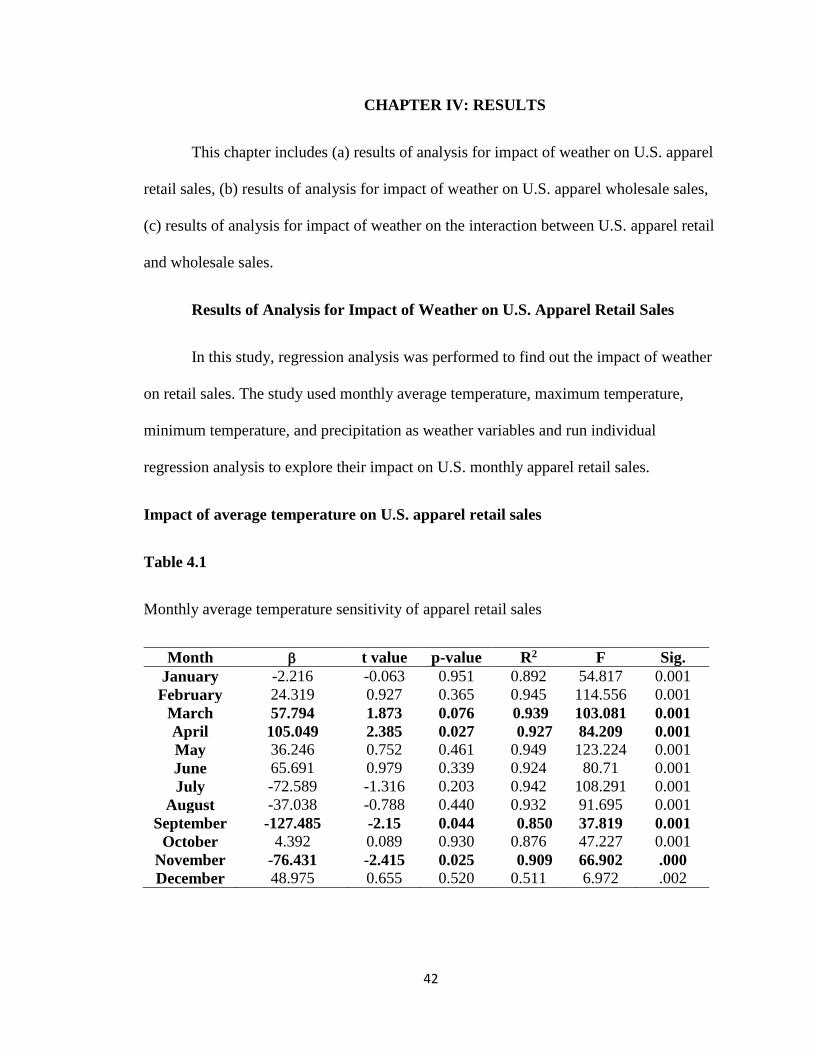
Impact of average temperature on U.S. apparel retail sales
Table 4.1
Monthly average temperature sensitivity of apparel retail sales
Month t value p-value R2 F Sig.
January -2.216 -0.063 0.951 0.892 54.817 0.001
February 24.319 0.927 0.365 0.945 114.556 0.001
March 57.794 1.873 0.076 0.939 103.081 0.001
April 105.049 2.385 0.027 0.927 84.209 0.001
May 36.246 0.752 0.461 0.949 123.224 0.001
June 65.691 0.979 0.339 0.924 80.71 0.001
July -72.589 -1.316 0.203 0.942 108.291 0.001
August -37.038 -0.788 0.440 0.932 91.695 0.001
September -127.485 -2.15 0.044 0.850 37.819 0.001
October 4.392 0.089 0.930 0.876 47.227 0.001
November -76.431 -2.415 0.025 0.909 66.902 .000
December 48.975 0.655 0.520 0.511 6.972 .002

43
The study used multiple regression analysis to regress U.S. apparel retail sales on
average temperature. The study result showed that average temperature had a statistically
significant impact on apparel retail sales in the month of April, September, and
November. Regression coefficients were significant at the 5 percent level. In the month
of April, average temperature along with GDP and population all together accounted for
92.7% variation in retail sales (R2 = .927; F(3, 20) = 84.209; p=0.001). The average
temperature was a significant predictor of the retail sales ( = 105.049; t (20) = 2.39; p=
0.027). Holding GDP and population constant, with one degree Fahrenheit increase of
average temperature in April, the apparel retail sales increased by $105.05 millions of
dollars. As expected in April, when the temperature is warmer than the normal
temperature, there will be more demand in the market for summer clothing. Therefore the
sales will increase.
In the month of September, average temperature along with GDP and population
all together accounted for 85% variation in retail sales (R2 = 0.85; F(3, 20) = 37.819;
p=0.001). The average temperature was a significant predictor of the monthly retail sales,
( = -127.49; t (20) = -2.15, p=0.044). Holding GDP and population constant, with one
degree Fahrenheit increase of average temperature, the apparel retail sales decreased by
$127.49 millions of dollars. That is, in September, if the temperature is higher than the
regular temperature, the apparel sales also drops as September is the month when the
retailers carry fall or early winter items. Warm weather does not help such sales.
Again, in the month of November, average temperature along with GDP and
population all together accounted for 90.9% variation in retail sales (R2 = 0.909; F(3, 20)
= 66.902; p=0.000). The average temperature was a significant predictor of the retail

44
sales, ( = -76.43; t (20) = -2.42, p=0.025). Holding GDP and population constant, with
one degree Fahrenheit increase of average temperature, the apparel retail sales decreased
by $76.43 millions of dollars. Again similar to September, in November, increase of the
average temperature lowers apparel retail sales. However, with the change of one degree
Fahrenheit, the decrease in sales in November ($76.431 millions of dollars) is
comparatively lower to sales in the September ($127.485 millions of dollars).
Moreover, March shows inconclusive but statistically suggestive evidence that
average temperature affects retail sales where regression coefficient was significant at the
10 percent level (Ramsey & Schafer, 2012). In the month of March, the average
temperature along with GDP and population all together accounted for 93.9% variation in
retail sales (R2 = .939; F(3, 20) = 103.08; p=0.001). The average temperature was a
significant predictor of the retail sales ( = 57.79; t (20) = 1.87; p=0.076). Holding GDP
and population constant, with one degree Fahrenheit increase of average temperature in
March, the apparel retail sales increased by $57.79 millions of dollars. Similar to April,
when the temperature is warmer than the normal temperature, there will be more demand
in the market for summer clothing. Therefore the overall sales will increase in March.
However, the study did not find any statistically significant relationship between
average temperature and retail sales for any other months. So we can conclude that
average temperature does not have any impact on apparel retail sales on January,
February, May, June, July, August, October, and December.
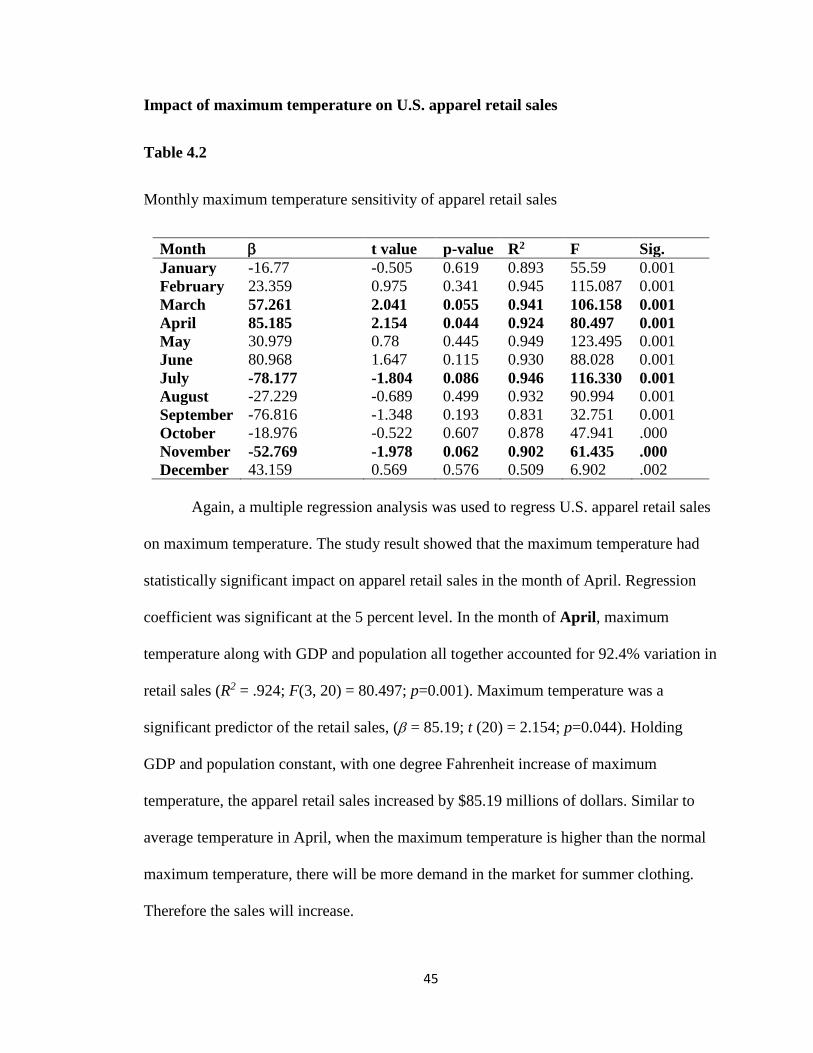
45
Impact of maximum temperature on U.S. apparel retail sales
Table 4.2
Monthly maximum temperature sensitivity of apparel retail sales
Month t value p-value R2 F Sig.
January -16.77 -0.505 0.619 0.893 55.59 0.001
February 23.359 0.975 0.341 0.945 115.087 0.001
March 57.261 2.041 0.055 0.941 106.158 0.001
April 85.185 2.154 0.044 0.924 80.497 0.001
May 30.979 0.78 0.445 0.949 123.495 0.001
June 80.968 1.647 0.115 0.930 88.028 0.001
July -78.177 -1.804 0.086 0.946 116.330 0.001
August -27.229 -0.689 0.499 0.932 90.994 0.001
September -76.816 -1.348 0.193 0.831 32.751 0.001
October -18.976 -0.522 0.607 0.878 47.941 .000
November -52.769 -1.978 0.062 0.902 61.435 .000
December 43.159 0.569 0.576 0.509 6.902 .002
Again, a multiple regression analysis was used to regress U.S. apparel retail sales
on maximum temperature. The study result showed that the maximum temperature had
statistically significant impact on apparel retail sales in the month of April. Regression
coefficient was significant at the 5 percent level. In the month of April, maximum
temperature along with GDP and population all together accounted for 92.4% variation in
retail sales (R2 = .924; F(3, 20) = 80.497; p=0.001). Maximum temperature was a
significant predictor of the retail sales, ( = 85.19; t (20) = 2.154; p=0.044). Holding
GDP and population constant, with one degree Fahrenheit increase of maximum
temperature, the apparel retail sales increased by $85.19 millions of dollars. Similar to
average temperature in April, when the maximum temperature is higher than the normal
maximum temperature, there will be more demand in the market for summer clothing.
Therefore the sales will increase.
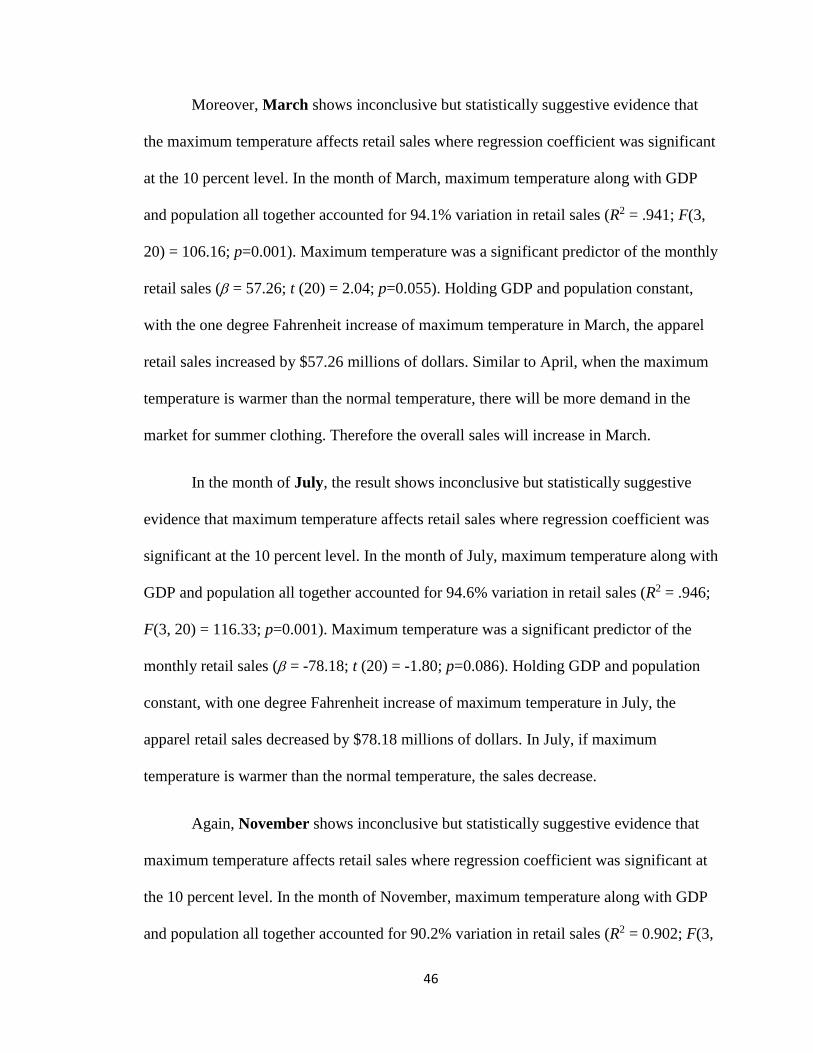
46
Moreover, March shows inconclusive but statistically suggestive evidence that
the maximum temperature affects retail sales where regression coefficient was significant
at the 10 percent level. In the month of March, maximum temperature along with GDP
and population all together accounted for 94.1% variation in retail sales (R2 = .941; F(3,
20) = 106.16; p=0.001). Maximum temperature was a significant predictor of the monthly
retail sales ( = 57.26; t (20) = 2.04; p=0.055). Holding GDP and population constant,
with the one degree Fahrenheit increase of maximum temperature in March, the apparel
retail sales increased by $57.26 millions of dollars. Similar to April, when the maximum
temperature is warmer than the normal temperature, there will be more demand in the
market for summer clothing. Therefore the overall sales will increase in March.
In the month of July, the result shows inconclusive but statistically suggestive
evidence that maximum temperature affects retail sales where regression coefficient was
significant at the 10 percent level. In the month of July, maximum temperature along with
GDP and population all together accounted for 94.6% variation in retail sales (R2 = .946;
F(3, 20) = 116.33; p=0.001). Maximum temperature was a significant predictor of the
monthly retail sales ( = -78.18; t (20) = -1.80; p=0.086). Holding GDP and population
constant, with one degree Fahrenheit increase of maximum temperature in July, the
apparel retail sales decreased by $78.18 millions of dollars. In July, if maximum
temperature is warmer than the normal temperature, the sales decrease.
Again, November shows inconclusive but statistically suggestive evidence that
maximum temperature affects retail sales where regression coefficient was significant at
the 10 percent level. In the month of November, maximum temperature along with GDP
and population all together accounted for 90.2% variation in retail sales (R2 = 0.902; F(3,

47
20) = 61.44; p=0.000). Maximum temperature was a significant predictor of the retail
sales ( = -52.77; t (20) = -1.98; p=0.062). Holding GDP and population constant, with
one degree Fahrenheit increase of maximum temperature in November, the apparel retail
sales decreased by $52.77 millions of dollars. That is, in November, similar to
September, if the temperature is higher than the regular temperature, the apparel sales
also drops as November is the month when the retailers carry early winter items. Warm
weather does not help such sales.
However, the study did not find any statistically significant relationship between
maximum temperature and retail sales for any other months. So we can conclude that
maximum temperature does not have any impact on apparel retail sales on any month of
the year but March, April, July, and November.
Impact of minimum temperature on U.S. apparel retail sales
Table 4.3
Monthly minimum temperature sensitivity of apparel retail sales
Month t value p-value R2 F Sig.
January 13.583 0.4 0.694 0.892 55.296 0.001
February 20.628 0.785 0.441 0.944 113.146 0.001
March 53.098 1.607 0.124 0.937 98.759 0.001
April 121.021 2.523 0.020 0.929 86.616 0.001
May 34.556 0.634 0.533 0.948 122.194 0.001
June -10.469 -0.126 0.901 0.920 76.781 0.001
July -40.337 -0.590 0.562 0.938 100.967 0.001
August -52.732 -0.845 0.408 0.933 92.137 0.001
September -156.400 -2.859 0.010 0.869 44.240 0.001
October 56.928 1.023 0.319 0.882 50.023 .000
November -97.931 -2.751 0.012 0.915 71.855 .000
December 50.159 0.706 0.488 0.513 7.018 .002

48
Again, a multiple regression analysis was used to regress U.S. apparel retail sales
on minimum temperature. The study result showed that minimum temperature had
statistically significant impact on apparel retail sales in the month of April, September,
and November. Regression coefficients were significant at the 5 percent level. In the
month of April, minimum temperature along with GDP and population all together
accounted for 92.9% variation in retail sales (R2 = .929; F(3, 20) = 86.62; p=0.001).
Minimum temperature was a significant predictor of the monthly retail sales, ( = 121.02;
t (20) = 2.52; p=0.020). Holding GDP and population constant, with one degree
Fahrenheit increase of minimum temperature, the apparel retail sales increased by
$121.02 millions of dollars. As expected in April, when the minimum temperature is
higher than the average, there will be more demand in the market for summer clothing.
Therefore the sales will increase.
In the month of September, minimum temperature along with GDP and
population all together accounted for 86.9% variation in retail sales (R2 = 0.869; F(3, 20)
= 44.24; p=0.001). Minimum temperature was a significant predictor of the retail sales, (
= -156.4; t (20) = -2.86; p=0.010). Holding GDP and population constant, with the one
degree Fahrenheit increase of minimum temperature, the apparel retail sales decreased by
$156.4 millions of dollars. This result is consistent with the previous results.
Again, in the month of November, minimum temperature along with GDP and
population all together accounted for 91.5% variation in retail sales (R2 = 0.915; F(3, 20)
= 71.86; p=0.000). Minimum temperature was a significant predictor of the retail sales, (
= -97.93; t (20) = -2.75; p=0.012). Holding GDP and population constant, with the one
degree Fahrenheit increase of minimum temperature, the apparel retail sales decreased by
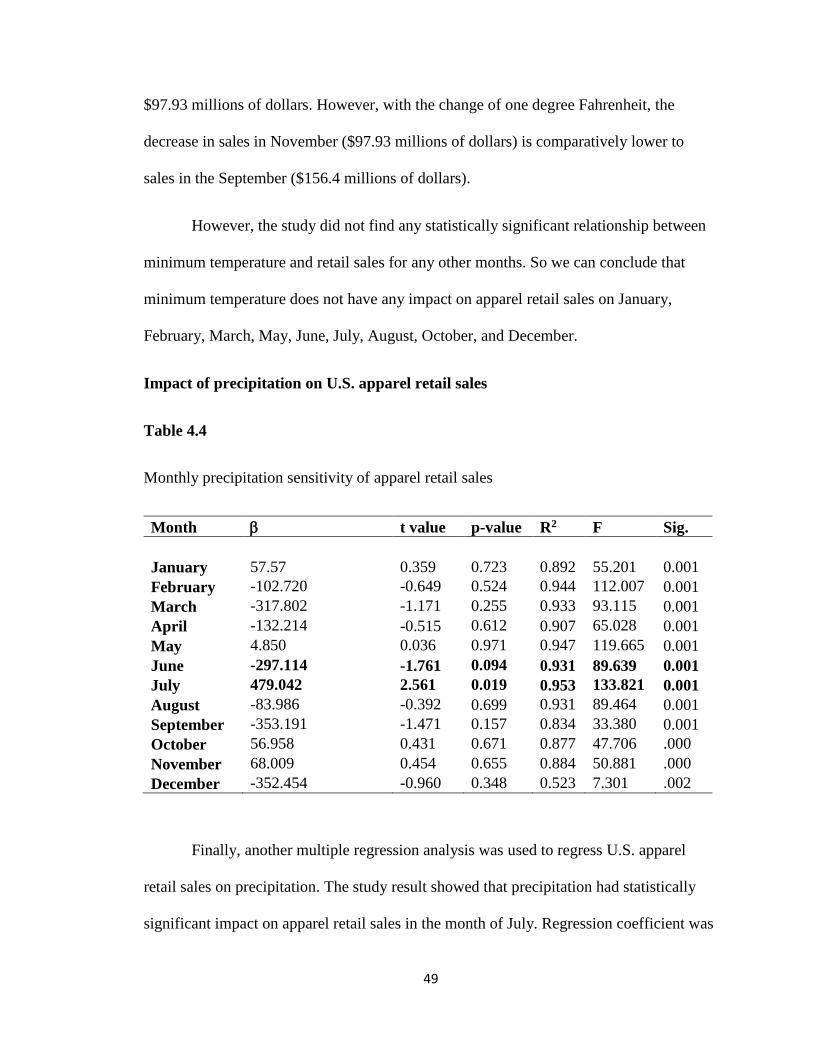
49
$97.93 millions of dollars. However, with the change of one degree Fahrenheit, the
decrease in sales in November ($97.93 millions of dollars) is comparatively lower to
sales in the September ($156.4 millions of dollars).
However, the study did not find any statistically significant relationship between
minimum temperature and retail sales for any other months. So we can conclude that
minimum temperature does not have any impact on apparel retail sales on January,
February, March, May, June, July, August, October, and December.
Impact of precipitation on U.S. apparel retail sales
Table 4.4
Monthly precipitation sensitivity of apparel retail sales
Month t value p-value R2 F Sig.
January 57.57 0.359 0.723 0.892 55.201 0.001
February -102.720 -0.649 0.524 0.944 112.007 0.001
March -317.802 -1.171 0.255 0.933 93.115 0.001
April -132.214 -0.515 0.612 0.907 65.028 0.001
May 4.850 0.036 0.971 0.947 119.665 0.001
June -297.114 -1.761 0.094 0.931 89.639 0.001
July 479.042 2.561 0.019 0.953 133.821 0.001
August -83.986 -0.392 0.699 0.931 89.464 0.001
September -353.191 -1.471 0.157 0.834 33.380 0.001
October 56.958 0.431 0.671 0.877 47.706 .000
November 68.009 0.454 0.655 0.884 50.881 .000
December -352.454 -0.960 0.348 0.523 7.301 .002
Finally, another multiple regression analysis was used to regress U.S. apparel
retail sales on precipitation. The study result showed that precipitation had statistically
significant impact on apparel retail sales in the month of July. Regression coefficient was

50
significant at the 5 percent level. In the month of July, the precipitation along with GDP
and population all together accounted for 95.3% variation in retail sales (R2 = 0.953; F(3,
20) = 133.82; p=0.001). Precipitation was a significant predictor of the retail sales, ( =
479.04; t (20) = 2.56; p=0.019). Holding GDP and population constant, with the one inch
increase of precipitation, the apparel retail sales increased by $479.04 millions of dollars.
That is, wetter the weather, more retail sales would take place. However, the reason
behind this is not known.
Moreover, June shows inconclusive but statistically suggestive evidence that the
precipitation affects retail sales where regression coefficient was significant at the 10
percent level. In the month of June, precipitation along with GDP and population all
together accounted for 93.1% variation in retail sales (R2 = .931; F(3, 20) = 89.64;
p=0.001). Precipitation was a significant predictor of the retail sales ( = -297.11; t (20) =
-1.76; p=0.094). Holding GDP and population constant, with the one inch increase of
precipitation in June, the apparel retail sales decreased by $297.11 millions of dollars.
Similar to July, the reason behind the effect of precipitation on retail sales is unknown.
However, the study did not find any statistically significant relationship between
precipitation and retail sales for any other months. So we can conclude that precipitation
does not have any impact on apparel retail sales on any month of the year but June and
July.
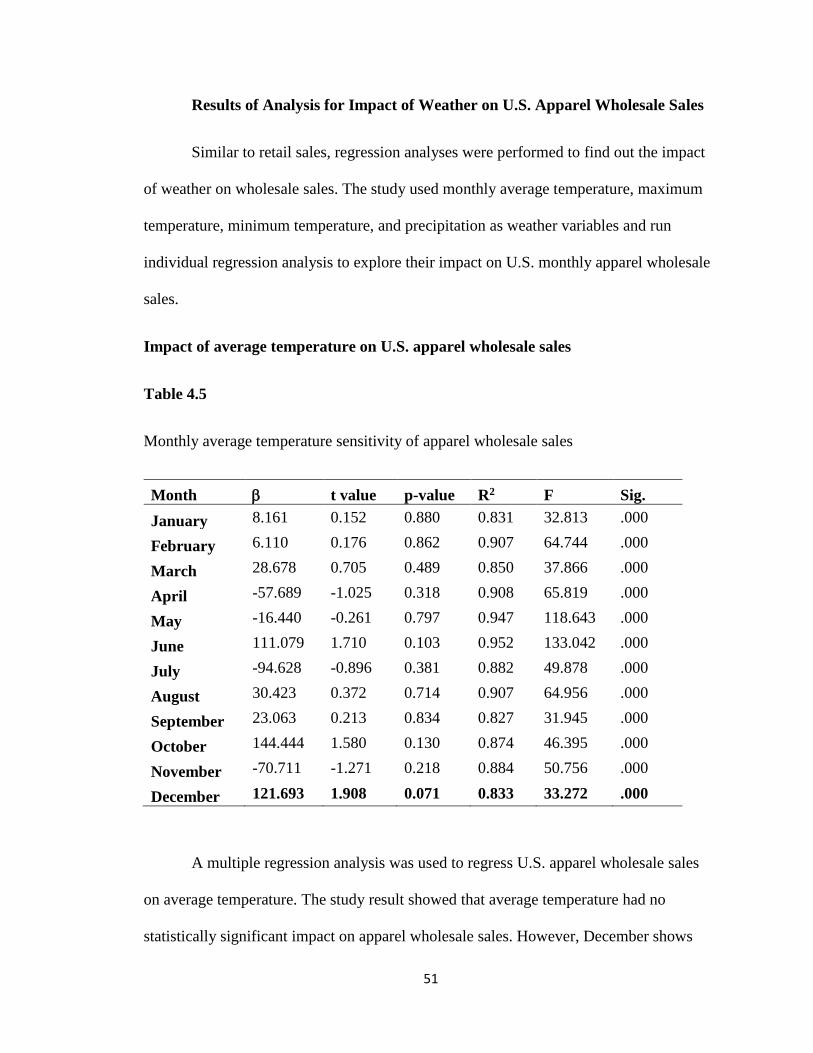
51
Results of Analysis for Impact of Weather on U.S. Apparel Wholesale Sales
Similar to retail sales, regression analyses were performed to find out the impact
of weather on wholesale sales. The study used monthly average temperature, maximum
temperature, minimum temperature, and precipitation as weather variables and run
individual regression analysis to explore their impact on U.S. monthly apparel wholesale
sales.
Impact of average temperature on U.S. apparel wholesale sales
Table 4.5
Monthly average temperature sensitivity of apparel wholesale sales
Month t value p-value R2 F Sig.
January 8.161 0.152 0.880 0.831 32.813 .000
February 6.110 0.176 0.862 0.907 64.744 .000
March 28.678 0.705 0.489 0.850 37.866 .000
April -57.689 -1.025 0.318 0.908 65.819 .000
May -16.440 -0.261 0.797 0.947 118.643 .000
June 111.079 1.710 0.103 0.952 133.042 .000
July -94.628 -0.896 0.381 0.882 49.878 .000
August 30.423 0.372 0.714 0.907 64.956 .000
September 23.063 0.213 0.834 0.827 31.945 .000
October 144.444 1.580 0.130 0.874 46.395 .000
November -70.711 -1.271 0.218 0.884 50.756 .000
December 121.693 1.908 0.071 0.833 33.272 .000
A multiple regression analysis was used to regress U.S. apparel wholesale sales
on average temperature. The study result showed that average temperature had no
statistically significant impact on apparel wholesale sales. However, December shows

52
inclusive but statistically suggestive evidence that average temperature affects wholesale
sales where regression coefficient was significant at the 10 percent level. In the month of
December, average temperature along with GDP and population all together accounted
for 83.3% variation in wholesale sales (R2 = 0.833; F(3, 20) = 33.27; p=0.000). Average
temperature was a significant predictor of the wholesale sales ( = 121.693.11; t (20) =
1.91; p=0.071). Holding GDP and population constant, with one degree Fahrenheit
increase of average temperature in December, the apparel wholesale sales increased by
$121.69 millions of dollars. The study result is quite opposite than what we found for
retail sales. In December, the retail sales were decreased when the average temperature
had decreased but for wholesale it had increased. This is interesting that retailers are
buying more items from wholesalers, but selling less. So there inventory level will be
higher in December than usual which will eventually incur them higher cost. Therefore,
retailers must take preventive steps if they want to reduce their operating costs.
However, the study did not find any statistically significant relationship between
average temperature and wholesale sales for any other months. So we can conclude that
average temperature does not have any impact on apparel wholesale sales on any of the
month but December.
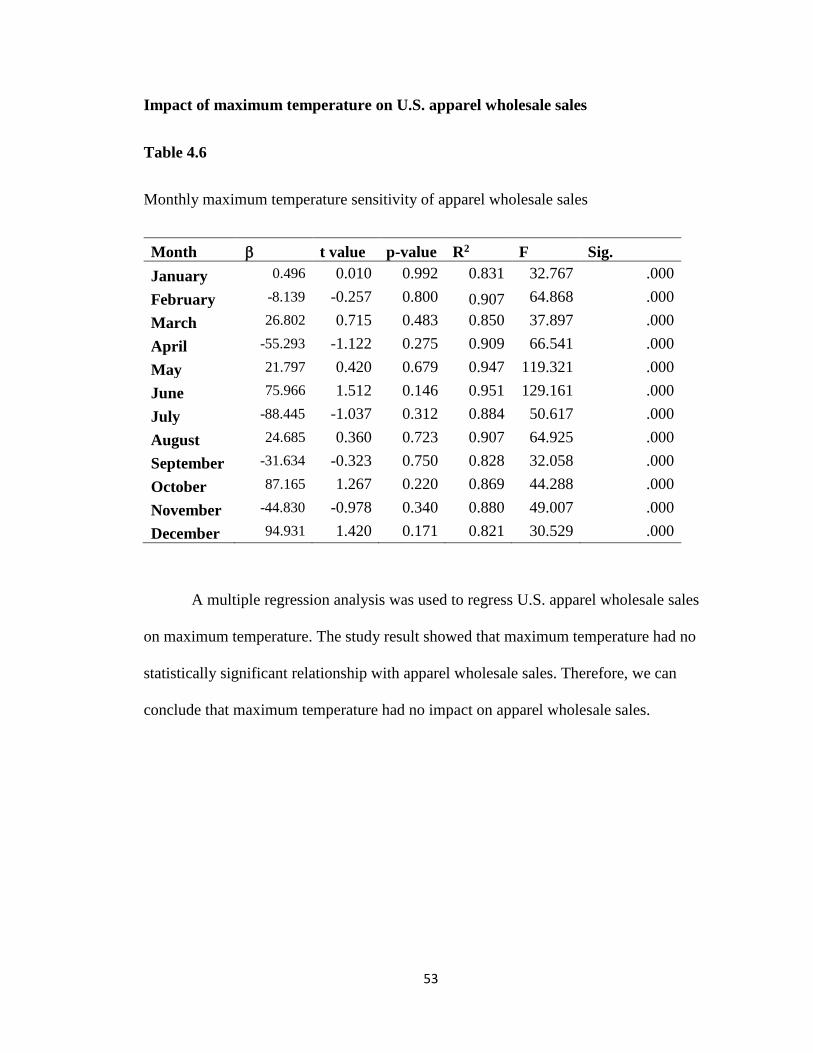
53
Impact of maximum temperature on U.S. apparel wholesale sales
Table 4.6
Monthly maximum temperature sensitivity of apparel wholesale sales
Month t value p-value R2 F Sig.
January 0.496 0.010 0.992 0.831 32.767 .000
February -8.139 -0.257 0.800 0.907 64.868 .000
March 26.802 0.715 0.483 0.850 37.897 .000
April -55.293 -1.122 0.275 0.909 66.541 .000
May 21.797 0.420 0.679 0.947 119.321 .000
June 75.966 1.512 0.146 0.951 129.161 .000
July -88.445 -1.037 0.312 0.884 50.617 .000
August 24.685 0.360 0.723 0.907 64.925 .000
September -31.634 -0.323 0.750 0.828 32.058 .000
October 87.165 1.267 0.220 0.869 44.288 .000
November -44.830 -0.978 0.340 0.880 49.007 .000
December 94.931 1.420 0.171 0.821 30.529 .000
A multiple regression analysis was used to regress U.S. apparel wholesale sales
on maximum temperature. The study result showed that maximum temperature had no
statistically significant relationship with apparel wholesale sales. Therefore, we can
conclude that maximum temperature had no impact on apparel wholesale sales.
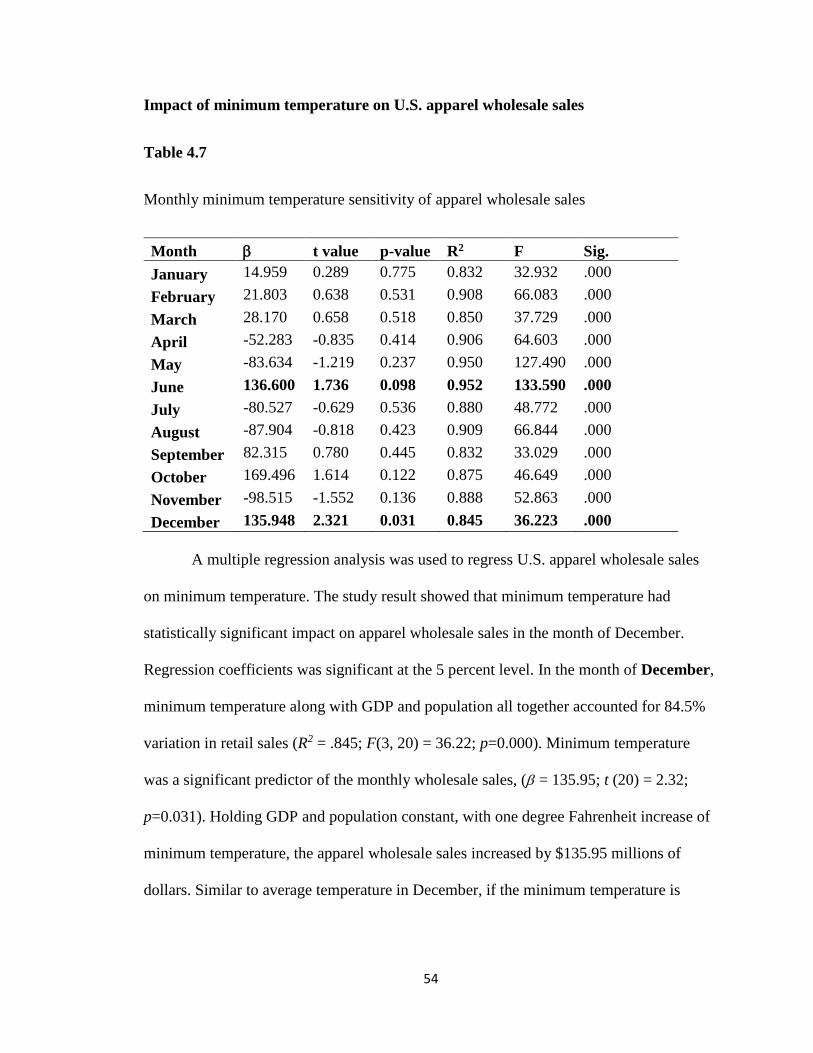
54
Impact of minimum temperature on U.S. apparel wholesale sales
Table 4.7
Monthly minimum temperature sensitivity of apparel wholesale sales
Month t value p-value R2 F Sig.
January 14.959 0.289 0.775 0.832 32.932 .000
February 21.803 0.638 0.531 0.908 66.083 .000
March 28.170 0.658 0.518 0.850 37.729 .000
April -52.283 -0.835 0.414 0.906 64.603 .000
May -83.634 -1.219 0.237 0.950 127.490 .000
June 136.600 1.736 0.098 0.952 133.590 .000
July -80.527 -0.629 0.536 0.880 48.772 .000
August -87.904 -0.818 0.423 0.909 66.844 .000
September 82.315 0.780 0.445 0.832 33.029 .000
October 169.496 1.614 0.122 0.875 46.649 .000
November -98.515 -1.552 0.136 0.888 52.863 .000
December 135.948 2.321 0.031 0.845 36.223 .000
A multiple regression analysis was used to regress U.S. apparel wholesale sales
on minimum temperature. The study result showed that minimum temperature had
statistically significant impact on apparel wholesale sales in the month of December.
Regression coefficients was significant at the 5 percent level. In the month of December,
minimum temperature along with GDP and population all together accounted for 84.5%
variation in retail sales (R2 = .845; F(3, 20) = 36.22; p=0.000). Minimum temperature
was a significant predictor of the monthly wholesale sales, ( = 135.95; t (20) = 2.32;
p=0.031). Holding GDP and population constant, with one degree Fahrenheit increase of
minimum temperature, the apparel wholesale sales increased by $135.95 millions of
dollars. Similar to average temperature in December, if the minimum temperature is

55
warmer in December than regular, the wholesalers will expect more order for early winter
items. Therefore, the wholesale sales will increase with the increase of demand.
The study also found that June showed inconclusive but statistically suggestive
evidence that minimum temperature affects wholesale sales where regression coefficients
were significant at the 10 percent level. In the month of June, minimum temperature
along with GDP and population all together accounted for 95.2% variation in retail sales
(R2 = .952; F(3, 20) = 133.59; p=0.000). Minimum temperature was a significant
predictor of wholesale sales ( = 136.60; t (20) = 1.74; p=0.098). Holding GDP and
population constant, with one degree Fahrenheit increase of minimum temperature in
June, the apparel wholesale sales increased by $136.60 millions of dollars. Which is
consistent with the previous studies. In June, there will be more demand for summer
clothing which will make wholesalers to gather more items. Therefore, with the increase
of demand, sells will increase.
However, the study did not find any statistically significant relationship between
minimum temperature and wholesale sales for any other months. So we can conclude that
minimum temperature does not have any impact on apparel wholesale sales on any other
months but June and December.
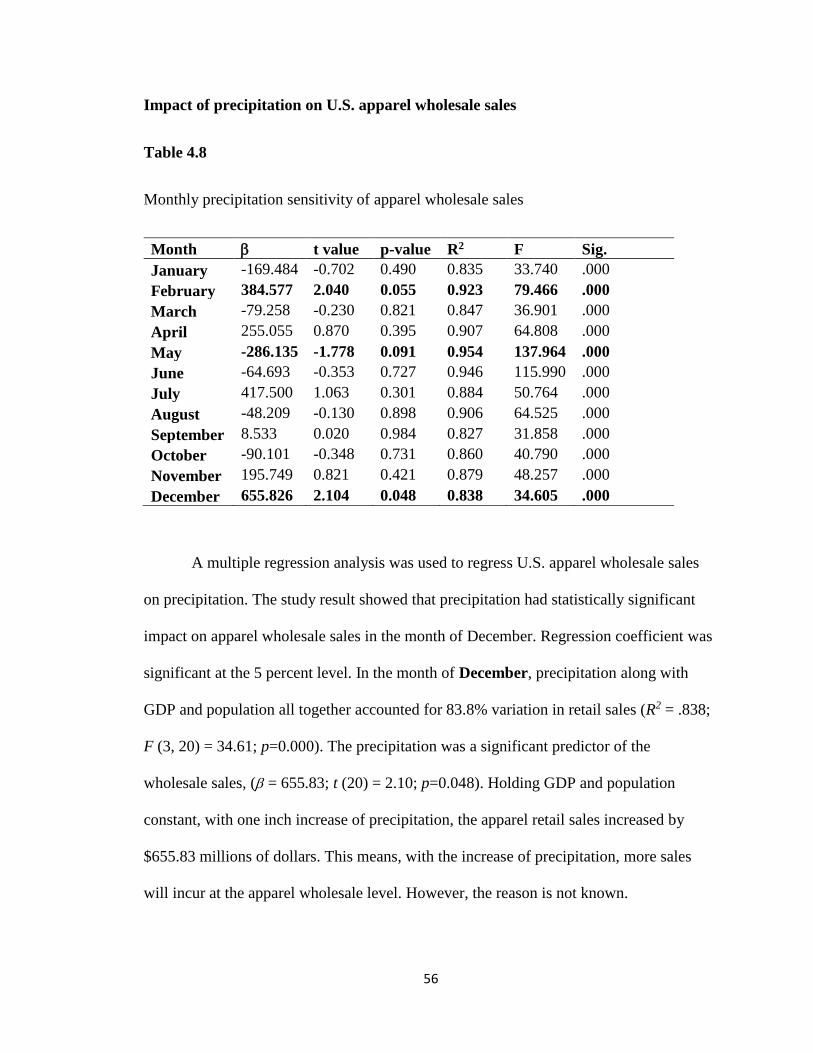
56
Impact of precipitation on U.S. apparel wholesale sales
Table 4.8
Monthly precipitation sensitivity of apparel wholesale sales
Month t value p-value R2 F Sig.
January -169.484 -0.702 0.490 0.835 33.740 .000
February 384.577 2.040 0.055 0.923 79.466 .000
March -79.258 -0.230 0.821 0.847 36.901 .000
April 255.055 0.870 0.395 0.907 64.808 .000
May -286.135 -1.778 0.091 0.954 137.964 .000
June -64.693 -0.353 0.727 0.946 115.990 .000
July 417.500 1.063 0.301 0.884 50.764 .000
August -48.209 -0.130 0.898 0.906 64.525 .000
September 8.533 0.020 0.984 0.827 31.858 .000
October -90.101 -0.348 0.731 0.860 40.790 .000
November 195.749 0.821 0.421 0.879 48.257 .000
December 655.826 2.104 0.048 0.838 34.605 .000
A multiple regression analysis was used to regress U.S. apparel wholesale sales
on precipitation. The study result showed that precipitation had statistically significant
impact on apparel wholesale sales in the month of December. Regression coefficient was
significant at the 5 percent level. In the month of December, precipitation along with
GDP and population all together accounted for 83.8% variation in retail sales (R2 = .838;
F (3, 20) = 34.61; p=0.000). The precipitation was a significant predictor of the
wholesale sales, ( = 655.83; t (20) = 2.10; p=0.048). Holding GDP and population
constant, with one inch increase of precipitation, the apparel retail sales increased by
$655.83 millions of dollars. This means, with the increase of precipitation, more sales
will incur at the apparel wholesale level. However, the reason is not known.
57
The study also found that February showed statistically suggestive evidence that
precipitation affects wholesale sales where regression coefficient was significant at the 10
percent level. In the month of February, precipitation along with GDP and population all
together accounted for 92.3% variation in retail sales (R2 = .923; F(3, 20) = 79.47;
p=0.000). Precipitation was a significant predictor of the monthly wholesale sales ( =
384.58; t (20) = 2.04; p=0.055). Holding GDP and population constant, with the one inch
increase of precipitation in February, the apparel wholesale sales increased by $384.28
millions of dollars.
Again, May showed inconclusive but statistically suggestive evidence that
precipitation affects wholesale sales where regression coefficient was significant at the 10
percent level. In the month of May, precipitation along with GDP and population all
together accounted for 95.4% variation in retail sales (R2 = 0.954; F(3, 20) = 137.96;
p=0.000). Precipitation was a significant predictor of the wholesale sales ( = -286.14; t
(20) = -1.78; p=0.091). Holding GDP and population constant, with one inch increase of
precipitation in May, the apparel wholesale sales decreased by $286.14 millions of
dollars. However, the reason behind the negative effect of precipitation on wholesale
sales is unknown.
However, the study did not find any statistically significant relationship between
precipitation and apparel wholesale sales for any other months. So we can conclude that
precipitation does not have any impact on apparel wholesale sales on other month of the
year but February, May, and December.
58
Results of Analysis for Impact of Weather on the Interaction between U.S.
Apparel Retail Sales and Wholesale Sales
Impact of monthly weather on the interaction between apparel retail sales and
wholesale sales
Regression analyses were performed to find out the impact of monthly weather on
the relationship between U.S. apparel retail and wholesale sales. The study used
interaction between monthly average temperature and apparel wholesale sales, monthly
maximum temperature and apparel wholesale sales, monthly minimum temperature and
apparel wholesale sales, and monthly precipitation and apparel wholesale sales as
independent variables and run individual regression analysis to explore their impact on
U.S. monthly apparel retail sales.
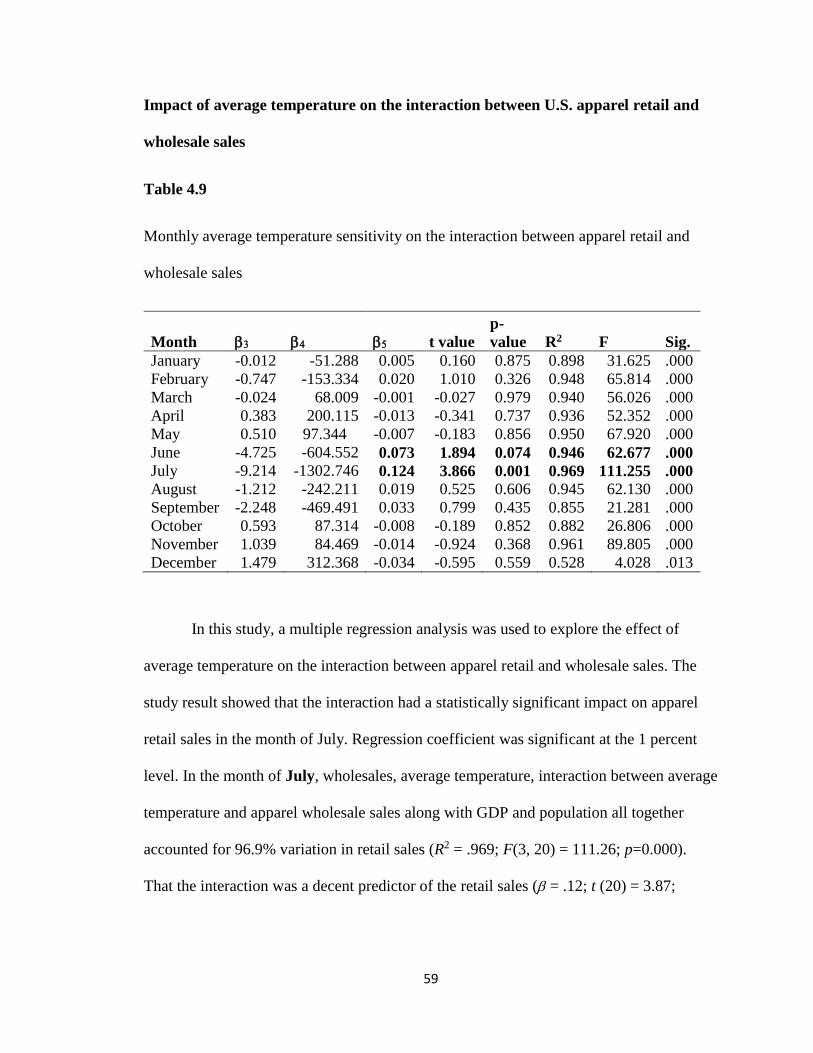
59
Impact of average temperature on the interaction between U.S. apparel retail and
wholesale sales
Table 4.9
Monthly average temperature sensitivity on the interaction between apparel retail and
wholesale sales
Month
t value
p-
value R2 F Sig.
January -0.012 -51.288 0.005 0.160 0.875 0.898 31.625 .000
February -0.747 -153.334 0.020 1.010 0.326 0.948 65.814 .000
March -0.024 68.009 -0.001 -0.027 0.979 0.940 56.026 .000
April 0.383 200.115 -0.013 -0.341 0.737 0.936 52.352 .000
May 0.510 97.344 -0.007 -0.183 0.856 0.950 67.920 .000
June -4.725 -604.552 0.073 1.894 0.074 0.946 62.677 .000
July -9.214 -1302.746 0.124 3.866 0.001 0.969 111.255 .000
August -1.212 -242.211 0.019 0.525 0.606 0.945 62.130 .000
September -2.248 -469.491 0.033 0.799 0.435 0.855 21.281 .000
October 0.593 87.314 -0.008 -0.189 0.852 0.882 26.806 .000
November 1.039 84.469 -0.014 -0.924 0.368 0.961 89.805 .000
December 1.479 312.368 -0.034 -0.595 0.559 0.528 4.028 .013
In this study, a multiple regression analysis was used to explore the effect of
average temperature on the interaction between apparel retail and wholesale sales. The
study result showed that the interaction had a statistically significant impact on apparel
retail sales in the month of July. Regression coefficient was significant at the 1 percent
level. In the month of July, wholesales, average temperature, interaction between average
temperature and apparel wholesale sales along with GDP and population all together
accounted for 96.9% variation in retail sales (R2 = .969; F(3, 20) = 111.26; p=0.000).
That the interaction was a decent predictor of the retail sales ( = .12; t (20) = 3.87;

60
p=0.001). Holding GDP and population constant, change in average temperature affects
the impact of wholesale sales on retail sales.
Moreover, June shows inconclusive but statistically suggestive evidence that the
interaction between monthly average temperature and apparel wholesale sales affects
retail sales where regression coefficient was significant at the 10 percent level. In the
month of June, wholesale sales, average temperature, interaction between average
temperature and apparel wholesale sales along with GDP and population all together
accounted for 94.6% variation in retail sales (R2 = .946; F(3, 20) = 62.68; p=0.000). The
interaction was a significant predictor of the retail sales ( = 0.073; t (20) = 1.89;
p=0.074). Holding GDP and population constant, change in average temperature affects
the impact of wholesale sales on retail sales.
However, the study did not find any statistically significant relationship between
average temperature and interaction between retail and wholesale sales for any other
months. So we can conclude the average temperature does not have any impact on the
relationship between apparel retail and wholesale sales on any other months but June and
July.

61
Impact of maximum temperature on the interaction between U.S. apparel retail and
wholesale sales
Table 4.10
Monthly maximum temperature sensitivity on the interaction between apparel retail and
wholesale sales
Month
t value
p-
value R2 F Sig.
January -0.766 -214.354 0.022 0.608 0.551 0.901 32.770 .000
February -0.913 -147.793 0.019 1.030 0.316 0.948 66.131 .000
March -0.031 65.225 -0.001 -0.021 0.983 0.941 57.768 .000
April -0.493 40.056 0.003 0.104 0.918 0.932 49.510 .000
May 0.902 126.720 -0.011 -0.415 0.683 0.950 68.174 .000
June -6.297 -645.439 0.080 2.853 0.011 0.958 81.293 .000
July -7.630 -938.942 0.087 3.832 0.001 0.971 119.404 .000
August -0.807 -157.500 0.012 0.399 0.694 0.944 60.994 .000
September -2.254 -365.372 0.028 0.721 0.480 0.836 18.318 .000
October -0.051 -58.960 0.003 0.071 0.944 0.885 27.692 .000
November 0.833 32.789 -0.007 -0.518 0.611 0.958 82.928 .000
December 0.715 121.058 -0.011 -0.182 0.858 0.519 3.886 .015
Again, a multiple regression analysis was used to explore the effect of maximum
temperature on the interaction between apparel retail and wholesale sales. The study
results showed that the interaction had a statistically significant impact on apparel retail
sales in the month of July and June. Regression coefficients were significant at the 1
percent and 5 percent levels respectively. In the month of July, wholesale sales,
maximum temperature, interaction between maximum temperature and apparel wholesale
sales along with GDP and population all together accounted for 97.1% variation in retail
sales (R2 = 0.971; F(3, 20) = 119.40; p=0.000). That the interaction was a decent
predictor of the retail sales ( = .09; t (20) = 3.83; p=0.001). Holding GDP and

62
population constant, change in maximum temperature affects the impact of wholesale
sales on retail sales.
Again, June shows that the interaction between maximum temperature and
apparel wholesale sales affects retail sales where regression coefficient was significant at
the 5 percent level. In the month of June, wholesale sales, maximum temperature,
interaction between maximum temperature and apparel wholesale sales along with GDP
and population all together accounted for 95.8% variation in retail sales (R2 = .958; F(3,
20) = 81.29; p=0.000). The interaction was a predictor of the retail sales ( = 0.080; t (20)
= 2.85; p=0.011). Holding GDP and population constant, change in maximum
temperature affects the impact of wholesale sales on retail sales.
However, the study did not find any statistically significant relationship between
maximum temperature and interaction between retail and wholesale sales for any other
months. So we can conclude that the maximum temperature does not have any impact on
the relationship between apparel retail and wholesale sales except for June and July.
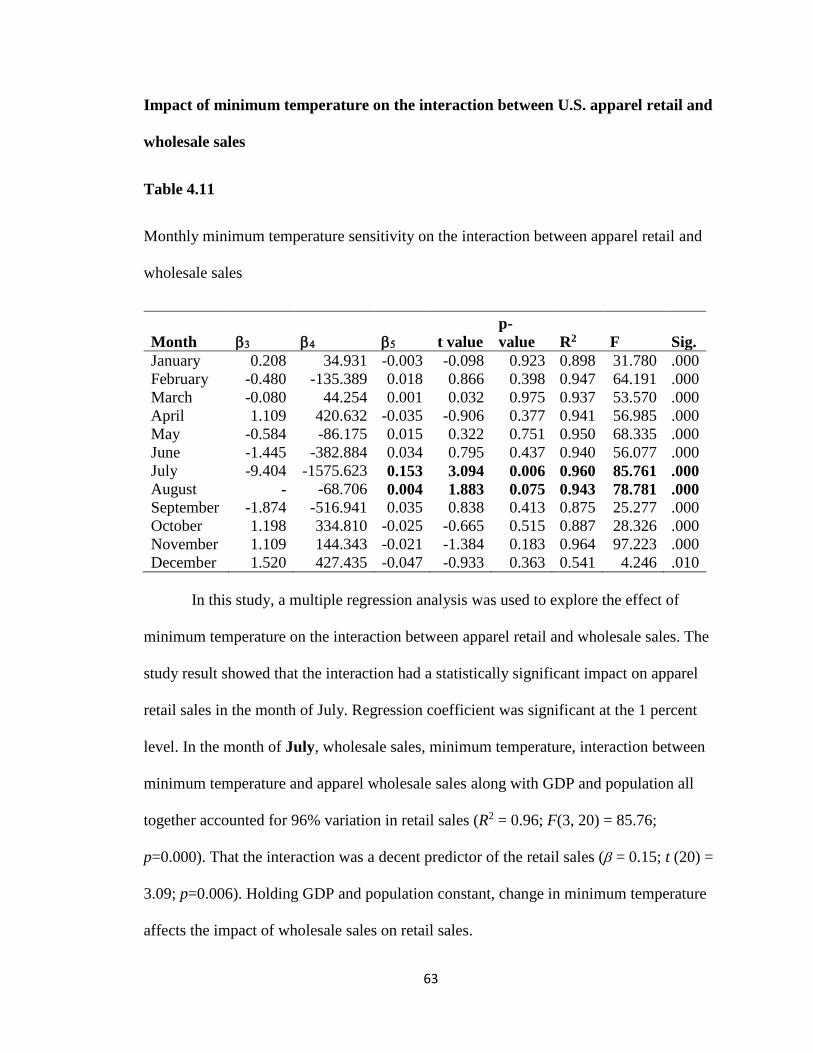
63
Impact of minimum temperature on the interaction between U.S. apparel retail and
wholesale sales
Table 4.11
Monthly minimum temperature sensitivity on the interaction between apparel retail and
wholesale sales
Month
t value
p-
value R2 F Sig.
January 0.208 34.931 -0.003 -0.098 0.923 0.898 31.780 .000
February -0.480 -135.389 0.018 0.866 0.398 0.947 64.191 .000
March -0.080 44.254 0.001 0.032 0.975 0.937 53.570 .000
April 1.109 420.632 -0.035 -0.906 0.377 0.941 56.985 .000
May -0.584 -86.175 0.015 0.322 0.751 0.950 68.335 .000
June -1.445 -382.884 0.034 0.795 0.437 0.940 56.077 .000
July -9.404 -1575.623 0.153 3.094 0.006 0.960 85.761 .000
August - -68.706 0.004 1.883 0.075 0.943 78.781 .000
September -1.874 -516.941 0.035 0.838 0.413 0.875 25.277 .000
October 1.198 334.810 -0.025 -0.665 0.515 0.887 28.326 .000
November 1.109 144.343 -0.021 -1.384 0.183 0.964 97.223 .000
December 1.520 427.435 -0.047 -0.933 0.363 0.541 4.246 .010
In this study, a multiple regression analysis was used to explore the effect of
minimum temperature on the interaction between apparel retail and wholesale sales. The
study result showed that the interaction had a statistically significant impact on apparel
retail sales in the month of July. Regression coefficient was significant at the 1 percent
level. In the month of July, wholesale sales, minimum temperature, interaction between
minimum temperature and apparel wholesale sales along with GDP and population all
together accounted for 96% variation in retail sales (R2 = 0.96; F(3, 20) = 85.76;
p=0.000). That the interaction was a decent predictor of the retail sales ( = 0.15; t (20) =
3.09; p=0.006). Holding GDP and population constant, change in minimum temperature
affects the impact of wholesale sales on retail sales.

64
Moreover, August shows inconclusive but statistically suggestive evidence that
the interaction between minimum temperature and apparel wholesale sales affects retail
sales where regression coefficient was significant at the 10 percent level. In the month of
August, wholesale sales, minimum temperature, interaction between minimum
temperature and apparel wholesale sales along with GDP and population all together
accounted for 94.3% variation in retail sales (R2 = 0.943; F(3, 20) = 78.78; p=0.000). The
interaction was a small predictor of the retail sales ( = 0.004; t (20) = 1.89; p=0.075).
Holding GDP and population constant, change in minimum temperature affects the
impact of wholesale sales on retail sales.
However, the study did not find any statistically significant relationship between
minimum temperature and interaction between monthly retail and wholesale sales for any
other months. So we can conclude that minimum temperature does not have any impact
on the relationship between apparel retail and wholesale sales except for July and August.
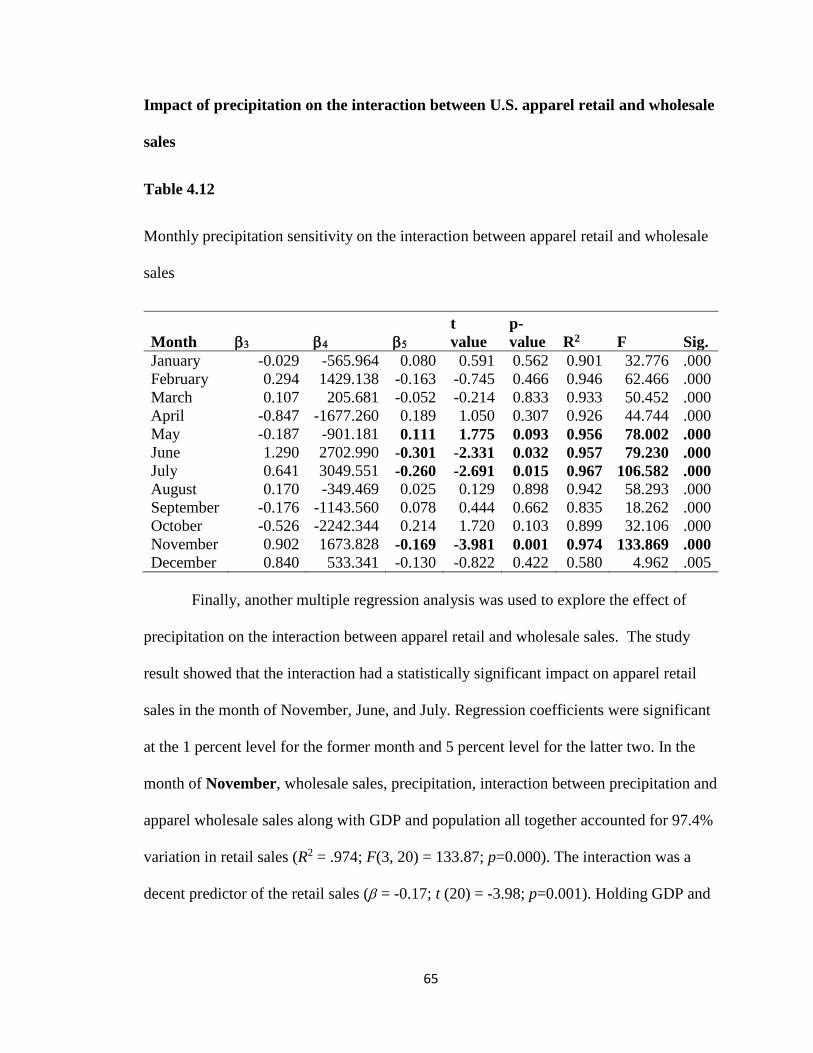
65
Impact of precipitation on the interaction between U.S. apparel retail and wholesale
sales
Table 4.12
Monthly precipitation sensitivity on the interaction between apparel retail and wholesale
sales
Month
t
value
p-
value R2 F Sig.
January -0.029 -565.964 0.080 0.591 0.562 0.901 32.776 .000
February 0.294 1429.138 -0.163 -0.745 0.466 0.946 62.466 .000
March 0.107 205.681 -0.052 -0.214 0.833 0.933 50.452 .000
April -0.847 -1677.260 0.189 1.050 0.307 0.926 44.744 .000
May -0.187 -901.181 0.111 1.775 0.093 0.956 78.002 .000
June 1.290 2702.990 -0.301 -2.331 0.032 0.957 79.230 .000
July 0.641 3049.551 -0.260 -2.691 0.015 0.967 106.582 .000
August 0.170 -349.469 0.025 0.129 0.898 0.942 58.293 .000
September -0.176 -1143.560 0.078 0.444 0.662 0.835 18.262 .000
October -0.526 -2242.344 0.214 1.720 0.103 0.899 32.106 .000
November 0.902 1673.828 -0.169 -3.981 0.001 0.974 133.869 .000
December 0.840 533.341 -0.130 -0.822 0.422 0.580 4.962 .005
Finally, another multiple regression analysis was used to explore the effect of
precipitation on the interaction between apparel retail and wholesale sales. The study
result showed that the interaction had a statistically significant impact on apparel retail
sales in the month of November, June, and July. Regression coefficients were significant
at the 1 percent level for the former month and 5 percent level for the latter two. In the
month of November, wholesale sales, precipitation, interaction between precipitation and
apparel wholesale sales along with GDP and population all together accounted for 97.4%
variation in retail sales (R2 = .974; F(3, 20) = 133.87; p=0.000). The interaction was a
decent predictor of the retail sales ( = -0.17; t (20) = -3.98; p=0.001). Holding GDP and
66
population constant, change in precipitation affects the impact of wholesale sales on retail
sales.
In the month of June, wholesale sales, precipitation, interaction between
precipitation and apparel wholesale sales along with GDP and population all together
accounted for 95.7% variation in retail sales (R2 = 0.957; F(3, 20) = 79.23; p=0.000).
That the interaction was a decent predictor of the retail sales ( = -0.30; t (20) = -2.33;
p=0.032). Holding GDP and population constant, change in precipitation affects the
impact of wholesale sales on retail sales. In the month of July, wholesale sales,
precipitation, interaction between precipitation and apparel wholesale sales along with
GDP and population all together accounted for 96.7% variation in retail sales (R2 = .967;
F(3, 20) = 106.58; p=0.000). That the interaction was a decent predictor of the retail sales
( = -0.26; t (20) = -2.69; p=0.015). Holding GDP and population constant, change in
precipitation affects the impact of wholesale sales on retail sales.
Moreover, May shows inconclusive but statistically suggestive evidence that the
interaction between precipitation and apparel wholesale sales affects retail sales where
regression coefficient was significant at the 10 percent level. In the month of May, the
interaction between precipitation and apparel wholesale sales along with GDP and
population all together accounted for 95.6% variation in retail sales (R2 = 0.956; F(3, 20)
= 78.00; p=0.000). The interaction was a small predictor of the retail sales ( = 0.11; t
(20) = 1.78; p=0.093). Holding GDP and population constant, precipitation affected the
relationship between retail and wholesale sales.
However, the study did not find any statistically significant relationship between
precipitation and interaction between retail and wholesale sales for any other months. So

67
we can conclude that precipitation does not have any impact on the relationship between
apparel retail and wholesale sales except for May, June, July, and November.
68
CHAPTER V: CONCLUSIONS
Chapter V contains the following sections (a) summary of the study, (b) discussion and
implications of the major findings, (c) contribution of findings, (d) study limitations and
future research suggestions.
Summary of the Study
It has been proven that weather has a significant impact on business activities.
Several studies have done in different fields to see how weather impact. Agriculture,
tourism, and forestry are few of them. However, few studies have been done to see if
weather has any influence on apparel sales. Apparel are seasonal goods and largely
influenced by consumer behavior, contemporary fashion trends, and different supply
chain factors i.e. labor strikes, transportation disruptions, and natural disasters. A change
in the weather might influence all these factors and significantly impact retail and
wholesale sales. Since retailers and wholesalers work very closely in the apparel industry,
impact of weather on one will influence the other. Therefore, in this study it was assumed
that weather might have some impact on both retail and wholesale sales as well as their
interactions. The study found that weather does have some impact on both retail and
wholesale sales as well as on their interactions.
This study was designed to find out how the weather impact on U.S. apparel retail
sales and wholesale sales and at what amount. At the same time, study also tested the
relationship between apparel retail and wholesale sales and examine how weather
influences that relationship. Due to lack of sufficient prior research on this relationship,

69
this study was designed in an exploratory manner and the following specific research
questions were proposed.
Research Question 1: What are the impacts of weather conditions in general on
U.S. apparel retail sales?
Research Question 2: What are the impacts of weather conditions in general on
U.S. apparel wholesale sales?
Research Question 3: What are the impacts of weather on the relationships
between U.S. apparel retail and wholesale sales?
In this study, secondary data were used. U.S. apparel monthly retail sales,
wholesale sales, and weather data were collected and analyzed. U.S. apparel monthly
retail sales and wholesales data were seasonally unadjusted and collected from the U.S.
census bureau. Later, the data were normalized to eliminate the impact of consumer price
index (CPI). Weather data (including monthly average temperature, maximum
temperature, minimum temperature, and precipitation) were collected from National
Centers for Environmental Information (NCEI). The study used 24 years (1992 to 2015)
of national level sales and weather data. The monthly average temperature (Av),
maximum temperature (Mx), minimum temperature (Mn), and precipitation (Pr) were
used as independent variables. Apparel retail and wholesale sales were defined as sales in
millions of dollars whereas the temperature and precipitation variables were defined by
Fahrenheit and inch respectively. Moreover, Gross Domestic Product (GDP), discounted
by CPI and population were used as control variables in this study to minimize their
impact on sales.

70
To analyze impact of weather on retail sales, the following regression equation
was developed for Av and the Av data were then replaced for Mx, Mn, and Pr
respectively (Rij= β0 + β1GDPj+ β2POPij+ β3Avij + έij, where, Rij = U.S. apparel retail sales
for month i and year j; GDPj = Gross Domestic Product for year j; POPjj= Population for
month i and year j; Avij, = Monthly average temperature for month i and year j; Mxij,=
Monthly maximum temperature for month i and year j; Mnij,= Monthly minimum
temperature for month i and year j; Prij = Monthly average precipitation for month i and
year j; and έij = Error term). Again, to analyze impact of weather on wholesale sales,
following regression equation was developed for Av and the Av data were then replaced
for Mx, Mn, and Pr respectively (Wij= β0 + β1GDPj+ β2POPij+ β3Avij + έij, where Wij=
U.S. apparel wholesale sales for month i and year j). Finally, to analyze impact of
weather on the relationship between apparel retail and wholesale sales, regression
equation was developed for Av and the Av data were then replaced for Mx, Mn, and Pr
respectively (Rij = β0 + β1GDPj + β2POPij + β3Wij+ β4Avij+ β5YijAvij +έij).
Next, regression analyses were conducted. Each equation was run to assess the
impact of weather on a particular month. Since there are 12 months in a year and the
datasets were collected from 1992 to 2015, so each equation was run for 12 times from
January to December and the total number of sample for each equation was 24. To
analyze weather impacts on economic activities, multiple regressions were conducted to
assess the contribution of each weather factor on sales. All the statistical analysis was
performed using the computer program SPSS.
71
Discussion and implication of Major Findings
The result of this study revealed that U.S. apparel sales are influenced by weather.
The results have several implications.
The study found that the weather has impact on apparel retail sales. During
spring, more specifically during March and April, increase in temperature positively
impacts apparel retail sales. In these two months, for each unit increase of temperature,
the retail sales increase. With one degree Fahrenheit increase, the retail sales in April
($105.05 millions of dollars) will be almost double compare to March ($57.79 millions of
dollars). On the other hand, with one degree Fahrenheit increase in late fall and early
winter, especially in September and November, the retail sales will decrease. With one
degree Fahrenheit increase, the sales will decrease more in September ($127.49 millions
of dollars) compared to November ($76.43 millions of dollars). The sales also decrease
with the increase of temperature in the month of July.
As expected in March and April, sales increase with warmer than normal
temperature while they decrease in September and November when the temperature is
colder than normal. These results are consistent with previous studies which suggest that
most significant correlation factors between apparel and temperature were observed in
spring and fall seasons and in the months of March, April, and May on one side, and in
September, October, and November, on the other side (Bertrand, Brusset & Fortin, 2015;
Marteau et.al. 2004). Bahng and Kincade (2012) also suggested that more seasonal items
are sold when the temperature changes drastically. The study also found that with the
increase of precipitation, the sales decrease in June but increase in July. However, the
reasons are unknown.
72
This information will be very useful to retailers. Retailers are now expected to
buy more items in early spring if there is a possibility of warmer than regular
temperature, and decrease their inventory in late fall and early spring, if the temperature
forecasts colder than normal temperature. For example, if retailers assume that the
temperature will be higher in March and April than the regular temperature, they can
expect a higher rate of traffic in their stores. Therefore, they can store more items to fulfil
the increasing demands. They can also predict, exactly what amount of the sales will
increase in each month and buy their items accordingly. For example, in September, if
the temperature increases by one degree Fahrenheit higher than the normal temperature,
the retailers will know their sales will decrease by $127.49 millions of dollars. So the
retailers can take precautions to avoid major loss in their sales. For instance, retailers can
order less items in September or offer promotions in August so that they have higher
sales in August and lower inventory in September. Retailers also know that they have to
take different strategies in June and July with the increase in precipitation.
Moreover, the study also revealed that weather has some impact on U.S. apparel
wholesale sales. In June and December, the wholesale sales increase as the temperature
increases. As expected in June, sales increase with the warmer than normal temperature
while the demand for summer clothing is usually higher. On the other hand, if the
temperature is above average in December, there will be more demand for early winter
items. Therefore, the wholesale sales will increase.
The study also found that the precipitation largely influences wholesale sales.
During the winter, more specifically in December and January, the sales increase if there
is higher precipitation than the normal. With the increase of one inch precipitation, the
73
sales will be almost double in December ($655.83 millions of dollars) compared to
February ($384.58 millions of dollars). On the other hand, in May, the sales decreases
with the increase of one inch precipitation and it will be around $286.14 millions of
dollars. Therefore, this information will be extremely helpful for the wholesalers as they
can now anticipate the impact of weather changes on their sales and take remedial steps
to overcome the impact of weather.
Another interesting thing the study revealed is that with the increase in
temperature in December, the wholesale sales increase but the retail sales decrease. This
also means that with the increase in temperature in December, wholesalers are selling
more items to retailers but retailers are failing to increase their sales. Therefore, retailers
end up with higher inventory, which cause them incur higher cost. So retailers may
realize the fact and implement some strategic managerial decisions to reduce their
inventory as well as their cost.
The study also explained the impact of weather on the interaction between U.S.
apparel retail and wholesale sales. The result revealed that change in temperature affects
the impact of wholesale sales on retail sales during the months of June, July, and August.
On the other hand, change in precipitation affects the impact of wholesale sales on retail
sales during the months of May, June, July, and November.
Contributions of Findings
This research has several contributions. First, the study could be able to contribute
to reduce the gap in literature significantly. This is the first time a study tried to find out a
relationship between weather and U.S. apparel retail sales. There has been few studies

74
made outside the United States, but nobody has done it before in the United States. In
addition to that, most of the studies used temperature deviation as the only weather factor
but this study used average temperature, maximum temperature, minimum temperature,
and precipitation as weather variables. Therefore, this study provides more
comprehensive results of the impact of weather on sales. The study expands the existing
apparel industry literature by showing impact of weather on wholesale sales. In addition
to that, it also suggests an anticipated impact of weather on the interaction between
apparel retail and wholesale sales. Therefore, this study tries to fill up the gap in the
literature and answer several weather related questions which were largely ignored by
academics.
Second, the study also significantly contributes to the apparel retail and wholesale
sectors. The U.S. retailers now can predict how the change in weather will impact their
sales and at what amount, and take corrective actions to mitigate the negative impact of
the weather on business activities. Moreover, the findings help U.S. apparel retailers in
their strategic and financial decisions making. The wholesalers will benefit from this
study too. Since the study also predicts the impact of weather on wholesale sales, the
wholesalers are now able to forecast their demand more accurately and take necessary
actions to reduce the negative influence of weather. Since the study explains how weather
impacts the interaction between retail and wholesale sales, this could be vital for retail
companies who work closely with the wholesale sectors or the companies who perform
both retailing and wholesaling activities.
Third, the study findings can also be used by the educators and advocating
groups. The study provides an insight about how weather impact apparel retail and

75
wholesale sales as well as the interaction between retail and wholesale sales. This could
open a totally new window for educators. Since the impact of weather on apparel retail
and wholesale sales is often neglected by the academics, they can use this study to
educate themselves as well as the industry professionals. They can carry out further study
on the weather and apparel sales and explore different level of relationships between
weather and sales. The apparel industry advocates and specialists can use this study to
educate their clients.
Finally, textile and apparel educators may want to teach these relationships
between weather and sales to students so that they could be better prepared for the
industry. Having this specific information may help future industry leaders and
employers to make both strategically and financially right decisions.
Study Limitations and Future Research Suggestions
Despite the significant results obtained from this study, there are few limitations.
First, one of the major limitations relate to this particular study’s sample size. The study
used datasets from 1992 to 2015 and the sample size was 24. Even though the sample
size provides statistically significant relationships between weather and sales, a larger
sample size would provide better and more comprehensive results. Therefore, further
studies with higher range of samples with a greater breadth is recommended.
Second, the study used average temperature, maximum temperature, minimum
temperature and precipitation as weather variables. However, there might be some
weather variables for example snow, drought, natural disasters such as floods, cyclones,
tornados etc. which might impact the retail and wholesale sales. So, future study should
76
include all other factors which might influence sales. In this study, population and Gross
Domestic Product (GDP) were used as control variables and measurement was taken to
normalize their impact on sales. However, the sales might be influenced by several other
factors such as markdown of price, clearance sales, and especial events. So future studies
should include all other factors which have direct influences on sales.
Third, the study examined the impact of weather on both retail and wholesale
sales and found that weather has significant impact on retail sales and wholesale sales as
well as on their interaction. However, manufacturers are responsible for producing all
kinds of apparel and textiles in the United States and the wholesalers and the retailers are
largely depend on the manufacturers for their products. So if the weather has some kind
of impact on manufacturers’ sales, then that might have significant impact on both retail
and wholesale sales. Therefore, future study should be done to find out the impact of
weather on manufacturers sales too. An additional studies should be carried out to find
out the impact of weather on the interaction among apparel manufacturer sales, wholesale
sales, and retail sales.
Fourth, the data used in this study were mostly monthly level data which were
used to find out the impact of weather on the interaction between apparel retail and
wholesale sales. Since apparel products are seasonal products and seasons might have
significant impact on the sales, therefore further study should be done by using seasonal
data to see how weather influence on sales. This will help us to get a long term impact of
weather on sales. Due to the limitation of data accessibility, the study used country level
data. However, since there are fifty states in the United States and each state weather
differ from each other significantly, we can get more comprehensive results if can use
77
state level or city level data. The study would give more realistic picture of the weather
influence on sales if we could use individual firm level data. Since the change in amount
of dollar could be normalized by the change in the price of the products, therefore further
research is recommended using amount of sales data instead of monetary value. Future
studies could be done both inside and outside the United States to find out how weather
impact sales in general around the world.
Fifth, it was beyond the scope of the study to see retailers and consumers
perception on the impact of weather on sales which can give us a more comprehensive
answers about the true impact of weather on sales. The retailer should be aware about the
negative impact of sales and how they can minimize these impacts. Therefore, various
study should be done to develop appropriate mathematical tools which can accurately
predict the negative impact of weather on sales and at the same time provide suggestions
to overcome these impacts.
Moreover, this is the first time that a study tried to find out a relationship between
weather and wholesale and impact of weather on the interaction between apparel retail
and wholesale sales. The study found that weather has significant impact both on apparel
wholesales as well as its interaction with retail sales. However, most of the cases the
reasons are unknown due to lack of pertinent literatures which can exactly predict these
relationships. Therefore, further studies are recommended to verify these relationships as
well as to reveal the reasons behind weathers impact on these relationships.
To conclude, the impact of weather on sales should be developed further. Even
though several studies have been done to see the impact of different supply chain factors
on sales, most of the time weather has not considered a significant factor. Since the whole
78
world is vulnerable to the rapid weather changes, like all other business industries, future
apparel industry will largely influenced by the weather. Therefore, both the academicians,
apparel manufacturers, wholesalers, and retailers should consider weather as a vital factor
for their business growth and work jointly to accurately predict and normalize its impact
on business activities.
79
REFERENCES
Abernathy, F. H., Dunlop, J. T., Hammond, J. H., & Weil, D. (1999). A stitch in time:
Lean retailing and the transformation of manufacturing--lessons from the apparel
and textile industries. Oxford University Press.
Bahng, Y., & Kincade, D. H. (2012). The relationship between temperature and sales:
Sales data analysis of a retailer of branded women's business wear. International
Journal of Retail & Distribution Management, 40(6), 410-426.
Bertrand, J. L., Brusset, X., & Fortin, M. (2015). Assessing and hedging the cost of
unseasonal weather: Case of the apparel sector. European Journal of Operational
Research, 244(1), 261-276.
Bertrand, J.-L., & Sinclair-Desgagné, B. (2012). Environmental risks and financial
markets: A two-way street. In The oxford handbook of business and the natural
environment (pp. 482–501). Oxford University Press.
Berlage, K. (2013). The weather business: How companies can protect against increasing
weather volatility. Technical report. The Allianz Group. Retrieved January 07,
2016 from http://www.agcs.allianz. com/ insights/white-papers-and-case-
studies/art-weather-report/.
Bloesch, J., & Gourio, F. (2015). The effect of winter weather on US economic activity.
Economic Perspectives, 39(1).
Bureau of Economic Analysis (2016). National Economic Accounts. Retrieved January 05,
2016 from Current-dollar and “real” GDP: http://bea.gov/national/index.htm#gdp.
80
Bureau of Labor Statistics (2016a). Subjects: Consumer Price Index. Retrieved January
05, 2016 from http://www.bls.gov/cpi/cpisaqanda.htm.
Bureau of Labor Statistics (2016b). Consumer Price Index: FAQs. Retrieved January 05,
2016 from http://www.bls.gov/cpi/cpifaq.htm#Question_1.
Cachon, G., Gallino, S., & Olivares, M. (2012). Severe weather and automobile assembly
productivity. Columbia Business School Research Paper, (12/37).
Cachon, G., & Swinney, R. (2009). Purchasing, pricing, and quick response in the
presence of strategic consumers. Management Science, 55(3), 497–511.
Cao, M., & Wei, J. (1998). Pricing weather derivatives: An equilibrium approach.
Working paper.
Créhalet, E., Bertrand, J.-L., & Fortin, M. (2013). Demystifying climate effects. Research
report, Kepler-Chevreux ESG.
Crewe, L., & Davenport, E. (1992). The puppet show: changing buyer-supplier
relationships within clothing retailing. Transactions of the Institute of British
Geographers, 183-197.
Dutton, J. (2002). Opportunities and priorities in a new era for weather and climate
services. Bulletin of American Meteorological Society, 83(9), 1303–1311.
Ellis, K. (2007). Importers concerned with port security plan. Women’s Wear Daily, 193,
12-12.
Goeree, J. K., & Holt, C. A. (1999). Stochastic game theory: For playing games, not just
for doing theory. Proceedings National Academy of Sciences of the USA, 96(19),

81
10564–10567. Retrieved January 07, 2016 from
http://ideas.repec.org/p/vir/virpap/306.html.
Gereffi, G. (2001). Beyond the producer-driven/buyer-driven dichotomy. IDS bulletin,
32(3), 30-40.
Gereffi, G. (1994). The Organization of Buyer-Driven Global Commodity Chains: How
US Retailers Shape Overseas Production Networks. Commodity chains and global
capitalism. Greenwood Press, Westport, CT, pp. 95-122.
Ha-Brookshire, J. E., & Dyer, B. (2008). Apparel import intermediaries the impact of a
hyperdynamic environment on US apparel firms. Clothing and Textiles Research
Journal, 26(1), 66-90.
Ha-Brookshire, J. E., & Lu, S. (2010). Organizational identities and their economic
performance: an analysis of US textile and apparel firms. Clothing and Textiles
Research Journal.
Hair, J. F., Black, W. C., Babin, B. J., Anderson, R. E., & Tatham, R. L. (2006).
Multivariate data analysis (Vol. 6). Upper Saddle River, NJ: Pearson Prentice
Hall.
Intergovernmental Panel on Climate Change (2014). Climate change 2014-Impacts,
adaptation and vulnerability: Intergovernmental Panel on Climate Change.
Retrieved January 05, 2016 from www.ipcc-wg2.gov/AR5.
Jin, B. (2004). Apparel industry in East Asian newly industrialized countries:
Competitive advantage, challenge and implications. Journal of Fashion
Marketing and Management: An International Journal, 8(2), 230-244.
82
Kincade, D. H., Kim, J., & Gibson, F. (2010). Generational consumer segments and
shopping process characteristics: Baby boomers and echo boomers with apparel
product selection activities. Journal of Global Fashion Marketing, 1(1), 19-29.
Kunz, G. I., & Garner, M. B. (2006). Going global: The textile and apparel industry,
New York: Fairchild.
Larsen, P. H. (2006). Estimating the sensitivity of U.S. economic sectors to weather,
working paper, Cornell University.
Lee, Y., & Oren, S. S. (2009). An equilibrium pricing model for weather derivatives in a
multi-commodity setting. Energy Economics, 31(5), 702-713.
Marteau, D., Carle, J., Fourneaux, S., Holz, R., & Moreno, M. (2004). La gestion du
risqué climatique. Edition Economica, ch. la mesure de l’exposition au risque
climatique, p. 35.
Mentzer, J. T. (2004). Fundamentals of supply chain management: Twelve drivers of
competitive advantage. Thousand Oaks, CA: Sage.
National Centers for Environmental Information (2015a). About us. Retrieved November
15, 2015, from National Centers for Environmental Information (NAICS)-NOAA:
http://www.ncdc.noaa.gov/cag/background/us.
National Retail Federation (2014). The Economic Impact of the U.S: Retail Industry.
Retrieved December 11, 2015, from https://nrf.com/resources/retail-library/the-
economic-impact-of-the-us-retail-industry.
Nordas, H. K. (2004). The global textile and clothing industry post the agreement on
textiles and clothing. World, 7, 1-000.

83
North American Industry Classification System Association (2015). NAICS structure.
Retrieved January 22, 2016, from North American Industry Classification System
Association: http://www.naics.com/history-naics-code/.
Newstex (2014). United States Men's & Boys' Apparel Wholesaling Market: Wholesale
bypass and cheap imports continue to lower prices and hurt demand: Men's &
Boys' Apparel Wholesaling in the US - Industry Market Research Report,
Chatham: Newstex. Retrieved January 10, 2016 from Newstex Trade & Industry
Blogs:
http://proxy.mul.missouri.edu/login?url=http://search.proquest.com/docview/1634
904944?accountid=14576
Organization for Economic Co-operation and Development (2015). OCD data-Domestic
product: Gross domestic product. Paris, France: Organization for Economic Co-
operation and Development. Retrieved January 06, 2016, from
https://data.oecd.org/gdp/gross-domestic-product-gdp.htm.
Parsons, A. G. (2001). The association between daily weather and daily shopping
patterns. Australasian Marketing Journal (AMJ), 9(2), 78-84.
Şen, A. (2008). The US fashion industry: a supply chain review. International Journal of
Production Economics, 114(2), 571-593.
Statista.com (2015). Fashion & Accessories. Retrieved September 20, 2015, from
http://www.statista.com/topics/965/apparel-market-in-the-us/.
Ramsey, F., & Schafer, D. (2012). The statistical sleuth: a course in methods of data
analysis. Cengage Learning.
84
Stockhammer, E., Hochreiter, H., Obermayr, B., & Steiner, K. (1997). The index of
sustainable economic welfare (ISEW) as an alternative to GDP in measuring
economic welfare. The results of the Austrian (revised) ISEW calculation 1955–
1992. Ecological Economics,
U.S. Census Bureau. (2015a). 2012 NAICS definition: Wholesale Trade. Retrieved
September 27, 2015, from North American Industry Classification System:
http://www.census.gov/econ/isp/ sampler.php?naicscode=42&naicslevel=2#.
U.S. Census Bureau. (2015b). 2012 NAICS definition: Retail Trade. Retrieved September
27, 2015, from North American Industry Classification System:
http://www.census.gov/econ/isp/ sampler.php?naicscode=44-45&naicslevel=2#.
U.S. Census Bureau. (2015c). About the Census Bureau: What we do. Retrieved
September 27, 2015, from North American Industry Classification System:
http://www.census.gov/ about/what.html.
U.S. Census Bureau. (2015d). E-Stats 2013. Retrieved September 27, 2015, from North
American Industry Classification System: https://www.google.com/search?q=
Wholesalers%E2%80%99+work+as+an+intermediate+between+manufacturers%
2C+and+retailers.+Apparel+wholesale+sectors+primarily+engaged+in+distributi
on+of+piece+goods%2C+notions%2C+clothing%2C+accessories%2C+and+foot
wear.+&ie=utf-8&oe
=utf8#q=The+U.S.+retail+sales+were+approximately+US+%244.5+trillion+in+2
013+.
U.S. Census Bureau. (2015e). 2012 NAICS definition- Retail Trade: Clothing and
clothing accessories stores. Retrieved September 27, 2015, from North American

85
Industry Classification System:
http://www.census.gov/econ/isp/sampler.php?naicscode=448&naicslevel=3#.
U.S. Census Bureau. (2015f). Monthly and Annual Retail Trade. Retrieved September 27,
2015, from Business & Industry:
www2.census.gov/retail/releases/current/arts/sales.xls.
U.S. Census Bureau. (2015g). 2012 NAICS definition: Retail Trade: Clothing and
clothing accessories stores: Clothing stores. Retrieved September 27, 2015, from
North American Industry Classification System:
http://www.census.gov/econ/isp/sampler.php? naicscode=4481&naicslevel=4#.
U.S. Census Bureau. (2015h). 2012 NAICS definition: Retail Trade: General
merchandise stores. Retrieved September 27, 2015, from North American
Industry Classification System: http://www.census.gov/econ/isp/sampler.php?
naicscode=452&naicslevel=3#.
U.S. Census Bureau. (2015i). Monthly and Annual Wholesale Trade. Retrieved
September 27, 2015, from Business & Industry: www2.census.gov/wholesale/xls/
awts/2013_awts_sales_table1 .xls.
U.S. Census Bureau. (2015j). 2012 NAICS definition: Wholesale trade: Merchant
wholeslers, nondurable goods stores. Retrieved September 27, 2015, from North
American Industry Classification System:
http://www.census.gov/econ/isp/sampler.php? naicscode=424&naicslevel =3#.
U.S. Census Bureau. (2015k). 2012 NAICS definition: Wholesale trade: Merchant
wholesalers, nondurable goods stores: Apparel, piece goods, and notions
merchant wholesalers. Retrieved September 27, 2015, from North American

86
Industry Classification System: http://www.census.gov/econ/isp/sampler.
php?naicscode=4243&naicslevel=4#.
U.S. Census Bureau (2015l). Census Govt. Business & Industry. Wholesale. Monthly &
Annual. How Surveys are collected: Monthly Methodology. Washington, DC:
U.S. Department of Commerce. Retrieved December 11, 2015, from
http://www.census.gov/wholesale/www/
how_surveys_are_collected/monthly_methodology.html.
U.S. Census Bureau. (2015m). Census Govt. Business & Industry. Retail. Monthly &
Annual. About the Surveys: About the Monthly Retail Trade Survey. Washington,
DC: U.S. Department of Commerce. Retrieved December 11, 2015, from
http://www.census.gov/retail/mrts/ about_the_surveys.html.
U.S. Census Bureau. (2015n). Census Govt. Business & Industry. Retail. Monthly &
Annual. How the Data are collected: Monthly Retail Trade Survey Methodology.
Washington, DC: U.S. Department of Commerce. Retrieved November 15, 2015,
from http://www.census.gov/retail/mrts/how_surveys_are_collected.html.
U.S. Census Bureau (2015o). FAQs on Seasonal Adjustment. Washington, DC: U.S.
Department of Commerce. Retrieved January 05, 2016, from
http://www.census.gov/const/ www/faq2.html.
Wholesale.com (2015). Home. Retrieved January 23, 2016, from http://www.wholesale
central.com/.
World Meteorological Organization (2013). WMO statement on the status of the global
climate in 2012. Report 1108: World Meteorological Organization.
87
APPENDIX A:
Regression Analysis of Monthly Apparel Retail Sales on Weather

88
Table A1:
Regression analysis of monthly apparel retail sales on monthly average temperature
Month Variables t value p-value R2 F Sig.
January Constant 3438.166 0.847 0.407 0.892 54.817 0.001
GDP 0.504 2.329 0.03
Population -5.899E-06 -0.271 0.789
AvgTemp -2.216 -0.063 0.951
February Constant -2274.393 -0.651 0.523 0.945 114.556 0.001
GDP 0.357 2.028 0.056
Population 1.924E-05 1.056 0.303
AvgTemp 24.319 0.927 0.365
March Constant 1905.158 0.492 0.628 0.939 103.081 0.001
GDP 0.744 3.498 0.002
Population -1.163E-05 -0.541 0.594
AvgTemp 57.794 1.873 0.076
April Constant 1405.870 0.334 0.742 0.927 84.209 0.001
GDP 0.625 2.970 0.008
Population -1.469E-05 -0.687 0.500
AvgTemp 105.049 2.385 0.027
May Constant 2763.907 0.600 0.555 0.949 123.224 0.001
GDP 0.636 3.306 0.004
Population -7.604E-06 -0.388 0.702
AvgTemp 36.246 0.752 0.461
June Constant 6519.626 1.251 0.225 0.924 80.71 0.001
GDP 0.836 4.216 0.000
Population -3.978E-05 -1.949 0.065
AvgTemp 65.691 0.979 0.339
July Constant 13862.121 2.383 0.027 0.942 108.291 0.001
GDP 0.837 4.125 0.001
Population -3.057E-05 -1.513 0.146
AvgTemp -72.589 -1.316 0.203
August Constant 15024.155 3.188 0.005 0.932 91.695 0.001
GDP 0.845 4.716 0.000
Population -4.05E-05 -2.222 0.038
AvgTemp -37.038 -0.788 0.44
September Constant 18933.903 3.596 0.002 0.850 37.819 0.001
GDP 0.710 3.095 0.006
Population -3.190E-05 -1.360 0.189
AvgTemp -127.485 -2.15 0.044
October Constant 11712.957 2.273 0.034 0.876 47.227 0.001
GDP 0.749 3.220 0.004
Population -3.582E-05 -1.518 0.145
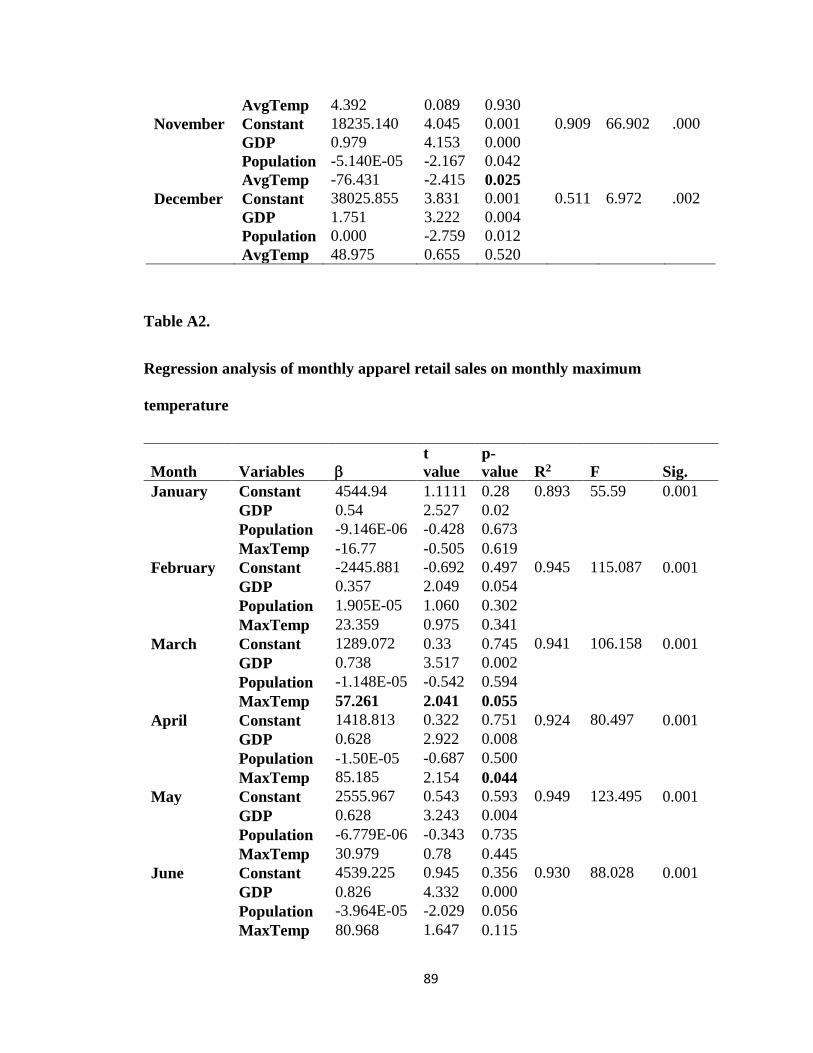
89
AvgTemp 4.392 0.089 0.930
November Constant 18235.140 4.045 0.001 0.909 66.902 .000
GDP 0.979 4.153 0.000
Population -5.140E-05 -2.167 0.042
AvgTemp -76.431 -2.415 0.025
December Constant 38025.855 3.831 0.001 0.511 6.972 .002
GDP 1.751 3.222 0.004
Population 0.000 -2.759 0.012
AvgTemp 48.975 0.655 0.520
Table A2.
Regression analysis of monthly apparel retail sales on monthly maximum
temperature
Month Variables
t
value
p-
value R2 F Sig.
January Constant 4544.94 1.1111 0.28 0.893 55.59 0.001
GDP 0.54 2.527 0.02
Population -9.146E-06 -0.428 0.673
MaxTemp -16.77 -0.505 0.619
February Constant -2445.881 -0.692 0.497 0.945 115.087 0.001
GDP 0.357 2.049 0.054
Population 1.905E-05 1.060 0.302
MaxTemp 23.359 0.975 0.341
March Constant 1289.072 0.33 0.745 0.941 106.158 0.001
GDP 0.738 3.517 0.002
Population -1.148E-05 -0.542 0.594
MaxTemp 57.261 2.041 0.055
April Constant 1418.813 0.322 0.751 0.924 80.497 0.001
GDP 0.628 2.922 0.008
Population -1.50E-05 -0.687 0.500
MaxTemp 85.185 2.154 0.044
May Constant 2555.967 0.543 0.593 0.949 123.495 0.001
GDP 0.628 3.243 0.004
Population -6.779E-06 -0.343 0.735
MaxTemp 30.979 0.78 0.445
June Constant 4539.225 0.945 0.356 0.930 88.028 0.001
GDP 0.826 4.332 0.000
Population -3.964E-05 -2.029 0.056
MaxTemp 80.968 1.647 0.115

90
July Constant 15841.823 2.842 0.010 0.946 116.330 0.001
GDP 0.879 4.436 0.000
Population -3.45E-05 -1.745 0.096
MaxTemp -78.177 -1.804 0.086
August Constant 14624.459 3.126 0.005 0.932 90.994 0.001
GDP 0.840 4.684 0.000
Population -4.018E-05 -2.198 0.040
MaxTemp -27.229 -0.689 0.499
Septembe
r Constant 17132.675 2.856 0.010 0.831 32.751
0.001
GDP 0.714 2.923 0.008
Population -3.398E-05 -1.363 0.188
MaxTemp -76.816 -1.348 0.193
October Constant 13738.443 2.757 0.012 0.878 47.941 .000
GDP 0.785 3.421 0.003
Population -3.924E-05 -1.676 0.109
MaxTemp -18.976 -0.522 0.607
November Constant 17023.866 3.691 0.001 0.902 61.435 .000
GDP 0.934 3.842 0.001
Population -4.671E-05 -1.916 0.070
MaxTemp -52.769 -1.978 0.062
December Constant 37285.873 3.419 0.003 0.509 6.902 .002
GDP 1.721 3.053 0.006
Population 0.000 -2.611 0.017
MaxTemp 43.159 0.569 0.576
Table A3.
Regression analysis of monthly apparel retail sales on monthly minimum
temperature
Month Variables
t
value
p-
value R2 F Sig.
January Constant 2446.163 0.631 0.535 0.892 55.296 0.001
GDP 0.466 2.175 0.042
Population -2.002E-06 -0.092 0.928
MinTemp 13.583 0.4 0.694
February Constant -1741.829 -0.522 0.608 0.944 113.146 0.001
GDP 0.367 2.082 0.050
Population 1.816E-05 0.994 0.332
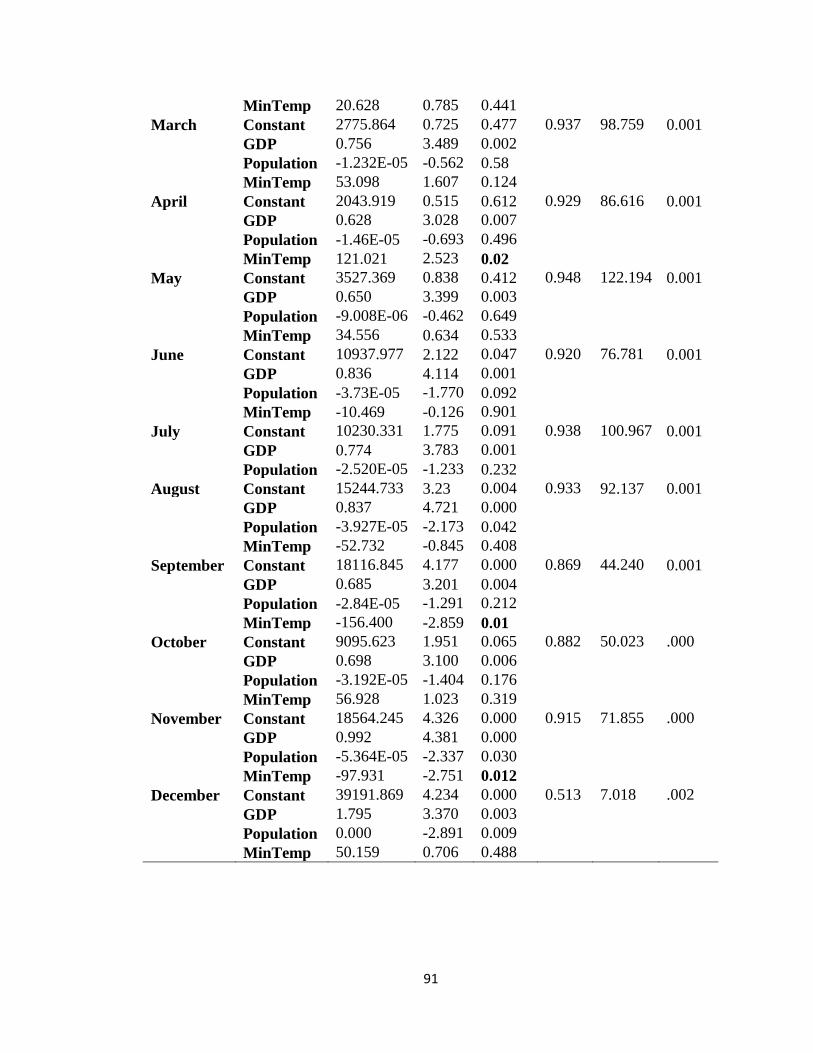
91
MinTemp 20.628 0.785 0.441
March Constant 2775.864 0.725 0.477 0.937 98.759 0.001
GDP 0.756 3.489 0.002
Population -1.232E-05 -0.562 0.58
MinTemp 53.098 1.607 0.124
April Constant 2043.919 0.515 0.612 0.929 86.616 0.001
GDP 0.628 3.028 0.007
Population -1.46E-05 -0.693 0.496
MinTemp 121.021 2.523 0.02
May Constant 3527.369 0.838 0.412 0.948 122.194 0.001
GDP 0.650 3.399 0.003
Population -9.008E-06 -0.462 0.649
MinTemp 34.556 0.634 0.533
June Constant 10937.977 2.122 0.047 0.920 76.781 0.001
GDP 0.836 4.114 0.001
Population -3.73E-05 -1.770 0.092
MinTemp -10.469 -0.126 0.901
July Constant 10230.331 1.775 0.091 0.938 100.967 0.001
GDP 0.774 3.783 0.001
Population -2.520E-05 -1.233 0.232
August Constant 15244.733 3.23 0.004 0.933 92.137 0.001
GDP 0.837 4.721 0.000
Population -3.927E-05 -2.173 0.042
MinTemp -52.732 -0.845 0.408
September Constant 18116.845 4.177 0.000 0.869 44.240 0.001
GDP 0.685 3.201 0.004
Population -2.84E-05 -1.291 0.212
MinTemp -156.400 -2.859 0.01
October Constant 9095.623 1.951 0.065 0.882 50.023 .000
GDP 0.698 3.100 0.006
Population -3.192E-05 -1.404 0.176
MinTemp 56.928 1.023 0.319
November Constant 18564.245 4.326 0.000 0.915 71.855 .000
GDP 0.992 4.381 0.000
Population -5.364E-05 -2.337 0.030
MinTemp -97.931 -2.751 0.012
December Constant 39191.869 4.234 0.000 0.513 7.018 .002
GDP 1.795 3.370 0.003
Population 0.000 -2.891 0.009
MinTemp 50.159 0.706 0.488
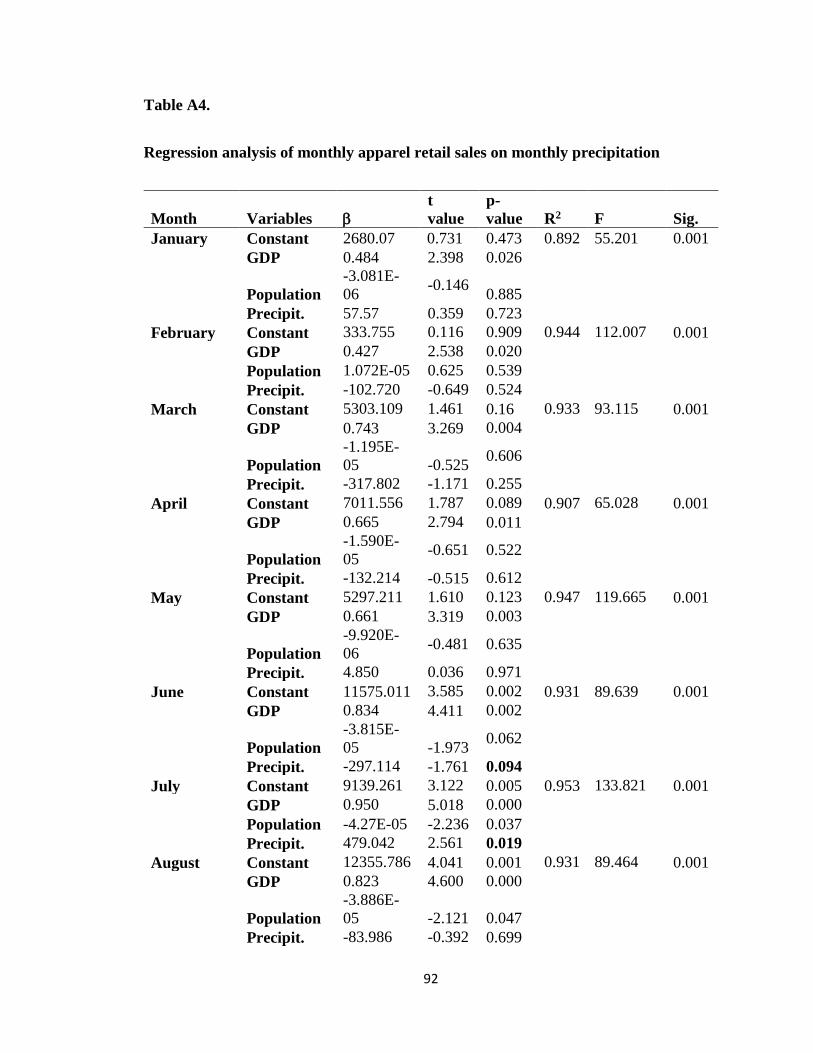
92
Table A4.
Regression analysis of monthly apparel retail sales on monthly precipitation
Month Variables
t
value
p-
value R2 F Sig.
January Constant 2680.07 0.731 0.473 0.892 55.201 0.001
GDP 0.484 2.398 0.026
Population
-3.081E-
06 -0.146
0.885
Precipit. 57.57 0.359 0.723
February Constant 333.755 0.116 0.909 0.944 112.007 0.001
GDP 0.427 2.538 0.020
Population 1.072E-05 0.625 0.539
Precipit. -102.720 -0.649 0.524
March Constant 5303.109 1.461 0.16 0.933 93.115 0.001
GDP 0.743 3.269 0.004
Population
-1.195E-
05 -0.525 0.606
Precipit. -317.802 -1.171 0.255
April Constant 7011.556 1.787 0.089 0.907 65.028 0.001
GDP 0.665 2.794 0.011
Population
-1.590E-
05 -0.651 0.522
Precipit. -132.214 -0.515 0.612
May Constant 5297.211 1.610 0.123 0.947 119.665 0.001
GDP 0.661 3.319 0.003
Population
-9.920E-
06 -0.481 0.635
Precipit. 4.850 0.036 0.971
June Constant 11575.011 3.585 0.002 0.931 89.639 0.001
GDP 0.834 4.411 0.002
Population
-3.815E-
05 -1.973 0.062
Precipit. -297.114 -1.761 0.094
July Constant 9139.261 3.122 0.005 0.953 133.821 0.001
GDP 0.950 5.018 0.000
Population -4.27E-05 -2.236 0.037
Precipit. 479.042 2.561 0.019
August Constant 12355.786 4.041 0.001 0.931 89.464 0.001
GDP 0.823 4.600 0.000
Population
-3.886E-
05 -2.121 0.047
Precipit. -83.986 -0.392 0.699

93
September Constant 11520.551 2.830 0.01 0.834 33.380 0.001
GDP 0.649 2.678 0.014
Population -2.94E-05 -1.185 0.250
Precipit. -353.191 -1.471 0.157
October Constant 12041.868 3.206 0.004 0.877 47.706 .000
GDP 0.760 3.412 0.003
Population
-3.712E-
05 -1.623 0.120
Precipitat. 56.958 0.431 0.671
November Constant 11620.595 2.837 0.010 0.884 50.881 .000
GDP 0.752 3.090 0.006
Population
-3.021E-
05 -1.217 0.238
Precipitat. 68.009 0.454 0.655
December Constant 39121.421 4.320 0.000 0.523 7.301 .002
GDP 1.729 3.232 0.004
Population 0.000 -2.650 0.015
Precipitat. -352.454 -0.960 0.348

94
APPENDIX B:
Regression Analysis of Monthly Apparel Wholesale Sales on Weather
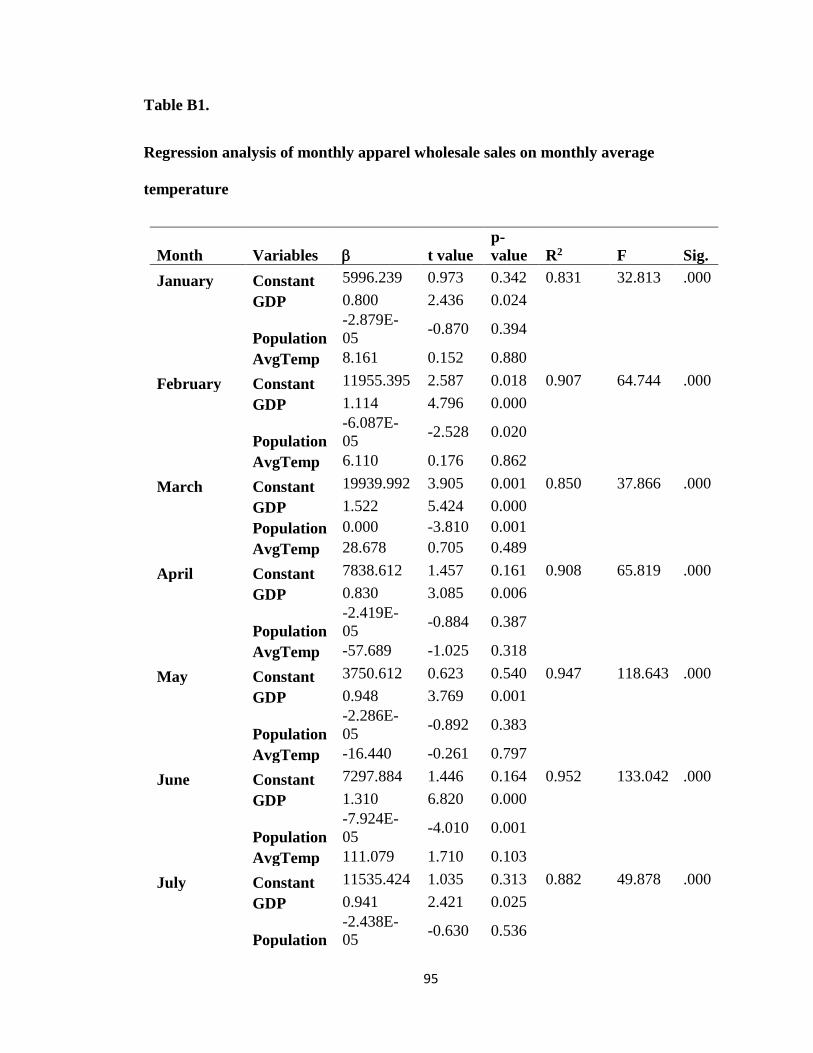
95
Table B1.
Regression analysis of monthly apparel wholesale sales on monthly average
temperature
Month Variables t value
p-
value R2 F Sig.
January Constant 5996.239 0.973 0.342 0.831 32.813 .000
GDP 0.800 2.436 0.024
Population
-2.879E-
05 -0.870 0.394
AvgTemp 8.161 0.152 0.880
February Constant 11955.395 2.587 0.018 0.907 64.744 .000
GDP 1.114 4.796 0.000
Population
-6.087E-
05 -2.528 0.020
AvgTemp 6.110 0.176 0.862
March Constant 19939.992 3.905 0.001 0.850 37.866 .000
GDP 1.522 5.424 0.000
Population 0.000 -3.810 0.001
AvgTemp 28.678 0.705 0.489
April Constant 7838.612 1.457 0.161 0.908 65.819 .000
GDP 0.830 3.085 0.006
Population
-2.419E-
05 -0.884 0.387
AvgTemp -57.689 -1.025 0.318
May Constant 3750.612 0.623 0.540 0.947 118.643 .000
GDP 0.948 3.769 0.001
Population
-2.286E-
05 -0.892 0.383
AvgTemp -16.440 -0.261 0.797
June Constant 7297.884 1.446 0.164 0.952 133.042 .000
GDP 1.310 6.820 0.000
Population
-7.924E-
05 -4.010 0.001
AvgTemp 111.079 1.710 0.103
July Constant 11535.424 1.035 0.313 0.882 49.878 .000
GDP 0.941 2.421 0.025
Population
-2.438E-
05 -0.630 0.536

96
AvgTemp -94.628 -0.896 0.381
August Constant 1526.587 0.186 0.854 0.907 64.956 .000
GDP 0.756 2.422 0.025
Population
-1.038E-
05 -0.327 0.747
AvgTemp 30.423 0.372 0.714
September Constant 2633.033 0.273 0.787 0.827 31.945 .000
GDP 0.736 1.756 0.094
Population
-1.177E-
05 -0.274 0.787
AvgTemp 23.063 0.213 0.834
October Constant
-
10599.293 -1.115 0.278 0.874 46.395 .000
GDP 0.454 1.058 0.303
Population 2.669E-05 0.614 0.546
AvgTemp 144.444 1.580 0.130
November Constant 4992.760 0.630 0.536 0.884 50.756 .000
GDP 0.853 2.058 0.053
Population
-1.245E-
05 -0.299 0.768
AvgTemp -70.711 -1.271 0.218
December Constant -7779.560 -0.919 0.369 0.833 33.272 .000
GDP 0.488 1.052 0.305
Population 1.830E-05 0.387 0.703
AvgTemp 121.693 1.908 0.071
Table B2.
Regression analysis of monthly apparel wholesale sales on monthly maximum
temperature
Month Variables t value p-value R2 F Sig.
January Constant 6517.112 1.042 0.310 0.831 32.767 .000
GDP 0.818 2.508 0.021
Population -3.060E-05 -0.938 0.360
MaxTemp 0.496 0.010 0.992
February Constant 13238.851 2.830 0.010 0.907 64.868 .000
GDP 1.148 4.978 0.000

97
Population -6.480E-05 -2.725 0.013
MaxTemp -8.139 -0.257 0.800
March Constant 19743.282 3.784 0.001 0.850 37.897 .000
GDP 1.521 5.420 0.000
Population 0.000 -3.818 0.001
MaxTemp 26.802 0.715 0.483
April Constant 8393.089 1.527 0.142 0.909 66.541 .000
GDP 0.834 3.114 0.005
Population -2.432E-05 -0.893 0.382
MaxTemp -55.293 -1.122 0.275
May Constant 701.837 0.114 0.910 0.947 119.321 .000
GDP 0.915 3.620 0.002
Population -1.986E-05 -0.770 0.450
MaxTemp 21.797 0.420 0.679
June Constant 8399.187 1.711 0.103 0.951 129.161 .000
GDP 1.301 6.674 0.000
Population -7.752E-05 -3.882 0.001
MaxTemp 75.966 1.512 0.146
July Constant 12665.912 1.155 0.262 0.884 50.617 .000
GDP 0.971 2.490 0.022
Population -2.738E-05 -0.704 0.489
MaxTemp -88.445 -1.037 0.312
August Constant 1643.613 0.203 0.842 0.907 64.925 .000
GDP 0.758 2.436 0.024
Population -1.054E-05 -0.332 0.743
MaxTemp 24.685 0.360 0.723
September Constant 6456.665 0.626 0.538 0.828 32.058 .000
GDP 0.754 1.796 0.088
Population -1.195E-05 -0.279 0.783
MaxTemp -31.634 -0.323 0.750
October Constant -8241.979 -0.874 0.393 0.869 44.288 .000
GDP 0.502 1.154 0.262
Population 2.345E-05 0.529 0.603
MaxTemp 87.165 1.267 0.220
November Constant 3472.298 0.438 0.666 0.880 49.007 .000
GDP 0.796 1.907 0.071
Population -6.809E-06 -0.163 0.872
MaxTemp -44.830 -0.978 0.340
December Constant -8624.120 -0.897 0.380 0.821 30.529 .000
GDP 0.441 0.888 0.385
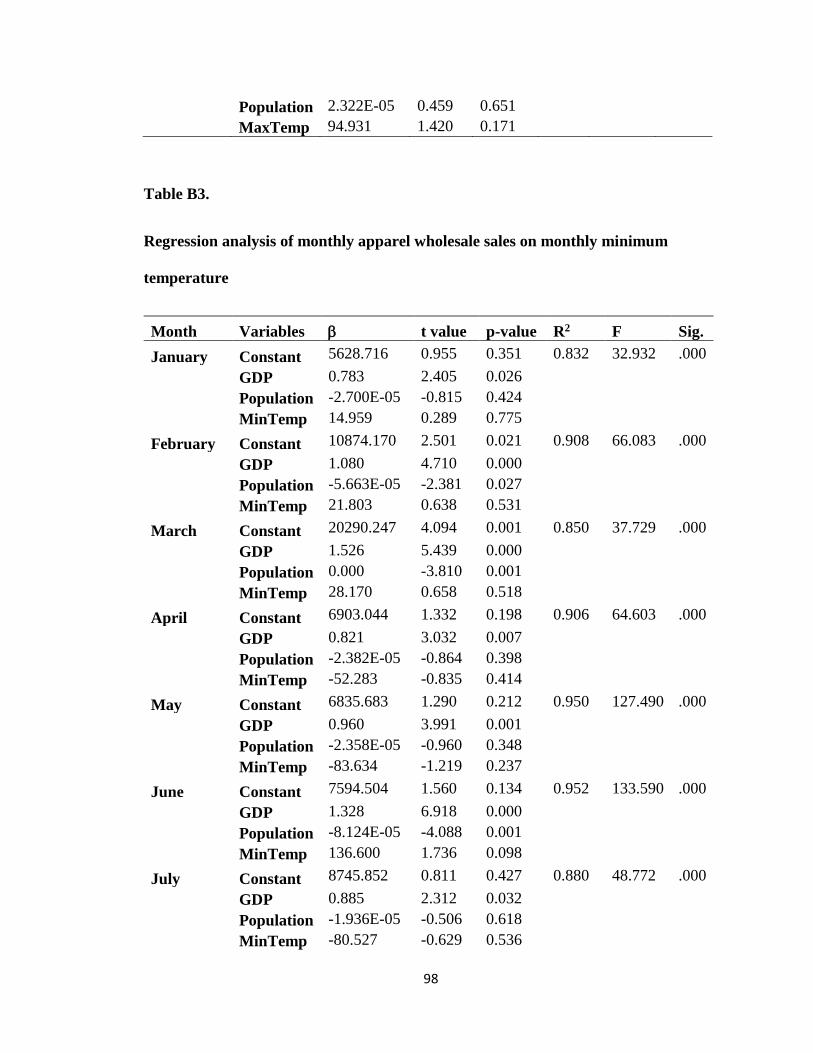
98
Population 2.322E-05 0.459 0.651
MaxTemp 94.931 1.420 0.171
Table B3.
Regression analysis of monthly apparel wholesale sales on monthly minimum
temperature
Month Variables t value p-value R2 F Sig.
January Constant 5628.716 0.955 0.351 0.832 32.932 .000
GDP 0.783 2.405 0.026
Population -2.700E-05 -0.815 0.424
MinTemp 14.959 0.289 0.775
February Constant 10874.170 2.501 0.021 0.908 66.083 .000
GDP 1.080 4.710 0.000
Population -5.663E-05 -2.381 0.027
MinTemp 21.803 0.638 0.531
March Constant 20290.247 4.094 0.001 0.850 37.729 .000
GDP 1.526 5.439 0.000
Population 0.000 -3.810 0.001
MinTemp 28.170 0.658 0.518
April Constant 6903.044 1.332 0.198 0.906 64.603 .000
GDP 0.821 3.032 0.007
Population -2.382E-05 -0.864 0.398
MinTemp -52.283 -0.835 0.414
May Constant 6835.683 1.290 0.212 0.950 127.490 .000
GDP 0.960 3.991 0.001
Population -2.358E-05 -0.960 0.348
MinTemp -83.634 -1.219 0.237
June Constant 7594.504 1.560 0.134 0.952 133.590 .000
GDP 1.328 6.918 0.000
Population -8.124E-05 -4.088 0.001
MinTemp 136.600 1.736 0.098
July Constant 8745.852 0.811 0.427 0.880 48.772 .000
GDP 0.885 2.312 0.032
Population -1.936E-05 -0.506 0.618
MinTemp -80.527 -0.629 0.536
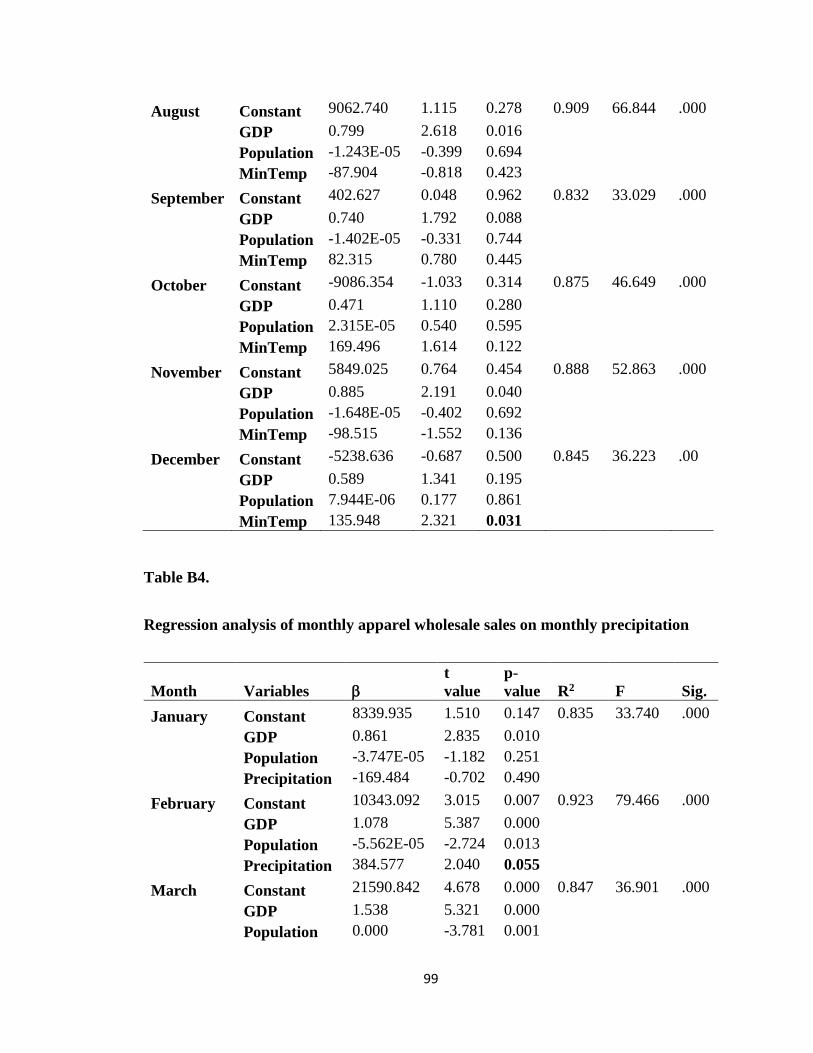
99
August Constant 9062.740 1.115 0.278 0.909 66.844 .000
GDP 0.799 2.618 0.016
Population -1.243E-05 -0.399 0.694
MinTemp -87.904 -0.818 0.423
September Constant 402.627 0.048 0.962 0.832 33.029 .000
GDP 0.740 1.792 0.088
Population -1.402E-05 -0.331 0.744
MinTemp 82.315 0.780 0.445
October Constant -9086.354 -1.033 0.314 0.875 46.649 .000
GDP 0.471 1.110 0.280
Population 2.315E-05 0.540 0.595
MinTemp 169.496 1.614 0.122
November Constant 5849.025 0.764 0.454 0.888 52.863 .000
GDP 0.885 2.191 0.040
Population -1.648E-05 -0.402 0.692
MinTemp -98.515 -1.552 0.136
December Constant -5238.636 -0.687 0.500 0.845 36.223 .00
GDP 0.589 1.341 0.195
Population 7.944E-06 0.177 0.861
MinTemp 135.948 2.321 0.031
Table B4.
Regression analysis of monthly apparel wholesale sales on monthly precipitation
Month Variables
t
value
p-
value R2 F Sig.
January Constant 8339.935 1.510 0.147 0.835 33.740 .000
GDP 0.861 2.835 0.010
Population -3.747E-05 -1.182 0.251
Precipitation -169.484 -0.702 0.490
February Constant 10343.092 3.015 0.007 0.923 79.466 .000
GDP 1.078 5.387 0.000
Population -5.562E-05 -2.724 0.013
Precipitation 384.577 2.040 0.055
March Constant 21590.842 4.678 0.000 0.847 36.901 .000
GDP 1.538 5.321 0.000
Population 0.000 -3.781 0.001
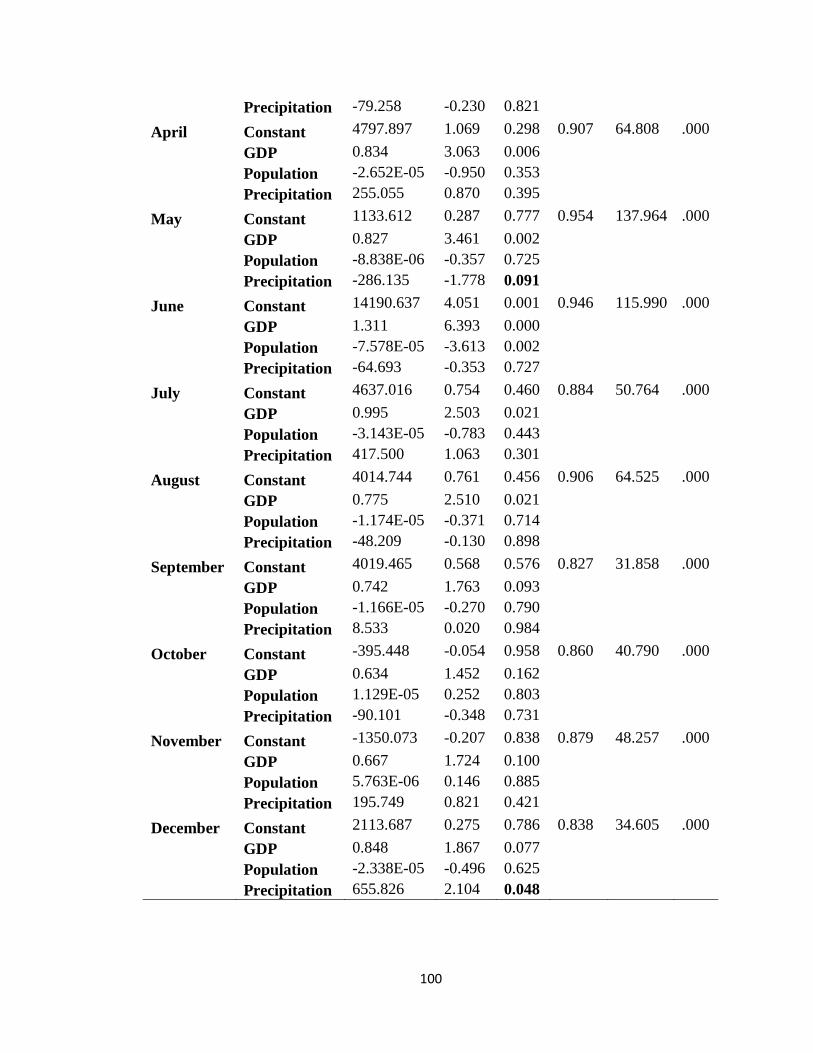
100
Precipitation -79.258 -0.230 0.821
April Constant 4797.897 1.069 0.298 0.907 64.808 .000
GDP 0.834 3.063 0.006
Population -2.652E-05 -0.950 0.353
Precipitation 255.055 0.870 0.395
May Constant 1133.612 0.287 0.777 0.954 137.964 .000
GDP 0.827 3.461 0.002
Population -8.838E-06 -0.357 0.725
Precipitation -286.135 -1.778 0.091
June Constant 14190.637 4.051 0.001 0.946 115.990 .000
GDP 1.311 6.393 0.000
Population -7.578E-05 -3.613 0.002
Precipitation -64.693 -0.353 0.727
July Constant 4637.016 0.754 0.460 0.884 50.764 .000
GDP 0.995 2.503 0.021
Population -3.143E-05 -0.783 0.443
Precipitation 417.500 1.063 0.301
August Constant 4014.744 0.761 0.456 0.906 64.525 .000
GDP 0.775 2.510 0.021
Population -1.174E-05 -0.371 0.714
Precipitation -48.209 -0.130 0.898
September Constant 4019.465 0.568 0.576 0.827 31.858 .000
GDP 0.742 1.763 0.093
Population -1.166E-05 -0.270 0.790
Precipitation 8.533 0.020 0.984
October Constant -395.448 -0.054 0.958 0.860 40.790 .000
GDP 0.634 1.452 0.162
Population 1.129E-05 0.252 0.803
Precipitation -90.101 -0.348 0.731
November Constant -1350.073 -0.207 0.838 0.879 48.257 .000
GDP 0.667 1.724 0.100
Population 5.763E-06 0.146 0.885
Precipitation 195.749 0.821 0.421
December Constant 2113.687 0.275 0.786 0.838 34.605 .000
GDP 0.848 1.867 0.077
Population -2.338E-05 -0.496 0.625
Precipitation 655.826 2.104 0.048

101
APPENDIX C:
Regression Analysis of Monthly Weather on Interaction of Monthly Apparel Retail
and Wholesale sales.

102
Table C1.
Regression analysis of monthly average temperature on interaction of monthly
apparel retail and wholesale sales.
Month Variables
t
value
p-
value R2 F Sig.
January Constant 4071.804 0.381 0.708 0.898 31.625 .000
GDP 0.380 1.508 0.149
Population -1.804E-06 -0.079 0.938
Wholesale Sales -0.012 -0.011 0.991
AvgTemp -51.288 -0.171 0.867
Wholesale.Avg 0.005 0.160 0.875
February Constant 3992.934 0.569 0.577 0.948 65.814 .000
GDP 0.386 1.457 0.162
Population 1.895E-05 0.879 0.391
Wholesale Sales -0.747 -1.043 0.311
AvgTemp -153.334 -0.860 0.401
Wholesale.Avg 0.020 1.010 0.326
March Constant 2742.399 0.203 0.841 0.940 56.026 .000
GDP 0.836 2.325 0.032
Population -1.816E-05 -0.600 0.556
Wholesale Sales -0.024 -0.018 0.985
AvgTemp 68.009 0.216 0.831
Wholesale.Avg -0.001 -0.027 0.979
April Constant -2410.542 -0.135 0.894 0.936 52.352 .000
GDP 0.833 3.258 0.004
Population -1.980E-05 -0.903 0.378
Wholesale Sales 0.383 0.199 0.844
AvgTemp 200.115 0.611 0.549
Wholesale.Avg -0.013 -0.341 0.737
May Constant -1251.097 -0.061 0.952 0.950 67.920 .000
GDP 0.537 2.041 0.056
Population -5.117E-06 -0.245 0.809
Wholesale Sales 0.510 0.228 0.822
AvgTemp 97.344 0.297 0.770
Wholesale.Avg -0.007 -0.183 0.856
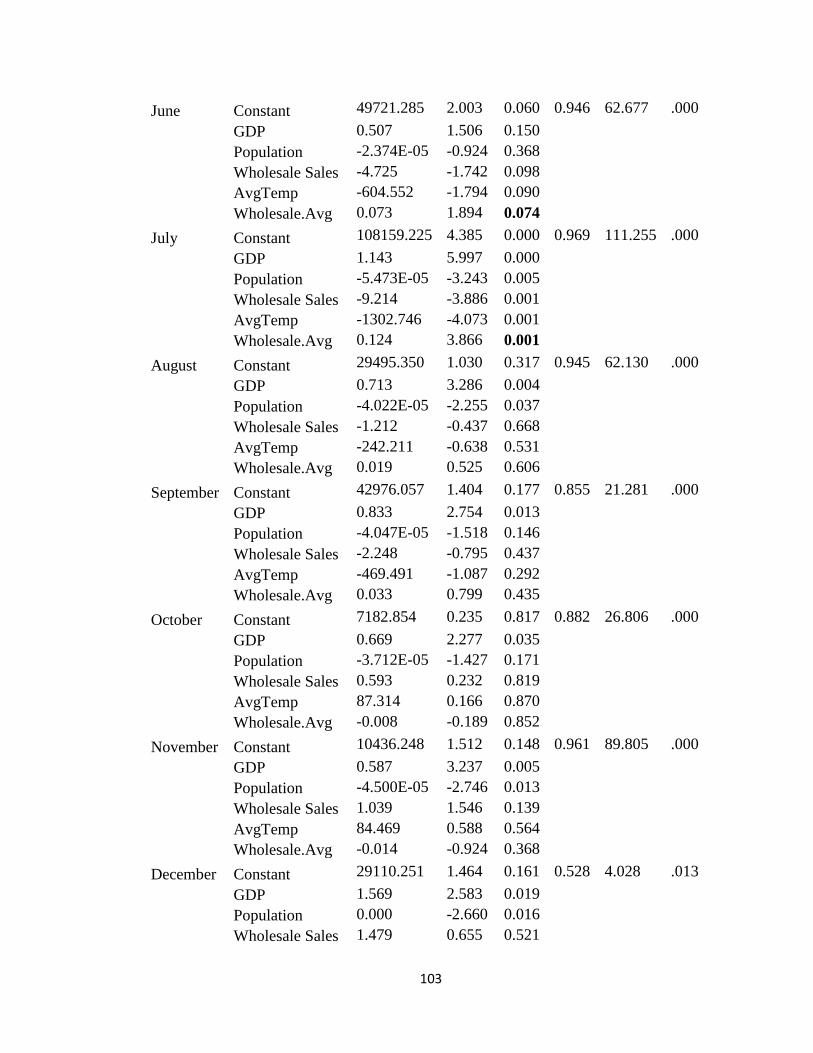
103
June Constant 49721.285 2.003 0.060 0.946 62.677 .000
GDP 0.507 1.506 0.150
Population -2.374E-05 -0.924 0.368
Wholesale Sales -4.725 -1.742 0.098
AvgTemp -604.552 -1.794 0.090
Wholesale.Avg 0.073 1.894 0.074
July Constant 108159.225 4.385 0.000 0.969 111.255 .000
GDP 1.143 5.997 0.000
Population -5.473E-05 -3.243 0.005
Wholesale Sales -9.214 -3.886 0.001
AvgTemp -1302.746 -4.073 0.001
Wholesale.Avg 0.124 3.866 0.001
August Constant 29495.350 1.030 0.317 0.945 62.130 .000
GDP 0.713 3.286 0.004
Population -4.022E-05 -2.255 0.037
Wholesale Sales -1.212 -0.437 0.668
AvgTemp -242.211 -0.638 0.531
Wholesale.Avg 0.019 0.525 0.606
September Constant 42976.057 1.404 0.177 0.855 21.281 .000
GDP 0.833 2.754 0.013
Population -4.047E-05 -1.518 0.146
Wholesale Sales -2.248 -0.795 0.437
AvgTemp -469.491 -1.087 0.292
Wholesale.Avg 0.033 0.799 0.435
October Constant 7182.854 0.235 0.817 0.882 26.806 .000
GDP 0.669 2.277 0.035
Population -3.712E-05 -1.427 0.171
Wholesale Sales 0.593 0.232 0.819
AvgTemp 87.314 0.166 0.870
Wholesale.Avg -0.008 -0.189 0.852
November Constant 10436.248 1.512 0.148 0.961 89.805 .000
GDP 0.587 3.237 0.005
Population -4.500E-05 -2.746 0.013
Wholesale Sales 1.039 1.546 0.139
AvgTemp 84.469 0.588 0.564
Wholesale.Avg -0.014 -0.924 0.368
December Constant 29110.251 1.464 0.161 0.528 4.028 .013
GDP 1.569 2.583 0.019
Population 0.000 -2.660 0.016
Wholesale Sales 1.479 0.655 0.521

104
AvgTemp 312.368 0.651 0.523
Wholesale.Avg -0.034 -0.595 0.559
Table C2.
Regression analysis of monthly maximum temperature on interaction of monthly
apparel retail and wholesale sales.
Month Variables
t
value
p-
value R2 F Sig.
January Constant 12418.844 0.816 0.425 0.901 32.770 .000
GDP 0.448 1.757 0.096
Population -8.444E-06 -0.366 0.719
Wholesale Sales -0.766 -0.503 0.621
MaxTemp -214.354 -0.657 0.520
Wholesale.Max 0.022 0.608 0.551
February Constant 5415.096 0.643 0.528 0.948 66.131 .000
GDP 0.377 1.409 0.176
Population 1.889E-05 0.874 0.394
Wholesale Sales -0.913 -1.044 0.310
MaxTemp -147.793 -0.881 0.390
Wholesale.Max 0.019 1.030 0.316
March Constant 2218.937 0.139 0.891 0.941 57.768 .000
GDP 0.836 2.374 0.029
Population -1.844E-05 -0.621 0.542
Wholesale Sales -0.031 -0.020 0.984
MaxTemp 65.225 0.223 0.826
Wholesale.Max -0.001 -0.021 0.983
April Constant 5690.271 0.288 0.777 0.932 49.510 .000
GDP 0.857 3.259 0.004
Population -2.202E-05 -0.979 0.341
Wholesale Sales -0.493 -0.230 0.821
MaxTemp 40.056 0.137 0.893
Wholesale.Max 0.003 0.104 0.918
May Constant -4660.636 -0.260 0.798 0.950 68.174 .000
GDP 0.549 2.109 0.049
Population -5.032E-06 -0.241 0.812
Wholesale Sales 0.902 0.455 0.655
MaxTemp 126.720 0.532 0.602
Wholesale.Max -0.011 -0.415 0.683
June Constant 61649.277 2.874 0.010 0.958 81.293 .000
GDP 0.581 2.007 0.060

105
Population -2.838E-05 -1.299 0.210
Wholesale Sales -6.297 -2.696 0.015
MaxTemp -645.439 -2.592 0.018
Wholesale.Max 0.080 2.853 0.011
July Constant 92741.669 4.562 0.000 0.971 119.404 .000
GDP 1.135 6.227 0.000
Population -5.234E-05 -3.264 0.004
Wholesale Sales -7.630 -3.864 0.001
MaxTemp -938.942 -4.161 0.001
Wholesale.Max 0.087 3.832 0.001
August Constant 25215.019 0.904 0.378 0.944 60.994 .000
GDP 0.697 3.188 0.005
Population -3.953E-05 -2.185 0.042
Wholesale Sales -0.807 -0.307 0.763
MaxTemp -157.500 -0.502 0.622
Wholesale.Max 0.012 0.399 0.694
September Constant 41138.054 1.220 0.238 0.836 18.318 .000
GDP 0.830 2.688 0.015
Population -4.130E-05 -1.488 0.154
Wholesale Sales -2.254 -0.726 0.477
MaxTemp -365.372 -0.905 0.377
Wholesale.Max 0.028 0.721 0.480
October Constant 16818.417 0.579 0.570 0.885 27.692 .000
GDP 0.731 2.679 0.015
Population -4.273E-05 -1.696 0.107
Wholesale Sales -0.051 -0.020 0.984
MaxTemp -58.960 -0.144 0.887
Wholesale.Max 0.003 0.071 0.944
November Constant 11968.561 1.590 0.129 0.958 82.928 .000
GDP 0.571 3.117 0.006
Population -4.339E-05 -2.586 0.019
Wholesale Sales 0.833 1.087 0.292
MaxTemp 32.789 0.255 0.802
Wholesale.Max -0.007 -0.518 0.611
December Constant 34430.974 1.327 0.201 0.519 3.886 .015
GDP 1.613 2.547 0.020
Population 0.000 -2.535 0.021
Wholesale Sales 0.715 0.233 0.819
MaxTemp 121.058 0.234 0.818
Wholesale.Max -0.011 -0.182 0.858

106
Table C3.
Regression analysis of monthly minimum temperature on interaction of monthly
apparel retail and wholesale sales.
Month Variables
t
value
p-
value R2 F Sig.
January Constant 1113.139 0.176 0.862 0.898 31.780 .000
GDP 0.350 1.389 0.182
Population 1.944E-06 0.086 0.933
Wholesale Sales 0.208 0.354 0.727
MinTemp 34.931 0.143 0.888
Wholesale.Min -0.003 -0.098 0.923
February Constant 2228.670 0.405 0.690 0.947 64.191 .000
GDP 0.409 1.547 0.139
Population 1.712E-05 0.797 0.436
Wholesale Sales -0.480 -0.927 0.366
MinTemp -135.389 -0.737 0.471
Wholesale.Min 0.018 0.866 0.398
March Constant 4066.756 0.393 0.699 0.937 53.570 .000
GDP 0.829 2.250 0.037
Population -1.747E-05 -0.562 0.581
Wholesale Sales -0.080 -0.083 0.935
MinTemp 44.254 0.138 0.892
Wholesale.Min 0.001 0.032 0.975
April Constant -8818.421 -0.602 0.555 0.941 56.985 .000
GDP 0.821 3.368 0.003
Population -1.791E-05 -0.853 0.405
Wholesale Sales 1.109 0.721 0.480
MinTemp 420.632 1.202 0.245
Wholesale.Min -0.035 -0.906 0.377
May Constant 9052.206 0.442 0.663 0.950 68.335 .000
GDP 0.531 1.992 0.062
Population -6.394E-06 -0.308 0.761
Wholesale Sales -0.584 -0.262 0.796
MinTemp -86.175 -0.208 0.837
Wholesale.Min 0.015 0.322 0.751
June Constant 25407.166 1.083 0.293 0.940 56.077 .000
GDP 0.243 0.691 0.498

107
Population -2.728E-06 -0.101 0.921
Wholesale Sales -1.445 -0.590 0.562
MinTemp -382.884 -0.977 0.342
Wholesale.Min 0.034 0.795 0.437
July Constant 108411.088 3.384 0.003 0.960 85.761 .000
GDP 1.093 5.036 0.000
Population -5.348E-05 -2.724 0.014
Wholesale Sales -9.404 -3.103 0.006
MinTemp -1575.623 -3.158 0.005
Wholesale.Min 0.153 3.094 0.006
August Constant 15410.140 3.465 0.003 0.943 78.781 .000
GDP 0.659 3.434 0.003
Population -3.679E-05 -2.155 0.044
Wholesale Sales
MinTemp -68.706 -1.157 0.262
Wholesale.Min 0.004 1.883 0.075
September Constant 38691.535 1.550 0.139 0.875 25.277 .000
GDP 0.789 2.695 0.015
Population -3.691E-05 -1.463 0.161
Wholesale Sales -1.874 -0.814 0.426
MinTemp -516.941 -1.206 0.243
Wholesale.Min 0.035 0.838 0.413
October Constant -3090.773 -0.155 0.878 0.887 28.326 .000
GDP 0.583 2.166 0.044
Population -3.058E-05 -1.272 0.220
Wholesale Sales 1.198 0.704 0.490
MinTemp 334.810 0.761 0.457
Wholesale.Min -0.025 -0.665 0.515
November Constant 9482.742 1.672 0.112 0.964 97.223 .000
GDP 0.578 3.276 0.004
Population -4.464E-05 -2.818 0.011
Wholesale Sales 1.109 2.164 0.044
MinTemp 144.343 0.974 0.343
Wholesale.Min -0.021 -1.384 0.183
December Constant 29714.825 2.046 0.056 0.541 4.246 .010
GDP 1.574 2.675 0.015
Population 0.000 -2.806 0.012
Wholesale Sales 1.520 1.007 0.327
MinTemp 427.435 0.989 0.336
Wholesale.Min -0.047 -0.933 0.363
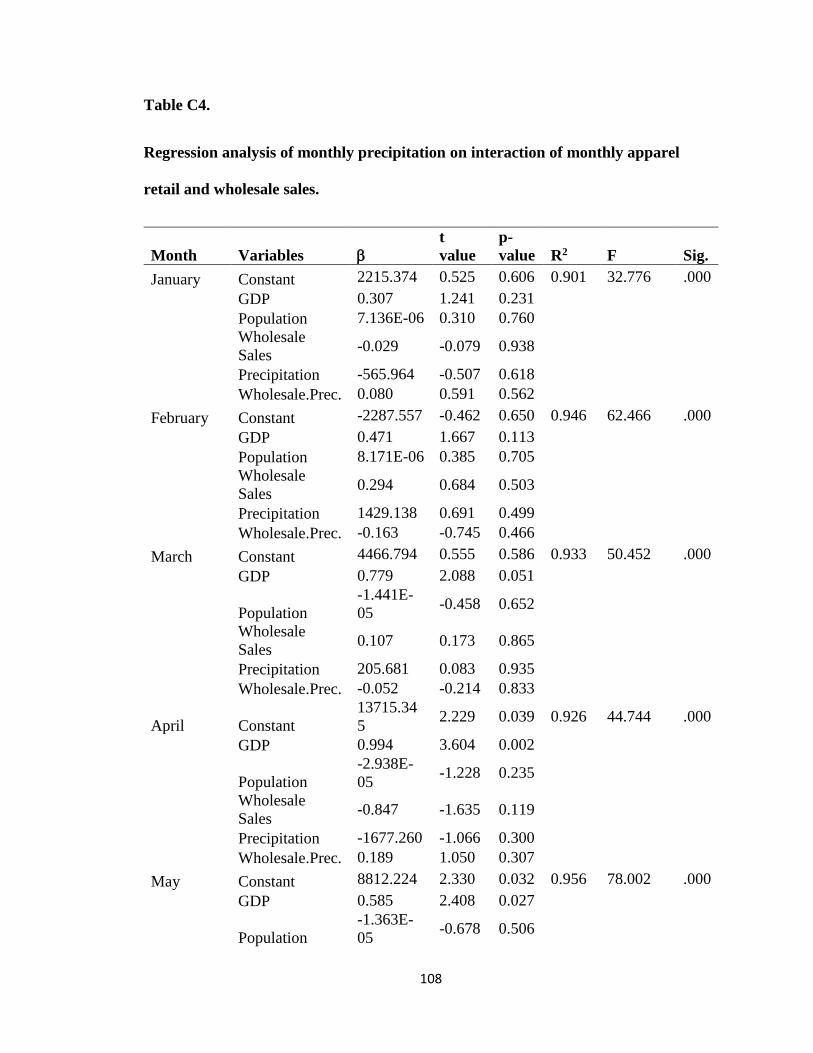
108
Table C4.
Regression analysis of monthly precipitation on interaction of monthly apparel
retail and wholesale sales.
Month Variables
t
value
p-
value R2 F Sig.
January Constant 2215.374 0.525 0.606 0.901 32.776 .000
GDP 0.307 1.241 0.231
Population 7.136E-06 0.310 0.760
Wholesale
Sales -0.029 -0.079 0.938
Precipitation -565.964 -0.507 0.618
Wholesale.Prec. 0.080 0.591 0.562
February Constant -2287.557 -0.462 0.650 0.946 62.466 .000
GDP 0.471 1.667 0.113
Population 8.171E-06 0.385 0.705
Wholesale
Sales 0.294 0.684 0.503
Precipitation 1429.138 0.691 0.499
Wholesale.Prec. -0.163 -0.745 0.466
March Constant 4466.794 0.555 0.586 0.933 50.452 .000
GDP 0.779 2.088 0.051
Population
-1.441E-
05 -0.458 0.652
Wholesale
Sales 0.107 0.173 0.865
Precipitation 205.681 0.083 0.935
Wholesale.Prec. -0.052 -0.214 0.833
April Constant
13715.34
5 2.229 0.039 0.926 44.744 .000
GDP 0.994 3.604 0.002
Population
-2.938E-
05 -1.228 0.235
Wholesale
Sales -0.847 -1.635 0.119
Precipitation -1677.260 -1.066 0.300
Wholesale.Prec. 0.189 1.050 0.307
May Constant 8812.224 2.330 0.032 0.956 78.002 .000
GDP 0.585 2.408 0.027
Population
-1.363E-
05 -0.678 0.506

109
Wholesale
Sales -0.187 -0.760 0.457
Precipitation -901.181 -1.650 0.116
Wholesale.Prec. 0.111 1.775 0.093
June Constant -3286.768 -0.610 0.550 0.957 79.230 .000
GDP 0.380 1.374 0.186
Population
-9.939E-
06 -0.478 0.638
Wholesale
Sales 1.290 3.063 0.007
Precipitation 2702.990 2.105 0.050
Wholesale.Prec. -0.301 -2.331 0.032
July Constant 3215.124 0.917 0.371 0.967 106.582 .000
GDP 1.161 5.949 0.000
Population
-5.384E-
05 -3.121 0.006
Wholesale
Sales 0.641 2.237 0.038
Precipitation 3049.551 3.188 0.005
Wholesale.Prec. -0.260 -2.691 0.015
August Constant
11978.58
3 2.291 0.034 0.942 58.293 .000
GDP 0.630 2.822 0.011
Population
-3.508E-
05 -1.796 0.089
Wholesale
Sales 0.170 0.341 0.737
Precipitation -349.469 -0.163 0.873
Wholesale.Prec. 0.025 0.129 0.898
September Constant
13671.02
2 2.116 0.049 0.835 18.262 .000
GDP 0.654 2.393 0.028
Population
-3.097E-
05 -1.177 0.254
Wholesale
Sales -0.176 -0.426 0.675
Precipitation -1143.560 -0.636 0.533
Wholesale.Prec. 0.078 0.444 0.662
October Constant
16369.26
4 3.745 0.001 0.899 32.106 .000
GDP 0.681 3.039 0.007
Population
-2.904E-
05 -1.288 0.214
Wholesale
Sales -0.526 -1.373 0.187

110
Precipitation -2242.344 -1.663 0.114
Wholesale.Prec. 0.214 1.720 0.103
November Constant 9073.594 4.113 0.001 0.974 133.869 .000
GDP 0.521 3.931 0.001
Population
-4.068E-
05 -3.229 0.005
Wholesale
Sales 0.902 7.051 0.000
Precipitation 1673.828 3.860 0.001
Wholesale.Prec. -0.169 -3.981 0.001
December Constant
35816.42
4 3.768 0.001 0.580 4.962 .005
GDP 1.351 2.318 0.032
Population 0.000 -2.540 0.021
Wholesale
Sales 0.840 1.281 0.216
Precipitation 533.341 0.378 0.710
Wholesale.Prec. -0.130 -0.822 0.422
111
VITA
Md. Tahmidul Islam Molla completed his Master's from University of Missouri (MU) in
May, 2016. Earlier on, he has completed his Bachelor of Science in Textile Technology
with major in Garments Technology from Bangladesh University of Textiles, the only
university of its kind in the country in June 2011. Later, he has completed his MBA with
major in Quantitative Business Analysis and minor in Marketing at Institute of Business
Administration, Jahangirnagar University from January 2012 to April 2014. To articulate
his profession, he worked as a Teaching Assistant from fall 2014 to spring 2016 at MU.
Prior to that he worked as a lecturer in Green University of Bangladesh from spring, 2012
to summer, 2014. He also worked as a Merchandiser in Opex and Sinha Textile Group
which is one of the largest and export oriented apparel industries in Bangladesh from April,
2011 to December, 2011. Md. Tahmidul Islam Molla received ITAA Sara Douglas
Fellowship for Professional Promise from International Textile and Apparel Association
(ITAA) and Adeline M. Hoffman Scholarship from the College of Human Environmental
Sciences at MU for his exceptional academic records. He has demonstrated excellent
leadership skills through his involvement with different organizations. His research interest
include global textile and apparel industry, global apparel supply chain, wearable
technology, apparel manufacturing technology, operations management, international
trade analysis and sourcing strategies.