impact study of the national horticulture mission scheme ... · summarizing some of the findings...
TRANSCRIPT

IMPACT STUDY OF THE NATIONAL HORTICULTURE MISSION SCHEME: A CONSOLIDATED REPORT
PARMOD KUMAR
Agricultural Development and Rural Transformation Centre Institute for Social and Economic Change
Bangalore- 560 072
DECEMBER 2013

i
PREFACE
National Horticulture Mission (NHM) is a Centrally sponsored scheme to develop
horticulture to the maximum potential available in the states and to augment production of
all horticultural products including fruits, vegetables, flowers, plantation crops, spices and
medicinal and aromatic plants. Government of India launched NHM Scheme during the
10th Plan, with effect from 2005-06. The thrust of the Mission has been area-based,
regionally differentiated cluster approach for development of horticulture crops, having
comparative advantage. The Scheme has been approved ‘in principle’ for implementation
up to the end of XI Five Year Plan. Since, the programme entered in the fifth year in 2009,
it was felt necessary to analyze the impact of the programme vis-à-vis objectives of the
NHM scheme especially for the major focused crops in terms of area expansion, increase in
production and productivity. Therefore, this study has been carried out for the impact
evaluation in different NHM states through the Agro Economic Research Centres (AERCs)
and Units. Six AERCs namely, Waltair, Bhagalpur, Vallabh Vidyanagar, Chennai,
Shantiniketan and Delhi participated for the states of Andhra Pradesh, Bihar, Rajasthan,
Tamil Nadu, West Bengal and Haryana. In addition, ADRTC Centre carried out the work
for Karnataka. The Centre also played the lead role from the proposal to finalization of
methodology and questionnaire development and planning the structure of the report for
each state and thereby has compiled the Consolidated Report on the basis of findings of all
the seven state reports.
Summarizing some of the findings based on time series data, among the major achievement
of National Horticulture Mission, the area under fruits increased from 4 million hectares in
2001-02 to more than 6 million hectares by the end of the 2009-10. Area under vegetables
increased from 6.2 million hectares in 2001-02 to 8 million hectares in 2009-10. Area under
floriculture and aromatic plants also experienced some increase although area under such
crops before the beginning of the current decade was almost negligible. Area under all
horticultural crops increased from 16.6 million hectares in 2001-02 to 20.9 million hectares in
2009-10. Production of all horticultural crops increased from 146 million tonnes in 2001-02 to
223 million tonnes in 2009-10. At the aggregate, NHM seems to have overall positive effect
on the horticultural crops. The time series trends were validated with the ground level
information collected through the field survey of around 200 beneficiaries each among the
selected states. Among the selected household, area under selected crops increased among
almost all farm size holdings. Compared to constant increase in area, there were wide
fluctuations in the yield rate in the selected horticultural crops among the selected farmers.
Thus, NHM appears to have succeeded in raising area under horticultural crops but difficult
to say with firmness whether it has the same effect with respect to yield level. On the
resource provision under NHM, the performance of NHM was mixed one.
NHM helped farmers increasing their area under horticultural crops through resource
provision like seedling/nursery, fertilizer and plant protection, putting up poly house
ventilation, insect proof net and putting up infrastructure for sprinkler irrigation and so on.
However, NHM failed completely in making provision of processing facility, providing
market for the end product/facilitating them through procurement and building capacity by

ii
proper training. About majority of the selected farmers agreed that financial assistance
through NHM as well as subsidy provision in terms of direct payment was a good point of
the NHM Programme. On the other hand, majority of the households disagreed on
infrastructure and capacity building activities by the NHM programme. NHM helped in
increasing the employment opportunities for the farmers through expansion of area under
horticultural crops. Majority of the households indicated that their income has increased
after shifting to horticultural crops The infrastructure building especially that of post
harvest management as well as capacity building under NHM was found lacking although
some attempts were made in that direction.
The findings of the study provide valuable insights into various aspects of functioning of the
NHM and also provide policy suggestions on how to improve the functioning of the
programme. I am sure study would be useful to all including policy planners, researchers,
academicians, practitioners and policy makers.
Parmod Kumar
Professor & Head
Agricultural Development and Rural Transformation Centre
Institute for Social and Economic Change (ISEC)
Bangalore - 560072

iii
ACKNOWLEDGEMENTS
The study was undertaken by the Agricultural Development and Rural Transformation
Centre, Institute for Social and Economic Change (ISEC) Bangalore on behest of
Department of Agriculture and Cooperation, Ministry of Agriculture, Government of India,
New Delhi. I sincerely thank the officials of the Ministry for their cooperation and help.
The report would not have been possible without the cooperation of Ms. S. Bhawani,
Principal Adviser, Shri B. Gangaiah, Economic and Statistical Adviser, Dr. B.S. Bhandari
(Economic Adviser), Ms. Sebastian (Addl. Economic Adviser) and Shri B. Naik (Economic
Officer) in the Department of Agriculture and Cooperation.
I sincerely thank the AERCs, viz., Dr. G Gangadhara Rao AERC Vishakhapatnam; Dr.
Basanta Kumar Jha, AERC Bhagalpur; Dr. R.H. Patel, AERC Vallabh Vidyanagar; Dr.
Debashis Sarkar, AERC Shantiniketan; Dr. Usha Tuteja, AERC Delhi; and K. Jothi
Sivagnanam, AERC Chennai and their team for compiling the state reports.
I sincerely thank Prof. R. S. Deshpande, Former Director, ISEC, for his encouragement and
constructive suggestions on the project. I also thank Prof. Ramesh Chand (Director NCAP)
and Prof. V.M. Rao (Honorary Visiting Fellow, ISEC), Prof. P.G. Chengappa ICAR Chair
Professor ISEC, Dr T K Prabhakar Shetty and Shri K V Subramanyam (Government of
Karnataka) and Prof Shetty (UAS) for their constructive suggestions in a meeting earlier
held in the ISEC. The cooperation of ADRTC faculty and staff is duly acknowledged for
their useful comments and valuable suggestions on the questionnaire as well as their help in
commencing the field work. I specially wish to thank the help rendered by Dr. Elumalai
Kannan and Dr. G.B. Lokesh in the Karnataka report. I also wish to thank Mr. Arun Kumar
and Mr. Kumar for their secretarial help.
I highly appreciate the co-operation extended by the households in the primary survey and
express sincere thanks to all the respondents. The project team benefited from the
interaction with various Panchayat officials as well as Horticultural Department Officials,
Government of Karnataka during the course of this study. The list is too long to be spelt out
here. I express my sincere thanks to all of them.
Ms. Prema helped in processing the data at different stages of the project and her
contribution to the report is acknowledged.
The report would have remained incomplete without the co-operation of all of them.
Parmod Kumar
iv
CONTENTS
Page Number
PREFACE I
ACKNOWLEDGEMENT III
CONTENTS IV-X
CHAPTER 1
Introduction 1-16
1.1 Diversification in demand and supply of agricultural commodities 1
1.2 Distribution of horticultural crops across different states in India 6
1.3 National Horticultural Mission 13
1.4 Need for the study 14
1.5 Objectives of the study 14
1.6 Methodology, scope and data base 15
1.7 Overview 16
CHAPTER 2
Area, Production and Productivity of Horticultural
Crops in Selected States 17-33
2.1 Growth of horticulture crops in Karnataka 17
2.2 Growth of horticulture crops in Andhra Pradesh 21
2.3 Growth of horticulture crops in Bihar 23
2.4 Growth of horticulture crops in Rajasthan 24
2.5 Growth of horticulture crops in Tamil Nadu 27
2.6 Growth of horticulture crops in West Bengal 29
v
2.7 Growth of horticulture crops in Haryana 32
2.8 Summary of the chapter 33
CHAPTER 3
Household Characteristics, Cropping Pattern and
Value of Output 37-62
3.1 Socio economic characteristics of selected farmers 37
3.2 Characteristics of operational holdings 40
3.3 Nature of tenancy 41
3.4 Sources of irrigation 42
3.5 Sources and purpose of credit 43
3.6 Assets holdings 45
3.7 Cropping pattern 47
3.8 Household income 49
3.9 Summary of the chapter 52
CHAPTER 4
The Production Structure and Resource Use
under Horticultural Crops 63-115
4.1 Economics of production, cost and resource use in selected crops 63
4.1.1 Selected crops in Karnataka 63
4.1.2 Selected crops in Andhra Pradesh 70
4.1.3 Selected crops in Bihar 73
4.1.4 Selected crops in Rajasthan 76
4.1.5 Selected crops in Tamil Nadu 83
4.1.6 Selected crops in West Bengal 89
4.1.7 Selected crops in Haryana 92
4.2 Use of human labour in horticultural versus non horticultural crops 97
4.3 Marketing channels of horticultural crops 104
4.4 On farm processing activities in horticultural crops 112
4.5 Summary of the chapter 115

vi
ANNEXURE - 4.1
The Cost of Production of Perennial Crops 116-117
CHAPTER 5
Impact of NHM on the Expansion of Horticultural Crops 118-179
5.1 Impact of National Horticulture Mission 118
5.1.1 Impact of NHM on area and yield of horticultural crops in Karnataka 119
5.1.2 Impact of NHM on area and yield of horticultural crops in Andhra 121
5.1.3 Impact of NHM on area and yield of horticultural crops in Bihar 122
5.1.4 Impact of NHM on area and yield of horticultural crops in Rajasthan 123
5.1.5 Impact of NHM on area and yield of horticultural crops in Tamil Nadu 124
5.1.6 Impact of NHM on area and yield of horticultural crops in West Bengal 126
5.1.7 Impact of NHM on area and yield of horticultural crops in Haryana 127
5.2 Rejuvenation activities under National Horticulture Mission 127
5.2.1 Rejuvenation, resource procurement through NHM in Karnataka 127
5.2.2 Rejuvenation, resource procurement through NHM in Andhra Pradesh 129
5.2.3 Rejuvenation, resource procurement through NHM in Bihar 129
5.2.4 Rejuvenation, resource procurement through NHM in Rajasthan 130
5.2.5 Rejuvenation, resource procurement through NHM in Tamil Nadu 131
5.2.6 Rejuvenation, resource procurement through NHM in West Bengal 133
5.2.7 Rejuvenation, resource procurement through NHM in Haryana 134
5.3 Resource provision under the National Horticulture Mission 135
5.3.1 NHM reaching to the households with resource provision in Karnataka 135
5.3.2 NHM reaching to the households with resource provision in Andhra P. 136
5.3.3 NHM reaching to the households with resource provision in Bihar 137
5.3.4 NHM reaching to the households with resource provision in Rajasthan 138
5.3.5 NHM reaching to the households with resource provision in Tamil Nadu 140
5.3.6 NHM reaching to the households with resource provision in West Bengal 141
5.3.7 NHM reaching to the households with resource provision in Haryana 143
5.4 Subsidy provision under National Horticulture Mission 144
5.4.1 Subsidy provision under NHM in Karnataka 144

vii
5.4.2 Subsidy provision under NHM in Andhra Pradesh 146
5.4.3 Subsidy provision under NHM in Bihar 147
5.4.4 Subsidy provision under NHM in Rajasthan 148
5.4.5 Subsidy provision under NHM in Tamil Nadu 151
5.4.6 Subsidy provision under NHM in West Bengal 153
5.4.7 Subsidy provision under NHM in Haryana 154
5.5 Capacity building under National Horticulture Mission 155
5.5.1 Capacity building under NHM in Karnataka 156
5.5.2 Capacity building under NHM in Andhra Pradesh 157
5.5.3 Capacity building under NHM in Bihar 157
5.5.4 Capacity building under NHM in Rajasthan 159
5.5.5 Capacity building under NHM in Tamil Nadu 161
5.5.6 Capacity building under NHM in West Bengal 163
5.5.7 Capacity building under NHM in Haryana 163
5.6 Perceptions of households about National Horticulture Mission 166
5.6.1 Perceptions of households about NHM in Karnataka 166
5.6.2 Perceptions of households about NHM in Andhra Pradesh 168
5.6.3 Perceptions of households about NHM in Bihar 169
5.6.4 Perceptions of households about NHM in Rajasthan 171
5.6.5 Perceptions of households about NHM in Tamil Nadu 173
5.6.6 Perceptions of households about NHM in West Bengal 175
5.6.7 Perceptions of households about NHM in Haryana 175
5.7 Summary of the chapter 178
CHAPTER 6
Concluding Remarks and Policy Suggestions 180-197
6.1 Summary of Findings 182
6.1.1 Growth in Area, Production and Productivity of Horticultural Crops
in the selected states 182
6.1.2 Household characteristics, Cropping Pattern and Production Structure
of Selected Households 187

viii
6.1.3 The Production Structure and Resource Use under Horticulture Crops 188
6.1.4 Impact of NHM on the Expansion of Horticultural Crops 192
6.2 Policy Suggestions 196
References 198-200
Annexure Tables 201-220

ix
LIST OF TABLES
Table Number Title Page Number
1.1 Expenditure share of different items in the household budget 2
1.2 Trends in Area, production and productivity of
horticultural crops - All India 3
1.3 Cropping pattern in India (2004-05 to 2007-08) 4
1.4 Share of various crops (groups) in the value of
agricultural output at 1999-00 prices 5
1.5 Crop wise, area, production and productivity – All India 5
1.6 Share of states in area and production of horticultural crops
in India (TE 2009-10) 8
1.7 Share of states in area and production of fruit crops in
India (TE 2009-10) 9
1.8 Share of states in area and production of vegetable crops
in India (TE2009-10) 10
1.9 Share of states in area and production of flower crops
in India (TE 2009-10) 11
1.10 Share of states in area and production of aromatic crops
in India (TE 2009-10) 12
2.1a Growth rate in area and yield rate of horticultural crops
in the state (%) 18
2.1b Growth rate$ in area and yield rate of horticultural crops
in Karnataka (%) 21
2.2a Growth rate in area and yield rate of selected horticultural crops
in Andhra Pradesh (%) 21
2.2b Growth rate in area and yield rate of selected horticultural crops
in Andhra Pradesh (%) 23
2.3a Growth in area and yield of horticultural crops (%) 23
2.3b Growth rate in area and yield of selected Horticultural Crops
in Bihar (%) 24
2.4a Growth rate in area and yield of horticulture crops
in Rajasthan (%) 25
2.4b Growth rate in area and yield rate of selected horticulture crops
in Rajasthan 26
2.5a Growth rate in area and yield of horticulture crops
in Tamil Nadu (%) 28
2.5b Growth rate in area and yield rate of selected horticulture crops
in Tamil Nadu (%) 29
2.6a Growth rate in Area and Yield Rate of Horticultural Crops
in W.B. (%) 31
2.6b Growth rate in area and yield of selected horticultural crops
in W.B. 31
2.7 Area under Fruits and Vegetables in Haryana 32

x
3.1 Demographic profile of the selected farmers (% of households) 53
3.2 Characteristics of operational holdings (acres per household) 54
3.3 Nature of tenancy in leasing-in land (%) 55
3.4a Source of irrigation of net operated area (Acres) 56
3.4b Source of irrigation of net operated area (%) 57
3.5a Details of source of credit by the selected households 58
3.5b Details of purpose of credit by the selected households 59
3.6 Ownership of productive assets 60
3.7 Cropping pattern of selected farmers (% of GCA) 61
3.8 Value of output, cost and net returns for the survey year
aggregate of all crops ( ) 62
4.1.1a Net returns per acre from horticultural crops – Grapes 66
4.1.1b Net returns per acre from horticultural crops – Pomegranate 67
4.1.1c Net returns per acre from horticultural crops – Flowers 68
4.1.1d Net returns per acre from horticultural crops – Aromatic/medicinal 69
4.1.2a Net returns per acre from horticultural crops – Mango 71
4.1.2b Net returns per acre from horticultural crops – Sweet orange 72
4.1.3a Net returns per acre from horticultural crops – Mango 74
4.1.3b Net returns per acre from horticultural crops – Litchi 75
4.1.4a Net returns per acre from horticultural crops – Aonla 77
4.1.4b Net returns per acre from horticultural crops – Papaya 79
4.1.4c Net returns per acre from horticultural crops – Coriander 80
4.1.4d Net returns per acre from horticultural crops – Mango 82
4.1.5a Net returns per acre from horticultural crops – Banana 85
4.1.5b Net returns per acre from horticultural crops – Mango 86
4.1.5c Net returns per acre from horticultural crops – Flower 88
4.1.6a Net returns per acre from horticultural crops – Pineapple 90
4.1.6b Net returns per acre from horticultural crops – Mandarin orange 91
4.1.7a Net returns per acre from horticultural crops – Kinnow 93
4.1.7b Net returns per acre from horticultural crops – Guava 94
4.1.7c Net returns per acre from horticultural crops – Aonla 95
4.1.7d Net returns per acre from horticultural crops – Garlic 96
4.2.1 Labour use crop wise in Karnataka (no of days per acre) 98
4.2.2 Labour use crop wise in Andhra Pradesh (no of days per acre) 98
4.2.3 Labour use crop wise in Bihar (no of days per acre) 99
4.2.4 Labour use crop wise in Rajasthan (no of days per acre) 100
4.2.5 Labour use crop wise in Tamil Nadu (no of days per acre) 102
4.2.6 Labour use crop wise in West Bengal (no of days per acre) 103
4.2.7 Labour use crop wise in Haryana 104
4.3.1 Marketing channels through which horticultural products were
sold by the selected households (percentage of households)
- Karnataka 105
4.3.2 Marketing channels through which horticultural products were
sold by the selected households (percentage of households)
- Andhra Pradesh 106

xi
4.3.3 Marketing channels through which horticultural products were
sold by the selected households (percentage of households)
- Bihar 107
4.3.4 Marketing channels through which horticultural products were
sold by the selected households (percentage of households)
- Rajasthan 109
4.3.5 Marketing channels through which horticultural products were
sold by the selected households (percentage of households)
- Tamil Nadu 110
4.3.6 Marketing channels through which horticultural products were
sold by the selected households (percentage of households)
- West Bengal 112
4.5 Processing activities undertaken by the cultivators in
grapes preparing raisins in Karnataka 113
5.1.1a Impact of NHM on area and yield of selected farmers
in Karnataka 119
5.1.1b Impact of NHM on value of productivity in Karnataka
( per acre at reference year price) 120
5.1.2 Impact of NHM on area and yield of selected farmers
in Andhra Pradesh 122
5.1.3 Impact of NHM on area and yield of selected farmers
in Bihar 123
5.1.4 Impact of NHM on area and yield of selected farmers
in Rajasthan 124
5.1.5 Impact of NHM on area and yield of selected farmers
in Tamil Nadu 125
5.1.6 Impact of NHM on area and yield of selected farmers
in West Bengal 126
5.1.7 Impact of NHM on area and yield of selected farmers
in Haryana 127
5.2.1a Resource provision certified/non-certified for area/productivity
expansion via rejuvenation/protection under NHM - Karnataka 128
5.2.1b Sources of NHM resource procurement for all crops
during 2004-05 to 2008-09 128
5.2.1c Rejuvenation/protection provided under NHM and resultant increase
in productivity in Karnataka 129
5.2.2 Sources of NHM resource procurement in Andhra Pradesh
during 2004-05 to 2009-10 130
5.2.3 Sources of NHM resource procurement in Bihar during
2004-05 to 2009-10 130
5.2.4 Increase in area and productivity due to rejuvenation/protection
supported by the NHM in Rajasthan 131
5.2.5a Area rejuvenated/protected through NHM resource provision
in Tamil Nadu 132
5.2.5b Increase in Area and Productivity due to Rejuvenation/Protection
Supported by the NHM in Tamil Nadu 132
xii
5.2.6a Area/Productivity Expansion via Rejuvenation/Protection
through NHM Resource Provision in West Bengal 134
5.2.6b Increase in productivity due to rejuvenation/protection supported
by the NHM in West Bengal 134
5.3.1 How did NHM help households to increase their area under
horticultural crops in Karnataka 136
5.3.2 Did NHM help households to increase their area under
horticultural crops Andhra Pradesh 137
5.3.3 Promotional activities of NHM to increase area under
horticultural crops in Bihar 138
5.3.4a Sources of NHM resource procurement for all crops
during 2004-05 to 2009-10 in Rajasthan 139
5.3.4b Promotional activities of NHM to increase area under
horticultural crops in Rajasthan 139
5.3.5a Source of NHM resource procurement during 2004-05 to
2009-10 in Tamil Nadu 141
5.3.5b Promotional Activities of NHM to increase area under
horticultural crops in Tamil Nadu 141
5.3.6a Sources of NHM resource procurement (sapling) for selected
crops in WB during 2004-05 to 2009-10 142
5.3.6b Did NHM Help Households to Increase their Area under
Horticultural Crops in WB 143
5.3.7 Did NHM help farm households to increase their area under
horticultural crops in Haryana 144
5.4.1 Details of subsidy provided under NHM in Karnataka 145
5.4.2 Details of subsidy provided under NHM in Andhra Pradesh 147
5.4.3 Details of subsidy provided under NHM in Bihar 148
5.4.4 Details of subsidy provided under NHM in Rajasthan 149
5.4.5 Details of subsidy provided under NHM in Tamil Nadu 152
5.4.6 Details of subsidy provided under NHM in West Bengal 154
5.4.7 Details of subsidy provided under NHM in Haryana 155
5.5.1 Sources of training/dissemination activity provided to the
farmers under NHM in Karnataka 156
5.5.2 Sources of training/dissemination activity provided to the
farmers under NHM in Andhra Pradesh 158
5.5.3 Sources of training/dissemination activity provided to the
farmers under NHM in Bihar 159
5.5.4 Sources of training/dissemination activity provided to the
farmers under NHM in Rajasthan 160
5.5.5 Sources of training/dissemination activity provided to the
farmers under NHM in Tamil Nadu 162
5.5.6 Sources of training/dissemination activity provided to the
farmers under NHM in West Bengal 164
5.5.7 Sources of training/dissemination activity provided to the
farmers under NHM in Haryana 165
5.6.1 Perception of households about the NHM in Karnataka 167
xiii
5.6.2 Perception of households about the NHM in Andhra Pradesh 169
5.6.3 Perception of households about the NHM in Bihar 170
5.6.4 Perception of households about the NHM in Rajasthan 172
5.6.5 Perception of households about the NHM in Tamil Nadu 174
5.6.6 Perception of households about the NHM in West Bengal 176
5.6.7 Perception of households about the NHM in Haryana 177

xiv
LIST OF ANNEXURE TABLES
Table Number Title Page Number
1.1A The details of the crops and number of households
selected in each state 201
2.1A Area and production of horticultural crops in Karnataka 202
2.2A Area and production of selected horticultural crops in Karnataka 203
2.3A Area and production of horticultural crops in AP 204
2.4A Area and production of selected horticultural crops in AP 205
2.5A Area and production of horticultural crops in Bihar 206
2.6A Area and production of selected horticultural crops in Bihar 206
2.7A Area and production of horticultural crops in Rajasthan 207
2.8A Area and production of selected horticultural crops in Rajasthan 208
2.9A Area and production of horticultural crops in TN 209
2.10A Area and production of selected horticultural crops in TN 210
2.11A Area and production of horticultural crops in WB 211
2.12A Area and production of selected horticultural crops in WB 212
3.1A Demographic Profile of the Selected Farmers (% of households) 213
3.2A Ownership of Productive Assets among selected households 215
3.3A Value of output, Cost and net returns for the survey year
Aggregate all Crops 218
1
Chapter 1
Introduction
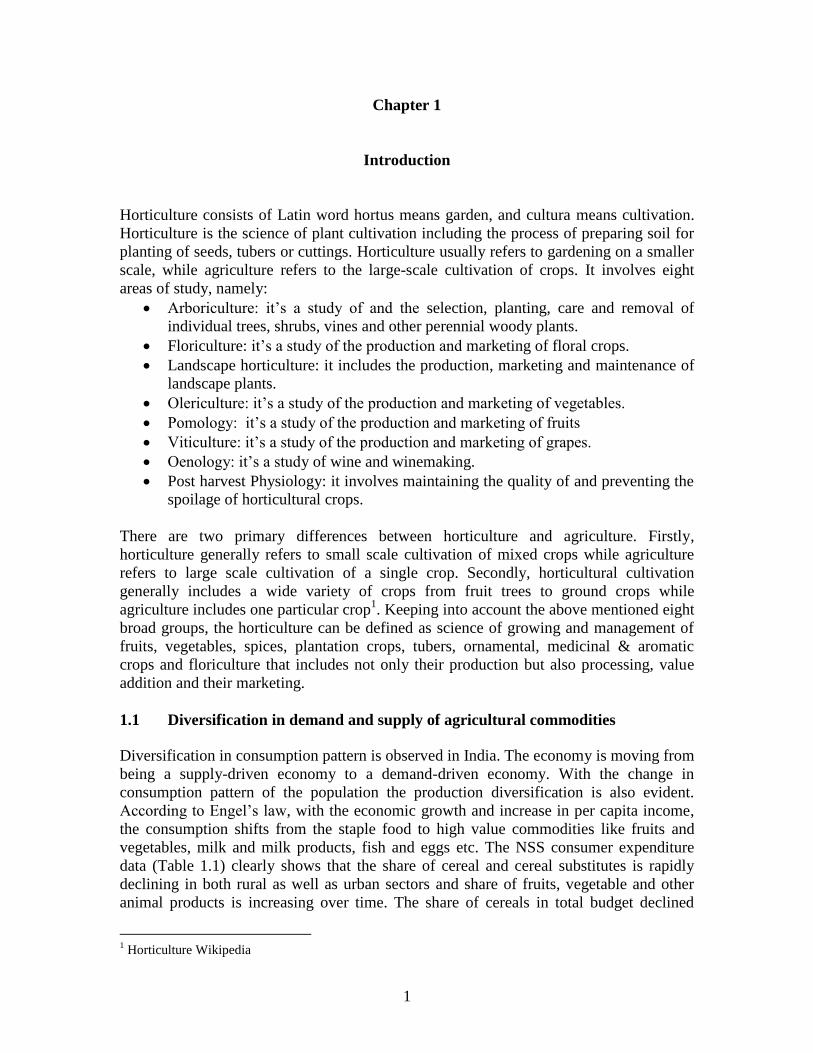
Horticulture consists of Latin word hortus means garden, and cultura means cultivation.
Horticulture is the science of plant cultivation including the process of preparing soil for
planting of seeds, tubers or cuttings. Horticulture usually refers to gardening on a smaller
scale, while agriculture refers to the large-scale cultivation of crops. It involves eight
areas of study, namely:
Arboriculture: it’s a study of and the selection, planting, care and removal of
individual trees, shrubs, vines and other perennial woody plants.
Floriculture: it’s a study of the production and marketing of floral crops.
Landscape horticulture: it includes the production, marketing and maintenance of
landscape plants.
Olericulture: it’s a study of the production and marketing of vegetables.
Pomology: it’s a study of the production and marketing of fruits
Viticulture: it’s a study of the production and marketing of grapes.
Oenology: it’s a study of wine and winemaking.
Post harvest Physiology: it involves maintaining the quality of and preventing the
spoilage of horticultural crops.
There are two primary differences between horticulture and agriculture. Firstly,
horticulture generally refers to small scale cultivation of mixed crops while agriculture
refers to large scale cultivation of a single crop. Secondly, horticultural cultivation
generally includes a wide variety of crops from fruit trees to ground crops while
agriculture includes one particular crop1. Keeping into account the above mentioned eight
broad groups, the horticulture can be defined as science of growing and management of
fruits, vegetables, spices, plantation crops, tubers, ornamental, medicinal & aromatic
crops and floriculture that includes not only their production but also processing, value
addition and their marketing.
1.1 Diversification in demand and supply of agricultural commodities
Diversification in consumption pattern is observed in India. The economy is moving from
being a supply-driven economy to a demand-driven economy. With the change in
consumption pattern of the population the production diversification is also evident.
According to Engel’s law, with the economic growth and increase in per capita income,
the consumption shifts from the staple food to high value commodities like fruits and
vegetables, milk and milk products, fish and eggs etc. The NSS consumer expenditure
data (Table 1.1) clearly shows that the share of cereal and cereal substitutes is rapidly
declining in both rural as well as urban sectors and share of fruits, vegetable and other
animal products is increasing over time. The share of cereals in total budget declined
1 Horticulture Wikipedia

2
from 26 percent in 1987-88 to 14 percent in 2009-10 in the rural sector while it declined
from 15 percent to 8 percent in the urban sector during the same time period. On the other
hand share of fruits and vegetables in the household budget increased from 6.8 percent in
1987-88 to 10.47 percent in 2009-10 in the rural sector while these commodities
maintained their share in the urban during this time period. Overall, the share of food
items in the total budget has come down from 67 percent in 1987-88 to 57 percent in
2009-10 in the rural sector. Similarly, in the urban sector share of food items has come
down from 59 percent in 1987-88 to 44 percent in 20089-10. Thus, a general shift is
occurring in the household consumption from cereals to high value commodities and
from food to non food commodities both in rural as well as urban sectors.
Table 1.1: Expenditure share of different items in the household budget (percentage)
Items 43
rd
(1987
-88)
50th
(1993
-94)
55th
(1999
-00)
61st
(2004
-05)
66th
(2009
-10)
43rd
(1987
-88)
50th
(1993
-94)
55th
(1999
-00)
61st
(2004
-05)
66th
(2009
-10)
Rural Urban
Total cereal and substitute 26.4 24.3 22.3 18.1 13.8 15.2 14.1 12.4 10.1 8.2
Total pulses 4.2 3.8 3.9 3.2 3.3 3.5 3.0 2.9 2.2 2.5
Total edible 5.0 4.4 3.7 4.6 3.7 5.3 4.4 3.1 3.5 2.7
Milk & milk product 8.6 9.5 8.8 8.5 7.7 9.5 9.8 8.7 7.9 6.9
Eggs & meat 3.2 3.3 3.3 3.3 4.7 3.5 3.4 3.1 2.7 3.6
Fruits, vegetables and nuts 6.8 7.8 7.9 8.4 10.7 7.8 8.1 7.6 7.0 8.8
Sugar, salt and spices 5.7 5.7 5.3 4.5 5.7 4.7 4.4 3.9 2.9 3.7
Beverages and intoxicants 7.1 7.3 7.1 7.2 7.4 9.3 9.6 8.2 7.8 8.0
Non food 33.0 33.8 37.7 42.2 43.0 41.2 43.1 50.0 55.9 55.6
Total 100.0 100.0 100.0 100.0 100.0 100.0 100.0 100.0 100.0 100.0
Source: National Sample Survey Organisation (NSSO), Government of India, Various years.
The demand for horticulture products are increasing significantly both at the national as well
as at the international fronts due to their high nutritional values. This switch in demand
towards nutritious and high value commodities in the recent decades is probably due to a
general rise in people’s purchasing power. The Planning Commission, while formulating
11th Five Year Plan, projected foodgrains demand would grow at around 2 percent per
annum while fruits and vegetables demand would grow at 2.5 to 3.5 percent per annum and
meat products would grow at more than 4.5 percent per annum2. This enormous increase in
demand for such products has actually led to a shift in cropping pattern in favour of
horticultural crops in the country. As a result, total area and production of fruits and
vegetables in India have gained considerable momentum in the last two decades. The area
under fruits increased from 2.8 million hectares in 1991-92 to 4 million hectares in 2001-02
that further increased to more than 6 million hectares by the end of the 2009-10 (Table 1.2).
The area under fruits expanded at an exponential rate of 6.5 percent per annum during the
decade of 2000s. The yield rate of fruits, however, increased at a much slower rate of only
half-a-percent per annum during the same time period. The average yield rate of fruits
increased from less than 10 tonnes per hectare in 1991-92 to 10.7 tonnes per hectare in
2001-02 and 11 tonnes per hectare in 2009-10. Thus, the fruit production increased at more
2 Report of the ‘Steering Committee on Agriculture and Allied Sectors for Formulation of the 11
th Five Year
Plan’, Planning Commission, Government of India, New Delhi.

3
than 7 percent per annum from 43 million tonnes in 2001-02 to 71.5 million tonnes in 2009-
10 (Table 1.2).
Area under vegetables increased at a rate of 4.2 percent per annum from 6.2 million hectares
in 2001-02 to 8 million hectares in 2009-10. Vegetables observed much better growth rate in
yield rate (2.2 percent per annum) as compared to fruits (0.57 percent). The total production
of vegetables increased at 6.5 percent per annum from 89 million tones in 2001-02 to 134
million tones in 2009-10 (Table 1.3). Area under floriculture and aromatic plants has also
experienced some increase although area under such crops before the beginning of the
current decade was almost negligible (was not reported). Area under floriculture increased
from 1 lakh hectares in 2001-02 to 1.8 lakh hectares in 2009-10. Similarly, area under
aromatic and medicinal plants increased from 1.3 lakh hectares in 2004-05 to 5 lakh hectares
in 2009-10. At the aggregate, area under horticultural crops increased from 12.8 million
hectares in 1991-92 to 16.6 million hectares in 2001-02 and further to 20.9 million hectares
in 2009-10. Production of horticultural crops increased from 96.6 million tonnes in 1991-92
to 146 million tonnes in 2001-02 and further to 223 million tonnes in 2009-10. The
exponential growth of production of horticultural crops during 2001-02 to 2009-10 was 6.3
percent per annum that was contributed almost equally, i.e., 3 percent per annum by the
expansion in area and 3.2 percent per annum increase in yield rate.
Table 1.2: Trends in area, production and productivity of horticultural crops – All India
Source: National Horticulture Board, Government of India
Note: area (in 000’ha); Production (in 000’mt); Yield (in metric tonnes per hectare); Nuts = Almond &
walnuts; Plantation crops = coconut, cashew nut, cocoa & areca nut
Crop Details 1991-92
2001-02 2002-03 2003-04 2004-05 2005-06 2006-07 2007-08 2008-09 2009-10 Exponential GR
2001-
2009
Fruits Area 2874 4010 3788 4661 5049 5324 5554 5857 6101 6329 6.55
Prod 28632 43001 45203 45942 50867 55356 59563 65587 68466 71516 7.16
Yield 9.96 10.72 11.93 9.86 10.07 10.40 10.72 11.20 11.22 11.30 0.57
Vegetables
Area 5593 6156 6092 6082 6744 7213 7581 7848 7981 7985 4.22
Prod 58532 88622 84815 88334 101246 111399 114993 128449 129077 133738 6.51
Yield 10.47 14.40 13.92 14.52 15.01 15.44 15.17 16.37 16.17 16.75 2.20
Flo-
wer
loose
Area - 106 70 101 118 129 144 166 167 183 10.49
Prod - 535 735 580 659 654 880 868 987 1021 7.91
Yield - 5.05 10.50 5.74 5.58 5.07 6.11 5.23 5.91 5.58 -2.34
Nuts Area - 117 117 106 106 130 132 132 136 142 3.19
Prod - 114 114 121 121 149 150 177 173 193 7.49
Yield - 0.97 0.97 1.14 1.14 1.15 1.14 1.34 1.27 1.36 4.17
Aroma
tic &
med.
Area - - - - 131 262 324 397 430 509 27.40
Prod - - - - 159 202 178 396 430 573 31.09
Yield - - - - 1.21 0.77 0.55 1.00 1.00 1.13 2.90
Plantation
crops
Area 2298 2984 2984 3102 3147 3283 3207 3190 3217 3265 1.11
Prod 7498 9697 9697 13161 9835 11263 12007 11300 11336 11928 2.01
Yield 3.26 3.25 3.25 4.24 3.13 3.43 3.74 3.54 3.52 3.65 0.89
Spices Area 2005 3220 3220 5155 3150 2366 2448 2617 2629 2464 -5.33
Prod 1900 3765 3765 5113 4001 3705 3953 4357 4145 4016 0.36
Yield 0.95 1.17 1.17 0.99 1.27 1.57 1.61 1.66 1.58 1.63 6.01
Gross total
Area 12770 16592 16270 19208 18445 18707 19389 20207 20662 20876 3.02
Prod 96562 145785 144380 153302 166939 182816 191813 211235 214716 223089 6.31
Yield 7.56 8.79 8.87 7.98 9.05 9.77 9.89 10.45 10.39 10.69 3.19

4
Today India is the second largest producer of fruits and vegetables in the world. As the
quantum of total production of fruits and vegetables increased, their export targets also
simultaneously have gone high over these years. Floriculture, which is a comparatively new
arena of horticultural sector, is also emerging as a giant sector both in domestic as well as in
overseas markets. The importance of horticulture in generating employment, enhancing
income and improving economic conditions of the farmers especially that of small
farmers, enhancing exports and above all, providing nutritional security to the people is
widely acknowledged. Horticulture sector occupied for around 21 million hectares of
land in 2009-10, accounting for around 10 percent of the gross cropped area of the
country. With production of 223 million tonnes in 2009-10, the sector contributed more
than 30 percent in the total value of output in agriculture. Fruits and vegetables alone
accounted for less than 6 percent of gross cropped area in 2007-08 (Table 1.3) while their
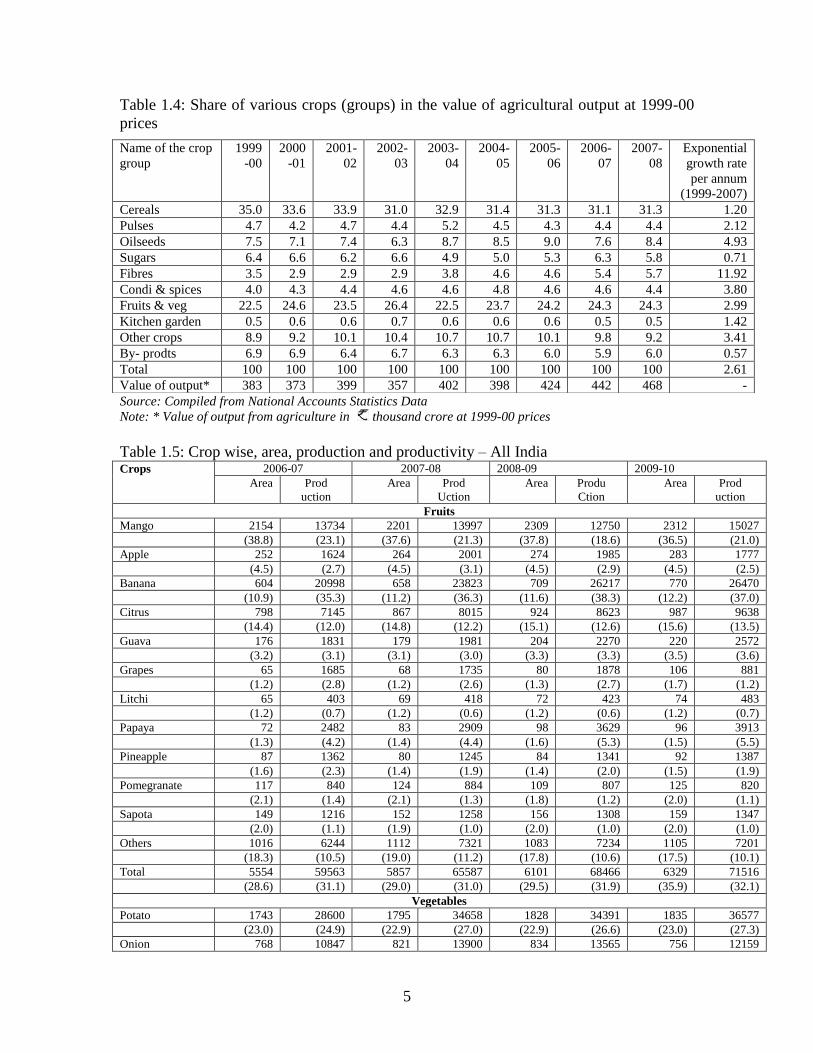
share in the value of agricultural GDP was around 25 percent (Table 1.4). Looking at the
growth trends in the value of crop sector output, fibers including the BT cotton output
grew at the fastest rate of around 12 percent during the period of 1999-00 to 2007-08.
Fruits, vegetables, condiments and spices grew at a rate of around 3 to 4 percent per
annum (Table 1.4) whereas overall agricultural output growth was less than 3 percent per
annum during the same time period.
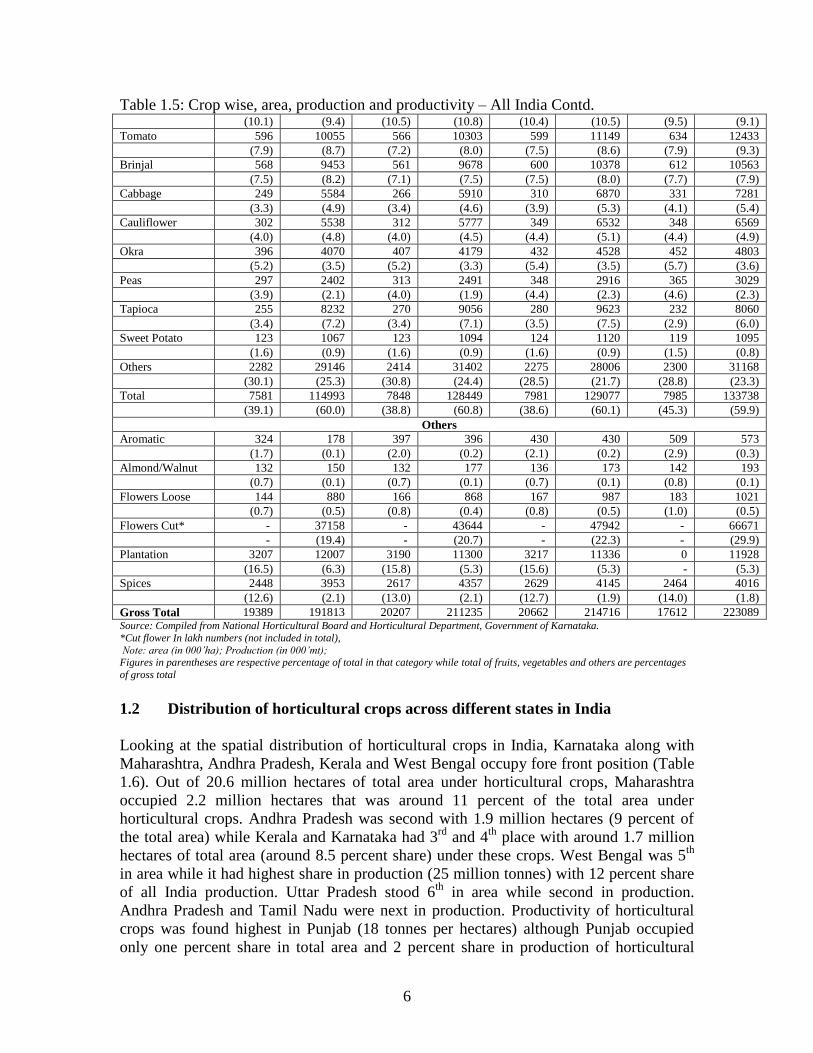
Among horticultural crops, fruits occupied around 30 percent area, vegetables around 38
percent area, plantation 16 percent and spices 13 percent area, while rest of less than 4
percent area was shared by the aromatic & medicinal plants, nuts and floriculture (Table
1.5). Among fruit crops, mango occupies major share (around 38 percent) followed by
citrus fruits (15 percent), banana 12 percent and apple (4 percent). The other minor fruits
are guava, sapota, pomegranate, papaya, grapes, litchi, pineapple etc. Among vegetables,
the major share is occupied by potato (23 percent), onion (10 percent), tomato and brinjal
(7.5 percent, each) and okra, peas, cauliflower and cabbage (around 4 to 5 percent, each).
Table-1.3: Cropping pattern in India (2004-05 to 2007-08)
(Percentage of GCA)
Commodities 2004-05 2006-07 2007-08
Rice 22.53 22.55 22.53
Wheat 3.97 4.36 3.97
Coarse Cereals 25.18 25.20 25.18
Total Cereals 51.67 52.11 51.67
Total Pulses 12.65 12.35 12.65
Total Foodgrains 64.32 64.46 64.32
Total Oil Seeds 14.86 14.85 14.86
Total Fibers 5.33 5.26 5.33
Condiment & Spices 1.64 1.52 1.64
Total Fruits 2.13 2.10 2.13
Total Vegetables 3.02 2.93 3.02
Other crops 8.71 8.88 8.70
Gross Cropped Area 100.00 100.00 100.00
Sources: Agricultural Statistics at a Glance, Various years.
5
Table 1.4: Share of various crops (groups) in the value of agricultural output at 1999-00
prices
Source: Compiled from National Accounts Statistics Data
Note: * Value of output from agriculture in thousand crore at 1999-00 prices
Table 1.5: Crop wise, area, production and productivity – All India Crops 2006-07 2007-08 2008-09 2009-10
Area Prod
uction
Area Prod
Uction
Area Produ
Ction
Area Prod
uction
Fruits
Mango 2154 13734 2201 13997 2309 12750 2312 15027
(38.8) (23.1) (37.6) (21.3) (37.8) (18.6) (36.5) (21.0)
Apple 252 1624 264 2001 274 1985 283 1777
(4.5) (2.7) (4.5) (3.1) (4.5) (2.9) (4.5) (2.5)
Banana 604 20998 658 23823 709 26217 770 26470
(10.9) (35.3) (11.2) (36.3) (11.6) (38.3) (12.2) (37.0)
Citrus 798 7145 867 8015 924 8623 987 9638
(14.4) (12.0) (14.8) (12.2) (15.1) (12.6) (15.6) (13.5)
Guava 176 1831 179 1981 204 2270 220 2572
(3.2) (3.1) (3.1) (3.0) (3.3) (3.3) (3.5) (3.6)
Grapes 65 1685 68 1735 80 1878 106 881
(1.2) (2.8) (1.2) (2.6) (1.3) (2.7) (1.7) (1.2)
Litchi 65 403 69 418 72 423 74 483
(1.2) (0.7) (1.2) (0.6) (1.2) (0.6) (1.2) (0.7)
Papaya 72 2482 83 2909 98 3629 96 3913
(1.3) (4.2) (1.4) (4.4) (1.6) (5.3) (1.5) (5.5)
Pineapple 87 1362 80 1245 84 1341 92 1387
(1.6) (2.3) (1.4) (1.9) (1.4) (2.0) (1.5) (1.9)
Pomegranate 117 840 124 884 109 807 125 820
(2.1) (1.4) (2.1) (1.3) (1.8) (1.2) (2.0) (1.1)
Sapota 149 1216 152 1258 156 1308 159 1347
(2.0) (1.1) (1.9) (1.0) (2.0) (1.0) (2.0) (1.0)
Others 1016 6244 1112 7321 1083 7234 1105 7201
(18.3) (10.5) (19.0) (11.2) (17.8) (10.6) (17.5) (10.1)
Total 5554 59563 5857 65587 6101 68466 6329 71516
(28.6) (31.1) (29.0) (31.0) (29.5) (31.9) (35.9) (32.1)
Vegetables
Potato 1743 28600 1795 34658 1828 34391 1835 36577
(23.0) (24.9) (22.9) (27.0) (22.9) (26.6) (23.0) (27.3)
Onion 768 10847 821 13900 834 13565 756 12159
Name of the crop
group
1999
-00
2000
-01
2001-
02
2002-
03
2003-
04
2004-
05
2005-
06
2006-
07
2007-
08
Exponential
growth rate
per annum
(1999-2007)
Cereals 35.0 33.6 33.9 31.0 32.9 31.4 31.3 31.1 31.3 1.20
Pulses 4.7 4.2 4.7 4.4 5.2 4.5 4.3 4.4 4.4 2.12
Oilseeds 7.5 7.1 7.4 6.3 8.7 8.5 9.0 7.6 8.4 4.93
Sugars 6.4 6.6 6.2 6.6 4.9 5.0 5.3 6.3 5.8 0.71
Fibres 3.5 2.9 2.9 2.9 3.8 4.6 4.6 5.4 5.7 11.92
Condi & spices 4.0 4.3 4.4 4.6 4.6 4.8 4.6 4.6 4.4 3.80
Fruits & veg 22.5 24.6 23.5 26.4 22.5 23.7 24.2 24.3 24.3 2.99
Kitchen garden 0.5 0.6 0.6 0.7 0.6 0.6 0.6 0.5 0.5 1.42
Other crops 8.9 9.2 10.1 10.4 10.7 10.7 10.1 9.8 9.2 3.41
By- prodts 6.9 6.9 6.4 6.7 6.3 6.3 6.0 5.9 6.0 0.57
Total 100 100 100 100 100 100 100 100 100 2.61
Value of output* 383 373 399 357 402 398 424 442 468 -
6
Table 1.5: Crop wise, area, production and productivity – All India Contd. (10.1) (9.4) (10.5) (10.8) (10.4) (10.5) (9.5) (9.1)
Tomato 596 10055 566 10303 599 11149 634 12433
(7.9) (8.7) (7.2) (8.0) (7.5) (8.6) (7.9) (9.3)
Brinjal 568 9453 561 9678 600 10378 612 10563
(7.5) (8.2) (7.1) (7.5) (7.5) (8.0) (7.7) (7.9)
Cabbage 249 5584 266 5910 310 6870 331 7281
(3.3) (4.9) (3.4) (4.6) (3.9) (5.3) (4.1) (5.4)
Cauliflower 302 5538 312 5777 349 6532 348 6569
(4.0) (4.8) (4.0) (4.5) (4.4) (5.1) (4.4) (4.9)
Okra 396 4070 407 4179 432 4528 452 4803
(5.2) (3.5) (5.2) (3.3) (5.4) (3.5) (5.7) (3.6)
Peas 297 2402 313 2491 348 2916 365 3029
(3.9) (2.1) (4.0) (1.9) (4.4) (2.3) (4.6) (2.3)
Tapioca 255 8232 270 9056 280 9623 232 8060
(3.4) (7.2) (3.4) (7.1) (3.5) (7.5) (2.9) (6.0)
Sweet Potato 123 1067 123 1094 124 1120 119 1095
(1.6) (0.9) (1.6) (0.9) (1.6) (0.9) (1.5) (0.8)
Others 2282 29146 2414 31402 2275 28006 2300 31168
(30.1) (25.3) (30.8) (24.4) (28.5) (21.7) (28.8) (23.3)
Total 7581 114993 7848 128449 7981 129077 7985 133738
(39.1) (60.0) (38.8) (60.8) (38.6) (60.1) (45.3) (59.9)
Others
Aromatic 324 178 397 396 430 430 509 573
(1.7) (0.1) (2.0) (0.2) (2.1) (0.2) (2.9) (0.3)
Almond/Walnut 132 150 132 177 136 173 142 193
(0.7) (0.1) (0.7) (0.1) (0.7) (0.1) (0.8) (0.1)
Flowers Loose 144 880 166 868 167 987 183 1021
(0.7) (0.5) (0.8) (0.4) (0.8) (0.5) (1.0) (0.5)
Flowers Cut* - 37158 - 43644 - 47942 - 66671
- (19.4) - (20.7) - (22.3) - (29.9)
Plantation 3207 12007 3190 11300 3217 11336 0 11928
(16.5) (6.3) (15.8) (5.3) (15.6) (5.3) - (5.3)
Spices 2448 3953 2617 4357 2629 4145 2464 4016
(12.6) (2.1) (13.0) (2.1) (12.7) (1.9) (14.0) (1.8)
Gross Total 19389 191813 20207 211235 20662 214716 17612 223089 Source: Compiled from National Horticultural Board and Horticultural Department, Government of Karnataka.
*Cut flower In lakh numbers (not included in total),
Note: area (in 000’ha); Production (in 000’mt); Figures in parentheses are respective percentage of total in that category while total of fruits, vegetables and others are percentages
of gross total
1.2 Distribution of horticultural crops across different states in India
Looking at the spatial distribution of horticultural crops in India, Karnataka along with
Maharashtra, Andhra Pradesh, Kerala and West Bengal occupy fore front position (Table
1.6). Out of 20.6 million hectares of total area under horticultural crops, Maharashtra
occupied 2.2 million hectares that was around 11 percent of the total area under
horticultural crops. Andhra Pradesh was second with 1.9 million hectares (9 percent of
the total area) while Kerala and Karnataka had 3rd
and 4th
place with around 1.7 million
hectares of total area (around 8.5 percent share) under these crops. West Bengal was 5th
in area while it had highest share in production (25 million tonnes) with 12 percent share
of all India production. Uttar Pradesh stood 6th
in area while second in production.
Andhra Pradesh and Tamil Nadu were next in production. Productivity of horticultural
crops was found highest in Punjab (18 tonnes per hectares) although Punjab occupied
only one percent share in total area and 2 percent share in production of horticultural

7
crops. Uttar Pradesh with 16.5 tonnes per hectares was second placed in productivity and
had 7 percent share in area while 11.6 percent share in production. Tamil Nadu and Bihar
with above 15.5 and 15.3 tonnes per hectare, respectively were placed third and fourth in
productivity in all India. The states that occupied top position in productivity were
Punjab, Uttar Pradesh, Tamil Nadu, Bihar, West Bengal and Jharkhand while those that
were found at the bottom in productivity were Rajasthan, Arunachal Pradesh, Sikkim,
Goa, Kerala, Uttrakhand and Mizoram. Karnataka state occupied 8.4 percent area in all
India but had only 6.8 percent share in production and thus the state was placed at 18th
number in productivity among 35 states and UTs in India.
Table 1.7 presents details about area, production and productivity of fruit crops. Fruit
crops occupied around 6 million hectares in India. Maharashtra (1.5 million hectares) and
Andhra Pradesh (0.9 million hectares) together accounted for around 40 percent area
under fruit crops in India. Uttar Pradesh, Gujarat, Karnataka, Kerala and Tamil Nadu
were the other major states as each of them occupied more than 3 lakh hectares under
fruit crops. Andhra Pradesh accounted highest share in production of fruits (12 million
tonnes). With 15 percent area under fruits, the state accounted for around 18 percent
share in total production. Maharashtra, on the other hand, having highest share of 24
percent in area contributed only 16 percent share (10.8 million tonnes) in production of
fruits. The other major fruit producing states included Tamil Nadu, Gujarat, Karnataka,
Utter Pradesh, Bihar, West Bengal and Kerala in the descending order. Productivity of
fruits was highest in Pondicherry (25.9 tonnes/hectare) followed by Madhya Pradesh
(25.7 tonnes/hectare), Tamil Nadu (24.5 tonnes/hectare), Gujarat (19.1 tonnes/hectare),
Punjab (18.6 tonnes/hectare), Karnataka (16.5 tonnes/hectare) and Rajasthan (15.2
tonnes//hectare). Among fruits, performance of Karnataka state was much better as it
occupied 5.3 percent share in area while its share in production was 7.8 percent, thus
having better productivity than all-India average productivity of 11 tonnes per hector.
In the case of vegetables (Table 1.8), out of total area of 7.94 million hectares under
vegetables, three states namely west Bengal (1.3 million hectare), Uttar Pradesh (1.0
million hectare) and Bihar (0.83 million hectare) occupied the principal place
contributing 16.5, 12.5 and 10.4 percent share, respectively in the total area of vegetable
crops. These three states also occupied principal proportion in the total vegetable
production contributing 22, 20 and 14 million tonnes respectively, in the total production.
The other major states in vegetable production were Orissa, Maharashtra, Karnataka,
Gujarat, Andhra Pradesh and Chhattisgarh. Productivity of vegetable crops was highest in
Lakshadweep (31.7 tonnes/hectare) followed by Tamil Nadu (29.9 tonnes/hectare),
Kerala (21.8 tonnes/hectare), Utter Pradesh (20.6 tonnes/hectare), Jammu & Kashmir
(19.2 tonnes/hectare), Pondicherry (18.8 tonnes/hectare), Punjab (18.2 tonnes/hectare)
and Gujarat (17.7 tonnes/hectare). Productivity in Karnataka was 16.8 tonnes/hectare that
was almost at par with the all-India productivity of 16.4 tonnes/hectare.
Compared to fruits and vegetables, floriculture and aromatic crops were grown in a few
states only. The total Area under floriculture crops was only 1.7 Lakh hectares (Table
1.9) and under aromatic and medicinal plants only 4.5 Lakh hectares (Table 1.10). Four
states, namely Tamil Nadu (29 thousand hectares), Karnataka (26 thousand hectares),

8
West Bengal (23 thousand hectares) and Andhra Pradesh (21 thousand hectares) occupied
around 57 percent of the total area under Floriculture crops. Maharashtra, Uttar Pradesh
and Gujarat were the other states that occupied principal area under floricultural crops.
Production of floriculture crops was highest in Tamil Nadu followed by Karnataka,
Andhra Pradesh, Maharashtra, Punjab, Haryana and West Bengal in the descending
order. Among the states with significant area under flowers, productivity was higher in
Tamil Nadu (7.9 tonnes/hectare), Karnataka (7.5 tonnes/hectare), Andhra Pradesh (5.6
tonnes/hectare), Maharashtra (4.9 tonnes/hectare) and Gujarat (4.7 tonnes/hectare).
Table 1.6: Share of states in area and production of horticultural crops in India (TE 2009-
10)
Name of the state Area in
000
hectares
% share in
all India
Productio
n in 000
tonnes
% share
in all
India
Productivi
ty tones /
hectare)
Rank in
producti
vity
1 Maharashtra 2245 10.9 17637 8.2 7.9 21
2 Andhra Pradesh 1887 9.2 19643 9.1 10.4 16
3 Kerala 1764 8.6 10266 4.7 5.8 29
4 Karnataka 1719 8.4 14795 6.8 8.6 18
5 West Bengal 1679 8.2 25650 11.9 15.3 5
6 Uttar Pradesh 1530 7.4 25180 11.6 16.5 2
7 Orissa 1301 6.3 10597 4.9 8.1 20
8 Tamil Nadu 1259 6.1 19563 9.0 15.5 3
9 Bihar 1131 5.5 17281 8.0 15.3 4
10 Gujarat 1051 5.1 13921 6.4 13.2 10
11 Rajasthan 949 4.6 2014 0.9 2.1 34
12 Madhya Pradesh 558 2.7 5927 2.7 10.6 15
13 Assam 517 2.5 5695 2.6 11.0 14
14 Chhattisgarh 455 2.2 4302 2.0 9.4 17
15 Jammu & Kashmir 373 1.8 2876 1.3 7.7 22
16 Haryana 341 1.7 4083 1.9 12.0 11
17 Himachal Pradesh 291 1.4 1874 0.9 6.4 26
18 Uttrakhand 283 1.4 1787 0.8 6.3 28
19 Jharkhand 281 1.4 4049 1.9 14.4 7
20 Punjab 256 1.2 4576 2.1 17.9 1
21 Meghalaya 105 0.5 761 0.4 7.3 24
22 Goa 101 0.5 275 0.1 2.7 31
23 Arunachal Pradesh 94 0.5 245 0.1 2.6 33
24 Tripura 80 0.4 940 0.4 11.7 12
25 Manipur 65 0.3 477 0.2 7.3 23
26 Mizoram 65 0.3 413 0.2 6.4 27
27 Sikkim 63 0.3 172 0.1 2.7 32
28 Delhi 44 0.2 617 0.3 14.1 8
29 Nagaland 38 0.2 252 0.1 6.6 25
30 Andaman & Nicobar 35 0.2 126 0.1 3.6 30
31 Pondicherry 12 0.1 131 0.1 11.4 13
32 Lakshadweep 3 0.0 53 0.0 15.2 6
33 D & N Haveli 3 0.0 24 0.0 8.6 19
34 Chandigarh 0 0.0 3 0.0 14.0 9
35 Daman & Diu 0 0.0 0 0.0 1.3 35
All India 20579 100 216202 100 10.5 - Source: As Table 1.5.

9
Table 1.7: Share of states in area and production of fruit crops in India (TE 2009-10)
Name of the state Area
(000’
ha)
% Share in
all India
Productio
n (000’
tones)
% Share
in all
India
Productivi
ty tones /
hectare)
Rank in
producti
vity
1 Maharashtra 1468 24.1 10790 15.7 7.3 25
2 Andhra Pradesh 915 15.0 12180 17.8 13.3 12
3 Uttar Pradesh 340 5.6 4584 6.7 13.5 11
4 Gujarat 326 5.3 6219 9.1 19.1 4
5 Karnataka 322 5.3 5328 7.8 16.5 7
6 Kerala 314 5.1 2512 3.7 8.0 21
7 Tamil Nadu 301 4.9 7372 10.8 24.5 3
8 Bihar 290 4.8 3480 5.1 12.0 14
9 Orissa 284 4.7 1551 2.3 5.5 29
10 Jammu & Kashmir 203 3.3 1503 2.2 7.4 24
11 West Bengal 202 3.3 2801 4.1 13.9 10
12 Himachal Pradesh 201 3.3 573 0.8 2.8 32
13 Uttrakhand 179 2.9 722 1.1 4.0 30
14 Assam 115 1.9 1520 2.2 13.2 13
15 Chhattisgarh 115 1.9 1022 1.5 8.9 18
16 Madhya Pradesh 84 1.4 2158 3.1 25.7 2
17 Punjab 65 1.1 1201 1.8 18.6 5
18 Arunachal Pradesh 62 1.0 108 0.2 1.7 33
19 Jharkhand 49 0.8 452 0.7 9.2 17
20 Manipur 40 0.7 299 0.4 7.5 23
21 Haryana 38 0.6 269 0.4 7.2 26
22 Tripura 36 0.6 526 0.8 14.7 9
23 Rajasthan 35 0.6 528 0.8 15.2 8
24 Mizoram 31 0.5 218 0.3 6.9 28
25 Meghalaya 31 0.5 275 0.4 8.7 19
26 Nagaland 20 0.3 143 0.2 7.1 27
27 Goa 11 0.2 88 0.1 7.8 22
28 Sikkim 11 0.2 16 0.0 1.5 34
29 Andaman & Nicobar 3 0.0 25 0.0 8.2 20
30 D & N Haveli 2 0.0 20 0.0 10.7 16
31 Pondicherry 1 0.0 36 0.1 25.9 1
32 Lakshadweep 0 0.0 1 0.0 3.5 31
33 Chandigarh 0 0.0 1 0.0 11.0 15
34 Delhi 0 0.0 1 0.0 17.9 6
35 Daman & Diu 0 0.0 0 0.0 1.4 35
All India 6096 100 68522 100 11.2 Source: As Table 1.5.

10
Table 1.8: Share of states in area and production of vegetable crops in India (TE2009-10)
Name of the state Area in
000
hectares
% share in
all India
Productio
n in 000
tonnes
% share
in all
India
Productivi
ty tones /
hectare)
Rank in
producti
vity
1 West Bengal 1313 16.5 22356 17.1 17.0 10
2 Uttar Pradesh 990 12.5 20392 15.6 20.6 4
3 Bihar 829 10.4 13787 10.6 16.6 13
4 Orissa 676 8.5 8549 6.6 12.6 23
5 Maharashtra 452 5.7 6332 4.9 14.0 18
6 Karnataka 439 5.5 7391 5.7 16.8 12
7 Gujarat 404 5.1 7155 5.5 17.7 8
8 Andhra Pradesh 318 4.0 5213 4.0 16.4 14
9 Chhattisgarh 304 3.8 3192 2.4 10.5 25
10 Haryana 291 3.7 3719 2.9 12.8 20
11 Assam 275 3.5 3987 3.1 14.5 17
12 Tamil Nadu 271 3.4 8099 6.2 29.9 2
13 Madhya Pradesh 251 3.2 3379 2.6 13.5 19
14 Jharkhand 231 2.9 3582 2.7 15.5 16
15 Punjab 178 2.2 3235 2.5 18.2 7
16 Kerala 161 2.0 3502 2.7 21.8 3
17 Rajasthan 134 1.7 887 0.7 6.6 31
18 Uttrakhand 82 1.0 1037 0.8 12.7 21
19 Himachal Pradesh 73 0.9 1268 1.0 17.4 9
20 Jammu & Kashmir 63 0.8 1212 0.9 19.2 5
21 Meghalaya 44 0.6 395 0.3 9.0 28
22 Delhi 38 0.5 610 0.5 15.9 15
23 Tripura 31 0.4 388 0.3 12.7 22
24 Sikkim 23 0.3 114 0.1 4.9 32
25 Arunachal Pradesh 19 0.2 92 0.1 4.7 33
26 Manipur 16 0.2 170 0.1 10.5 26
27 Nagaland 10 0.1 73 0.1 7.1 30
28 Mizoram 9 0.1 115 0.1 12.3 24
29 Goa 7 0.1 67 0.1 10.1 27
30 Andaman & Nnicobar 4 0.1 34 0.0 7.9 29
31 Pondicherry 4 0.0 72 0.1 18.8 6
32 D & N Haveli 1 0.0 4 0.0 4.6 34
33 Lakshadweep 0 0.0 14 0.0 31.7 1
34 Daman & Diu 0 0.0 0 0.0 1.2 35
35 Chandigarh 0 0.0 2 0.0 17.0 11
All India 7940 100 130426 100 16.4 Source: As Table 1.5.

11
Table 1.9: Share of states in area and production of flower crops in India (TE 2009-10)
Name of the state Area
in
000
hectar
es
%
share
in all
India
Produc
tion in
000
tonnes
%
share
in all
India
Producti
on (cut
flower)
in 000
tonnes
%
share
in all
India
Produc
tivity
tones /
hectare
Rank in
productivi
ty
1 Tamilnadu 29 16.9 232 24.2 0 0.0 7.9 7
2 Karnataka 26 15.1 196 20.4 5809 10.0 7.5 8
3 West bengal 23 13.6 52 5.4 21027 36.1 2.2 16
4 Andhra pradesh 21 12.4 121 12.6 2069 3.6 5.6 9
5 Maharashtra 17 9.8 83 8.7 6457 11.1 4.9 10
6 Uttar pradesh 11 6.6 20 2.1 3118 5.4 1.7 17
7 Gujarat 11 6.2 50 5.2 5063 8.7 4.7 11
8 Haryana 6 3.4 59 6.1 1022 1.8 9.9 5
9 Delhi 6 3.2 6 0.6 1038 1.8 1.0 19
10 Orissa 5 2.9 19 1.9 5356 9.2 3.7 13
11 Madhya pradesh 4 2.4 3 0.3 0 0.0 0.7 21
12 Rajasthan 4 2.1 5 0.6 0 0.0 1.5 18
13 Chhattisgarh 3 1.7 9 1.0 0 0.0 3.1 15
14 Punjab 1 0.8 81 8.4 0 0.0 55.0 2
15 Arunachal pradesh 1 0.7 0 0.0 2860 4.9 0.0 22
16 Jharkhand 1 0.6 15 1.5 1165 2.0 13.4 3
17 Uttranchal 1 0.6 1 0.1 2309 4.0 0.8 20
18 Himachal pradesh 1 0.4 2 0.3 579 1.0 3.9 12
19 Pondicherry 0 0.2 2 0.3 0 0.0 8.5 6
20 Bihar 0 0.1 2 0.2 11 0.0 11.5 4
21 Jammu & kashmir 0 0.1 1 0.1 101 0.2 3.2 14
22 Sikkim 0 0.1 0 0.0 100 0.2 0.0 23
23 Mizoram 0 0.1 0 0.0 129 0.2 0.0 24
24 Andaman & nicobar 0 0.0 2 0.2 0 0.0 80.1 1
25 Nagaland 0 0.0 0 0.0 17 0.0 0.0 25
All India 173 100 959 100 58230 100 5.6 Source: As Table 1.5.

12
Table 1.10: Share of states in area and production of aromatic crops in India (TE 2009-
10)
Name of the state Area in
000
hectares
% share in
all India
Productio
n in 000
tonnes
% share
in all
India
Productivi
ty tones /
hectare)
Rank in
producti
vity
1 Rajasthan 239 53.6 116 24.8 0.5 9
2 Uttar Pradesh 134 30.0 13 2.9 0.1 12
3 Madhya Pradesh 24 5.3 141 30.1 6.0 2
4 Andhra Pradesh 20 4.5 78 16.7 3.9 5
5 Chhattisgarh 11 2.6 65 13.9 5.7 3
6 Tamil Nadu 9 1.9 25 5.3 2.9 6
7 Karnataka 3 0.7 17 3.7 5.7 4
8 Punjab 2 0.5 1 0.2 0.5 10
9 Orissa 2 0.4 0 0.1 0.3 11
10 Mizoram 1 0.3 9 1.9 6.2 1
11 Haryana 1 0.3 2 0.5 2.0 7
12 Jharkhand 0 0.0 0 0.0 0.0 13
13 Pondicherry 0 0.0 0 0.0 1.7 8
All India 446 100 469 100 1.1
Source: As Table 1.5.
In the case of aromatic and medicinal crops (Table 1.10), Rajasthan and Utter Pradesh
alone accounted for 84 percent area. While Rajasthan occupied 2.4 lakh hectares area
alone accounted for 54 percent share of total aromatic area in India and produced 1.2 lakh
tonnes of production thus, sharing 25 percent of total production in India. Utter Pradesh
with 1.3 lakh hectares occupied 30 percent share in area while it produced only 0.13 lakh
tonnes of output which was less than 3 percent production share in all-India. The other
major states occupying principal area and production of aromatic crops were Madhya
Pradesh, Andhra Pradesh, Chhattisgarh and Tamil Nadu. The highest productivity was
observed by Mizoram (6.2 tonnes/hectare) followed by Madhya Pradesh (6.0
tonnes/hectare), Chhattisgarh (5.7 tonnes/hectare), Karnataka (5.7 tonnes/hectare),
Andhra Pradesh (3.9 tonnes/hectare) and Tamil Nadu (2.9 tonnes/hectare). Karnataka
although lied at seventh place in area under aromatic crops but it had fourth position in
productivity thus contributed much higher in production 3.7 percent than its area share of
0.7 percent in all-India.
In the mid 1980s the horticulture sector was identified by the Government of India as a
promising emerging sector for agricultural diversification to enhance profitability through
efficient land use, optimum utilization of natural resources and creating employment for
rural masses. In the period 1948 to 1980, the main focus of the country was on cereals.
During 1980 to 1992 there was consolidation of institutional support and a planned
process for the development of horticulture. In the post 1993 period a focused attention
was given to horticulture development through an enhancement of plan allocation and
knowledge-based technology. This decade had been called a “golden revolution” in
horticultural production. The productivity of horticultural crops increased marginally
from 7.6 tonnes per hectare in 1991-92 to 8.8 tonnes per hectare in 2001-02 while area

13
under horticultural crops increased from 12.8 million hectares in 1991-92 to 16.6 million
hectares in 2001-02 (Table 1.2)
The Indian horticulture sector is facing severe constraints like low crop productivity,
limited irrigation facilities and underdeveloped infrastructure support like cold storages,
markets, roads, transportation facilities, etc. There are heavy post-harvest and handling
losses, resulting in low productivity per unit area and high cost of production. However,
on the other hand, India’s long growing-season, diverse soil and climatic conditions
provide sufficient opportunity to grow a variety of horticulture crops. Thus, efforts are
needed in the direction to capitalize on our strengths and remove constraints to meet the
goal of moving towards rapid horticultural growth in India. The foreign trade policy in
2004-09 emphasized the need to boost agricultural exports, growth and promotion of
exports of horticultural products. Horticulture contributes nearly 30 percent of GDP in
agriculture and 54 percent of export share in agriculture.
During the 10th
Five Year Plan, several schemes were launched to promote the
horticulture sector in the country. The National Horticulture Mission (NHM) was
initiated in 2005-06 by the Government of India, covering 340 districts and the
Technology Mission for Integrated Development of Horticulture in North Eastern states
including Sikkim, Jammu & Kashmir, Himachal Pradesh and Uttarakhand. The main
objective of this mission is to promote integrated development in horticulture, to help
coordinating, stimulating and sustaining the production and processing of fruits and
vegetables and to establish a sound infrastructure in the field of production, processing
and marketing with a focus on post-harvest management to reduce losses.
1.3 National Horticultural Mission
National Horticulture Mission is a Centrally Sponsored Scheme in which Government of
India provides 100 percent assistance to the State Mission during X Five Year Plan.
During XI Plan, the assistance from Government of India will be 85 percent with 15
percent contribution by the State Government. The main objective of the Scheme is to
develop horticulture to the maximum potential available in the states and to augment
production of all horticultural products including fruits, vegetables, flowers, plantation
crops, spices and medicinal and aromatic plants. The objectives of the mission are
highlighted below:
To provide holistic growth of the horticulture sector through an area based
regionally differentiated strategies;
To enhance horticulture production, improve nutritional security and income
support to farm households;
To establish convergence and synergy among multiple on-going and planned
programmes for horticulture development;
To promote, develop and disseminate technologies, through a seamless blend of
traditional wisdom and modern scientific knowledge;
To create opportunities for employment generation for skilled and unskilled
persons, especially unemployed youth;

14
To achieve the above objectives, the mission would adopt the following strategies:
(i) Ensure an end-to-end holistic approach covering production, post harvest
management, processing and marketing to assure appropriate returns to
growers/producers;
(ii) Promote R&D technologies for production, post-harvest management and
processing;
(iii) Enhance acreage, coverage, and productivity through (a) Diversification, from
traditional crops to plantations, orchards, vineyards, flower and vegetable gardens;
and (b) Extension of appropriate technology to the farmers for high-tech horticulture
cultivation and precision farming.
(iv) Assist setting up post harvest facilities such as pack house, ripening chamber, cold
storages, controlled atmosphere (CA) storages etc, processing units for value
addition and marketing infrastructure;
(v) Adopt a coordinated approach and promotion of partnership, convergence and
synergy among R&D, processing and marketing agencies in public as well as
private sectors, at the National, Regional, State and sub-State levels;
(vi) Where appropriate and feasible, promote National Dairy Development Board
(NDDB) model of cooperatives to ensure support and adequate returns to farmers;
(vii) Promote capacity-building and Human Resource Development at all levels.
The Scheme has been approved ‘in principle’ for implementation up to the end of XI Five
Year Plan. For implementation of the NHM programme in 18 States, an amount of 630
crore was provided during 2005-06, an amount of 1,000 crore during 2006-07, 1150
crore during 2007-08, while the outlay for the scheme during 2008-09 was 1100 crore.
Presently, the Scheme is being implemented in 18 States and 2 UTs covering 344 districts
of the country for the development of potential crops. The pattern of assistance was 100
percent to the state governments during X Plan. With effect from the XI Plan (2007-08),
the state governments are contributing 15 percent of the share.
1.4 Need for the study
The Scheme was in operation effectively for about five years in 2009-10 and already
completed four years up to 2008-09. It would be necessary to analyse the impact of the
programme vis-à-vis objectives of the NHM scheme especially for the major focused
crops in terms of area expansion, increase in production and productivity. Since, the
focus was on cluster approach for holistic development of potential crops, it was planned
to undertake an in-depth study in respect of selected crops taken up for horticultural
development in some selected states. We therefore, carried out crop based impact
evaluation study in different NHM states through the Agro Economic Research Centres
(AERCs) led by the Agriculture Development and Rural Transformation (ADRT) Centre
based in Bangalore.
1.5 Objectives of the study
The study focuses on the following objectives:
15
Assess the impact in terms of increase in area, production and productivity of
identified horticultural crops covered under NHM, keeping 2004-05 as the base
year in the state in general and for the identified crops in particular.
Extent to which the scheme has helped in creating employment opportunities and
enhancement of income of the farmers.
Suggest measures in improving the implementation strategy.
1.6 Methodology, scope and data base
The study would indicate the details of pre-project (2004-05) and current level of area
coverage, production and productivity of identified horticulture crops covered under
NHM in different states through area expansion, rejuvenation, protected cultivation, INM
(integrated nutrient management) / IPM (integrated pest management). Survival and
growth of horticulture crops together with their production and productivity also need to
be indicated. Further, the study should provide details of the coverage and production of
the identified crops in the selected states. The study should also indicate the name of
varieties of horticulture crops adopted for area expansion, its quality, source of
procurement, certification etc. Methodology adopted for the study is given below:
The study is based on both primary as well as secondary data. The secondary information
has been collected from the National Horticulture Board (NHB) and the Horticultural
Department of various states, as well as, Directorate of Economics and Statistics,
Government of India. The second chapter is based on secondary data presenting the status
of horticultural crops in the selected states. The details of selected crops in seven selected
states is presented during the historical period and their growth rate for the historical
period and pre (2000-01 to 2004-05) and post (2004-05 to 2008-09) period. The primary
data was collected through intensive sample survey of the selected farmers through
structured questionnaire by visits and personal interviews. Main reliance of the study has
been on primary data.
In order to see the working of NHM at the ground level, in terms of area and yield
expansion at the household level and distribution of stipulated subsidies and various tools
and implements among the households growing horticultural crops, a household survey
was carried out among a selected number of households growing various horticultural
crops. Following the directions from the Ministry of Agriculture, two crops namely
mango and sweet orange were selected in Andhra Pradesh; mango and litchi were
selected in Bihar; kinnow, guava, anola and garlic were selected in Haryana; grapes,
pomegranates, flowers and aromatic/medicinal crops were selected in Karnataka; anola,
papaya, coriander and mango were selected in Rajasthan; banana, mango and flowers
were selected in Tamil Nadu and pineapple and mandarin oranges were selected in West
Bengal. For these selected crops, 200 households each were surveyed in Andhra Pradesh
and Rajasthan; 150 households were surveyed in Haryana and Tamil Nadu each; 100
households were surveyed in West Bengal and Bihar each; and 212 households were
surveyed in Karnataka. For the selection of districts, villages and households the
following procedure was adopted.

16
As per instructions of the Ministry of Agriculture, two to four districts, were selected for
the detailed primary survey in each state. The names of the districts selected in each state
is given in Annexure Table 1.1A. Two villages were selected, keeping into account the
cropping pattern in each of these districts taking one village near the periphery of district
headquarters or accessible mandi/market and one village from a distant place to realize
the effect of distance factor in the findings. From the selected districts, a list of total
number of beneficiary farmers was obtained from the concerned district/block level
authorities. From each selected village, 25 beneficiary farmers were selected using
random sampling method for detailed household survey. In this way, a total number of
100 to 200 beneficiary farmers were surveyed in details in each selected state. While
selecting the sample care was taken to represent all the section of the society such as
small and marginal farmers, SC/ST farmers and women folk, so that outreach of the
programme to these sections is also reflected in the study/report. Members of Growers
Associations, Gram Pradhan, Block and District level concerned functionaries were also
contacted or interviewed. The detail of selected districts and farmers is given in Annexure
Table 1.1A. The reference period for the selected sample was 2008-09 while survey was
carried out in March-April 2010. The study covers the implementation of the NHM
programme from 2005-06 to 2008-09.
1.7 Overview
The report has six chapters including the present one which provides details about the
horticultural crops grown in the country, share of horticulture in the total cropped area
and share of different states in the horticultural area and production. It also outlines the
main objectives, data base and methodology followed in the study. The second chapter is
based on secondary data which outlines area, production and productivity of horticultural
crops in seven selected states during the historical period as well before and after the
implementation of NHM Programme. The chapter also discusses The next three chapters
are based on primary household survey carried out in seven states among the NHM
beneficiaries. Chapter 3 presents household characteristics, cropping pattern and output
produced of various crops grown by the households including foodgrains, oilseeds,
commercial crops and horticultural crops.
Chapter 4 discusses production structure and resource use under horticultural crops. The
chapter presents economics of production, cost and resources use including labour use for
the selected horticultural crops in the seven states. A comparative analysis of net returns
per acre from the selected horticultural crops with the other foodgrains and commercial
crops grown by the selected farmers is carried out. The chapter also tracks the marketing
channels and on farm processing activities in the selected states. Chapter 5 probes impact
of NHM on the expansion of horticultural crops in the selected states. The time series
data on area, production and yield collected from the farmers is anslysed to see whether
selected farmers’ area expended after NHM. Rejuvenation activities, NHM resource and
subsidy provision to the selected households and farmers’ perception about the NHM are
analysed in the chapter. The last chapter 6 summarizes the main findings and presents
policy suggestions.

17
Chapter 2
Area, Production and Productivity of
Horticultural Crops in Selected States
2.1 Growth of horticultural crops in Karnataka
Karnataka has high potential for horticultural crops and the state ranks fourth in area
under horticultural crops. Horticulture generates 40 percent of the total income of the
state. The state is preparing strategies to ensue more flexibility and advancement in
cultivating various fruits, vegetables and other horticultural crops which is adding value
to Karnataka's economy to a great extent. Annexure Table 2.1A presents area and
production of horticultural crops in Karnataka during the last 30 years. Area under fruit
crops in the state gradually increased from 1.53 lakh hectares in TE 1980-81 to 2.99 lakh
hectares in TE 2008-09. In consonance with area, production of fruits also increased in
the state from 24 lakh tonnes in the TE 1980-81 to 51 lakh tonnes in TE 2008-09. Area
under vegetables increased from 1.2 lakh hectares in TE 1980-81 to 4.2 lakh hectares in
TE 2008-09. Production of vegetables increased from 19 lakh tonnes in TE 1980-81 to 70
lakh tones in TE 2008-09. There was small area under commercial flowers in 1980s. The
recorded area under commercial flowers in TE 1980-81 was 4000 hectares that steeply
increased to 25 thousand hectares in TE 2008-09. Production of commercial flowers
increased from 23 thousand tonnes in TE 1980-81 to 195 thousand tonnes in TE 2008-09.
As was discussed in the previous chapter medicinal and aromatic plants are
commercialized only during the recent periods. Karnataka stands 7th
place in area under
aromatic and medicinal plants. In TE 2003-04 only a miniscule area of 500 hectares was
under medicinal plants and 1000 hectares under aromatic crops. In TE 2008-09 the area
under medicinal plants was almost three times, 1500 hectares while there was no further
increase in area under aromatic crops. Despite increase in area under medicinal plants,
production of medicinal as well as aromatic plants, either remained stagnant or declined
indicating no further increase in their productivity. Similarly, area under plantation
increased till the early 1990s but experienced stagnation thereafter and their production
started declining in the late 1990s. The production of spices was measured 12.8 lakh
tones in the TE 1980-81 that declined to 10.9 lakh tones in TE 2008-09. On account of
expansion in area under fruits, vegetables and commercial flowers, overall area under
horticultural crops in Karnataka increased persistently during the last 30 years.
Horticultural area increased from 9 lakh hectares in TE 1980-81 to 18 lakh hectares in TE
2008-09. The production increased from 56 lakh tonnes in TE 1980-81 to 134 lakh tonnes
in TE 2008-09.
Table 2.1a presents the compound annual growth rate of area and yield of horticultural
crops in Karnataka and their corresponding, ‘t’ values that indicate the significance level
of growth for different periods. The growth rates are estimated using the semi lag trend
for three different periods, i.e., 1980-81 to 1990-91 (1980s), 1990-91 - 2000-01 (1990s)
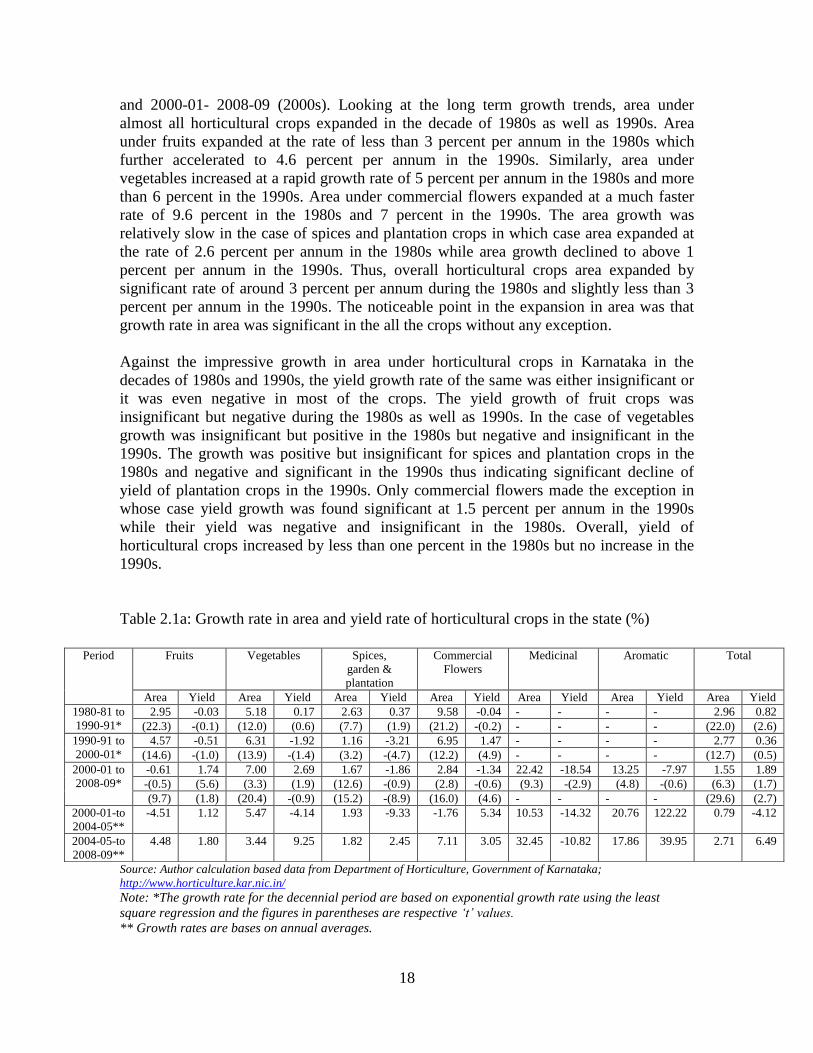
18
and 2000-01- 2008-09 (2000s). Looking at the long term growth trends, area under
almost all horticultural crops expanded in the decade of 1980s as well as 1990s. Area
under fruits expanded at the rate of less than 3 percent per annum in the 1980s which
further accelerated to 4.6 percent per annum in the 1990s. Similarly, area under
vegetables increased at a rapid growth rate of 5 percent per annum in the 1980s and more
than 6 percent in the 1990s. Area under commercial flowers expanded at a much faster
rate of 9.6 percent in the 1980s and 7 percent in the 1990s. The area growth was
relatively slow in the case of spices and plantation crops in which case area expanded at
the rate of 2.6 percent per annum in the 1980s while area growth declined to above 1
percent per annum in the 1990s. Thus, overall horticultural crops area expanded by
significant rate of around 3 percent per annum during the 1980s and slightly less than 3
percent per annum in the 1990s. The noticeable point in the expansion in area was that
growth rate in area was significant in the all the crops without any exception.
Against the impressive growth in area under horticultural crops in Karnataka in the
decades of 1980s and 1990s, the yield growth rate of the same was either insignificant or
it was even negative in most of the crops. The yield growth of fruit crops was
insignificant but negative during the 1980s as well as 1990s. In the case of vegetables
growth was insignificant but positive in the 1980s but negative and insignificant in the
1990s. The growth was positive but insignificant for spices and plantation crops in the
1980s and negative and significant in the 1990s thus indicating significant decline of
yield of plantation crops in the 1990s. Only commercial flowers made the exception in
whose case yield growth was found significant at 1.5 percent per annum in the 1990s
while their yield was negative and insignificant in the 1980s. Overall, yield of
horticultural crops increased by less than one percent in the 1980s but no increase in the
1990s.
Table 2.1a: Growth rate in area and yield rate of horticultural crops in the state (%)
Source: Author calculation based data from Department of Horticulture, Government of Karnataka;
http://www.horticulture.kar.nic.in/
Note: *The growth rate for the decennial period are based on exponential growth rate using the least
square regression and the figures in parentheses are respective ‘t’ values.
** Growth rates are bases on annual averages.
Period Fruits Vegetables Spices,
garden &
plantation
Commercial
Flowers
Medicinal Aromatic Total
Area Yield Area Yield Area Yield Area Yield Area Yield Area Yield Area Yield
1980-81 to
1990-91*
2.95 -0.03 5.18 0.17 2.63 0.37 9.58 -0.04 - - - - 2.96 0.82
(22.3) -(0.1) (12.0) (0.6) (7.7) (1.9) (21.2) -(0.2) - - - - (22.0) (2.6)
1990-91 to
2000-01*
4.57 -0.51 6.31 -1.92 1.16 -3.21 6.95 1.47 - - - - 2.77 0.36
(14.6) -(1.0) (13.9) -(1.4) (3.2) -(4.7) (12.2) (4.9) - - - - (12.7) (0.5)
2000-01 to
2008-09*
-0.61 1.74 7.00 2.69 1.67 -1.86 2.84 -1.34 22.42 -18.54 13.25 -7.97 1.55 1.89
-(0.5) (5.6) (3.3) (1.9) (12.6) -(0.9) (2.8) -(0.6) (9.3) -(2.9) (4.8) -(0.6) (6.3) (1.7)
(9.7) (1.8) (20.4) -(0.9) (15.2) -(8.9) (16.0) (4.6) - - - - (29.6) (2.7)
2000-01-to
2004-05**
-4.51 1.12 5.47 -4.14 1.93 -9.33 -1.76 5.34 10.53 -14.32 20.76 122.22 0.79 -4.12
2004-05-to
2008-09**
4.48 1.80 3.44 9.25 1.82 2.45 7.11 3.05 32.45 -10.82 17.86 39.95 2.71 6.49

19
In the present decade of 2000s, there was some reversal in area and yield growth rates.
The fruits crops that had impressive growth rate in area during the 1980s and 1990s,
observed negative but insignificant growth in area while had significant 1.7 percent
growth in yield rate during the 2000s. Vegetables continued accelerating their area
expansion in the 2000s as well, whereby area under vegetables expanded at even faster
rate of 7 percent per annum. Their yield also experienced around 2.7 percent growth rate,
albeit significant at 10 percent level. In the case of spices and commercial flowers, their
area continued expanding at the rate of 1.7 and 2.58 percent per annum, respectively but
their yield growth rate was negative and insignificant. In the 2000s, medicinal and
aromatic crops entered in the state at a commercial scale and their area jumped at a rate
of 22 and 13 percent per annum, respectively. However, even these new entry crops
failed in observing increase in their yield rate and over the whole period yield had a
significant and very high negative growth rate, at least in the case of medicinal crops
while negative yield growth in aromatic crops was not significant. At the overall, area
under horticultural crops in Karnataka grew at an annual growth rate of 1.6 percent in the
2000s while yield increased at 1.9 percent whereby yield growth was not significant
(Table 2.1a).
To see the effect of National Horticultural Mission (NHM) on the expansion in area and
yield of horticultural crops, we have bifurcated the period of 2000s into 2000-01 to 2004-
05 (before NHM) and 2004-05 to 2008-09 (after NHM). Although it is difficult to
attribute any expansion in area or yield in the post NHM period exclusively to the
programme of NHM, yet it indicates whether there has been any increase in the growth in
area and yield after the implementation of NHM. The growth accelerated in both area and
yield in the case of fruits but area growth declined for vegetables while their yield growth
rate accelerated. In the case of commercial flowers and medicinal crops, while area
growth increased but yield growth rate declined and it was an opposite case for spices in
whose case while area declined but yield growth expanded. Last but not the least, the
growth in area and yield, both declined in the case of aromatic crops which observed
massive increase in area in the early 2000s but stagnated in the later period. At the
aggregate, NHM seems to have overall positive effect on the horticultural crops as area
growth increased from 0.8 percent per annum during the before NHM period of 2000-
2004 to 2.7 percent per annum during the post NHM period of 2004-2008. Similarly,
yield growth rate that was negative during the before NHM period (-4.1 percent per
annum), observed a very high growth rate of 6.5 percent per annum during the post NHM
period. This issue needs deliberation in much more details that we shall be presenting in
the next chapters.
The discussion up to now presented the trends in area, production and productivity of
horticultural crops at the state level in Karnataka. In the following discussion we try to
grasp the area and production trends of our selected horticultural crops, namely grapes,
pomegranate, flowers and aromatic and medicinal crops. For grapes, data on area and
production was available only from 1991-92 onwards. Similarly for pomegranate, data
was available only from 2001-02 onwards. Data for aromatic and medicinal plants was
available from 1999-00 onwards. Annexure Table 2.2A presents statistics on area and
production of our selected crops.
20
The impact of National Horticultural Mission is depicted more clearly by statistics in
Table 2.1b that shows growth trends in area and yield during the historical period as well
as for the pre and post NHM period for the selected horticultural crops. Area under
grapes increased at a significant rate of 5 percent per annum in the 1990s which further
went up by an impressive rate of 11 percent per annum in the 2000s. Dividing the period
of 2000s into before and after NHM, the area under grapes increased at a rate of 9.4
percent per annum in the before NHM period (2000-01 to 2004-05) to 9.8 percent per
annum in the after NHM period (2004-05 to 2008-09). However, against the impressive
growth in area under grapes, their yield growth rate was only 1 percent per annum in the
1990s that turned negative (-4 percent per annum) in the 2000s. The decline in yield rate
was much sharper in the first four years i.e., before starting of NHM, while some reversal
took place after implementation of NHM. The growth in yield rate was -7 percent per
annum in the pre NHM period which came down to -0.08 percent per annum in the post
NHM period. Thus, whereas National Horticultural Mission helped in increasing area
under grapes in Karnataka, it helped in reversing the decline in yield rate that was
happening at a very rapid pace before the implementation of this programme.
Expansion in area and yield under pomegranate in Karnataka was negligible during
2000s, the only decade for which data is available. Growth in area under pomegranate
was negative but insignificant while yield growth rate was positive but insignificant.
Breaking the period into pre and post NHM indicates that area growth was -1.5 percent
per annum before beginning of NHM but turned positive (3.5 percent per annum) after
the implementation of NHM. On the opposite, yield growth was positive (0.5 percent per
annum) before NHM but it turned negative (-1.2 percent per annum) after the
implementation of NHM Programme. Thus, effect of NHM on the pomegranate crop
remains indeterminate. Area under flowers expanded rapidly in the 1980s but the
momentum declined subsequently. The rate of growth in expansion of area under flowers
was 9.6 percent per annum in the 1980s which declined to 7 percent per annum in the
1990s and the impetus further came down to 2.5 percent per annum in the 2000s.
However, yield growth never touched the exhilaration that was seen in the expansion of
area in flowers. The exponential growth rate of yield was negative and insignificant in the
1980s, it turned positive and significant in the 1990s and 2000s and the volume of growth
was around 1.6 to 1.7 percent during this period.
Looking at pre and post NHM period, area growth of flowers was -2.5 percent per annum
in the pre NHM period that turned positive and the volume increased to 7.6 percent per
annum in the post NHM period. Yield on the other hand was impressive 4 percent per
annum in the pre NHM period that turned to almost negligible in the post NHM period.
In the case of aromatic and medicinal crops, area expansion in the 2000s was very high as
the crop came into existence only in the 2000s. Yield, however, remained fluctuating
depending on the weather and other climatic conditions. On the overall, although effect
of National Horticultural Mission is visible on the area expansion of selected horticultural
crops, however, its effect on the yield rate is yet to be seen. As agriculture in Karnataka is
heavily dependent on rain, Karnataka being the second most rainfed state in the country,
large fluctuations are observed in the yield of selected crops and any initiative under

21
NHM is bound to take more time as capital investment made on drip irrigation and other
such techniques shall have a lagged effect.
Table 2.1b: Growth rate$ in area and yield rate of horticultural crops in Karnataka (%)
Period Grapes Pomegranates Flowers A & M Plants
Area Yield Area Yield Area Yield Area Yield
1980-81 to 1990-91* -
-
-
-
9.58
(21.2)
-0.04
-(0.2)
-
-
1990-91 to 2000-01* 5.18
(2.8)
1.10
(1.7)
-
-
6.99
(12.6)
1.74
(4.4)
-
-
2000-01 to 2008-09* 10.85
(5.2)
-3.94
-(3.6)
-0.34
-(0.3)
0.54
(0.7)
2.53
(2.3)
1.61
(2.8)
47.87
(5.4)
-16.28
-(1.9)
2000-01-to 2004-05** 9.36 -7.18 -1.46 0.53 -2.45 4.10 150.67 -22.55
2004-05-to 2008-09** 9.75 -0.08 3.46 -1.22 7.58 -0.18 11.49 12.64
Source: Author calculation on data from Department of Horticulture, Government of Karnataka;
http://www.horticulture.kar.nic.in/
Note: *The growth rate for the decennial period are based on semi log time trend and the figures in/
parentheses are respective ‘t’ values
** Growth rates are bases on annual averages.
$ Because of wide fluctuations in the data, all growth rates are calculated on Triennium averages (TE).
2.2 Growth of horticultural crops in Andhra Pradesh
The details of area and production of horticultural crops in the state are presented in
Annexure Table 2.3A. Over a period of three decades, the area under various horticultural
crops increased from 4.33 lakh hectares in TE 1980-81 to 19.43 lakh hectares in TE
2009-10. On the other hand, the production increased from 4.60 lakh tones in 1980-81 to
198.38 lakh tonnes in 2009-10. The increase in area and production of horticultural crops
was largely contributed by increasing trends reported by fruits and vegetable crops. Data
on production of spices, garden and plantation crops, commercial flowers (during 1980-
81 to 1996-97) and medicinal and aromatic plants (during 1980-81 to 2000-2001) was not
available and thereby has not been reported.
Table 2.2a: Growth rate in area and yield rate of selected horticultural crops in Andhra
Pradesh (%) Period Fruits Vegetables Spices, Garden
& Plantation
Commercial
Flowers
Medicinal &
Aromatic Plants
Total
Area Yield Area Yield Area Yield Area Yield Area Yield Area Yield
1980-81 to
1990-91*
3.62
(34.19)
10.61
(7.43)
6.111
(7.56)
-2.44
(-1.98)
-2.70
(-0.60)
-- 3.30
(5.27)
-- -1.30
(-1.4)
-- -2.47
(-1.27)
14.58
(4.87)
1990-91 to
2000-01*
3.69
(6.61)
10.60
(6.08)
10.31
(7.00)
22.38
(9.33)
23.44
(4.41)
-- 1.04
(4.14)
-- -14.03
(-3.0)
-- 8.89
(8.44)
11.68
(5.04)
2000-01 to
2008-09*
4.87 (11.99)
0.39 (0.22)
3.16 (5.16)
1.97 (1.55)
4.77 (5.29)
0.87 (-0.46)
5.00 (3.48)
5.13 (1.83)
8.34 (1.45)
8.79 (-0.79)
3.95 (18.98)
4.98 (9.42)
TE2000-01 to
TE2004-05**
13.70 -0.88 0.16 0.50 -7.15 0.55 275.4 192.6 3.71 1.79
TE2004-05 to
TE2008-09**
-0.43 8.82 4.98 -2.75 19.95 2.32 12.87 8.16 36.19 49.54 4.47 7.37
Source: Andhra State Report Submitted by AERC, Waltair
Note: * The Growth Rate for the Decennial Period are based on Semi log time trend and the figures in parentheses are
respective ‘t’ values
** Growth rates are based on annual averages.

22
Table 2.2a shows the growth rates of area and yield under various categories of
horticultural crops in the state. During the 1980s, the total area under horticultural crops
showed a significant negative trend (-2.5), while the yield recorded a positive growth
(14.6). Among horticultural crops in the state, fruits and vegetables and commercial
flowers showed a positive and significant growth in their area during the 1980s. With
respect to yield, only fruit crops reported a positive and significant growth during the
same time period, while vegetable crops reported a significant negative growth (-2.4) in
yield. During the period of 1990s significant positive growth was reported in area and
yield of fruits, vegetable crops and the total horticultural crops. In the period 2000s,
fruits, vegetables and commercial flowers reported a positive and significant growth in
area and yield.
Dividing the period of 2000s into pre (2000 to 2004) and post (2004-2008) NHM, it is
seen from the growth rate statistics that the growth in area of fruits was very high in the
before NHM period while yield rate was negative and insignificant during this period. In
the post NHM, growth in area declined to zero while yield rate increased by more than 8
percent in the case of fruits. In the case of vegetables, growth and yield was almost
negligible in the pre NHM but area growth increased to 5 percent per annum whereas
yield rate fell by more than 2.7 percent per annum in the post NHM period. The growth
rate in area as well as yield rate of flowers decreased in the post NHM period compared
to pre NHM period while area and yield growth rate increased in the case of plantation
and aromatic and medicinal crops. At the overall, area under all horticultural crops
increased at a rate of 3.7 percent per annum in the pre NHM period that increased to 4.3
percent per annum in the post NHM period while yield growth rate increased from 1.7
per annum in the pre NHM to 7.4 percent per annum in post NHM period. Thus, clearly,
the implementation of National Horticulture Mission Scheme helped increasing area as
well as yield rate of horticultural crops in Andhra Pradesh.
Annexure Table 2.4A presents the time series data on the area and production of mango
and sweet orange the two crops selected in Andhra Pradesh. The production of mango
and sweet orange crops significantly increased over a period of 30 years in Andhra
Pradesh. Table 2.2b shows the growth rate of area and yield under mango and sweet-
orange crops for the last three decades. During the period of 1980s, area growth rate for
mango and sweet orange was found statistically significant and the magnitude was
around 3.7 and 4.4 percent per annum, respectively. The yield data was not available.
During the 1990s, the coefficient of area and yield for mango crop was found statistically
significant, while the sweet-orange crop reported a positive and significant growth only
in the case of area while data for yield was not available. For the period 2000s both
mango and sweet-orange crops reported a positive and significant growth in the case of
area while mango crop had positive growth, sweet orange crop reported negative growth
in the yield (-2.86). Looking at the before and after NHM periods, both mango and sweet
orange observed rapid growth in area during both the period, while area growth was
slightly less in the post NHM period compared to pre NHM period. On the other hand,
the yield growth rate was negative in the pre NHM period for both the crops that turned
positive for mango while remained negative for the sweet orange in the post NHM
period. Nonetheless, the NHM did not appear to have helped the selected crops in

23
expanding its area or increasing the yield level of these two selected crops in Andhra
Pradesh.
Table 2.2b: Growth rate in area and yield rate of selected horticultural crops in Andhra
Pradesh (%)
Period Mango Sweet Orange
Area Yield Area Yield
1980-81 to 1990-91$ 3.734
(17.50)
-- 4.431
(6.49)
--
1990-91 to 2000-01$ 4.4
(17.12)
5.0
(2.28)
2.573
(17.86)
--
2000-01 to 2008-09$ 6.728
(22.98)
0.219
(0.65)
20.70
(13.80)
- 2.866
(-4.38)
2000-01 to 2004-05** 5.63 -0.04 22.63 -2.83
2004-05 to 2008-09** 4.45 1.15 12.05 -0.34 Source: Andhra State Report Submitted by AERC, Waltair
Note: $ The growth rates are based on semi log trend and the parentheses refer to t’ values
** Growth rates are annual averages
2.3 Growth of horticultural crops in Bihar
Time series data for various constituents of horticultural sub sectors was not available for
Bihar. An analysis of the triennium ending averages of area and production of
horticultural crops in the state (Annexure Table 2.5A) reveals that both fruits and
vegetables signify a steady growth in terms of area and production since 1990-91. The
data on area and production of fruits, vegetables, spices, flowers and medicinal and
aromatic crops show moderate increase in production of these crops from 1990-91 up to
2009-10. A detailed analysis of percentage growth in area and yield of different
horticultural crops in Bihar revealed that during the decade of 1990s, fruits area increased
by less than 2 percent per annum while vegetables area decelerated significantly (Table
2.3a). The growth in yield was negligible in fruits and negative in vegetables in Bihar.
However, there was complete reversal in the growth of area as well as yield level of both
fruits and vegetables during the 2000s. In particular, while the rate of growth of fruits
area stood 8.82 per cent, vegetables grew by more than 40 percent. Similarly, yield rate
also increased by around 25 percent for fruits as well as vegetables during the decade of
2000s. The expansion in area as well as yield level of horticultural crops in the decade of
2000s indicate the positive contribution of NHM in Bihar. Breaking the period of 2000s
into pre and post NHM periods, one can observe that the fruits area declined in the post
NHM period but its yield rate increased at a rapid rate. In all other crops, namely,
vegetables, spices and flowers, not only area expanded in the post NHM but also their
yield increased indicating the positive effect of NHM programme in Bihar.
As stated earlier mango and litchi crops were selected for this study in Bihar. After
carving out Jharkhand state from old Bihar in 2000, the area and yield under both the
selected crops have increased in the state (Annexure Table 2.6A). Data presented in
Table 2.3b reveals that the area and yield of mango rose by 0.35 per cent and 0.6 per cent,
respectively during the period of 2000-01 to 2008-09. Litchi area increased by around 9
percent per annum while yield rate declined by the same rate of around 9 percent.

24
Table 2.3a: Growth in area and yield of horticultural crops (%)
Year Fruits Vegetables Spices, Garden &
Plantation
Commercial
Flowers
Medicinal &
Aromatic
A Y A Y A Y A Y A Y
1990-91 to 2000-01 1.87 0.95 - 31.44 - 20.55 0.00 0.00 0.00 0.00 0.00 0.00
2000-01 to 2009-10 8.82 24.95 46.19 24.71 0.00 0.00 0.00 0.00 0.00 0.00
2000-01 to 2004-05 6.99 - 5.20 - 14.53 11.24 0.00 0.00 0.00 0.00 0.00 0.00
2004-05 to 2008-09 -0.34 28.02 67.41 4.86 39.56 13.59 318.44 32.44 0.00 0.00
Source: Bihar State Report Submitted by AERC, Bhagalpur
Table 2.3b: Growth rate in area and yield of selected Horticultural Crops in
Bihar (%)
Year Crop – I (Mango) Crop - 2 (Litchi)
Area Yield Area Yield
1990-91 to 2000-01 NA NA NA NA
2000-01 to 2008-09 0.351 0.610 9.82 -8.60
2000-01 to 2004-05** (-) 0.352 0.973 7.420 (-) 3.413
2004-05 to 2008-09** 0.714 13.410 1.848 1.464 Source: Bihar State Report Submitted by AERC, Bhagalpur
** Growth rates are based on annual averages.
During the pre NHM period there was almost no growth in the area as well as yield of
mango crop while its yield rate increased by almost 13.5 percent per annum during the
post NHM period. In the case of litchi, there was 7 percent per annum growth in area in
the pre NHM period while yield growth rate was negative during the same period. In the
post NHM period, its area as well as yield increased by around 1.5 to 2 percent per
annum. Thus, it is difficult to conclude that NHM really helped in expansion of area of
the selected crops while there is some conclusive evidence of rise in the yield rate of the
selected crops during the post NHM period.
2.4 Growth of horticultural crops in Rajasthan
With the concerted efforts of State Horticulture Department, the area under various
horticultural crops in Rajasthan has increased to 9.23 lakh hectares, including 0.31 lakh
hectares under fruit crops, 1.26 lakh hectares under vegetable crops, 5.37 lakh hectares
under spice crops, 0.033 lakh hectares under flowers and 2.26 lakh hectares under
medicinal and aromatic crops. Given the gross cropped area of 221 lakh hectares,
horticulture area accounted for 4.18 per cent of the gross cropped area during 2008-09 in
the state.
Annexure Table 2.7A shows the area and production of various horticultural crops in
Rajasthan from TE 1980-81 to TE 2008-09 and their growth rates are depicted in Table
2.4a. It may be noted that total area under all horticultural crops increased from 3.23 lakh
hectares during TE 1980-81 to 8.71 lakh hectares during TE 2008-09. Total horticultural
production increased from 1.85 lakh metric tonnes (MT) during TE 1980-81 to 18.48
lakh MT during TE 2008-09 in the state. The growth in area and production of
horticultural crops was not steady as both the area and production observed fluctuations
during the period under study.

25
As revealed by Table 2.4a, the area under horticultural crops in Rajasthan grew at an
annual rate of 4.5 percent per annum while yield rate increased by 11 percent per annum
during the decade of 1980s. Growth in area further increased to 4.63 percent per annum
during the 1990s while yield growth decelerated to almost zero during the same time
period. The trends in growth of area and yield reversed during the next decade of 2000s.
The growth rate of area decreased to 0.64 per cent per annum whereas yield rate
increased by 7.5 per cent per annum during 2000s.
It may be noted that whereas the area under horticultural crops was almost stagnant in the
pre NHM period whereby it grew by only 0.5 percent per annum, the area increased at a
rapid pace of above 5 percent per annum in the post NHM period exceeding all previous
long term growth rate of area expansion in horticultural crops in the state. However, in
the case of yield growth rate there was completely an opposite trend. The yield rate of
horticultural crops increased by around 5 percent per annum before NHM period (2000 to
2004) while it decelerated to 1 percent per annum in the post NHM period. Looking at
sub categories of horticultural crops like fruits, vegetables, spices, flowers and medicinal
crops, the instability in growth of yield was much higher than the instability in growth of
area under these crops. The growth rate of area under fruits decreased to -0.28 per cent
per annum during the period of 1990s from 3.78 per cent per annum in the 1980s. The
rate of growth of area under fruits once again increased to 4.99 per cent per annum during
the period of 2000s. The growth rate of area and yield of vegetables was 4.0 per cent and
7.19 per cent, respectively during the period of 1980s, that changed to 3.48 per cent and
6.44 per cent, respectively during the 2000s. The growth rate of area and yield of spices
was 3.55 and 14.93 per cent, respectively during the period 1980s, which sharply
declined to -2.14 per cent and -2.97 per cent, respectively during the period of 2000s. The
growth rate of area under medicinal crops continuously declined from 11.67 per cent
during the period of 1980s to 0.99 per cent during the period of 2000s while the growth
rate of yield of medicinal crops was negative throughout the same period. Though the
growth rate of area under flowers fell on an average, the growth rate of yield of flowers
satisfactorily increased during the period of 1980s to 2000s.
Table 2.4a: Growth rate in area and yield of horticulture crops in Rajasthan (%)
Period Fruits Vegetables Spices Flowers Medicinal Total Horti.
Area Yield Area Yield Area Yield Area Yield Area Yield Area Yield
1980-81 to
1990-91*
3.78 -6.35 4.00 7.19 3.55 14.93 NA NA 11.67 -8.71 4.47 11.01
(0.75) (-1.84) (6.94) (5.82) (2.66) (6.50) NA NA (4.27) (-2.53) (4.87) (9.46)
1990-91 to
2000-01*
-0.28 8.09 5.46 -2.33 3.61 0.41 -2.60 3.57 9.51 -1.31 4.63 0.74
(-1.303) (3.16) (9.13) (-2.95) (1.91) (0.31) (-0.39) (0.68) (6.03) (-0.87) (3.20) (0.83)
2000-01 to
2008-09*
4.99 8.99 3.48 6.44 -2.14 -2.97 9.07 3.14 5.63 -3.95 0.64 7.47
(16.85) (3.48) (1.98) (5.08) (-0.66) (-0.46) (3.43) (0.81) (3.97) (-2.24) (0.29) (3.46)
2000-01 to
2004-05**
2.86 -1.33 6.14 4.29 -1.18 4.59 8.93 -7.83 0.99 -1.81 0.53 4.98
2004-05 to
2008-09**
5.00 7.69 0.43 3.20 5.10 -0.43 0.25 12.22 8.36 -2.41 5.10 1.01
Source: Rajasthan State Report Submitted by AERC, Vallabh Vidyanagar
Notes : (1)* The growth rate for the decennial period are based on semi log time trend and the figures in the
parentheses are respective ' t' values.
(2) ** Growth rates are based on annual averages.
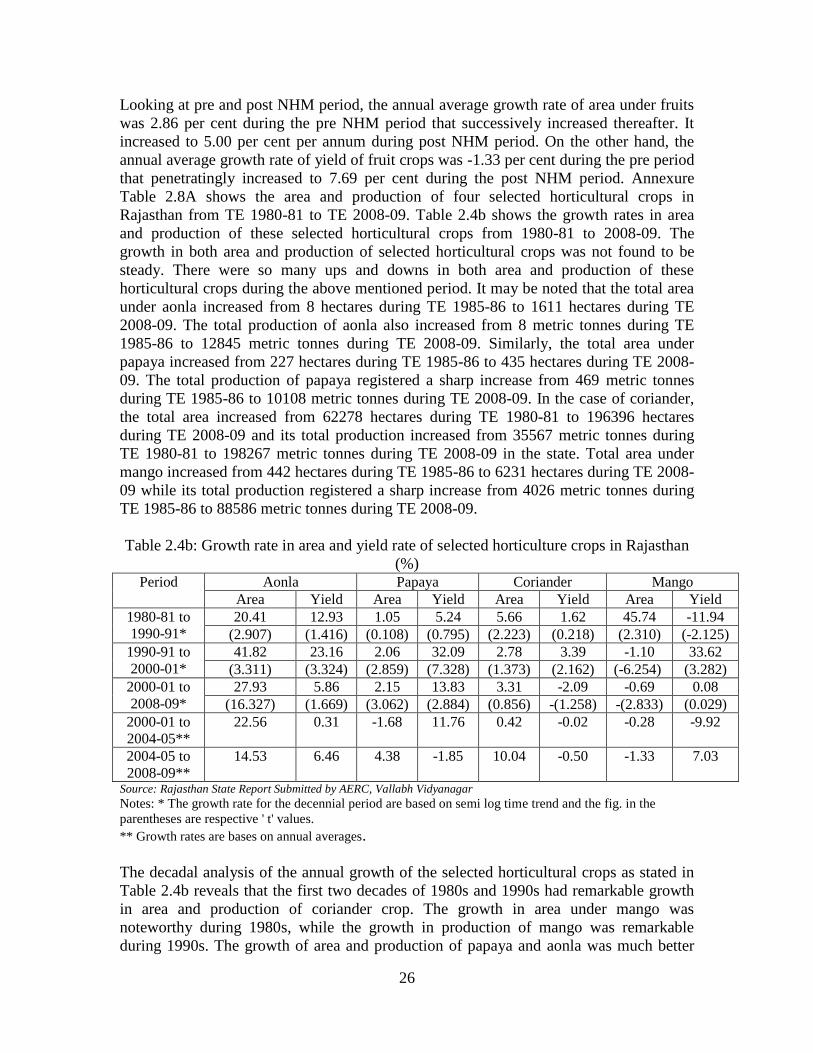
26
Looking at pre and post NHM period, the annual average growth rate of area under fruits
was 2.86 per cent during the pre NHM period that successively increased thereafter. It
increased to 5.00 per cent per annum during post NHM period. On the other hand, the
annual average growth rate of yield of fruit crops was -1.33 per cent during the pre period
that penetratingly increased to 7.69 per cent during the post NHM period. Annexure
Table 2.8A shows the area and production of four selected horticultural crops in
Rajasthan from TE 1980-81 to TE 2008-09. Table 2.4b shows the growth rates in area
and production of these selected horticultural crops from 1980-81 to 2008-09. The
growth in both area and production of selected horticultural crops was not found to be
steady. There were so many ups and downs in both area and production of these
horticultural crops during the above mentioned period. It may be noted that the total area
under aonla increased from 8 hectares during TE 1985-86 to 1611 hectares during TE
2008-09. The total production of aonla also increased from 8 metric tonnes during TE
1985-86 to 12845 metric tonnes during TE 2008-09. Similarly, the total area under
papaya increased from 227 hectares during TE 1985-86 to 435 hectares during TE 2008-
09. The total production of papaya registered a sharp increase from 469 metric tonnes
during TE 1985-86 to 10108 metric tonnes during TE 2008-09. In the case of coriander,
the total area increased from 62278 hectares during TE 1980-81 to 196396 hectares
during TE 2008-09 and its total production increased from 35567 metric tonnes during
TE 1980-81 to 198267 metric tonnes during TE 2008-09 in the state. Total area under
mango increased from 442 hectares during TE 1985-86 to 6231 hectares during TE 2008-
09 while its total production registered a sharp increase from 4026 metric tonnes during
TE 1985-86 to 88586 metric tonnes during TE 2008-09.
Table 2.4b: Growth rate in area and yield rate of selected horticulture crops in Rajasthan
(%) Period Aonla Papaya Coriander Mango
Area Yield Area Yield Area Yield Area Yield
1980-81 to
1990-91*
20.41 12.93 1.05 5.24 5.66 1.62 45.74 -11.94
(2.907) (1.416) (0.108) (0.795) (2.223) (0.218) (2.310) (-2.125)
1990-91 to
2000-01*
41.82 23.16 2.06 32.09 2.78 3.39 -1.10 33.62
(3.311) (3.324) (2.859) (7.328) (1.373) (2.162) (-6.254) (3.282)
2000-01 to
2008-09*
27.93 5.86 2.15 13.83 3.31 -2.09 -0.69 0.08
(16.327) (1.669) (3.062) (2.884) (0.856) -(1.258) -(2.833) (0.029)
2000-01 to
2004-05**
22.56 0.31 -1.68 11.76 0.42 -0.02 -0.28 -9.92
2004-05 to
2008-09**
14.53 6.46 4.38 -1.85 10.04 -0.50 -1.33 7.03
Source: Rajasthan State Report Submitted by AERC, Vallabh Vidyanagar
Notes: * The growth rate for the decennial period are based on semi log time trend and the fig. in the
parentheses are respective ' t' values.
** Growth rates are bases on annual averages.
The decadal analysis of the annual growth of the selected horticultural crops as stated in
Table 2.4b reveals that the first two decades of 1980s and 1990s had remarkable growth
in area and production of coriander crop. The growth in area under mango was
noteworthy during 1980s, while the growth in production of mango was remarkable
during 1990s. The growth of area and production of papaya and aonla was much better

27
during last two decades of 1990s and 2000s. Particularly, the growth of area and
production of aonla was outstanding during the second decade of our study, i.e., 1990s.
During the decade of 2000s, area under aonla expanded at rapid rate of 28 percent per
annum while growth in area under papaya and coriander area was less than 4 percent and
mango area decelerated during this period. Similarly, yield of papaya increased at a rate
of 14 percent per annum while aonla yield grew at a rate of 6 percent per annum. Yield of
other two crops namely, coriander and mango stagnated or decelerated. Dividing the
period between pre and post, area under aonla decelerated from 23 percent per annum
growth in the pre to 15 percent per annum growth in the post NHM period. Area under
papaya accelerated from negative growth of -2 percent per annum to positive growth of 4
percent per annum. Area under coriander increased from almost zero percent to more
than 10 percent per annum. Area growth under mango remained negative during both the
periods. Yield rate improved for two crops namely aonla and mango while papaya yield
decelerated and coriander yield growth remained negative during both the period. In
conclusion, impact of NHM on selected crops in Rajasthan was inconclusive both in area
as well as yield level.
2.5. Growth of horticultural crops in Tamil Nadu
Details regarding area and production of horticultural crops in Tamil Nadu are presented
in Annexure Table 2.9A. Data in the table reveals that the total area under all
horticultural crops in Tamil Nadu remarkably increased from 4.6 lakh hectares during TE
1980-81 to 7.99 lakh hectares during TE 2010-11. In tune with the increase in area, the
production of horticultural crops also tremendously increased from 44.78 lakh tonnes to
176.78 lakh tonnes over a period of 3 decades (TE 1980-81 to TE 2010-11). The growth
rate in area and yield of horticultural crops in Tamil Nadu for the period 1980-81 to
2008-09 is depicted in Table 2.5a. It is understood from the data that the growth rate of
area and yield of all horticultural crops in Tamil Nadu during the decade of 1980s worked
out to 2.5 per cent and 3.0 per cent, respectively, whereas there was a fall in the growth
rate of area (1.9 percent) and yield (1.8 percent) during the decade of 1990s. Again a
significant growth rate of 2.5 per cent in area and 4.8 per cent in yield was observed
during the decade of 2000s. Dividing the period of 2000s into pre and post NHM period,
the statistics shows that the growth rate of area and yield of all horticultural crops during
the post NHM period worked out to 3.47 per cent and 1.52 per cent, respectively. The
growth rate, in area however, was negative in the pre NHM period while growth in yield
was positive 4 percent during that period. So the in the latter period there was substantial
increase in area growth but there was decline in yield growth in the aggregate
horticultural crops implying that the effect of NHM at the overall was inconclusive.
Looking at within horticultural sector, the area growth increased from pre to post NHM
period in almost all horticultural crops namely, fruits, vegetables, flowers, plantation and
medicinal crops. On the other hand, there was a decline in the yield rate from pre to post
NHM period in vegetables and spices while yield rate was stagnant in fruits and increased
in the flowers and medicinal crops.

28
Table 2.5a: Growth rate in area and yield of horticulture crops in Tamil Nadu (%)
Period Fruits$ Vegetables$ Spices$ Flowers$ Medicinal$# Total
Area Yield Area Yield Area Yield Area Yield Area Yield Area Yield
1980-81 to
1990-91* NA NA NA NA NA NA NA NA NA NA
2.48
(1.94)
3.0
1.80
1990-91 to
2000-01*
4.5
(9.1)
-1.4
-(0.9)
3.5
(5.2)
0.03
(0.05)
1.1
(1.1)
8.4
(3.1)
6.1
(14.2)
2.6
(0.4) NA NA
1.9
(2.4)
1.8
(1.6)
2000-01 to
2008-09*
3.8
(6.76)
5.2
(4.08)
3.1
(2.08)
3.2
(3.02)
-1.7
(-1.87)
4.3
(3.36)
5.7
(7.18)
1.1
(2.35)
5.5
(2.56)
-3.6
(-0.2)
2.5
(3.11)
4.8
(4.21)
2000-01 to
2004-05**
1.13 3.09 -0.46 3.63 -3.22 4.48 3.82 0.08 7.82 0.56 -0.26 4.06
2004-05 to
2008-09**
4.46 3.81 3.18 -0.57 1.48 -0.09 4.64 1.65 13.86 14.61 3.47 1.52
Source: Tamil Nadu State Report Submitted by AERC, Chennai
Notes:
1. *The growth rate for the decennial period are based on semi log time trend and the figures in the
parentheses are respective ‘t’ values.
2. ** Growth rates are based on annual averages. Annual Average Growth Rate = ((Ln(value year
end)-Ln(value year begin))/number of years X 100.
3. $ The growth rate of area and yield for Fruits, Vegetables, Spices, Flowers, Medicines have not
been calculated from 1980-81 to 1990-91 due to unavailability of data
4. # The growth rate for medicinal crop area and yield has not been calculated from 1990-91 to
2000-01 due to non-availability of data
In Tamil Nadu, the selected crops in the study area were mango, banana and flowers.
Mango and banana are the leading fruit crops in Tamil Nadu, accounting for over 84 per
cent of the area under fruits and over 87 per cent of total fruit production. The main
flowers grown in Tamil Nadu are Jasmine, Mullai, Chrysanthemum, Marigold and Rose.
Annexure Table 2.10A presents the details regarding area and production of three
selected horticultural crops in Tamil Nadu for the period from TE 1980-81 to TE 2008-09
and growth rates in area and productivity of these three crops are illustrated in Table 2.5b
for the period 1980-81 to 2008-09.
There was a declining trend in area under banana crop from TE 1980-91 to TE 1990-91
as the area declined from 60423 hectares in TE 1980-81 to 58435 hectare in TE 1990-91.
Since then an upward trend in area could be noticed and there was an appreciable
increase in area from 58435 hectares in TE 1990-91 to 111268 hectares in TE 2008-09. In
tune with increase in area, the production of banana also increased manifold. In absolute
term, the production of banana increased from 1486625 metric tonnes in TE 1980-81 to a
whopping 5228118 metric tonnes in TE 2008-09. With regard to area under mango, there
was tremendous increase in area from 36432 hectares in TE 1980-81 to 128030 hectares
in TE 2008-2009. It is significant to note that the production of mango, of course steadily
increased over 3 decades but the increase was not proportionate to the increase in area.
The production of mango increased from 567860 metric tonnes in TE 1980-81 to 680480
metric tonnes in TE 2008-09. The statistical data regarding area and production of
flowers was not available for the period from TE 1980-81 to TE 1990-91. Area as well as
production of flowers increased steadily from TE 1990-91 to TE 2008-09.

29
Table 2.5b indicates that banana area declined during the decade of 1980s, increased by
around 4 percent per annum during the 1990s and by 3.4 percent per annum in the 2000s.
Its yield, on the other hand, increased at a growth rate of 3 percent per annum in 1980s
and 3.4 percent per annum during both 1990s and 2000s. In the case of mango, area
growth rate accelerated from 3.5 percent per annum in the 1980s to 13.7 percent per
annum in the 1990s but decelerated to 2.6 percent per annum in the 2000s. Yield growth
of mango was negative in the 1980s and 1990s but became positive in 2000s although its
magnitude remained very small. Flowers area grew at a rate of 3.8 percent per annum in
the 1990s but came down to 1.7 percent in the 2000s while its yield growth declined from
16 percent per annum in the 1990s to -4.0 percent per annum in the 2000s.
Looking at before and after NHM periods, area growth rate accelerated from 1.3 percent
per annum in the period before NHM to 7 percent per annum in the post NHM period.
However, yield growth decelerated from 1.5 percent per annum to less than 1 percent per
annum during the above mentioned period. Mango observed slight deceleration in the
area as well as yield growth rate during the above two periods. In a similar way, flowers,
also observed acceleration in the area as well as yield growth rate. Thus, in the selected
crops in Tamil Nadu, visibly there was some positive impact of NHM on both area as
well as yield rate.
Table 2.5b: Growth rate in area and yield rate of selected horticulture crops
in Tamil Nadu (%)
Period Banana Mango Flowers$
Area Yield Area Yield Area Yield
1980-81 to
1990-91*
-0.09
(-0.26)
3.00
(3.62)
3.5
(6.34)
-13.8
(-6.47) NA NA
1990-91 to
2000-01*
3.9
(6.67)
3.4
(4.11)
13.7
(2.04)
-8.7
(-1.29)
3.8
(4.69)
16.3
(2.68)
2000-01 to
2008-09*
3.4
(2.64)
3.4
(5.24)
2.6
(14.45)
1.4
(1.12)
1.7
(5.71)
-4.3
(-0.60)
2000-01 to
2004-05**
1.34 1.48 1.99 3.11 0.30 -4.84
2004-05 to
2008-09**
7.03 0.91 1.86 1.70 3.25 2.28
Source: Tamil Nadu State Report Submitted by AERC, Chennai
Notes:
*The growth rate for the decennial period are based on semi log time trend and the figures in the
parentheses are respective ‘t’ values.
** Growth rates are based on annual averages. Annual Average Growth Rate = ((Ln(value year end)-
Ln (value year begin))/number of years X 100.
$ The growth rate of area and yield for flowers have not been calculated from 1980-81 to 1990-91
due to non availability of data
2.6. Growth of horticultural crops in West Bengal
Before we make an attempt to briefly elaborate the growth of horticultural crops in West
Bengal, it must be noted at the outset that the analysis has been severely constrained by
extremely poor and scattered availability of data on horticultural production in the state.
In fact, time series data for various constituents of horticultural sector was not available
30
with any of the major secondary data sources, including state government publications.
Nevertheless, an analysis of the triennium ending averages of area and production of
horticultural cops in the state (Annexure Table 2.11A) reveals that both fruits and
vegetables signify a steady growth in terms of area and production since 1991-92
onwards up to 2009-10. Considering triennium ending average, data on area and
production of fruits, vegetable, flowers, spices, etc., show a rapid increase over the
period. On a comparative basis, it comes out that while the production of fruits grew from
377.23 thousand tonnes in 1991-92 to 2798.71 thousand tonnes in 2009-10 (an increase
of more than 6 times), the production of vegetables grew from 1560 thousand tonnes in
1991-92 to 22355.86 thousand tonne in 2009-10 registering an increase of more than 13
times. In fact in the last decade alone, viz., 2000-01 to 2009-10, total area under
horticulture grew from 1043.47 thousand hectares in 2000-01 to 1678.70 thousand
hectares (an increase of more than 60 percent), while total horticultural production grew
from 11772.83 thousand tonnes in 2000-01 to 25857.56 thousand tonnes in 2009-10 (an
increase of about 120 percent).
An analysis of trend growth rates in area and yield of horticultural crops in West Bengal
reveals that horticulture has been growing at an impressive rate of over the last few
decades (Table 2.6a). The area and yield of all horticultural crops grew at an impressive
growth rate of above 12 percent per annum during the decade of 1980s. During the next
decade of 1990s, while yield growth rate was sustained on the same rate of 12 percent per
annum, area growth came down to less than 5 percent per annum. In the next decade,
while the trend rate of growth of area stood at 6.6 percent per annum (2000-01 to 2009-
10), the yield growth was once again was sustained at 11.1 percent per annum. The
higher trend rate of growth can be attributed especially to an impressive growth in area
and yield of vegetables and spices crops. Vegetables claimed a major share in area and
production of horticultural crops in the state that underwent above 14 percent growth in
area in the 1980s and observed 14 percent per annum growth in the yield in the 1990s and
above 11 percent growth in the 2000s. In the case of fruits, the trend growth rate in area
and yield stood at 4.9 percent and 6.4 percent, respectively during the 2000s.
Breaking the 2000s period into before and after NHM, growth rate in area expansion
remained constant at around 5 percent per annum during both the periods in fruits while
their yield growth rate was almost constant at 7 percent per annum during both the
periods. In the case of vegetables, both area and yield growth rate jumped to very high
level of 12 and 24 percent per annum, respectively during the post NHM period
compared to less than 2 percent per annum growth rate of both area and yield before the
NHM period for vegetables. In the case of commercial flowers, area growth rate
accelerated while yield growth rate decelerated from pre to post NHM period. The other
two crop groups namely, spices and plantation also observed increased growth in the area
and yield rate mostly from negligible or the low level. At the aggregate, area under
horticultural crops grew at a rate of 3 percent per annum that accelerated to 10 percent
per annum from the pre to post NHM period. Similarly, yield growth of all horticultural
crops jumped from 3 percent per annum in the pre NHM period to 20 percent per annum
in the post NHM period. It comes out that horticulture in West Bengal has exhibited an
impressive growth in area and yield, as has been substantiated by a semi-log time-trend

31
analysis and growth rates based on annual averages. This has been especially because of
a high growth rate achieved in the vegetables sub-sector, whereas area under fruits also
contributed to a significant extent. At the same time, floriculture also exhibits an
impressive growth in area and production with increasing importance in the horticulture
map of West Bengal.
Considering triennium ending averages, a comparison of available data on pineapple
reveals that area under pineapple cultivation in the state increased from 8.87 thousand
hectare during TE 1993-94 to a maximum of 13.21 thousand hectare during TE 2006-07,
from where there was a sudden decline in area in the following years (Annexure Table
2.11A). The data on production of pineapple also depicts a similar picture, showing a
sudden decline in production of pineapple in the state since TE 2006-07. On the other
hand, in the case of mandarin orange, there has been a steady increase in both area and
production from TE 1999-2000 to TE 2008-09, though the magnitude of increase was
even lower than pineapple. Needless to say, in view of the growth spurt especially in the
fruits sub-sector in West Bengal, the growth in both pineapple and mandarin orange thus
came out to be quite low. This in turn indicates that the selected fruit crops for the study,
viz. pineapple and especially mandarin orange, have failed to keep up with the growth
spurt in the fruits sector in the state, at least to some extent.
Table 2.6a: Growth rate in Area and Yield Rate of Horticultural Crops in W.B. (%)
Period Fruits Vegetables Commercial
Flowers (loose)
Spices Plantation Total
Area Yield Area Yield Area Yield Area Yield Area Yield Area Yield
1980-81 to
1990-91*
6.36
(5.21)
0.00 14.31
(3.96)
0.00 0.00 0.00 9.76
(9.78)
12.80
(8.27)
0.00 0.00 12.48
(5.16)
12.80
(8.27)
1990-91 to
2000-01*
0.58
(0.80)
5.63
(3.94)
5.05
(2.50)
14.04
(4.70)
0.00 0.00 3.11
(9.45)
3.99
(8.34)
0.00 0.00 4.32
(2.79)
12.47
(5.08)
2000-01 to
2009-10*
4.93
(25.07)
6.45
(10.19)
6.84
(5.66)
11.62
(6.99)
6.32
(4.61)
9.26
(12.04)
-0.06
(-0.06)
5.57
(3.25)
0.00 0.00 6.56
(6.83)
11.07
(7.74)
2000-01-
2004-05**
5.64 7.06 1.30 2.22 5.74 15.95 0.74 5.84 0.00 0.00 2.79 3.44
2004-05-
2008-09**
5.16 6.99 12.40 23.55 8.43 4.57 1.41 12.76 4.97 0.81 10.01 20.20
Source: West Bengal State Report Submitted by AERC, Shantiniketan Note: A few missing values have been replaced using linear trend at point while calculating growth.
* The growth rates for the decennial period are based on semi log time trend and the figures in parentheses are respective ‘t’ values.
** Growth rates are bases on annual averages.
Table 2.6b: Growth rate in area and yield of selected horticultural crops in W.B.
Period Pineapple Mandarin Orange
Area Yield Area Yield
2000-01 to 2008-09* -0.99
(-0.45)
1.01
(1.90)
1.01
(1.55)
1.00
(1.22)
2000-01-2004-05** 4.83 0.17 0.00 -0.56
2004-05-2008-09** -6.32 2.16 1.56 1.58 Source: West Bengal State Report Submitted by AERC, Shantiniketan
Note: *The growth rate for the decennial period are based on semi log time trend and the figures in parentheses are
respective ‘t’ values
** Growth rates are bases on annual averages.

32
A more detailed analysis of growth rate in area and yield rate of pineapple and mandarin
oranges in the state (Table 2.6b) shows that there was a decline in the area under
pineapple cultivation in West Bengal during the decade of 2000s although insignificant.
Yield growth rate of pineapple as well as area and yield growth in mandarin orange was
positive but their volume was not more than 1 to 2 percent for the period 2001-02 to
2009-10. Looking at the pre and post NHM periods, area under pineapple grew at around
5 percent per annum before NHM period that declined to -6 percent per annum in the post
NHM period. Its yield increased from almost zero growth rate in the pre NHM to 2
percent per annum in the post NHM period. Similarly, yield and area under mandarin
orange also increased from zero percent in the pre NHM period to around 2 percent per
annum in the post NHM period. This again confirms that the growth in area and
production of pineapple and mandarin orange lagged far behind the growth of
horticulture, especially of fruits in West Bengal.
2.7. Growth of horticultural crops in Haryana
Haryana has basically food grains based agriculture and rice wheat rotations are
prominent. In addition, cotton, mustard and sugarcane are also grown widely. Recently,
the government of Haryana has been making concerted efforts to diversify agriculture
through popularizing horticultural crops. These crops are being promoted because a
variety of fruits and vegetables can be grown in different agro-climatic regions of the
state. We have presented information on status of Haryana in all India area under fruits
and vegetables from 1996-97 to 2004-05 in Table 2.7. It is evident that share of this state
in all India area under fruits was less than 1 per cent throughout these years despite
higher potential. Moreover, it grew at the rate of 2.91 per cent per annum during this
period.
Table 2.7: Area under fruits and vegetables in Haryana
Year Fruits Vegetables Fruits and vegetables
Area
(000 ha)
Per cent of
all India
Area
(000 ha)
Per cent of
all India
Area
(000 ha)
Per cent of
all India
1996-1997 21.8 0.61 94.5 1.71 116.3 1.28
1997-1998 23.9 0.65 96.8 1.73 120.7 1.30
1998-1999 26.2 0.70 120 2.05 146.2 1.52
1999-2000 28.6 0.75 135 2.25 163.6 1.67
2000-2001 30.7 0.79 141.7 2.27 172.4 1.70
2001-2002 31.3 0.78 150.4 2.44 181.7 1.79
2002-2003 31.9 0.84 163.1 2.68 195 1.97
2003-2004 31.6 0.68 203.9 3.23 235.5 2.14
2004-2005 24.1 0.49 207.8 3.08 231.9 1.98
Growth
rate
2.91 10.71 9.5
Source: Haryana State Report Submitted by AERC, Delhi

33
A look at the share of Haryana in all India area under vegetables reveals a far better
status. It constituted 1.71 per cent of all India area during 1996-97 and reached to 3.08
per cent in 2004-05. The annual growth rate of area under vegetables was commendable
and crossed 10 per cent mark. These figures indicate a distinct achievement of the state.
When fruits and vegetables are clubbed together, Haryana showed 1.28 per cent share in
all India area during 1996-97 which reached to 1.98 per cent during 2004-05. The area
expansion appeared to be commendable by indicating a growth rate of 9.5 per cent per
year during the above-mentioned period.
Diverse agro-climatic conditions of the state are conducive for cultivation of horticultural
crops including fruits like citrus, grapes, mango, guava, etc. Since, one third of the state
territory falls within the geographical coverage of the National Capital Region, there is a
tremendous scope for commercial cultivation of vegetable crops, fruits, flowers, etc. In
addition, establishment of agro-processing industries has a good potential. Especially,
owing to its proximity to Delhi, there is vast potential for processing of fruits and
vegetables. Although, agro climatic conditions of Haryana are suitable for growing
horticultural crops, progress of horticulture in terms of area devoted has been rather slow
and does not commensurate with the availability of excellent natural and efficient human
resources. In fact, higher yields and better returns through assured marketing from wheat-
rice cropping system has been one of the major reasons for reluctance of the farmers to
shift to fruit crops which have a long gestation period. In the past, public policy, at state
and central levels has paid inadequate attention to the development of horticultural crops.
Now, policy makers have realized growth potential of horticultural crops and proactive
steps are being undertaken by the Government through implementation of programmes
like the National Horticulture Mission.
2.8 Summary of the chapter
To summarize the findings of the chapter, in Karnataka, horticultural crops area expanded
by significant rate of around 3 percent per annum during the 1980s and slightly less than
3 percent per annum in the 1990s. However, against the impressive growth in area under
horticultural crops in Karnataka in the decades of 1980s and 1990s, the yield growth rate
of the same was either insignificant or it was even negative in most of the crops. Overall,
yield of horticultural crops increased by less than one percent in the 1980s but no
increase in the 1990s. In the decade of 2000s, there was some reversal in area and yield
growth rates. Area under horticultural crops in Karnataka grew at an annual growth rate
of 1.6 percent in the 2000s while yield increased at 1.9 percent whereby yield growth was
not significant. At the aggregate, NHM seems to have overall positive effect on the
horticultural crops as area growth increased from 0.8 percent per annum during the before
NHM period to 2.7 percent per annum during the post NHM period. Similarly, yield
growth rate that was negative during the before NHM period (-4.1 percent per annum),
observed a very high growth rate of 6.5 percent per annum during the post NHM period.
Among the selected crops, although effect of National Horticultural Mission was visible
on the area expansion of selected horticultural crops, however, its effect on the yield rate
was yet to be seen.

34
In Andhra Pradesh, area under horticultural crops underwent a significant negative rate (-
2.5), while the yield recorded a positive growth (14.6) during the decade of 1980s.
During the decade of 1990s, significant positive growth was reported in area and yield of
fruits, vegetable crops and the total horticultural crops. In the decade of 2000s, fruits,
vegetables and commercial flowers reported a positive and significant growth in area and
yield. At the overall, area under all horticultural crops increased at a rate of 3.7 percent
per annum in the pre NHM period that increased to 4.3 percent per annum in the post
NHM period while yield growth rate increased from 1.7 per annum in the pre NHM to
7.4 percent per annum in post NHM period. In the case of selected crops, both mango and
sweet orange observed rapid growth in area during both pre and post NHM periods, while
area growth was slightly less in the post NHM period compared to pre NHM period. On
the other hand, the yield growth rate was negative in the pre NHM period for both the
crops that turned positive for mango while remained negative for the sweet orange in the
post NHM period. Nonetheless, the NHM did not appear to have helped the selected
crops in expanding its area or increasing the yield level of these two selected crops in
Andhra Pradesh.
A detailed analysis of percentage growth in area and yield of different horticultural crops
in Bihar revealed that during the decade of 1990s fruits area increased by less than 2
percent per annum while vegetables area decelerated significantly. The growth in yield
was negligible in fruits and negative in vegetables in Bihar. The expansion in area as well
as yield level of horticultural crops in the decade of 2000s indicate the positive
contribution of NHM in Bihar. The fruits area declined in the post NHM period but its
yield rate increased at a rapid rate. In all other crops, namely, vegetables, spices and
flowers, not only area expanded in the post NHM but also their yield increased indicating
the positive effect of NHM programme in Bihar. In the case of selected crops of mango
and litchi in Bihar, during the pre NHM period there was almost no growth in the area as
well as yield of mango crop while its yield rate increased by almost 13.5 percent per
annum during the post NHM period. In the case of litchi, there was 7 percent per annum
growth in area in the pre NHM period while yield growth rate was negative during the
same period. In the post NHM period, its area as well as yield grew by around 1.5 to 2
percent per annum. Thus, it is difficult to conclude that NHM really helped in expansion
of area of the selected crops while there is some conclusive evidence of rise in the yield
rate of the selected crops during the post NHM period.
In Rajasthan area under horticultural crops grew at an annual rate of 4.5 percent per
annum while yield rate increased by 11 percent per annum during the decade of 1980s.
Growth in area further increased to 4.63 percent per annum during the 1990s while yield
growth decelerated to almost zero during the same time period. The growth rate of area
decreased to 0.64 per cent per annum whereas yield rate increased by 7.5 per cent per
annum during 2000s. The area under horticultural crops was almost stagnant in the pre
NHM period whereby it grew by only 0.5 percent per annum, the area increased at a rapid
pace of above 5 percent per annum in the post NHM period. However, yield rate of
horticultural crops increased by around 5 percent per annum before NHM period (2000 to
2004) while it decelerated to 1 percent per annum in the post NHM period. The growth in
both area and yield of selected horticultural crops was not found to be steady. There were

35
ups and downs in both area and yield of selected crops. Dividing the period between pre
and post, area under aonla decelerated from 23 percent growth rate in the pre to 15
percent in the post harvest period. Area under papaya accelerated from negative growth
of -2 percent per annum to positive growth of 4 percent per annum. Area under coriander
increased from almost zero percent to more than 10 percent per annum. Area growth
under mango remained negative during both the periods. Yield rate improved for two
crops namely aonla and mango while papaya yield decelerated and coriander yield
growth remained negative during both the period. In conclusion, impact of NHM on
selected crops in Rajasthan was inconclusive both in area as well as yield level.
The growth rate of area and yield of all horticultural crops in Tamil Nadu during the
period of 1980s worked out to 2.5 per cent and 3.0 per cent, respectively, whereas there
was a fall in the growth rate of area (1.9 percent) and yield (1.8 percent) during the period
of 1990s. Again a significant growth rate of 2.5 per cent in area and 4.8 per cent in yield
was observed during the decade of 2000s. The growth rate of area and yield of all
horticultural crops during the post NHM period worked out to 3.47 per cent and 1.52 per
cent, respectively. The growth rate, in area however, was negative in the pre NHM period
while growth in yield was positive 4 percent during that period. So the in the latter period
there was substantial increase in area growth but there was decline in yield growth in the
aggregate horticultural crops implying that the effect of NHM at the overall was
inconclusive. Among selected crops, mango observed slight deceleration in the area as
well as yield growth rate during the above two periods. In an opposite way flowers,
observed acceleration in the area as well as yield growth rate. Thus, in the selected crops
in Tamil Nadu, visibly there was some positive impact of NHM on both area as well
yield rate in flowers but not in mango crop.
In West Bengal, the area and yield of all horticultural crops grew at an impressive growth
rate of above 12 percent per annum during the decade of 1980s. During the next decade
of 1990s, while yield growth rate was sustained on the same rate of 12 percent per
annum, area growth came down to less than 5 percent per annum. In the next decade,
while the trend rate of growth of area stood at 6.6 percent per annum (2000-01 to 2009-
10), the yield growth was once again sustained at 11.1 percent per annum. At the
aggregate, area under horticultural crops grew at a rate of 3 percent per annum in the pre
NHM period that accelerated to 10 percent per annum in the post NHM period. Similarly,
yield growth of all horticultural crops jumped from 3 percent per annum in the pre NHM
period to 20 percent per annum in the post NHM period. It comes out that horticulture in
West Bengal has exhibited an impressive growth in both area as well as yield. A detailed
analysis of growth rate in area and yield rate of pineapple and mandarin oranges in the
state showed that area under pineapple grew at around at 5 percent per annum before
NHM period that declined to -6 percent per annum in the post NHM period. Its yield
increased from almost zero growth rate in the pre NHM to 2 percent per annum in the
post NHM period. Similarly, yield and area under mandarin orange also increased from
zero percent in the pre NHM period to around 2 percent per annum in the post NHM
period. This confirms that the growth in area and production of pineapple and mandarin
orange lagged far behind the growth of horticulture, especially of fruits in West Bengal.

36
In Haryana, horticultural crops occupied only minor importance as the share of fruits and
vegetables in the state in all India area under fruits and vegetables clubbed together was
only 1.28 per cent during 1996-97 which reached to 1.98 per cent during 2004-05. The
area expansion appeared to be commendable by indicating a growth rate of 9.5 per cent
per year during the above-mentioned period. The further details of area of horticultural
crops in Haryana was not available.

37
Chapter 3
Household Characteristics, Cropping Pattern and Value of Output
The previous two chapters presented spatial distribution of various horticultural crops at all India
and in the selected states. The second chapter presented an overview of effect of National
Horticultural Mission (NHM) on fruits, vegetables, flowers and medicinal crops in general and
our selected horticultural crops in different states in particular. In order to see the working of
NHM at the ground level, in terms of area and yield expansion at the household level and
distribution of stipulated subsidies and various tools and implements among the households
growing horticultural crops, a household survey was carried out among a selected number of
households growing various horticultural crops. Following the directions from the Ministry of
Agriculture, two crops namely mango and sweet orange were selected in Andhra Pradesh; mango
and litchi were selected in Bihar; kinnow, guava, anola and garlic were selected in Haryana;
grapes, pomegranates, flowers and aromatic/medicinal crops were selected in Karnataka; anola,
papaya, coriander and mango were selected in Rajasthan; banana, mango and flowers were
selected in Tamil Nadu and pineapple and mandarin oranges were selected in West Bengal. For
these selected crops, 200 households each were surveyed in Andhra Pradesh and Rajasthan; 150
households surveyed in Haryana and Tamil Nadu each; 100 households were surveyed in West
Bengal and Bihar each; and 212 households were surveyed in Karnataka. Annexure Table 1.1A
presents the details of the crops, districts and households selected in each of the seven states.
This chapter presents a brief overview of the selected households followed by a detailed
discussion on their cropping pattern, inputs used, output produced and their profitability of
various crops grown. Our analysis in this chapter would be classified into farm size categories,
viz., marginal farmers, small farmers, medium farmers, large farmers and aggregate of all
classes. The households from all the districts in each state are clubbed together and analysis is
done for individual crops and crop groups.
3.1 Socio-economic characteristics of the selected farmers
Table 3.1 and Annexure Table 3.1A present demographic profile of the selected households in
seven selected states. In Karnataka, out of the selected 212 households, 59 were marginal
farmers with operational holdings between 0.00 to 2.50 acres; 63 were small farmers with
operational area between 2.50 to 5.00 acres; 35 were medium farmers operating between 5.01 to
10.00 acres and rest, 55 were large farmers operating above 10.00 acres of land. The
categorization was done on the basis of operational holdings rather than ownership holdings. On
an average, household size (number of members per family) was 6.9 members and it was lowest
(5.4) among the marginal farmers and highest 9.2 among the large farmers. There was a clear
positive relation between the family size and holding size as families were nuclear at the lower
holding size (marginal and small) while medium and large farmers were mostly combined
families. Similar to household size, number of earning members in the family also had a direct
relationship with the holding size. The average numbers of earners were 2.7 and 2.9 among
marginal and small holding size and increased to 3.3 and 4.2 in the case of medium and large

38
farmers. The gender characteristics were same among all size of holdings. On average, the
percentage of male was 54 and percentage of female was 46 while 2/3rd
members of the family
were in the working age and rest were children below 16 and senior citizens (above 60 years).
On the educational status, more than 1/5th
households were illiterate and another 1/5th
households
were literate up to primary level, while half of the selected farmers were educated up to
secondary level. Only 5 percent members were educated up to graduate level and only 1 percent
was educated above graduate. Across farm size holdings, there was no significant difference in
terms of education standards. Looking at the socio characteristics of the selected households,
majority of the farmers belonged to the Backward Castes (OBC) 1/4th
was from the General
Category and only 6 percent belonged to Scheduled Castes and 1 percent that of Scheduled
Tribes. More than 80 percent occupation of the selected households belonged to farming alone.
The other activities like self business, regular salary and daily wage earnings occupied around 5
percent, each in the total occupation. The proportion of wage earning was highest (13 percent)
among marginal farmers and small farmers (7.6 percent) while it was almost negligible among
large (2.7 percent) farmers. On the opposite, proportion of salaries and self business was higher
among large farmers (around 7 percent, each) as compared to marginal farmers (around 4
percent, each).
In Andhra Pradesh, out of 200 sample farmers the highest number of households were selected
from small farmers group (80) followed by medium (59), marginal (31) and large (30). The
average size of selected households was 4.15 members and it varied among the farm size groups.
Across the size groups the average household size was highest under large farmer group 5.27 and
least 3.70 among small farmers. The average number of earners per household was 1.77 that
varied from 1.63 among small farmers to 2.00 persons among large farmers. The male and
female member ratio constituted 54.5:44.5 which remained more or less similar across all size
holdings. Around 81 per cent members were in the working age and rest 19 per cent were either
below 16 years or above 60 years. Looking at the educational status of sample households
around 33 per cent members were illiterate, 24 per cent studied up to primary, 25 per cent up to
secondary, 16 per cent up to graduate and 1.8 per cent were post graduates or equivalent. Across
the farm size groups, number of illiterate members was highest 37 among medium farmers and
lowest 31 per cent among large farmers. Looking at the caste composition, 39.5 per cent
respondents belonged to general category, 37.5 per cent to other backward castes (OBC) and the
remaining 23 per cent were from scheduled caste (SC) and scheduled tribes (ST). Regarding
occupation, 78 per cent members were working under farming, followed by 15 per cent wage
earners, 3.68 per cent pensioners and 3.4 per cent self business.
In Bihar out of 100 households surveyed, 17 per cent belonged to marginal farmers, 22 per cent
small farmers, 43 per cent medium farmers and remaining 18 per cent were large farmers. The
average family size was 6.10 persons that varied between 5.41 persons in the case of small
farmers to 7.22 persons in the case of large famers indicating direct relation between the family
size and size of holdings. Out of 6.1 members of average family size, around 2.1 members were
earners. Data on gender wise classification of households’ members reveals that 49.6 per cent
were males and 50.4 per cent were females. The identity of respondents reveals that 84 per cent
of the respondents were heads while remaining 16 per cent were the other members of the
households. It is observed from the table that only 11 per cent of the members were illiterate.
About 28 per cent had attained the educational level of up-to-primary, 50 per cent up-to-

39
secondary, 7 per cent up-to-graduation and only 3 per cent had attained above graduation. The
social composition reveals that 5 per cent were from SC, 29 per cent from OBC and 66 per cent
belonged to general category. The data presented in the tables show that males were the decision
makers in 91 per cent of the households. Further 82 per cent of the working population had
adopted farming as the main occupation, 10 per cent were engaged in petty businesses, 7 per cent
were in salaried job and only 1 per cent were wage-earners.
In Rajasthan, out of 200 households surveyed, 44 were marginal farmers, 45 were small farmers,
57 were medium farmers and 54 were large farmers. The average household size for entire
sample was 7.47 persons depicting direct relationship of farm size and family size. The average
number of earners per sample household was 2.93 having highest in the case of marginal farmer
category (3.45) and lowest in the case of large farmer category (2.73). Gender wise, 53 per cent
family members were male and 47 per cent were female. About 67.47 per cent of all members of
sample households belonged to ‘16-60 years’ age group which is considered as working age.
Looking at the education standard, 22 percent members of sample households were illiterate. The
proportion of literate people was found lowest 71 per cent in marginal farmer category. The caste
composition of selected farmers reveals that about 51 per cent sample households (HHs)
belonged to OBC category, 33 percent belonged to ST category, 3 percent belonged to SC and
remaining 14 per cent belonged to general caste. About78 per cent working members of sample
HHs were engaged in farming, 10 per cent were engaged in self business, 11 per cent were
salaried or pensioners and only less than 1 per cent were wage earners. On average, 15 per cent
small farmers were salaried/pensioners and 16 per cent medium farmers were having their self
business.
In Tamil Nadu, 150 farmers were selected comprising of 89 marginal, 37 small, 19 medium, and
5 large farmers. The average household size of sample worked out to 5.7. The variation in family
size across different holdings was not perceptible. Average number of earners was 3.24 for all
sample households. The marginal framers who are economically poor compared to other
categories of farmers had the highest number of earners (3.5) and the lowest number of 2.1
earners was found with the large sample households. The male and female combination of
households worked out to 52 per cent and 48 per cent, respectively. More than 66 per cent of the
members of the sample households belonged to working age group of 16-60 years. As regards
education, the highest 35.6 per cent of the members of the sample households studied up to
secondary school, whereas 27.3 per cent of them studied up to primary school. About 16 per cent
of the members of the sample households were graduates. The illiterates were found to be 16.7
per cent. Above 50 per cent of the selected households belonged to OBC and the SC community
constituted about 3 per cent of the total sample while general category formed 6 per cent.
Farming was the main occupation for nearly 86 per cent of the working members of the sample
households, while nearly 6 per cent of the working members were doing self business. Salaried
persons and pensioners formed 5.06 per cent, while 3.3 per cent were wage earners.
In West Bengal a total number of 100 households were surveyed. The average size of farm
households was 4.8. The average number of earners were found 1.6 members per family. The
gender distribution was found highly skewed towards male members. Looking at the working
age members, around 68 per cent of household members belonged to this age-group. The ratio of
literates among the household members stood quite high at 80.5 percent, though most of them
40
(56.3 percent of the literates) were contained only to primary education levels. Interestingly
enough, the marginal group appeared to enjoy a distinct edge in higher education than the other
size classes as most of members with higher educational achievements came from marginal
households. There was a predominance of general castes (43 percent), followed by SCs (36
percent), and OBCs (15 percent). About 89 percent of the working members considered
agriculture as their primary occupation, while members considering other occupations like
business, service and wage-earners as their primary occupation were proportionately quite low.
In Haryana, out of total 150 households surveyed, the distribution of marginal, small, medium
and large farmers was 8, 21, 29 and 100, respectively. The average size of family was 5.91
persons in the selected farm households. There was no correlation between farm size and average
size of family. The male-female ratio in total population was 54.4 and 45.6 per cent at the
aggregate level. A majority of population i.e., 68.8 per cent was found in the age group of 16-60
years. The share of dependents above 60 years was 7.45 per cent at the aggregate level. Among
the selected households, SC, OBC and general category households were 1.33, 14.0 and 84.67
per cent, respectively. The proportion of literates among sampled farm households was at least
80 per cent in each category. Out of total literates, 17.27 per cent had education up to primary
level, 39.05 per cent up to secondary level. Only 7.90 per cent among them attained education
above matriculation and up to graduate level.
3.2 Characteristics of operational holdings
Table 3.2 presents characteristics of operational holdings of the selected households in all the
selected states. The size of operational holdings, on an average, was 8.6 acres among the selected
farmers in Karnataka. The size was less than the owned area because some area was either
cultivable waste or non-cultivable waste. The area leased-in was slightly more than area leased-
out across all size of holdings. The average size of operational holdings among the selected
farmers was 1.6 acres among marginal farmers, 3.8 acres among small farmers, 7.4 acres among
medium farmers and 22.3 acres among the large farmers. Average cropping intensity was 1.28
and it was highest 1.40 for marginal farmers and lowest 1.23 for small farmers.
In Andhra Pradesh average per household net operated area was 6.5 acres while gross cropped
area was 9.3 acres. The owned land and operated land among the selected households was quite
close as net leased in land was negligible. The cropping intensity per household was observed
1.42. Across various farm size groups, cropping intensity of marginal, medium and large farmers
was reported less than the aggregate average and constituted 1.40, 1.28 and 1.41 while small
farmer were found having highest cropping intensity of 1.65. In Bihar, the average size of
operational holdings of the selected households was 4.73 acre that was about 77 per cent of the
owned area indicating more than 20 per cent area being lost in cultivable waste and non
cultivable area as leased-in and leased-out area was very small. Among different size holdings,
the average operated area was 1.75 acres in the case of marginal farmers, 2.96 acre, small
farmers, 4.83 acres, medium farmers and 9.47 acres large farmers. The gross cropped area on
average was 7.03 acres with average cropping intensity of 1.49. The cropping intensity was 1.45
on marginal farms, 1.41 on small farms, 1.49 on medium farms and 1.52 on the large farms.

41
In Rajasthan, the net sown area and gross cropped area of sampled households was found to be
8.85 acres and 16.76 acres respectively, with cropping intensity in the study area of 1.87. The
high cropping intensity indicates that the agricultural land in Rajasthan has been utilized in an
effective way by the sample farmers. The proportion of leased-in land, leased-out land, cultivable
waste land and non-cultivable land was almost nil thereby there is hardly any difference between
the owned area and operated area among the sample farmers. Among various categories of
farmers, small farmers were found cultivating their land more intensively as their cropping
intensity was highest 2.27. The cropping intensity was considerably at higher level (2.03) for
medium farmers as well compared to rest of the categories. In Tamil Nadu, net operated area of
all the sample households on an average worked out to 3.91 acres. It is interesting to note that all
the owned area was cultivated in Tamil Nadu as cultivable waste and non cultivable land was
zero among all size of holdings. The gross cropped area of all sample households on an average
was 6.20 acres. The cropping intensity was on average 1.63. The net operated area was above the
owned area indicating at the aggregate leasing-in land exceeding that of leasing-out land. As
regards cropping intensity, it was high (1.74) for marginal category and low (1.51) for large
farmers category.
In West Bengal, cultivable waste land among all the size groups was negligible. In the case of
non cultivable waste, the marginal farmers on average had 0.22 acres of land which could not be
converted for use of agricultural purposes. Leasing-in and leasing-out land turned out to be
confined only to the marginal farmers, where the average leased-in land was 0.47 acres and the
average leased-out land was only 0.02 acres. It should be noted that though the smaller size-
classes were constrained by less operational area but they were compensated to some extent by
higher cropping intensity. The cropping intensity for the marginal farmers stood at 1.33 and it
was 1.08 and 1.00 for small and medium farmers, respectively while there was no farmer
operational in the category of large holdings in West Bengal among the selected households. In
Haryana, the size of operational holdings was 16.92 acres. The minimum of 1.54 acres was
operated by marginal category against a maximum of 22.96 acres by large category. The selected
farm households owned 16.35 acres of land at the aggregated level. The size of land leased in
varied from a minimum of 0.125 acres in marginal category of to a maximum of 0.68 acres in
large category. None of the selected farmers, however, leased-out land. Marginal farmers
indicated exceptionally higher cropping intensity (224.26 per cent). On the other hand, cropping
intensity was lowest on large farm households.
3.3 Nature of tenancy
Among the selected households in Karnataka, the tenancy was dominated by fixed rent in cash
which shared 64 percent of total land under tenancy followed by share cropping 21 percent and
fixed rent in kind 14 percent (Table 3.3). Among various farm sizes, tenancy among large
farmers dominated in terms of fixed rent in cash and kind whereas marginal and small farmers
preferred share cropping. In the latter case, input and output were shared among the land owners
and tenants as small farmers were starved in cash compared to large category of farmers
(Annexure Table 3.3). In Andhra Pradesh, only a few farmers reported area under tenancy.
Across the selected districts, Kurnool district reported small extent of leased-in land from
medium and large farmers under mango sample farmers only. In Bihar, only marginal and small
farmers leased-in small piece of land while medium and large farm households did not lease-in

42
any land. The structure of tenancy among the marginal and small farmers was only in terms of
fixed rent both in cash and kind. Around 64 per cent accounted for fixed rent in kind and 36 per
cent as fixed rent in cash at the aggregate in Bihar.
About the tenancy contract in Rajasthan, the share-cropping was the most popular form. Given
the dry land nature of agriculture in Rajasthan, this arrangement made the tenant to some extent
insulated against output fluctuations, as under these arrangements risk is shared with the
landlord. This is primarily an ex-ante risk management strategy used widely by the farmers to
reduce their risk level in the drought prone areas. However, in the study region in Rajasthan, it
was found that the sample farmers preferred fixed rent in cash form of tenancy contract instead
of share cropping. It may be seen from the statistics in Table 3.3 that near about 0.06 acres per
household was leased-in by the sample farmers and the entire leasing-in was on fixed rent in
cash. In Tamil Nadu share cropping, fixed rent in cash and fixed rent in kind were in existence,
but very small piece of land was on tenancy among our selected households. Table 3.3 indicates
that fixed rent in cash was the nature of tenancy method followed by all the sample households.
In West Bengal while examining the structure of tenancy among the sample farmers, it is
interesting to find that none of the sample farmer households had leased-out their land partly or
fully to other fellow farmers as was also the case in Haryana. However, in the case of leasing-in
of land, only about 1.77 percent of gross cropped area was leased-in on the contracts of fixed
rent in cash, particularly by marginal farmers alone in West Bengal. Even within the marginal
farmers, this contributed to only about 2.57 percent of gross cropped area, that was almost
negligible. In Haryana, tenancy mostly existed in terms of cash only. Among our sampled
households, only few large farmers hired land on kind basis (16 percent) while all other category
of farmers leased-in on cash alone.
3.4 Sources of irrigation
Availability of adequate irrigation is one of the important parameters for intensive use of
available land resources. Tables 3.4a and 3.4b present the net irrigated area operated and
percentage of irrigated area operated by the selected households under different irrigation
sources. In Karnataka, out of total operated area, 42 percent was rainfed, whereby marginal and
small farmers had up to 20 percent area rainfed and large farmers had 50 percent area rainfed.
Among the sources of irrigation, electric tube well and canal were the dominant sources while
tank irrigation had almost negligible share. In Andhra Pradesh, out of 1304 acres of net operated
area, lowest irrigated area was reported by the marginal farmers, 5.4 per cent and the highest by
large farmers, 35.2 per cent. Across the size categories, large farmers reported 46.3 per cent
irrigated area by electric tube well and 4.6 per cent by tanks and 3.5 per cent by canal plus tube
wells. Small and medium farmers reported the maximum 59.9 and 54.1 per cent area irrigated by
electric tube well. In the case of marginal farmers 23.1 per cent of their operated area was
irrigated by diesel tube wells, 18.3 percent by electric tube wells and 15 per cent by canal plus
tube wells. In Bihar, the major source of irrigation was tube well, which accounted for 75 per
cent irrigated area by diesel tube well and 10 per cent area by electric tube well, taking together
the share of tube well to 85 per cent of the total operated area. Tanks and other sources
contributed only 10 per cent of the total operated area and 5 per cent was rainfed. The above
analysis of data reveals that tube well occupies the major source of irrigation in Bihar but due to
poor and erratic supply of power diesel tube well had larger spread in the area.
43
In Rajasthan, about 8.26 acres out of 9.01 acres of NOA (91.6 per cent) was irrigated through
different sources. Among different farmer categories, large farmers were found to irrigate 18.43
acres out of 19.73 acres of NOA per HH (93.7 per cent), followed by small farmers with 93.0 per
cent of NOA as net irrigated area. As far as different sources of irrigation are concerned, highest
76.07 per cent of total operated area of sample farmers was irrigated by tube wells run by electric
and diesel out of which 65.91 per cent of NOA was irrigated by electric tube wells alone. Canal
and tank and other source of irrigation had minor presence in the study area as their joint
contribution was about 11.06 per cent for our sample farmers. The irrigated area by only canals
was 2.7 per cent of the net operated area. The total rainfed area was 8.36 per cent for all sample
farmers. Although only 8 per cent land was rainfed on the aggregate, the proportion of rainfed
area of marginal farmers was about one fourth of their total NOA.
In Tamil Nadu, out of the average net operated area of 3.79 acres, a major chunk of 68 per cent
of the land had well irrigation both tube well and open well, whereas canal and tanks were the
sources of irrigation for only 9.2 per cent of the net operated area. The rest of 13.6 per cent of the
net operated area was rainfed. The source of irrigation for 75 per cent of the net operated area of
marginal farmers was well, whereas it was 69.54 per cent for medium farmers and 68.86 per cent
for large farmers. The average rainfed area at the aggregate was 0.49 acres per household. In
West Bengal, the selected farmers were completely dependent on monsoon, i.e., almost all
operated area of the selected households was rainfed. Only about 5 percent of cultivable area
under the marginal farms had provision for irrigation through sources like tanks. Irrigation from
any other sources like canal or tube well (diesel/electric) was completely absent in the study
region, especially owing to the topography of the study area. It should be noted however that
average annual precipitation in the selected districts was much higher than the state average,
which in turn compensated for the near absence of irrigation for the sample farms. In Haryana,
The main sources of irrigation on the sampled farms was canal and tube wells which irrigated
around 78.37 per cent of the area operated by the sampled farm households. The proportion of
irrigated area by these sources was higher on large farm households in comparison to other
categories. On the other hand, canals irrigated merely 3.57 per cent of operated area and
percentage of area irrigated by this source was found highest on small farms. Tanks, wells and
other sources as a means of irrigation were almost non-existent on the sampled farms
3.5. Sources and purpose of credit
Rural credit market in India is characterized by few distinctive features like formal credit is
readily available for large farmers who are trusted by the institutional lenders on the basis of
their paying capacity. On the other hand, the access of poor marginal and small farmers to
institutional credit is quite limited (Rao 1980; Basu 1983; Swain 1986; Gupta and Shorf 1987;
Sarap 1991; and Jodhka 1995). The inability of small farmers to provide collateral such as land,
jewellery, or house buildings as mortgage is the major hindrance for them in availing
institutional credit. So the poor marginal and small farmers are automatically screened out as
potential beneficiaries of formal credit agencies (Swain, 2001; Swain and Swain, 2007). As a
result, they fail to avail the benefits of a large numbers of developmental programmes
specifically meant for them. The only alternative left for the landless and marginal farmers is to
repeatedly visit the moneylenders’ doorstep to get the linked loans at exorbitant interest rates
accepting large-scale exploitation.
44
Tables 3.5a and 3.5b provide details on sources and purpose of credit by the selected
horticultural farmers. In Karnataka, per household credit was measured at 2 lakh that varied
from 64 thousand in the case of marginal farmers to above 4 lakh in the case of large farmers.
Among different sources of credit, institutional credit constituted the major amount around 82
percent and non-institutional had only a share of less than 18 percent. Among the non-
institutional sources traders and landlords occupied the largest share among different category of
farmers. Whereas large farmers had 94 percent credit from the institutional sources, marginal
farmers were really the deprived ones who had only 21 percent share from the institutional
sources. Major amount of credit in their case was contributed by landlords, money-lenders,
friends and relatives. Against the direct relationship between credit per household and farm size,
credit per acre was clearly tilted towards the marginal and small farmers. Overall, credit per
acres was measured at 23 thousand and only large farmers had less than the average credit per
acre. Almost whole of the borrowed amount by large and medium farmers was used for
productive purposes in agriculture; small farmers used 60 percent of credit for productive
purposes while marginal farmers used only 36.5 percent of it for productive purposes and 57
percent was used for other uses like marriage, illness etc.
The sample farmers of mango and sweet-orange in Andhra Pradesh took the maximum
advantage of banking and co-operative institutions. Per household loan amount was found
40950 from institutional sources; followed by 8156 from the traders/money-lenders and land
lords; 1765 from the friends and relatives; and 825 from various government programmes.
Across the farm size groups, highest amount of credit 77967 obtained from institutional
sources was reported by the large farmers. On the overall, there was a direct relation between the
land size and institutional credit. On the other hand, per acre institutional credit depicted an
inverse relation between land size and amount borrowed. Per acre institutional credit borrowed
by marginal farmers was 8055 followed by 6280, 6232 and 4763 by the small, medium
and large farmers, respectively. The credit borrowed from other sources like commission agents,
traders/ML/landlord and friends and relatives was much less by the sample households in the
selected districts in Andhra Pradesh. Regarding the purpose of credit, most of the borrowing was
for productive purpose especially for the agriculture sector across all size of holdings. In Bihar,
per household credit was recorded as 3829 constituting of 2115 (55 percent) as institutional
credit and 1607 (45 percent) as non-institutional credit at the aggregate among the selected
households. The medium farmers obtained the largest share from the institutional sources (
3581) followed by small farmers ( 1250); large farmers ( 1000) and marginal farmers ( 706).
Per acre credit from institutional sources was recorded as 447 and it was highest for the
medium farmers and lowest for the large farmers. Further, out of per household borrowed
amount about 58 per cent was used for productive purposes at the aggregate. Across farm size
holdings, the large farmers used 84 per cent of the credit for productive purposes, compared to
48 per cent by the medium farmers.
In Rajasthan, per household credit from all sources for sample farmers was 143740 out of
which the credit amount from institutional sources excluding government programmes was
88034 (61.2 per cent). The contribution of institutional sources to total credit for marginal, small,
medium and large farmers was 63.1, 35.6, 32.0 and 72.1 per cent, respectively. At the aggregate,
per acre loan of 9924 was received by a sample farmer from various institutional sources and
per acre loan of 6237 was availed from various other government programmes. Looking at the

45
purpose of credit, all farmers taken together used the credit amount of 137360 (95.6 per cent)
per household in various productive activities such as agriculture and allied activities.
In Tamil Nadu, the average amount of loan taken from all sources worked out to 28382 per
household. Out of this amount, the share of institutional sources was a record 22395 per
household. The other sources were traders/moneylenders/land lords and friends and relatives.
Only marginal and small farmers borrowed money from moneylenders. It is interesting to note
that no sample respondents borrowed money from commission agents. At the aggregate,
borrowing per acre of net sown area stood at 8419. The highest amount of 6071 per acre was
obtained from banks. The loan taken per acre was found to be 7005 by marginal farmers,
whereas it was 10211 by the large framers. Looking at the purpose of credit, 87.5 per cent of
the total loan taken from all sources was for agriculture purpose and 3.4 per cent of the loan was
for animal husbandry. Thus, nearly 91 per cent of the loan availed by the sample respondents in
Tamil Nadu was for productive uses, leaving only a negligible 9 per cent, for non-productive
uses such as daily consumption and social ceremonies.
In West Bengal medium farmers followed by small farmers borrowed a large amount from the
institutional sources. The corresponding figures were 28,666 and 15035, respectively. The
marginal farmers contrastingly borrowed a large amount from the non-institutional sources viz.
commission agents, traders, money lenders, friends, etc. The non-availability of institutional
loans to the marginal farmers is a matter of deep concern. Examining the credit taken by purpose,
it was observed that a major part of the loans taken were spent in productive activities like
farming. However, while the large farmers used proportionately higher amounts of loans for
agricultural purposes, the marginal and small farmers were found spending proportionately
higher amount on non-productive uses like daily consumption and social ceremonies. In
Haryana, institutional loans from the banks constituted the major share followed by credit
received under the government programmes. The amount of per household credit availed was
210300 at the aggregate level and large farmers reaped higher benefits in comparison to other
categories. The disparities across farm size were glaring and a positive relationship emerged
between farm size and credit availability. In addition to credit received from institutional
sources, an amount of 3800 as credit was availed by the sample farmers under various
government programmes and small farmers received higher benefits of such credit in comparison
to other categories. Results about per acre credit availed by sample farmers were on the same
pattern. The large farmers availed per acre credit worth 13763 against 5702 by marginal and
3294 by small farm categories. Sample farm households received credit for agriculture and
animal husbandry purposes. It may be mentioned that credit for agriculture purpose was availed
by all categories of farmers irrespective of farm size but credit for animal husbandry purpose was
availed only by large category farmers. As expected, large farm households availed higher
amount of credit in comparison to other farm categories. It may be noticed that none of the
sample farmers availed credit for non-productive uses.
3.6 Assets holdings
The level of farm efficiency depends to a considerable degree on the investment made by
farmers on different farm assets. As credit was taken mostly for productive purposes in the
agricultural sector in almost all the states, a large amount of that went into building long term

46
agricultural assets. In Karnataka, among all agricultural assets biggest proportion was that of
tractor (including implements and accessories), electric tube well, followed by animals including
dairy and poultry shade. Overall per household assets value at the time of survey was measured
at 5.4 lakh for large farmers, 3.5 lakh for medium farmers, 2.5 lakh for small farmers and
1.5 lakh for the marginal farmers (Table 3.6 and Annexure Table 3.2A). Like credit, assts value
per acre was also higher for the marginal and small farmers as compared to medium and large
farmers. It varied from 96 thousand per acre for marginal farmers, 66 thousand for small
farmers, 47 thousand for medium farmers and 24 thousand for the large farmers. Overall, per
acre assets value among the selected farmers was 36.5 thousand.
In Andhra Pradesh farm implements like tractor, trolley, tiller, diesel pump sets, electric motors,
spray pump and storage bin accounted to 33424 per households and their value was 44 per cent
of the total farm assets value. The other important assets reported were cows, buffaloes, plough
bullocks and calves etc., whose value per household was measured as 42937 constituting about
56 percent of the total assets value. Among the size groups, the farm asset value per household
reported an increasing trend as the farm size increased. Per acre asset value of the sample
farmers accounted for 10743. Among the farm size group, a reverse trend was observed as the
size of land holdings increased, per acre asset value decreased. In Bihar, It was observed from
the field data that on average, each household had a total value of 37027 of productive assets at
reference year prices. These productive assets included tractor, trolley, harrow, tiller, plank,
threshing machine, reaper, pump sets, animals and other implements. It is noticed from the data
that major implements and animals were mostly with medium and large farm households. The
value of per acre total assets among the selected households was 5284. The analysis of data
revealed that in general, the assets value increased with the holdings with few exceptions.
In Rajasthan, the value of farm assets averaged at 368746 for all size of holdings with value of
farm assets held by the marginal farmers at 73470 while that of small, medium and large
farmers at 213124, 457572 and 645250, respectively. The livestock was found to be a
major component of total asset holdings for all categories of farmers. The value of total livestock
contributed to the extent of 26 per cent to 48 per cent to the total asset value of different farmer
categories. Looking at assets value per acre of NSA, large farmers were found to have lowest
value of farm assets of 33097 per acre while marginal farmers, small farmers and medium
farmers had a total asset value of 38650, 51374 and 55923 per acre, respectively. All
farmers taken together, a household had farm assets of 41213 per acre of NSA. In terms of
value of assets per acre, medium farmers had highest amount of asset values on tractor, trolley,
plank, threshing machine, manual fodder chaffer, spray pump, poultry and dairy sheds, cows and
calves compared to other categories of farmers.
In Tamil Nadu, total farm assets per household worked out to 177449 on aggregate. The farm
assets owned by large farmers per household were much higher 1130345 as against 82429
only by the marginal farmers. Wider variation in the value of machinery and livestock could be
found among the four size groups of sample respondents. The average value of farm assets per
acre was 43246. The value of assets owned by large farmer per acre of net sown area was
found to be the highest at 85503, whereas the small farmer had the lowest value of farm assets
per acre of net sown area. As far as value of farm assets was concerned the marginal farmers
were placed in a better position compared to small farmers. As regards tractor per acre of net

47
sown area owned by the farmers, the value of the tractor possessed by the large farmers was
equal to about double the value of the same owned by marginal farmers. In the case of live stock,
the marginal farmers possessed higher value per acre of net sown area compared to other
categories of farmers and by this they tried to supplement their income from agriculture.
In West Bengal, livestock occupied the prime position among all animate and inanimate assets
among all size classes. The average value of assets was much higher for the small farmers having
a distinct edge over the marginal and medium farmers in owning productive assets per
household. However, ownership of productive assets in terms of per acre value of assets brought
out a different picture. The medium farmers had the lowest average asset values per acre, in
comparison to them the marginal farmers turned out to have considerably higher asset value per
acre. On the whole, farmers in the survey area were accustomed to farming practices with
traditional instruments. This was reflected from the fact that modern machines and equipments
for mechanized agriculture were almost completely absent in the study area. However, one
should also consider the topography of the study area for reasoning out the possibility of
possessing farm equipments like tractors, tillers, combine harvesters etc. Nevertheless, the near
absence of modern equipments among all size classes of farmers in the study area unarguably
reflects financial constraints of the farmers to a great extent
The case of Haryana was totally opposite that of West Bengal. In our sampled households in
Haryana, each category of farm households possessed various inventories like milch animals,
tractors, pump sets and other minor farm assets. The sample farm households on an average
possessed assets worth 359030 at the aggregate. Farm size disparities were also wider. The
marginal category of farm households owned farm assets worth 56088 against 455755 by the
large farm category. It may be highlighted that value of farm assets increased with increasing
size of holding and indicated a positive relationship. As expected, households in marginal
category possessed minimum assets while large category farm households owned maximum by
indicating value of assets around 455753 per family. Tractors followed by milch animals were
the major assets owned by the households. The per acre value of farm assets owned by the
sampled farm households was 21960 at the aggregate level. Like per family assets,
farm size variations were a common phenomenon and medium size category possessed more
assets in value terms. Therefore, a positive relationship was not observed between farm size and
per acre value of farm assets.
3.7 Cropping pattern
Cropping pattern means area under cultivation of major crops. As our sample consists of
farmers who are beneficiary of National Horticultural Mission, thereby all the farmers were
growing some horticultural crops. Besides horticultural crops, they were growing a number of
other crops. The data in Table 3.7 presents cropping pattern followed by the selected farmers in
the seven states. The statistics presented in tables reveal that the selected farmers were growing,
paddy, wheat, coarse cereals, pulses, oilseeds sugarcane, cotton and horticultural crops. The
horticultural crops included fruits, vegetables, plantation, flowers, medicinal and aromatic
crops. Among the crops grown by the selected farmers in Karnataka, the proportion of different
crops show that coarse cereals including ragi and jowar contributed highest share, 32 percent in
the gross cropped area. Fruits occupied next position with 22 percent area. Oilseeds with third
48
position occupied 14 percent area. Pulses, floriculture and vegetables occupied around 5 to 10
percent area out of the total cropped area. The other crops that occupied minor area were wheat,
plantation, paddy and cotton. Among different farm size holdings, the large farmers preferred
traditional crops like coarse cereals, pulses, oilseeds and paddy. Share of large farmers in
horticultural crops like fruits, vegetables, floriculture, medicinal and aromatic crops, which were
mainly more labour intensive crops, was less than that of small and marginal farmers who had
comparatively higher share among these crops in comparison to traditional crops. In Andhra
Pradesh, out of 1846.94 acres of GCA, 43 per cent area was under horticultural crops and
remaining 57 per cent area was cultivated both during kharif and rabi period constituted of
paddy, groundnut and other pulse crops. Among the horticultural crops, mango and sweet-
orange reported the highest percentage of area, 28.7 and 21 per cent, respectively against the
field crops by the marginal farmers. While this trend was found due to more un-irrigated land
which was cultivated for horticultural crops and the government of Andhra Pradesh was
supplying seedlings of horticultural and other inputs through National Horticulture Mission
Scheme. Watershed Development Scheme, APMIP and Mahatma Gandhi National Rural
Development Project (MGNREGP) etc., also helped in bringing additional area under
horticultural crops.
Looking at cropping pattern in Bihar, paddy and maize were the most important crops during the
kharif season. The share of these two crops was 31 and 11 per cent, respectively in the gross
cropped area (GCA). In rabi season, wheat, pulses and oilseeds were prominently grown with
23.19, 4.69 and 3.13 per cent share, respectively in the GCA at the aggregate farm level. Out of
that cropped area, paddy and wheat covered 54.48 per cent area. Among the horticultural crops,
mango, litchi, vegetables and spices were grown, covering 27.03 per cent of the gross cropped
area on the aggregate. Mango was largely grown, which covered an area of 16.35 per cent of the
GCA. In Rajasthan among various kharif crops, maize was found as an important crop cultivated
by farmers of all categories and the share of maize in total GCA varied from 12 per cent to 27
per cent. The second important crop was bajra cultivated by farmers of all categories and its
share in total GCA varied from 7 per cent to 12 per cent. It may be noted that the medium and
large category farmers cultivated more area under commercial crops like oilseed and pulses
compared to marginal and small farmers. The area under horticulture crop for all selected farmer
categories ranged between 19 per cent and 27 per cent of GCA. The marginal farmers devoted
more area under mango and papaya crops consisting about 9.6 per cent and 8.4 per cent of total
horticulture area, respectively. The small and medium category of farmers devoted more area
under aonla, mango and coriander crops while large farmers grew coriander crop to the
maximum extent because this crop had a very good marketing channel in the region and was
fetched good profit for the farmers.
Cropping pattern followed by the sample farmers in Tamil Nadu reveals that farmers raised field
crops in kharif and rabi seasons and also cultivated horticultural crops of different varieties.
Total area under kharif crops accounted for 32 per cent of the total gross cropped area. Paddy,
maize, groundnut, sugarcane and cholam were the crops cultivated by the sample farmers during
the kharif season of the reference period. Among different crops cultivated during kharif season,
paddy was raised in more area compared to other crops by all the four categories of sample
farmers. Compared to kharif crop, the area under rabi was little lesser. The total area under rabi
crop worked out to 26.9 per cent of the gross cropped area. Likewise in kharif season, in the rabi
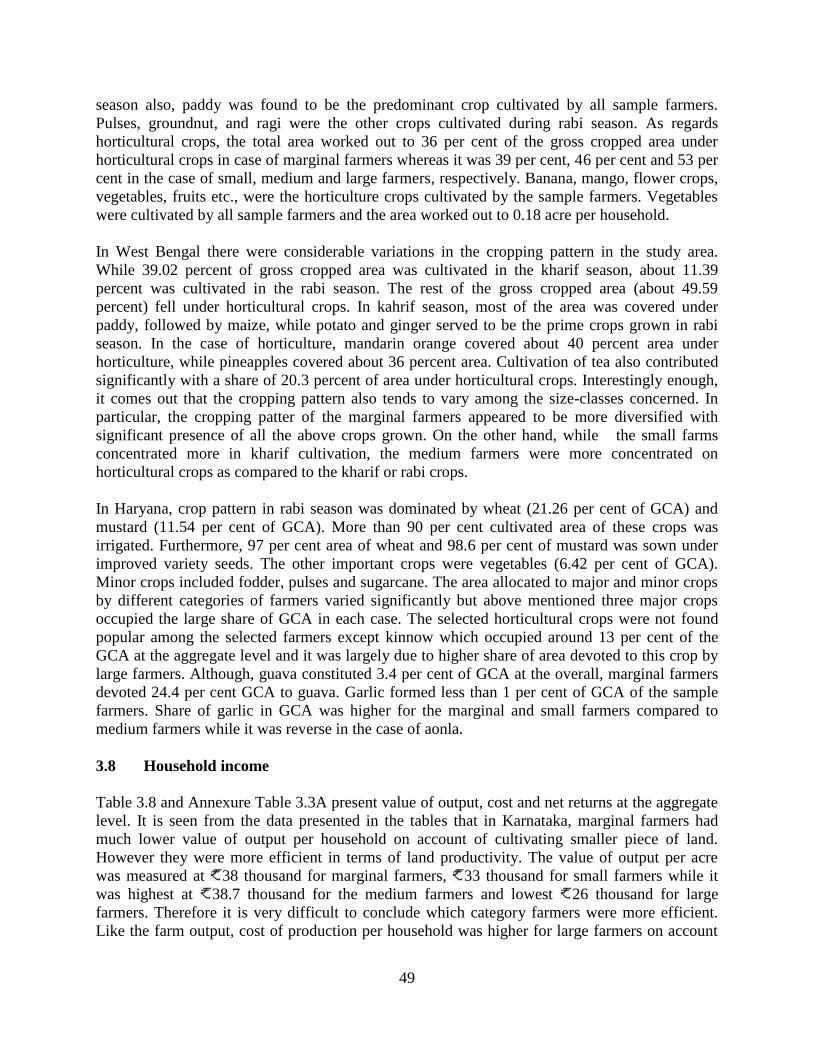
49
season also, paddy was found to be the predominant crop cultivated by all sample farmers.
Pulses, groundnut, and ragi were the other crops cultivated during rabi season. As regards
horticultural crops, the total area worked out to 36 per cent of the gross cropped area under
horticultural crops in case of marginal farmers whereas it was 39 per cent, 46 per cent and 53 per
cent in the case of small, medium and large farmers, respectively. Banana, mango, flower crops,
vegetables, fruits etc., were the horticulture crops cultivated by the sample farmers. Vegetables
were cultivated by all sample farmers and the area worked out to 0.18 acre per household.
In West Bengal there were considerable variations in the cropping pattern in the study area.
While 39.02 percent of gross cropped area was cultivated in the kharif season, about 11.39
percent was cultivated in the rabi season. The rest of the gross cropped area (about 49.59
percent) fell under horticultural crops. In kahrif season, most of the area was covered under
paddy, followed by maize, while potato and ginger served to be the prime crops grown in rabi
season. In the case of horticulture, mandarin orange covered about 40 percent area under
horticulture, while pineapples covered about 36 percent area. Cultivation of tea also contributed
significantly with a share of 20.3 percent of area under horticultural crops. Interestingly enough,
it comes out that the cropping pattern also tends to vary among the size-classes concerned. In
particular, the cropping patter of the marginal farmers appeared to be more diversified with
significant presence of all the above crops grown. On the other hand, while the small farms
concentrated more in kharif cultivation, the medium farmers were more concentrated on
horticultural crops as compared to the kharif or rabi crops.
In Haryana, crop pattern in rabi season was dominated by wheat (21.26 per cent of GCA) and
mustard (11.54 per cent of GCA). More than 90 per cent cultivated area of these crops was
irrigated. Furthermore, 97 per cent area of wheat and 98.6 per cent of mustard was sown under
improved variety seeds. The other important crops were vegetables (6.42 per cent of GCA).
Minor crops included fodder, pulses and sugarcane. The area allocated to major and minor crops
by different categories of farmers varied significantly but above mentioned three major crops
occupied the large share of GCA in each case. The selected horticultural crops were not found
popular among the selected farmers except kinnow which occupied around 13 per cent of the
GCA at the aggregate level and it was largely due to higher share of area devoted to this crop by
large farmers. Although, guava constituted 3.4 per cent of GCA at the overall, marginal farmers
devoted 24.4 per cent GCA to guava. Garlic formed less than 1 per cent of GCA of the sample
farmers. Share of garlic in GCA was higher for the marginal and small farmers compared to
medium farmers while it was reverse in the case of aonla.
3.8 Household income
Table 3.8 and Annexure Table 3.3A present value of output, cost and net returns at the aggregate
level. It is seen from the data presented in the tables that in Karnataka, marginal farmers had
much lower value of output per household on account of cultivating smaller piece of land.
However they were more efficient in terms of land productivity. The value of output per acre
was measured at 38 thousand for marginal farmers, 33 thousand for small farmers while it
was highest at 38.7 thousand for the medium farmers and lowest 26 thousand for large
farmers. Therefore it is very difficult to conclude which category farmers were more efficient.
Like the farm output, cost of production per household was higher for large farmers on account

50
of their higher area cultivated. Cost per acre, on the other hand, was comparatively higher for
marginal and small farmers as compared to large farmers because of economies of scale in the
latter case. Net household income from farm activities was measured at 93 thousand and it
varied from 22.6 thousand for marginal farmers to above 2 lakh for the large farmers. In
addition to farm business income, farmers also had earnings from the non-farm activities. The
average non-farm earnings were measured at 20 thousand for marginal farmers which
increased up to 54 thousand for the large farmers. Adding farm and non-farm income, the
aggregate household income was measured at 1.2 lakh varying from 43 thousand for the
marginal farmers to above 2.6 lakh for the large farmers.
In Andhra Pradesh, at the aggregate, average per household and per acre agricultural output
value was observed as 91906 and 14096. Per acre cost of production, both material and
labour was reported as 3281. The average per household and per acre net returns from farm
business was calculated as 53523 and 8209. Similarly, at the aggregate per household non-
farm income and total income were estimated at 11700 and 65223 whereby non-farm
income per household was 13 per cent of the total income. Across various farm size holdings,
per household output value was positively related with farm size. The cost of production per
acre both material and labour more or less was similar across farmer groups. The net returns
from farm (Farm business income) per household were maximum for large farmers 176588
and lowest 14214 for the marginal farmers. Across the farmer groups per household non-farm
income observed huge variations as this income depended on various non-farm activities. The
per household non-farm income was also maximum among large farmers 18567 followed by
marginal farmers 15274, medium farmers 10229 and 8825 for small farmers. Total income
per household was highest among large farmers 195154 which was followed by 109631 that
of medium farmers. The small and marginal farmers observed much less income because of
lower farm business income as well as that of non-farm income.
In Bihar, the value of output was observed as 45583 per household and 9637 per acre at the
aggregate. Farm wise analysis reveals that it was higher on large farms and lower on small farms
due the scale of production. Per acre cost of production was also separately calculated for
material and labour components, which showed that the per acre cost of production for material
components was 3977 whereas that of 1586 for labour component, accounting for 72 per cent
for materials and 28 per cent for labour component. It varied according to farm sizes. Per
household net returns were 20235 and per acre net returns were calculated as 4278. The non-
farm income was 5701 per household. However, it was higher on small farms ( 9012)
followed by large farms ( 5372), marginal farms ( 9012) and 4702 on medium farms. At the
aggregate, total income per household was calculated as 25936.
In Rajasthan, the gross value of output across all size groups of farmers was 186985 per
household, while the total cost of cultivation of all crops including material cost and labour cost
was 99452 per household. Thus the net return from cultivation of all types of crops was
87541 per household. The maximum annual net return from cultivation of agricultural crops was
earned by large farmers while minimum occurred among marginal farmers. Non-farm income
generated by all farmer categories taken together was 109232 per household. Small farmers
gained maximum non-farm income in percentage term (56.6 per cent) while the income
generated from non-farm activities by medium farmers, marginal farmers and large farmers was

51
42.06 per cent, 36.64 per cent and 32.44 per cent of total household income, respectively. The
average family income generated by our sample farmers from various farm and non-farm
activities was 196373 per household.
In Tamil Nadu The total value of output including by product in case of all the sample farmers
was to the tune of 262649 per household and 67346 per acre. Among the four categories of
sample farmers, value of output per acre was highest for small farmers followed by medium
farmers and it was lowest in the case of marginal farmers. The cost of cultivation per acre was
26542 in case of all the sample farmers. Net returns from agriculture were to the tune of 87541
per household and Rs.40804 per acre. Among the different categories of sample farmers the
highest net returns per acre of 44325 were obtained by medium farmers, whereas the lowest net
returns of 32273 were realized by marginal farmers. The earnings from non-farm activities
supplemented the farm activities with 30808 per household and thus the aggregate income per
household on average was measured at 189944 in Tamil Nadu.
In West Bengal, An analysis of value of value of output, costs and net returns among the various
size-classes of farmers belonging to the study area brought out that the average value of output
for all crops taken together tends to increase sharply with the increase in size of farms. Not only
in terms of value of output per households, but also the value of output per acre of land showed
an increasing pattern across the size-classes. This same pattern was also found in case of cost of
production (both material costs and labour cost), which sharply increased with the increase in
farm size. More importantly, it was observed that net returns (in terms of farm business income)
per acre of land also increased with the increase in size, which clearly reflects that the higher
size-classes were more successful at least in farm business operations, if not in generating
observed income (profit). On the other hand, the non-farm income of the sample farmers
appeared to decrease over increase in farm-size, which reflects that the larger farmers were less
involved in non-farm activities. The smaller farms, driven by acute financial distress, were often
compelled to opt for alternative sources of income to compensate for their smaller size. On the
whole, it was observed that the larger farms had considerable financial edge over their smaller
counterparts with much higher total income (farm income and non-farm income taken together)
per household.
In Haryana crop cultivation was the major source of income for farm households. Per household
net return from cultivation was 93145 during the reference year. However, wide variations
were noticed across different farm size holdings. As expected, per household income of large
farmers was almost ten times that of the marginal holdings. This disparity in net returns was
largely due to variations in the size of holdings. In addition to net returns from cultivation,
sample farmers earned 73340 during the reference year from non-farm employment which
included dairying, wage labour, services and pension, etc. After clubbing income from crop
cultivation and non-farm activities, per household income was 182711 during the reference
period. Owing to disparities in assets, large farm households earned the highest income. Thus, a
positive relationship emerged between farm size and income per farm household.
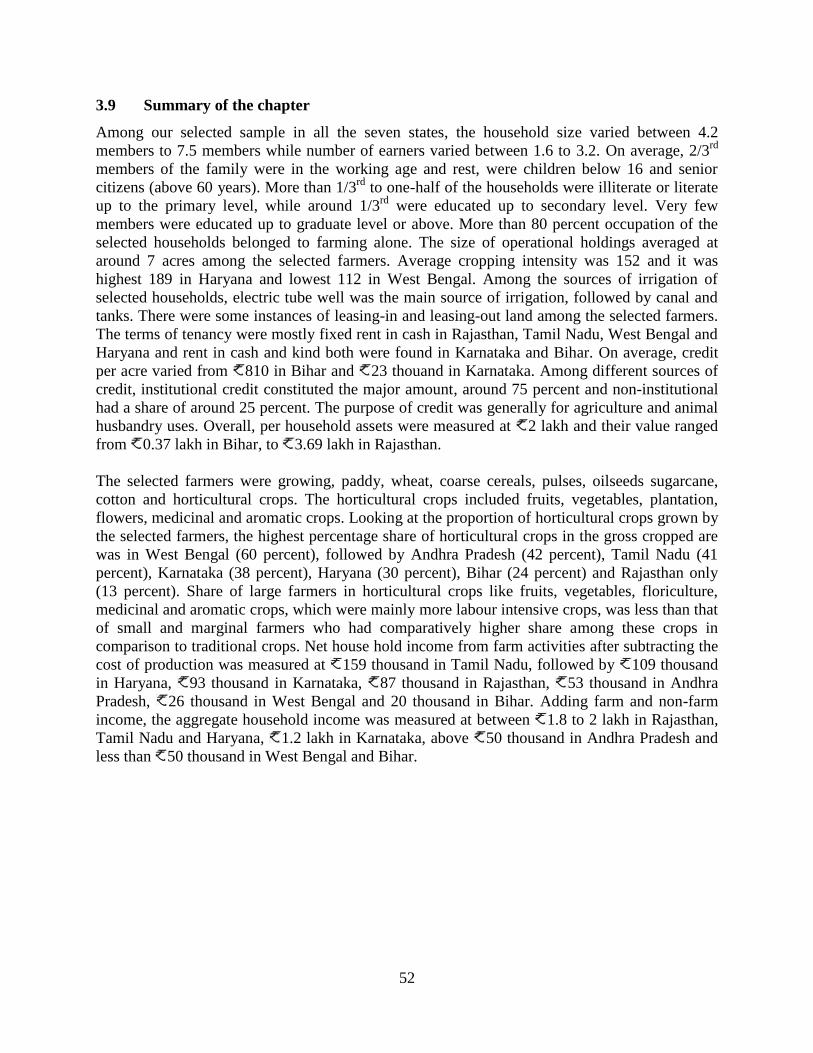
52
3.9 Summary of the chapter
Among our selected sample in all the seven states, the household size varied between 4.2
members to 7.5 members while number of earners varied between 1.6 to 3.2. On average, 2/3rd
members of the family were in the working age and rest, were children below 16 and senior
citizens (above 60 years). More than 1/3rd
to one-half of the households were illiterate or literate
up to the primary level, while around 1/3rd
were educated up to secondary level. Very few
members were educated up to graduate level or above. More than 80 percent occupation of the
selected households belonged to farming alone. The size of operational holdings averaged at
around 7 acres among the selected farmers. Average cropping intensity was 152 and it was
highest 189 in Haryana and lowest 112 in West Bengal. Among the sources of irrigation of
selected households, electric tube well was the main source of irrigation, followed by canal and
tanks. There were some instances of leasing-in and leasing-out land among the selected farmers.
The terms of tenancy were mostly fixed rent in cash in Rajasthan, Tamil Nadu, West Bengal and
Haryana and rent in cash and kind both were found in Karnataka and Bihar. On average, credit
per acre varied from 810 in Bihar and 23 thouand in Karnataka. Among different sources of
credit, institutional credit constituted the major amount, around 75 percent and non-institutional
had a share of around 25 percent. The purpose of credit was generally for agriculture and animal
husbandry uses. Overall, per household assets were measured at 2 lakh and their value ranged
from 0.37 lakh in Bihar, to 3.69 lakh in Rajasthan.
The selected farmers were growing, paddy, wheat, coarse cereals, pulses, oilseeds sugarcane,
cotton and horticultural crops. The horticultural crops included fruits, vegetables, plantation,
flowers, medicinal and aromatic crops. Looking at the proportion of horticultural crops grown by
the selected farmers, the highest percentage share of horticultural crops in the gross cropped are
was in West Bengal (60 percent), followed by Andhra Pradesh (42 percent), Tamil Nadu (41
percent), Karnataka (38 percent), Haryana (30 percent), Bihar (24 percent) and Rajasthan only
(13 percent). Share of large farmers in horticultural crops like fruits, vegetables, floriculture,
medicinal and aromatic crops, which were mainly more labour intensive crops, was less than that
of small and marginal farmers who had comparatively higher share among these crops in
comparison to traditional crops. Net house hold income from farm activities after subtracting the
cost of production was measured at 159 thousand in Tamil Nadu, followed by 109 thousand
in Haryana, 93 thousand in Karnataka, 87 thousand in Rajasthan, 53 thousand in Andhra
Pradesh, 26 thousand in West Bengal and 20 thousand in Bihar. Adding farm and non-farm
income, the aggregate household income was measured at between 1.8 to 2 lakh in Rajasthan,
Tamil Nadu and Haryana, 1.2 lakh in Karnataka, above 50 thousand in Andhra Pradesh and
less than 50 thousand in West Bengal and Bihar.
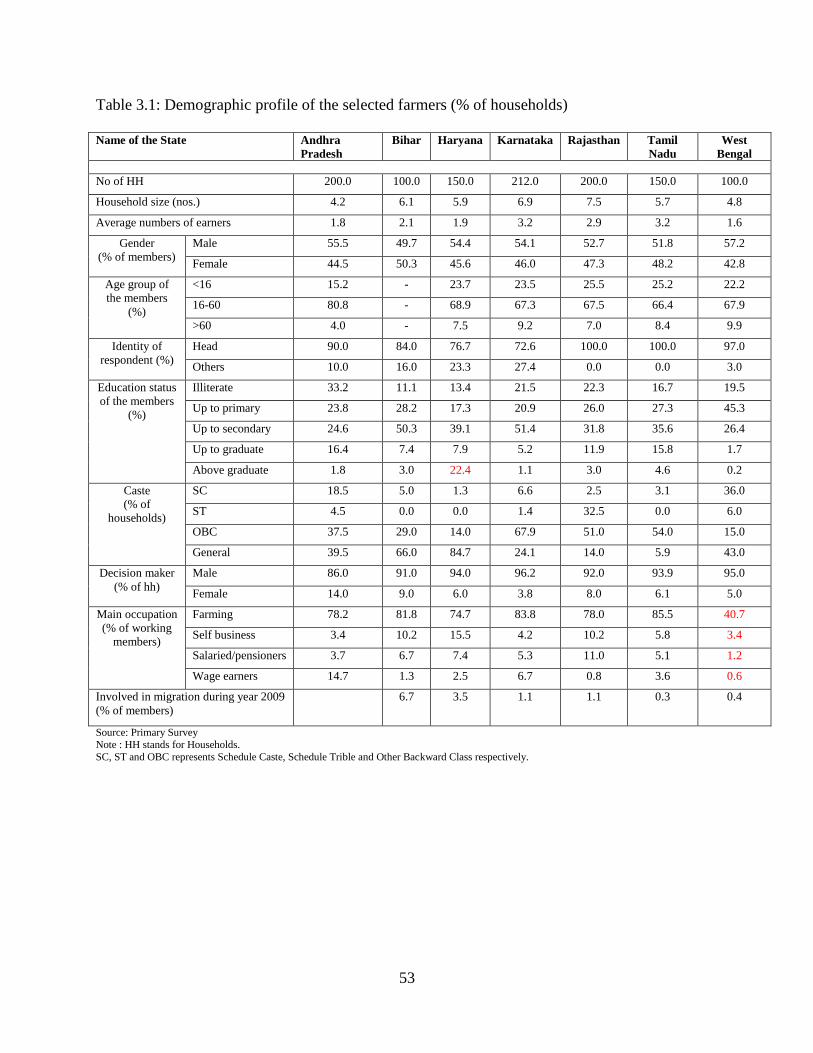
53
Table 3.1: Demographic profile of the selected farmers (% of households)
Name of the State Andhra
Pradesh
Bihar Haryana Karnataka Rajasthan Tamil
Nadu
West
Bengal
No of HH 200.0 100.0 150.0 212.0 200.0 150.0 100.0
Household size (nos.) 4.2 6.1 5.9 6.9 7.5 5.7 4.8
Average numbers of earners 1.8 2.1 1.9 3.2 2.9 3.2 1.6
Gender
(% of members)
Male 55.5 49.7 54.4 54.1 52.7 51.8 57.2
Female 44.5 50.3 45.6 46.0 47.3 48.2 42.8
Age group of
the members
(%)
<16 15.2 - 23.7 23.5 25.5 25.2 22.2
16-60 80.8 - 68.9 67.3 67.5 66.4 67.9
>60 4.0 - 7.5 9.2 7.0 8.4 9.9
Identity of
respondent (%)
Head 90.0 84.0 76.7 72.6 100.0 100.0 97.0
Others 10.0 16.0 23.3 27.4 0.0 0.0 3.0
Education status
of the members
(%)
Illiterate 33.2 11.1 13.4 21.5 22.3 16.7 19.5
Up to primary 23.8 28.2 17.3 20.9 26.0 27.3 45.3
Up to secondary 24.6 50.3 39.1 51.4 31.8 35.6 26.4
Up to graduate 16.4 7.4 7.9 5.2 11.9 15.8 1.7
Above graduate 1.8 3.0 22.4 1.1 3.0 4.6 0.2
Caste
(% of
households)
SC 18.5 5.0 1.3 6.6 2.5 3.1 36.0
ST 4.5 0.0 0.0 1.4 32.5 0.0 6.0
OBC 37.5 29.0 14.0 67.9 51.0 54.0 15.0
General 39.5 66.0 84.7 24.1 14.0 5.9 43.0
Decision maker
(% of hh)
Male 86.0 91.0 94.0 96.2 92.0 93.9 95.0
Female 14.0 9.0 6.0 3.8 8.0 6.1 5.0
Main occupation
(% of working
members)
Farming 78.2 81.8 74.7 83.8 78.0 85.5 40.7
Self business 3.4 10.2 15.5 4.2 10.2 5.8 3.4
Salaried/pensioners 3.7 6.7 7.4 5.3 11.0 5.1 1.2
Wage earners 14.7 1.3 2.5 6.7 0.8 3.6 0.6
Involved in migration during year 2009
(% of members)
6.7 3.5 1.1 1.1 0.3 0.4
Source: Primary Survey
Note : HH stands for Households.
SC, ST and OBC represents Schedule Caste, Schedule Trible and Other Backward Class respectively.

54
Table 3.2: Characteristics of operational holdings (acres per household)
Name of the state Andhra
Pradesh Bihar Haryana Karnataka Rajasthan Tamil Nadu
West
Bengal
Owned Land
Marginal 2.3 2.0 1.4 1.8 1.9 1.9 1.6
Small 4.2 3.7 3.3 3.9 4.1 4.5 3.3
Medium 7.2 6.3 5.9 7.5 8.2 8.1 6.9
Large 14.8 12.4 22.3 23.3 19.7 11.4 0.0
Total 6.4 6.1 16.4 9.0 9.0 3.6 2.0
Cultivable Waste
Marginal 0.0 0.2 0.0 0.1 0.0 0.0 0.0
Small 0.0 0.6 0.0 0.0 0.0 0.0 0.0
Medium 0.0 0.8 0.0 0.1 0.0 0.0 0.0
Large 0.0 0.9 0.0 0.1 0.0 0.0 0.0
Total 0.0 0.7 0.0 0.1 0.0 0.0 0.0
Non Cultivable land
Marginal 0.0 0.0 0.0 0.2 0.0 0.0 0.2
Small 0.0 0.1 0.0 0.1 0.0 0.0 0.1
Medium 0.0 0.4 0.0 0.2 0.0 0.0 0.1
Large 0.1 0.7 0.1 1.0 0.0 0.0 0.0
Total 0.0 0.3 0.1 0.4 0.0 0.0 0.2
Leased in
Marginal 0.0 0.1 0.1 0.1 0.1 0.1 0.5
Small 0.0 0.0 0.3 0.1 0.1 0.0 0.0
Medium 0.2 0.0 0.4 0.4 0.0 0.5 0.0
Large 0.6 0.0 0.7 0.8 0.0 2.0 0.0
Total 0.2 0.0 0.6 0.3 0.1 0.3 0.4
Leased out
Marginal 0.0 0.0 0.0 0.0 0.0 0.0 0.0
Small 0.0 0.0 0.0 0.1 0.0 0.0 0.0
Medium 0.0 0.3 0.0 0.2 0.0 0.0 0.0
Large 0.0 1.4 0.0 0.7 0.0 0.0 0.0
Total 0.0 0.4 0.0 0.3 0.0 0.0 0.2
NOA
Marginal 2.3 1.8 1.5 1.6 1.9 1.9 1.8
Small 4.2 3.0 3.6 3.8 4.2 4.5 3.2
Medium 7.4 4.8 6.3 7.4 8.2 8.6 6.8
Large 15.3 9.5 23.0 22.3 19.7 13.4 0.0
Total 6.5 4.7 16.9 8.6 9.0 3.9 2.0
GCA
Marginal 3.2 2.5 3.5 2.2 3.7 3.3 1.8
Small 7.0 4.2 7.5 4.7 9.4 7.4 3.5
Medium 10.4 7.2 12.5 9.4 16.6 13.6 6.8
Large 19.5 14.4 43.1 28.6 33.7 20.0 0.0
Total 9.3 7.0 32.0 11.0 16.8 6.2 2.2
Cropping intensity
Marginal 141.2 145.1 224.1 139.4 194.2 173.7 101.7
Small 164.5 140.9 208.5 122.8 226.5 164.4 108.4
Medium 139.9 149.3 197.1 126.5 203.4 157.7 100.0
Large 127.3 151.8 187.5 128.3 170.6 149.3 -
Total 142.0 148.6 188.8 127.9 186.0 159.0 111.6 Source: Primary Survey Note: NOA implies Net Operated Area, GCA implies Gross Cropped Area

55
Table 3.3: Nature of tenancy in leasing in lands (%)
Name of the state Bihar Haryana Karnataka Rajasthan Tamil Nadu West Bengal
Share Cropping
Marginal 0.0 0.0 50.0 0.0 0.0 0.0
Small 0.0 0.0 100.0 0.0 0.0 0.0
Medium 0.0 0.0 20.0 0.0 0.0 0.0
Large 0.0 0.0 0.0 0.0 0.0 0.0
Total 0.0 0.0 21.4 0.0 0.0 0.0
Fixed rent in cash
Marginal 43.0 100.0 50.0 100.0 100.0 100.0
Small 0.0 100.0 0.0 100.0 100.0 0.0
Medium 0.0 100.0 60.0 100.0 100.0 0.0
Large 0.0 83.3 75.0 100.0 100.0 0.0
Total 36.2 92.3 64.3 100.0 100.0 100.0
Fixed rent in kind
Marginal 57.0 0.0 0.0 0.0 0.0 0.0
Small 100.0 0.0 0.0 0.0 0.0 0.0
Medium 0.0 0.0 20.0 0.0 0.0 0.0
Large 0.0 16.7 25.0 0.0 0.0 0.0
Total 63.8 7.7 14.3 0.0 0.0 0.0
Against Labour
Marginal 0.0 0.0 0.0 0.0 0.0 0.0
Small 0.0 0.0 0.0 0.0 0.0 0.0
Medium 0.0 0.0 0.0 0.0 0.0 0.0
Large 0.0 0.0 0.0 0.0 0.0 0.0
Total 0.0 0.0 0.0 0.0 0.0 0.0 Source: Primary Survey Note: Data is not available for Andhra Pradesh

56
Table 3.4(a): Source of irrigation of the Net Operated Area (Acres)
Name of the state Karnataka Rajasthan Tamil
Nadu
West Bengal
Only Canal Marginal 0.0 0.1 0.1 0.0
Small 0.1 0.1 0.6 0.0
Medium 0.1 0.3 0.9 0.0
Large 0.0 0.4 1.3 0.0
Total 0.0 0.2 0.4 0.0
Canal + Tube well Marginal 0.3 0.0 1.4 0.0
Small 0.4 0.0 2.7 0.0
Medium 0.7 0.3 6.0 0.0
Large 2.3 3.5 9.2 0.0
Total 0.9 1.0 2.6 0.0
Only Electric
tube well
Marginal 1.0 0.7 0.0 0.0
Small 2.4 3.0 0.0 0.0
Medium 4.9 5.7 0.0 0.0
Large 8.3 12.9 0.0 0.0
Total 4.0 5.9 0.0 0.0
Only diesel
tube well
Marginal 0.0 0.5 0.0 0.0
Small 0.0 0.4 0.0 0.0
Medium 0.0 0.9 0.0 0.0
Large 0.0 1.7 0.0 0.0
Total 0.0 0.9 0.0 0.0
Tanks and others Marginal 0.0 0.1 0.1 0.1 Small 0.2 0.3 0.6 0.0
Medium 0.0 0.1 0.9 0.0 Large 0.0 0.0 1.4 0.0 Total 0.1 0.1 0.4 0.1
Rainfed area Marginal 0.3 0.5 0.3 1.3 Small 0.8 0.3 0.7 3.2
Medium 1.7 0.9 0.9 6.8 Large 11.7 1.3 1.5 0.0 Total 3.6 0.8 0.5 1.7
Total operated area Marginal 1.6 1.9 1.9 1.4 Small 3.8 4.2 4.5 3.2
Medium 7.4 8.2 8.6 6.8 Large 22.3 19.7 13.4 0.0 Total 8.6 9.0 3.8 1.8
Source: Primary Survey
Note: Data is not available for Andhra Pradesh, Bihar and Haryana States

57
Table 3.4(b): Source of irrigation of the Net Operated Area (in %)
Name of the state Andhra
Pradesh
Bihar Karnataka Rajasthan Tamil
Nadu
West
Bengal
Only Canal Marginal 0.0 0.0 0.0 7.1 4.7 0.0
Small 0.0 0.0 1.8 1.9 12.4 0.0
Medium 0.0 0.0 1.7 3.6 10.7 0.0
Large 0.0 0.0 0.0 2.1 9.7 0.0
Total 0.0 0.0 0.5 2.7 9.2 0.0
Canal +
Tubewell
Marginal 15.0 0.0 19.2 0.0 74.5 0.0
Small 12.3 0.0 11.6 0.0 60.3 0.0
Medium 3.7 0.0 10.0 3.7 69.5 0.0
Large 3.5 0.0 10.2 17.7 68.9 0.0
Total 6.4 0.0 10.8 11.4 68.0 0.0
Only Electric
tubewell
Marginal 18.3 14.4 60.1 35.2 0.0 0.0
Small 59.9 13.4 63.6 72.9 0.0 0.0
Medium 54.1 9.7 67.4 70.2 0.0 0.0
Large 46.3 8.9 37.2 65.3 0.0 0.0
Total 50.7 10.2 46.1 65.9 0.0 0.0
Only diesel
tubewell
Marginal 23.1 66.2 0.0 27.8 0.0 0.0
Small 11.3 64.7 0.0 10.2 0.0 0.0
Medium 7.6 77.2 0.0 10.5 0.0 0.0
Large 1.1 76.9 0.0 8.6 0.0 0.0
Total 7.1 74.7 0.0 10.2 0.0 0.0
Tanks and
others
Marginal 0.0 15.8 2.7 5.2 6.3 5.2
Small 15.5 4.0 7.9 12.2 0.0
Medium 3.4 9.7 0.0 1.5 9.8 0.0
Large 4.6 6.8 0.0 0.0 10.5 0.0
Total 2.7 9.8 0.7 1.4 9.2 3.3
Rainfed area Marginal 43.7 3.6 18.1 24.6 14.6 94.8
Small 16.5 6.4 20.9 7.1 15.1 100.0
Medium 31.4 3.5 22.6 10.6 10.0 100.0
Large 44.6 7.5 52.7 6.3 10.9 0.0
Total 33.1 5.3 42.4 8.4 13.6 96.7
Total operated
area
Marginal 100.0 100.0 100.0 100.0 100.0 100.0
Small 100.0 100.0 100.0 100.0 100.0 100.0
Medium 100.0 100.0 100.0 100.0 100.0 100.0
Large 100.0 100.0 100.0 100.0 100.0 0.0
Total 100.0 100.0 100.0 100.0 100.0 100.0
Source: Primary Survey
Note : Data is not available for Haryana State

58
Table 3.5(a): Details of source of credit by the selected households
Name of the state Andhra
Pradesh Bihar Haryana Karnataka Rajasthan Tamil Nadu West Bengal
Andhra
Pradesh Bihar Haryana Karnataka Rajasthan
Tamil
Nadu West Bengal
Farm size Rs. Per Household Rs. Per Acre
Institutional
loan by bank
Marginal 19677 706 8125 13542 9977 13450 5874 8055 403 5702 8752 5249 7005 4064
Small 29175 1250 10769 100643 16844 16320 15036 6280 422 3294 26335 4060 3619 4687
Medium 49271 3581 23276 193014 33141 46500 28667 6232 741 3947 25931 4050 5388 4203
Large 77967 1000 306650 380869 267290 135000 0 4763 106 13763 17093 13710 10212 0
Total 40950 2115 210300 164353 88034 22396 7841 5830 447 12860 19165 9839 6072 4240
Commission
agents
Marginal 581 0 0 2797 0 0 566 238 0 0 1807 0 0 408
Small 238 0 0 0 0 0 0 51 0 0 0 0 0 0
Medium 1017 0 0 0 0 0 0 129 0 0 0 0 0 0
Large 1167 0 0 0 0 0 0 71 0 0 0 0 0 0
Total 660 0 0 778 0 0 470 94 0 0 91 0 0 260
Trade/ML/
Landlord
Marginal 3194 474 0 31102 1750 4000 1387 1307 271 0 20100 921 2083 977
Small 6538 925 0 26000 0 3500 571 1407 313 0 6803 0 776 178
Medium 9932 395 0 20000 0 0 0 1256 82 0 2687 0 0 0
Large 14110 2361 0 909 0 0 0 862 249 0 41 0 0 0
Total 8156 879 0 19920 382 3237 1232 1161 186 0 2323 43 1428 668
Friends/
Relatives
Marginal 0 479 0 14576 0 2500 625
274 0 9420 0 1302 437
Small 1562 364 0 6889 0 0 357 336 123 0 1803 0 0 111
Medium 475 663 0 4286 0 10000 0 60 137 0 576 0 1159 0
Large 6667 671 0 8182 0 0 0 407 71 0 367 0 0 0
Total 1765 567 0 8934 0 2750 569 251 120 0 1042 0 919 307
Govt. programme
Marginal 0 147 0 0 4091 0 0
84 0 0 2152 0 0
Small 688 0 15385 0 30444 0 0 148 0 4706 0 7339 0 0
Medium 508 115 2414 0 70403 0 0 64 24 409 0 8605 0 0
Large 2667 178 3000 0 103488 0 0 163 19 135 0 5308 0 0
Total 825 107 3800 0 55324 0 0 117 23 232 0 6183 0 0
Others
Marginal 0 209 0 1986 0 0 0 0 120 0 1284 0 0 0
Small 0 571 0 508 0 0 0 0 193 0 133 0 0 0
Medium 0 0 0 10571 0 0 0 0 0 0 1420 0 0 0
Large 0 0 0 13527 0 0 0 0 0 0 607 0 0 0
Total 0 161 0 5958 0 0 0 0 34 0 695 0 0 0
Total
Marginal 23452 2015 8125 64003 15818 19950 8453 9600 1152 5702 41363 8321 10391 5887
Small 38201 3110 26154 134040 47289 19820 15964 8222 1051 8000 35074 11399 4395 4977
Medium 61203 4755 25690 227871 103544 56500 28667 7741 984 4356 30614 12655 6547 4203
Large 102578 4210 309650 403487 370778 135000 0 6266 445 13898 18108 19019 10212 0
Total 52356 3829 214100 199943 143740 28383 10111 7453 810 13092 23316 16065 8419 5476
Source: Primary Survey
Note: ML implies Money lenders
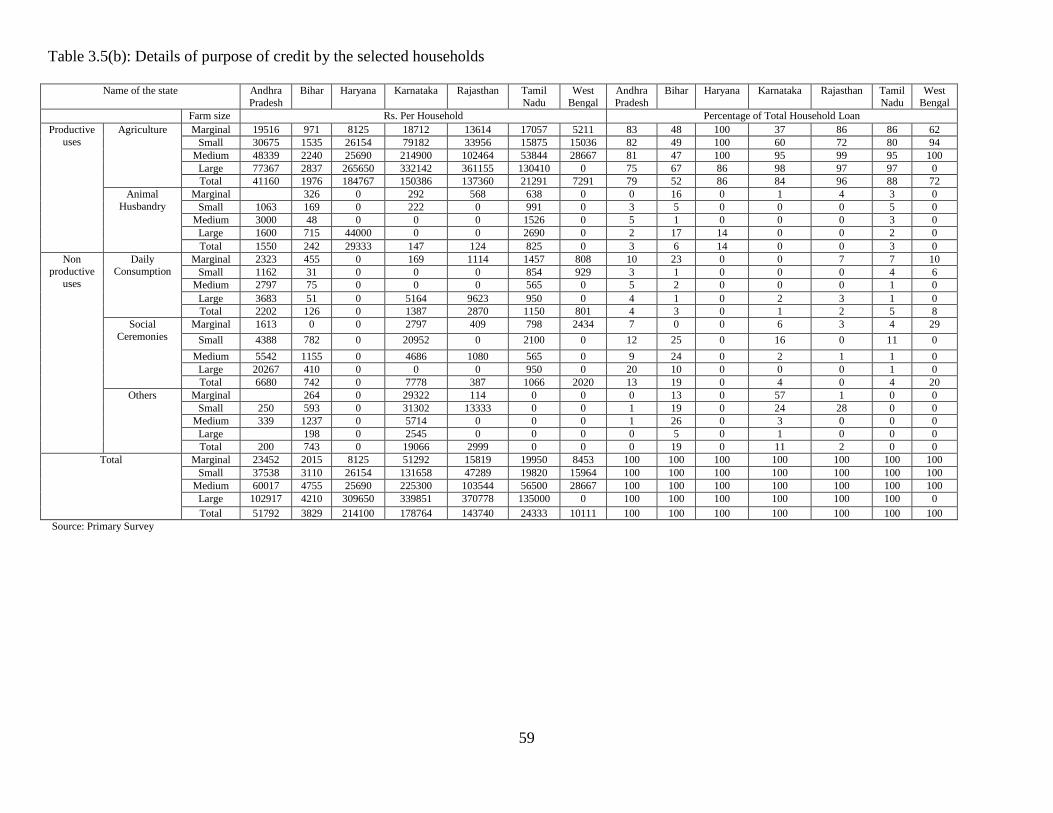
59
Table 3.5(b): Details of purpose of credit by the selected households
Name of the state Andhra
Pradesh
Bihar Haryana Karnataka Rajasthan Tamil
Nadu
West
Bengal
Andhra
Pradesh
Bihar Haryana Karnataka Rajasthan Tamil
Nadu
West
Bengal
Farm size Rs. Per Household Percentage of Total Household Loan
Productive
uses
Agriculture Marginal 19516 971 8125 18712 13614 17057 5211 83 48 100 37 86 86 62
Small 30675 1535 26154 79182 33956 15875 15036 82 49 100 60 72 80 94
Medium 48339 2240 25690 214900 102464 53844 28667 81 47 100 95 99 95 100
Large 77367 2837 265650 332142 361155 130410 0 75 67 86 98 97 97 0
Total 41160 1976 184767 150386 137360 21291 7291 79 52 86 84 96 88 72
Animal
Husbandry
Marginal 326 0 292 568 638 0 0 16 0 1 4 3 0
Small 1063 169 0 222 0 991 0 3 5 0 0 0 5 0
Medium 3000 48 0 0 0 1526 0 5 1 0 0 0 3 0
Large 1600 715 44000 0 0 2690 0 2 17 14 0 0 2 0
Total 1550 242 29333 147 124 825 0 3 6 14 0 0 3 0
Non
productive
uses
Daily
Consumption
Marginal 2323 455 0 169 1114 1457 808 10 23 0 0 7 7 10
Small 1162 31 0 0 0 854 929 3 1 0 0 0 4 6
Medium 2797 75 0 0 0 565 0 5 2 0 0 0 1 0
Large 3683 51 0 5164 9623 950 0 4 1 0 2 3 1 0
Total 2202 126 0 1387 2870 1150 801 4 3 0 1 2 5 8
Social
Ceremonies
Marginal 1613 0 0 2797 409 798 2434 7 0 0 6 3 4 29
Small 4388 782 0 20952 0 2100 0 12 25 0 16 0 11 0
Medium 5542 1155 0 4686 1080 565 0 9 24 0 2 1 1 0
Large 20267 410 0 0 0 950 0 20 10 0 0 0 1 0
Total 6680 742 0 7778 387 1066 2020 13 19 0 4 0 4 20
Others Marginal 264 0 29322 114 0 0 0 13 0 57 1 0 0
Small 250 593 0 31302 13333 0 0 1 19 0 24 28 0 0
Medium 339 1237 0 5714 0 0 0 1 26 0 3 0 0 0
Large 198 0 2545 0 0 0 0 5 0 1 0 0 0
Total 200 743 0 19066 2999 0 0 0 19 0 11 2 0 0
Total Marginal 23452 2015 8125 51292 15819 19950 8453 100 100 100 100 100 100 100
Small 37538 3110 26154 131658 47289 19820 15964 100 100 100 100 100 100 100
Medium 60017 4755 25690 225300 103544 56500 28667 100 100 100 100 100 100 100
Large 102917 4210 309650 339851 370778 135000 0 100 100 100 100 100 100 0
Total 51792 3829 214100 178764 143740 24333 10111 100 100 100 100 100 100 100
Source: Primary Survey

60
Table 3.6: Ownership of productive assets
Name of the States Andhra
Pradesh
Bihar Haryana Karnataka Rajasthan Tamil
Nadu
West
Bengal
Andhra
Pradesh
Bihar Haryana Karnataka Rajasthan Tamil
Nadu
West
Bengal
Total (Marginal., Small, Medium, Large)
Assets Rs. Per Household Rs. Per Acre
Tractor 18100 18861 144687 83972 128400 47567 0 2576 2683 8850 9792 14351 10649 0
Trolley 950 948 25747 9844 21895 7207 0 135 135 1575 1148 2447 1575 0
Harrow _ 304 11120 760 4840 2399 357 _ 43 680 89 541 467 161
Tiller 160 340 3648 4942 5993 5600 0 22 48 223 576 670 871 0
Plank _ 342 3775 1481 3198 0 0 _ 49 231 173 357 0 0
Threshing machine _ 3205 11973 236 15225 0 597 _ 456 732 28 1702 0 269
Pumpset diesel 2365 1153 11353 2493 4125 2773 323 336 164 694 291 461 401 146
Pumpset electric 9904 905 32242 128221 31895 36100 169 1409 129 1972 14951 3565 11908 76
Bullock cart 4339 1906 2987 5323 3650 1853 395 617 271 183 621 408 199 178
Spray pump 1987 234 4525 7700 2583 1773 197 282 33 277 898 289 631 89
Storage bin 18 722 493 3646 2279 _ 380 2 121 30 425 255 _ 171
Poultry shed _ 273 10000 4851 2305 _ 615 _ 39 612 566 258 _ 278
Dairy shed _ 746 867 15458 13765 5339 978 _ 106 53 1802 1538 1654 441
Animals _ 4800 82494 35118 114797 43544 7691 5494 682 5046 4095 12830 13004 3471
Combine harvester 38598 7333 _ 0 _ 0 _ 449 _ 0 _ 0
Other reaper _ 822 867 _ 0 _ 0 _ 117 53 _ 0 _ 0
Fodder chaffer: _ _ _ _ _ _ _ _ _ _ _ _ _ _
(I) Manual _ 542 358 _ 1168 _ 0 _ 77 22 _ 130 _ 0
(ii) Power driven _ 4563 _ 1558 _ 0 _ 279 _ 174 _ 0
Others _ 924 _ 9759 11070 23292 254 _ 131 _ 1138 1237 1887 115
Total 76421 37027 359032 313804 368746 177447 11956 10873 5284 21961 36593 41213 43246 5396
Source: Primary Survey
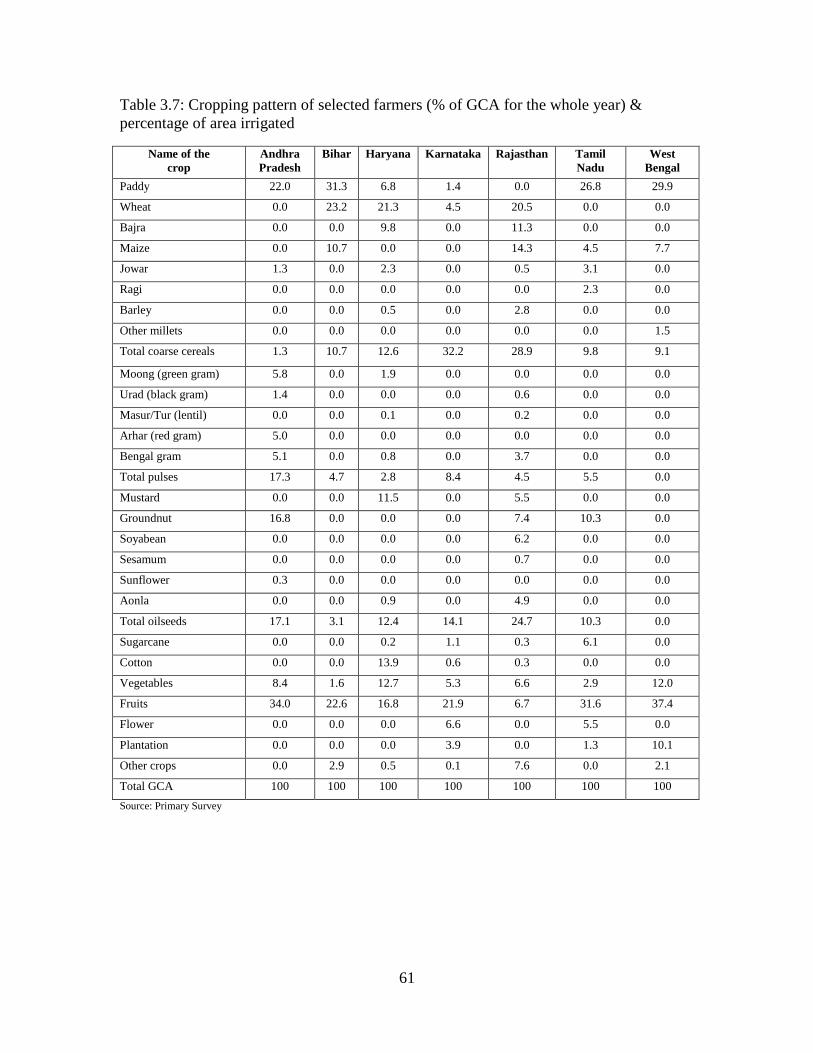
61
Table 3.7: Cropping pattern of selected farmers (% of GCA for the whole year) &
percentage of area irrigated
Name of the
crop
Andhra
Pradesh
Bihar Haryana Karnataka Rajasthan Tamil
Nadu
West
Bengal
Paddy 22.0 31.3 6.8 1.4 0.0 26.8 29.9
Wheat 0.0 23.2 21.3 4.5 20.5 0.0 0.0
Bajra 0.0 0.0 9.8 0.0 11.3 0.0 0.0
Maize 0.0 10.7 0.0 0.0 14.3 4.5 7.7
Jowar 1.3 0.0 2.3 0.0 0.5 3.1 0.0
Ragi 0.0 0.0 0.0 0.0 0.0 2.3 0.0
Barley 0.0 0.0 0.5 0.0 2.8 0.0 0.0
Other millets 0.0 0.0 0.0 0.0 0.0 0.0 1.5
Total coarse cereals 1.3 10.7 12.6 32.2 28.9 9.8 9.1
Moong (green gram) 5.8 0.0 1.9 0.0 0.0 0.0 0.0
Urad (black gram) 1.4 0.0 0.0 0.0 0.6 0.0 0.0
Masur/Tur (lentil) 0.0 0.0 0.1 0.0 0.2 0.0 0.0
Arhar (red gram) 5.0 0.0 0.0 0.0 0.0 0.0 0.0
Bengal gram 5.1 0.0 0.8 0.0 3.7 0.0 0.0
Total pulses 17.3 4.7 2.8 8.4 4.5 5.5 0.0
Mustard 0.0 0.0 11.5 0.0 5.5 0.0 0.0
Groundnut 16.8 0.0 0.0 0.0 7.4 10.3 0.0
Soyabean 0.0 0.0 0.0 0.0 6.2 0.0 0.0
Sesamum 0.0 0.0 0.0 0.0 0.7 0.0 0.0
Sunflower 0.3 0.0 0.0 0.0 0.0 0.0 0.0
Aonla 0.0 0.0 0.9 0.0 4.9 0.0 0.0
Total oilseeds 17.1 3.1 12.4 14.1 24.7 10.3 0.0
Sugarcane 0.0 0.0 0.2 1.1 0.3 6.1 0.0
Cotton 0.0 0.0 13.9 0.6 0.3 0.0 0.0
Vegetables 8.4 1.6 12.7 5.3 6.6 2.9 12.0
Fruits 34.0 22.6 16.8 21.9 6.7 31.6 37.4
Flower 0.0 0.0 0.0 6.6 0.0 5.5 0.0
Plantation 0.0 0.0 0.0 3.9 0.0 1.3 10.1
Other crops 0.0 2.9 0.5 0.1 7.6 0.0 2.1
Total GCA 100 100 100 100 100 100 100
Source: Primary Survey

62
Table 3.8: Value of output, cost and net returns for the survey year- Aggregate of all
crops (Rs.)
Name of the
States
Value of output
(Main+ Byproduct) Cost of production
Net returns
(Farm business income)
Non-
farm
income
Total
income
Per
HH Per Acre Per HH Per Acre Per HH Per Acre Per HH Per HH
Andhra Pradesh 91906 14096 21392 3281 53523 8209 11700 65223
Bihar 45583 9637 26313 5563 20235 4278 5701 25936
Haryana 198472 11730 87003 5142 109371 6464 73340 182711
Karnataka 226162 26372 133017 15511 93145 10861 26807 119952
Rajasthan 186985 20753 99452 11038 87541 9716 109232 196773
Tamil Nadu 262649 67346 103514 26542 159136 40804 30808 189944
West Bengal 70008 35180 43240 21728 26649 13391 19939 46588
Source: Primary Survey Note: HH- Household

63
Chapter 4
The Production Structure and Resource Use under Horticultural Crops
The horticulture sector encompasses a wide range of crops namely fruit crops, vegetables
crops, potato and tuber crops, ornamental crops, medicinal and aromatic crops, spices and
plantation crops. New introductions like mushroom, bamboo and bee keeping further
expanded the scope of horticulture. The increase in horticultural production requires
availability of adequate resource base, quality planting materials and necessary infrastructure.
Inadequate availability of plant material and other resources is one of the major impediments
for healthy growth in area, production and productivity of horticultural crops. Massive area
expansion under improved varieties, replanting, planting in marginal and arid areas, etc.
require a huge demand for quality planting material and a sound supporting infrastructure. In
this chapter, an analysis has been made on availability of different planting materials, cost
incurred by different categories of sample farmers on different types of inputs and the
production and revenue generated by them from the cultivation of selected horticultural crops
for which they had received the assistance from NHM.
4.1 Economics of production, cost and resource use in selected crops
This section presents economics of production, cost and resource use for the selected crops in
our selected states.
4.1.1 Selected crops in Karnataka
Table 4.1.1a presents net returns per acre realized by the selected farmers growing grapes
crop. Per household area planted under grapes by marginal farmers was miniscule as only one
farmer cultivated grapes crop. Among small farmers, area planted was less than half acre and
only 9 farmers were growing grapes. Per household area under grapes in the case of medium
and large farmers was 1.6 and 2.6 acres. Around 17 medium and 30 large farmers cultivated
grapes crop. The output produced per acre averaged at 55 quintals and it varied between 50 to
58 quintals per acre among different farm size classes. The average revenue earned per acre
was 92 thousand that varied from 98 thousand in the case of large farmers to 65
thousand in the case of marginal farmers.
The cost incurred consists of two components, fixed cost and variable cost. The fixed cost of
perennial crops consists of initial planting and gestation period cost. The variable cost is the
running cost every year at the time of plant bearing fruit1. The major components of variable
costs in grapes were topping and pruning, manure and fertilizer and harvesting and collection.
Out of total cost, variable cost consisted 84 percent and fixed cost (amortized into the life
period of the plant) was 16 percent. On average, total variable cost was measured at 55
thousand out of which 24 thousand was for the labour cost (44 percent) and rest of 31
thousand (56 percent) was for the material cost. Fixed cost including planting material, field
preparation and supporting material as well as the labour cost amortized over the life period
of the plant (15 years in the case of grapes) was measured at 11 thousand. Thus, overall cost
of cultivation of grapes was measured at 66 thousand per acre.
1 For more details on cost of cultivation among perennial crops see Annexure 4.1 at the end of the chapter.
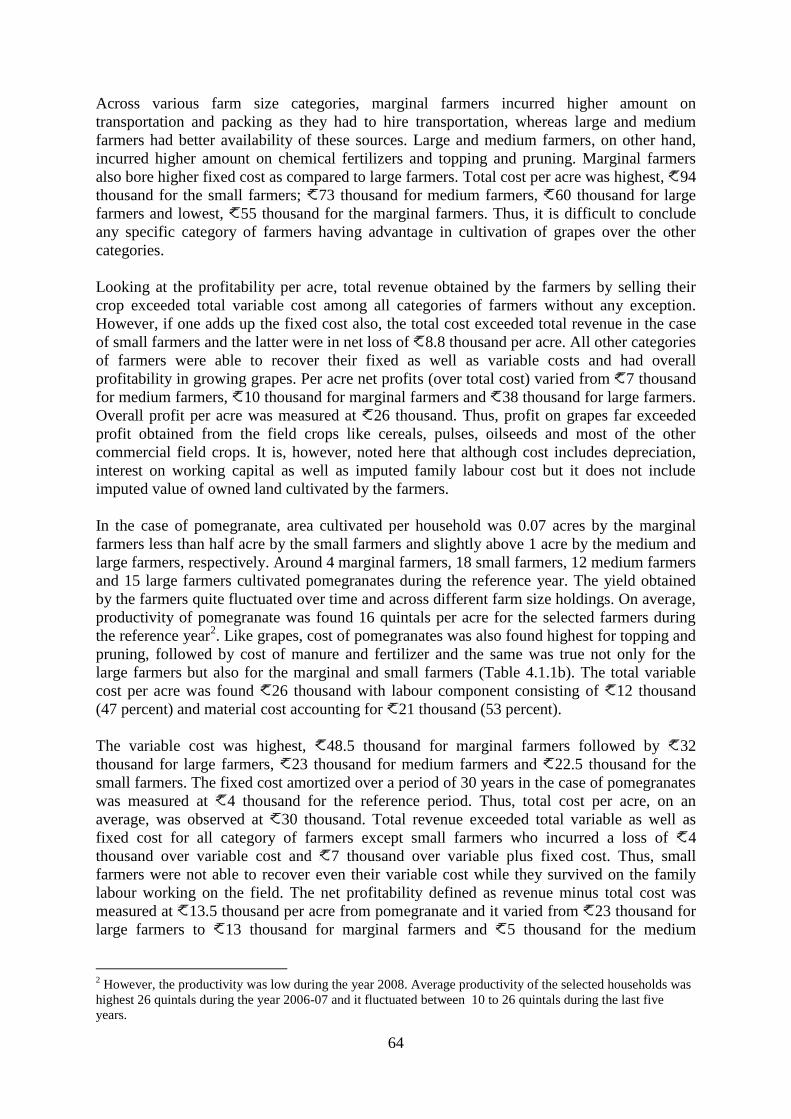
64
Across various farm size categories, marginal farmers incurred higher amount on
transportation and packing as they had to hire transportation, whereas large and medium
farmers had better availability of these sources. Large and medium farmers, on other hand,
incurred higher amount on chemical fertilizers and topping and pruning. Marginal farmers
also bore higher fixed cost as compared to large farmers. Total cost per acre was highest, 94
thousand for the small farmers; 73 thousand for medium farmers, 60 thousand for large
farmers and lowest, 55 thousand for the marginal farmers. Thus, it is difficult to conclude
any specific category of farmers having advantage in cultivation of grapes over the other
categories.
Looking at the profitability per acre, total revenue obtained by the farmers by selling their
crop exceeded total variable cost among all categories of farmers without any exception.
However, if one adds up the fixed cost also, the total cost exceeded total revenue in the case
of small farmers and the latter were in net loss of 8.8 thousand per acre. All other categories
of farmers were able to recover their fixed as well as variable costs and had overall
profitability in growing grapes. Per acre net profits (over total cost) varied from 7 thousand
for medium farmers, 10 thousand for marginal farmers and 38 thousand for large farmers.
Overall profit per acre was measured at 26 thousand. Thus, profit on grapes far exceeded
profit obtained from the field crops like cereals, pulses, oilseeds and most of the other
commercial field crops. It is, however, noted here that although cost includes depreciation,
interest on working capital as well as imputed family labour cost but it does not include
imputed value of owned land cultivated by the farmers.
In the case of pomegranate, area cultivated per household was 0.07 acres by the marginal
farmers less than half acre by the small farmers and slightly above 1 acre by the medium and
large farmers, respectively. Around 4 marginal farmers, 18 small farmers, 12 medium farmers
and 15 large farmers cultivated pomegranates during the reference year. The yield obtained
by the farmers quite fluctuated over time and across different farm size holdings. On average,
productivity of pomegranate was found 16 quintals per acre for the selected farmers during
the reference year2. Like grapes, cost of pomegranates was also found highest for topping and
pruning, followed by cost of manure and fertilizer and the same was true not only for the
large farmers but also for the marginal and small farmers (Table 4.1.1b). The total variable
cost per acre was found 26 thousand with labour component consisting of 12 thousand
(47 percent) and material cost accounting for 21 thousand (53 percent).
The variable cost was highest, 48.5 thousand for marginal farmers followed by 32
thousand for large farmers, 23 thousand for medium farmers and 22.5 thousand for the
small farmers. The fixed cost amortized over a period of 30 years in the case of pomegranates
was measured at 4 thousand for the reference period. Thus, total cost per acre, on an
average, was observed at 30 thousand. Total revenue exceeded total variable as well as
fixed cost for all category of farmers except small farmers who incurred a loss of 4
thousand over variable cost and 7 thousand over variable plus fixed cost. Thus, small
farmers were not able to recover even their variable cost while they survived on the family
labour working on the field. The net profitability defined as revenue minus total cost was
measured at 13.5 thousand per acre from pomegranate and it varied from 23 thousand for
large farmers to 13 thousand for marginal farmers and 5 thousand for the medium
2 However, the productivity was low during the year 2008. Average productivity of the selected households was
highest 26 quintals during the year 2006-07 and it fluctuated between 10 to 26 quintals during the last five
years.

65
farmers. Like grapes, even in the case of pomegranate, overall profitability was better than
the traditional field crops of cereals, pulses and oilseeds.
Among our selected horticultural crops, marginal and small farmers preferred growing
flowers and aromatic crops as these crops hardly had any gestation period and these crops
were more labour intensive. In comparison, grapes and pomegranate had much higher
gestation period, had longer bearing life time and required much larger capital investment.
The area planted per household of flower crops was measured at 0.42 acres by the marginal
farmers, much higher compared to their area under grapes and pomegranate. Among other
categories, area cultivated per household was 0.33 acres by the small farmers, only 0.19 acres
by the medium farmers and 0.38 acres by the large farmers while the last two categories had
much lower area under flowers compared to their area under grapes and pomegranates.
The realized yield of floriculture crops averaged at 18 quintals per acre and fluctuated widely
among various farm size holdings. The realized yield was higher for medium and large
farmers but much lower for the marginal and small farmers. A part of the reason in difference
of productivity might be different varieties of flowers grown by these farmers. There were
many different varieties and breed of flowers grown by the selected farmers. The major ones
were rose, chrysanthemum, buttans, white lemon, sevanthi, kanakambaram (crossandra),
jasmine (kakada), lily and marry-gold.
Among the cost components, manure and fertilizer, topping and pruning, harvesting,
collection and transportation constituted the major cost among all size classes (Table 4.1.1c).
Out of total variable cost, material and labour cost constituted almost same proportion. The
total variable cost per acre was measured at 23 thousand out of which 11.7 thousand
consisted of labour cost and rest 11.3 thousand was material cost. Thus, whereas labour cost
was less than material cost in the case of grapes and pomegranates, the former exceeded the
latter in the case of flowers, indicating that flowers were more labour intensive and thereby
small and marginal farmers had comparative advantage over the large size holdings as was
indicated above. Total variable cost was highest 41 thousand for the medium farmers, 26
thousand for the marginal and small farmers and 22 thousand for the large farmers. The
fixed cost amortized over the life span of 10 years, on average for all flower crops was
measured at 6.5 thousand. The total revenue obtained by the farmers exceeded total variable
cost among all categories of farmers in the case of flowers. However, when the fixed cost was
added to the variable cost, small and medium farmers were found having ended up in net
losses as their total cost exceeded total revenue. Realized profit over variable cost averaged at
22 thousand per acre that was highest at 31 thousand for large farmers and lowest at 2.7
thousand for the small farmers. The net profitability covering the fixed and variable cost
together averaged at 15.7 thousand whereby only large and marginal farmers had positive
profit amounting to 27 thousand and 17.7 thousand, respectively while small and medium
farmers incurred losses amounting to 5 thousand and 3 thousand, respectively. However,
losses incurred by small and medium farmers during the reference period was over the fixed
cost that is long run cost but they earned net profit over the variable cost which is the running
cost and comparing their returns with the field crops, farmers growing flower crops were still
better off compared to returns from the foodgrains and oilseeds.

66
Table 4.1.1a: Net returns per acre from horticultural crops – Grapes
(Rs per acre) Farm Size Marginal Small Medium Large Total
Preparatory tillage 0
(0.0)
0
(0.0)
36
(0.0)
126
(0.2)
91
(0.1)
Manure & fertilizer 0
(0.0)
8980
(9.5)
6638
(9.1)
7242
(12.1)
7143
(10.8)
Transplanting & gap filling 0 0 181 49 77
(0.0) (0.0) (0.2) (0.1) (0.1)
Irrigation, canal, electricity and diesel 0 9136 3291 670 2052
(0.0) (9.7) (4.5) (1.1) (3.1)
Weeding and Inter cultural operations 0 0 0 559 363
(0.0) (0.0) (0.0) (0.9) (0.5)
Topping / pruning 1667 14148 21938 9043 12612
(3.0) (15.0) (30.1) (15.1) (19.1)
Plant protection, pesticides etc. 0 0 181 0 45
(0.0) (0.0) (0.2) (0.0) (0.1)
Repair, maintenance and depreciation@ 315 527 998 282 444
(0.6) (0.6) (1.4) (0.5) (0.7)
Harvesting and collection 0 10442 0 6634 5215
(0.0) (11.1) (0.0) (11.1) (7.9)
Grading, storage, transport, packing 15000 2287 4747 1372 2481
(27.3) (2.4) (6.5) (2.3) (3.8)
Market/mandi fee etc. 0 731 408 56 202
(0.0) (0.8) (0.6) (0.1) (0.3)
Interest on Working Capital# 136 279 648 212 283
(0.2) (0.3) (0.9) (0.4) (0.4)
Variable labour cost 20833 35126 22205 23562 24190
(38.0) (37.3) (30.5) (39.3) (36.6)
Total Variable Cost 37951 81655 61271 49806 55197
(69.2) (86.7) (84.0) (83.0) (83.6)
Fixed cost including planting material, field preparation
cost, supporting material and irrigation setup including
material and labour (Amortized over the life time)##
16910 12521 11650 10170 10836
(30.8) (13.3) (16.0) (17.0) (16.4)
Total Cost 54861 94176 72922 59976 66033
(100.0) (100.0) (100.0) (100.0) (100.0)
Yield rate (quintals per acre) 50.00 50.93 51.04 57.65 55.34 Total Revenue 65000 85305 79902 98317 92261
Total Revenue - Total Cost 10139 -8871 6980 38341 26227
Total Revenue - Variable Cost 27049 3650 18631 48512 37064 Source: Primary Survey
Note: All variable cost items consist of two components:
@ Repair, maintenance and depreciation is 10 per cent discounted value of agricultural assets holdings including
tractor & implements and tubewell motor etc. that is divided in proportionate to each crop sown during the year.
# Interest on working capital is interest paid on the loans/borrowing divided in proportionate to each crop sown
during the year.

67
Table 4.1.1b: Net returns per acre from horticultural crops – Pomegranates
(Rs per acre) Farm Size Marginal Small Medium Large Total
Preparatory tillage 0 0 0 30 9
(0.0) (0.0) (0.0) (0.1) (0.0)
Manure & fertilizer 6725 2800 3268 3912 3440
(12.4) (11.0) (12.6) (9.9) (11.5)
Transplanting & gap filling 0 86 0 0 24
(0.0) (0.3) (0.0) (0.0) (0.1)
Irrigation, canal, electricity and diesel 900 1477 249 589 714
(1.7) (5.8) (1.0) (1.5) (2.4)
Weeding and Inter cultural operations 0 429 0 423 252
(0.0) (1.7) (0.0) (1.1) (0.8)
Topping / pruning 15667 3521 4899 8746 6034
(29.0) (13.8) (18.9) (22.1) (20.2)
Plant protection, pesticides etc. 0 55 150 151 120
(0.0) (0.2) (0.6) (0.4) (0.4)
Repair, maintenance and depreciation@ 630 1600 1452 130 424
(1.2) (6.3) (5.6) (0.3) (1.4)
Harvesting and collection 0 1374 0 2341 1116
(0.0) (5.4) (0.0) (5.9) (3.7)
Grading, storage, transport, packing 763 598 1453 1495 1210
(1.4) (2.3) (5.6) (3.8) (4.0)
Market/mandi fee etc. 17 240 199 45 157
(0.0) (0.9) (0.8) (0.1) (0.5)
Interest on Working Capital# 272 848 943 98 270
(0.5) (3.3) (3.6) (0.2) (0.9)
Variable labour cost 23593 9534 10645 14937 12055
(43.6) (37.3) (41.1) (37.7) (40.3)
Total Variable Cost 48567 22563 23257 32899 25824
(89.8) (88.3) (89.7) (83.0) (86.2)
Fixed cost including planting material, field preparation
cost, supporting material and irrigation setup including
material and labour (Amortized over the life time)##
5540 3000 2672 6723 4117
(10.2) (11.7) (10.3) (17.0) (13.8)
Total Cost 54107 25563 25929 39622 29942
(100.0) (100.0) (100.0) (100.0) (100.0)
Yield rate (quintals per acre) 29.50 11.63 21.69 12.81 15.79 Total Revenue 62000 18251 28247 55988 39356
Total Revenue - Total Cost 7893 -7311 2318 16366 9414
Total Revenue - Variable Cost 13433 -4311 4990 23089 13532 Source: Primary Survey
Note: All variable cost items consist of two components:
@ Repair, maintenance and depreciation is 10 per cent discounted value of agricultural assets holdings including
tractor & implements and tubewell motor etc. that is divided in proportionate to each crop sown during the year.
# Interest on working capital is interest paid on the loans/borrowing divided in proportionate to each crop sown
during the year.
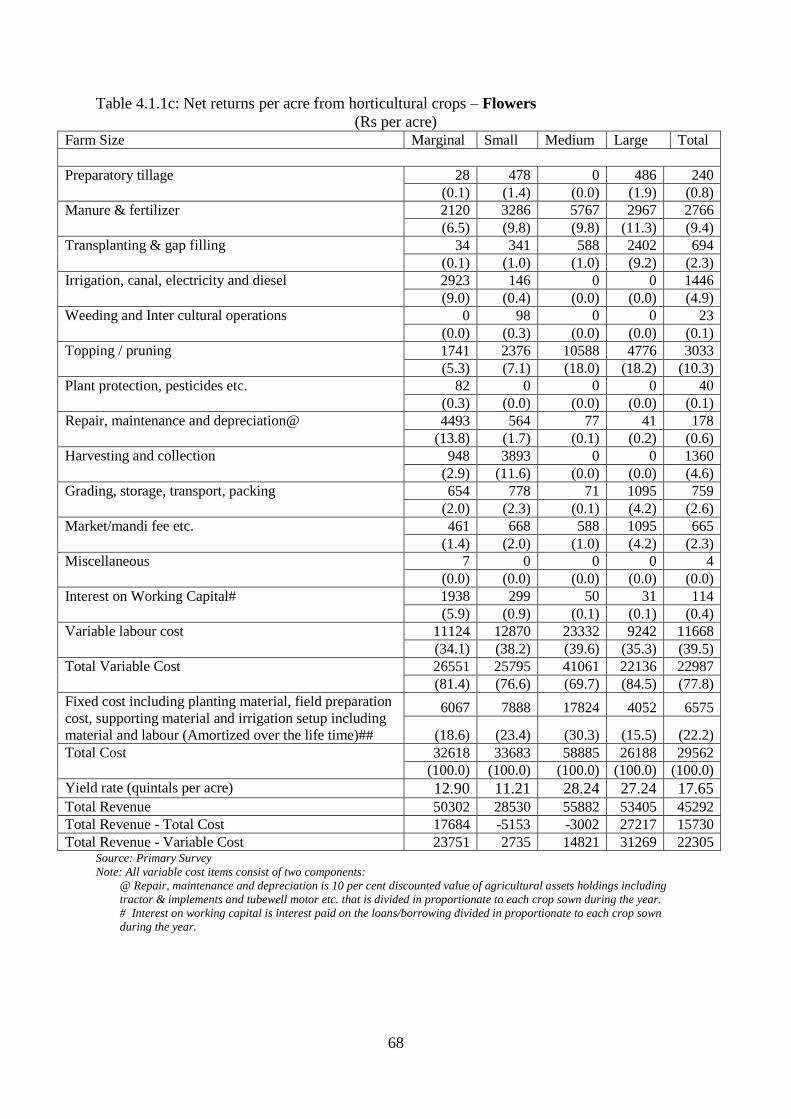
68
Table 4.1.1c: Net returns per acre from horticultural crops – Flowers
(Rs per acre) Farm Size Marginal Small Medium Large Total
Preparatory tillage 28 478 0 486 240
(0.1) (1.4) (0.0) (1.9) (0.8)
Manure & fertilizer 2120 3286 5767 2967 2766
(6.5) (9.8) (9.8) (11.3) (9.4)
Transplanting & gap filling 34 341 588 2402 694
(0.1) (1.0) (1.0) (9.2) (2.3)
Irrigation, canal, electricity and diesel 2923 146 0 0 1446
(9.0) (0.4) (0.0) (0.0) (4.9)
Weeding and Inter cultural operations 0 98 0 0 23
(0.0) (0.3) (0.0) (0.0) (0.1)
Topping / pruning 1741 2376 10588 4776 3033
(5.3) (7.1) (18.0) (18.2) (10.3)
Plant protection, pesticides etc. 82 0 0 0 40
(0.3) (0.0) (0.0) (0.0) (0.1)
Repair, maintenance and depreciation@ 4493 564 77 41 178
(13.8) (1.7) (0.1) (0.2) (0.6)
Harvesting and collection 948 3893 0 0 1360
(2.9) (11.6) (0.0) (0.0) (4.6)
Grading, storage, transport, packing 654 778 71 1095 759
(2.0) (2.3) (0.1) (4.2) (2.6)
Market/mandi fee etc. 461 668 588 1095 665
(1.4) (2.0) (1.0) (4.2) (2.3)
Miscellaneous 7 0 0 0 4
(0.0) (0.0) (0.0) (0.0) (0.0)
Interest on Working Capital# 1938 299 50 31 114
(5.9) (0.9) (0.1) (0.1) (0.4)
Variable labour cost 11124 12870 23332 9242 11668
(34.1) (38.2) (39.6) (35.3) (39.5)
Total Variable Cost 26551 25795 41061 22136 22987
(81.4) (76.6) (69.7) (84.5) (77.8)
Fixed cost including planting material, field preparation
cost, supporting material and irrigation setup including
material and labour (Amortized over the life time)##
6067 7888 17824 4052 6575
(18.6) (23.4) (30.3) (15.5) (22.2)
Total Cost 32618 33683 58885 26188 29562
(100.0) (100.0) (100.0) (100.0) (100.0)
Yield rate (quintals per acre) 12.90 11.21 28.24 27.24 17.65 Total Revenue 50302 28530 55882 53405 45292
Total Revenue - Total Cost 17684 -5153 -3002 27217 15730
Total Revenue - Variable Cost 23751 2735 14821 31269 22305 Source: Primary Survey
Note: All variable cost items consist of two components:
@ Repair, maintenance and depreciation is 10 per cent discounted value of agricultural assets holdings including
tractor & implements and tubewell motor etc. that is divided in proportionate to each crop sown during the year.
# Interest on working capital is interest paid on the loans/borrowing divided in proportionate to each crop sown
during the year.

69
Table 4.1.1d: Net returns per acre from horticultural crops – Aromatic and medicinal plants
(Rs per acre) Farm Size Marginal Small Medium Large Total
Preparatory tillage 941 262 0 500 393
(3.4) (0.9) (0.0) (2.4) (1.7)
Manure & fertilizer 3260 3945 251 4050 3046
(11.6) (14.0) (1.5) (19.4) (12.8)
Transplanting & gap filling 1059 272 0 650 446
(3.8) (1.0) (0.0) (3.1) (1.9)
Irrigation, canal, electricity and diesel 672 1188 0 0 652
(2.4) (4.2) (0.0) (0.0) (2.7)
Weeding and Inter cultural operations 0 0 0 0 0
(0.0) (0.0) (0.0) (0.0) (0.0)
Topping / pruning 1748 2183 861 1200 1668
(6.2) (7.7) (5.2) (5.8) (7.0)
Plant protection, pesticides etc. 0 0 0 0 0
(0.0) (0.0) (0.0) (0.0) (0.0)
Repair, maintenance and depreciation@ 1563 787 252 20 136
(5.6) (2.8) (1.5) (0.1) (0.6)
Harvesting and collection 1 699 4665 6600 2239
(0.0) (2.5) (28.4) (31.7) (9.4)
Grading, storage, transport, packing 34 224 280 0 160
(0.1) (0.8) (1.7) (0.0) (0.7)
Market/mandi fee etc. 0 14 0 0 6
(0.0) (0.0) (0.0) (0.0) (0.0)
Interest on Working Capital# 674 417 164 15 86
(2.4) (1.5) (1.0) (0.1) (0.4)
Variable labour cost 11983 10391 3039 4470 8345
(42.7) (36.7) (18.5) (21.4) (35.1)
Total Variable Cost 21934 20382 9512 17504 17178
(78.1) (72.1) (58.0) (84.0) (72.2)
Fixed cost including planting material, field preparation
cost, supporting material and irrigation setup including
material and labour (Amortized over the life time)##
6139 7899 6895 3346 6628
(21.9) (27.9) (42.0) (16.0) (27.8)
Total Cost 28073 28281 16406 20850 23806
(100.0) (100.0) (100.0) (100.0) (100.0)
Yield rate (quintals per acre) 44.24 54.98 49.14 69.00 53.47 Total Revenue 29546 31979 24191 22670 28429
Total Revenue - Total Cost 1473 3698 7784 1820 4622
Total Revenue - Variable Cost 7612 11597 14679 5166 11251 Source: Primary Survey
Note: All variable cost items consist of two components:
@ Repair, maintenance and depreciation is 10 per cent discounted value of agricultural assets holdings including
tractor & implements and tubewell motor etc. that is divided in proportionate to each crop sown during the year.
# Interest on working capital is interest paid on the loans/borrowing divided in proportionate to each crop sown
during the year.
The main medicinal/aromatic crops grown by the selected farmers included sweet flag and
Davana. Sweet flag is also known by its scientific name of acorus calamus. It is a perennial
plant that grows in wetlands with aromatic leaves and roots used in medicines and as an
alternative to ginger, cinnamon and nutmeg. It's been used as a stimulant, as a digestive aid
and for fevers and coughs. The root is also chewed for toothache, and the powered roots

70
inhaled to treat congestion. Davana known by its scientific name, artemisia pallens, is a
native aromatic herb, grown mainly in Karnataka and some parts of Tamil Nadu and
Maharashtra. Total area under this crop in Karnataka is 2000 hectares. Its foliage and floral
tops produce a viscous essential oil, emitting a delicate, persistently fruity fragrance which is
used in floral decorations, bouquets and cosmetics. On dilution, the oil imparts a sweet,
refreshingly pleasant odor. It is also used in flavoring of cakes, pastries, beverages and
tobacco products. Most of the oil produced in the country is exported to USA.
Like flowers, area cultivated of aromatic/medicinal crops was higher in the case of marginal
and small farmers compared to medium and large farmers. Cultivated area per household was
0.25 and 0.45 acres, respectively by marginal and small farmers compared to 0.40 and 0.18
acres by the medium and large farmers, respectively. The numbers of farmers who cultivated
aromatic/medicinal crops were 12 marginal farmers, 18 small farmers, 8 medium farmers and
3 large farmers during the reference year. The yield rate of aromatic crops was around 53
quintals per acre that fluctuated from 69 quintals for large farmers, 55 quintals for small
farmers, 49 quintals for medium farmers and 44 quintals for the marginal farmers. Manure
and fertilizer, topping and pruning and harvesting and collection were the major running cost
items.
In the total variable cost, material cost consisted of 65 percent while share of labour cost was
only 35 percent (Table 4.1.1d). Variable cost averaged at 17 thousand and it was highest
22 thousand for marginal farmers and lowest 9.5 thousand for medium farmers. The fixed
cost amortized over the life span of medicinal/aromatic crops of five years averaged at 6.6
thousand. The percentage of variable and fixed cost in the sum total cost was 72 and 28,
respectively. Comparing cost and revenue per acre from aromatic/medicinal crops, revenue
exceeded both variable as well as total (variable + fixed) cost across all holdings without any
exception. The net profit over variable cost averaged at 11 thousand and net profit over
total cost averaged at 4.6 thousand. The overall profit (over total cost) was highest 7.8
thousand for medium farmers followed by 3.7 thousand for small farmers, 1.8 thousand
for large farmers and 1.5 thousand for the marginal farmers. Thus, all size classes growing
aromatic and medicinal crops although observed net profits over and above the total cost, but
the amount of profitability was less than the other three horticultural crops grown namely,
grapes, pomegranate and flowers. The returns from medicinal and aromatic crops were not
even better than the traditional field crops of foodgrains and oilseeds, although profitability
was higher for the medicinal/aromatic crops if one does not account for the fixed cost which
includes planting material and other long term investment.
4.1.2 Selected crops in Andhra Pradesh
Table 4.1.2a presents expenditure on various components invested in raising mango orchards.
It can be seen that per acre total cost was 28,409. Total cost consists of fixed cost and
variable cost. The fixed cost consisting in two components as material and labour cost is
reported in the table while the variable cost as well as revenue could not be acquired from the
farmers as mango orchards were in the non-bearing stage after being planted under NHM
scheme as reported by the sample households. Per acre material cost consisted 66.7 percent of
total cost. Among the material cost per acre, manure and fertilizers reported highest share of
25.6 percent followed by irrigation, canal, electricity and diesel (19.8 percent) and land
preparation cost including planting material cost of 15.4 percent and pesticides cost (5.9
percent). In the case of labour cost per acre, the highest share of 17.6 percent was reported for
weeding and inter cultural operations.

71
Table 4.1.2a: Cost of cultivation per acre from horticultural crops – Mango
Source: Primary Survey
* indicates amortization costs of mango crop
Note: All Variable cost items consist of two components
(i) Bearing period cost – that is already during the reference period (i.e.2008-09)
(ii) Cost during the plantation year/gestation period – that has been brought into the 2008-09 prices from the year of
plantation/gestation, using the wholesale price index of all commodities for Andhra Pradesh State
(@ Repair, maintenance and depreciation is 10 per cent discounted value of agricultural assets holding including tractor
& implements and tube well motor etc., that is divided in proportionate to each crop sown during the year.
# Interest on working capital is interest paid on the loans/borrowing divided in proportionate to each crop sown during
the year.
## For amortization refer to the literature Subrahmanyam and Mohandoss (1982), Misra (1992), Sarma (1996), Chand
(1994) – the details given in Chapter Plan References.
Farm size Marginal Small Medium Large Total
Average Area Planted (acres) 1.56 3.36 3.7 7.38 3.6
Preparatory tillage 4200 4200 4300 4800 4375
per cent (15.16) (14.59) (15.87) (15.97) (15.40)
Manure & fertilizer 7600 7400 6900 7150 7263
per cent (27.44) (25.70) (25.46) (23.80) (25.56)
Transplanting & gap filling 400 520 545 620 521
per cent (1.44) (1.81) (2.01) (2.06) (1.83)
Irrigation, canal, electricity and diesel 5200 6000 5000 6400 5650
per cent (18.77) (20.84) (18.45) (21.30) (19.89)
Weeding and Inter cultural operations 5400 5250 4600 4800 5013
per cent (19.50) (18.24) (16.97) (15.97) (17.64)
Topping/pruning (100)0 1200 1400 1470 1268
per cent (3.61) (4.17) (5.17) (4.89) (4.46)
Plant protection, pesticides etc. 1500 1720 1620 1850 1673
per cent (5.42) (5.97) (5.98) (6.16) (5.89)
Repair, Maintenance and depreciation @ 890 900 980 1120 973
per cent (3.21) (3.13) (3.62) (3.73) (3.42)
Miscellaneous 766 780 846 962 839
per cent (2.77) (2.71) (3.12) (3.20) (2.95)
Interest on working capita l# 742.8 820 910 876 837
per cent (2.68) (2.85) (3.36) (2.92) (2.95)
Fixed cost including planting material,
field preparation cost, supporting material
and irrigation setup (Amortized over the
life time) ##
Material
Cost
639* 668* 616* 698* 655*
18500 19320 17820 20200 18960
per cent (66.79) (67.11) (65.75) (67.23) (66.74)
Labour
Cost
318* 327* 321* 340* 327*
9198.8 9470 9281 9848 9449
per cent (33.21) (32.89) (34.25) (32.77) (33.26)
Total cost
957* 995* 937* 1038* 982*
27699 28790 27101 30048 28409
per cent ((100)) ((100)) ((100)) ((100)) ((100))
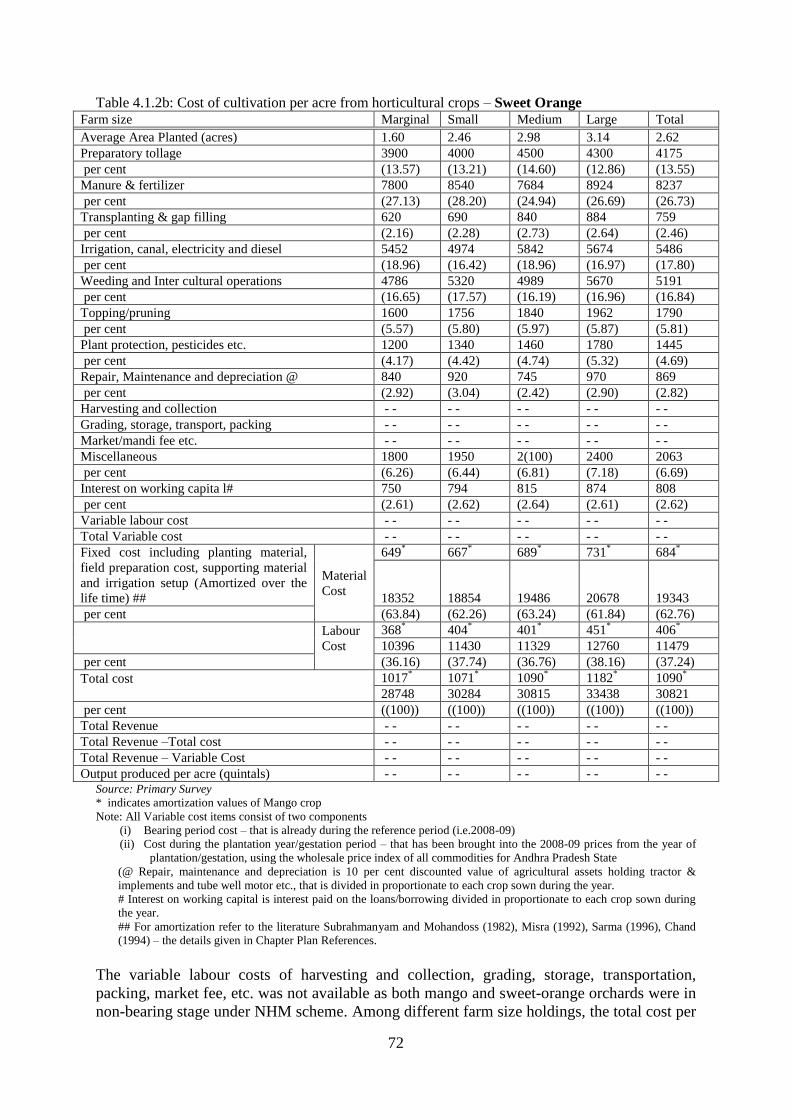
72
Table 4.1.2b: Cost of cultivation per acre from horticultural crops – Sweet Orange Farm size Marginal Small Medium Large Total
Average Area Planted (acres) 1.60 2.46 2.98 3.14 2.62
Preparatory tollage 3900 4000 4500 4300 4175
per cent (13.57) (13.21) (14.60) (12.86) (13.55)
Manure & fertilizer 7800 8540 7684 8924 8237
per cent (27.13) (28.20) (24.94) (26.69) (26.73)
Transplanting & gap filling 620 690 840 884 759
per cent (2.16) (2.28) (2.73) (2.64) (2.46)
Irrigation, canal, electricity and diesel 5452 4974 5842 5674 5486
per cent (18.96) (16.42) (18.96) (16.97) (17.80)
Weeding and Inter cultural operations 4786 5320 4989 5670 5191
per cent (16.65) (17.57) (16.19) (16.96) (16.84)
Topping/pruning 1600 1756 1840 1962 1790
per cent (5.57) (5.80) (5.97) (5.87) (5.81)
Plant protection, pesticides etc. 1200 1340 1460 1780 1445
per cent (4.17) (4.42) (4.74) (5.32) (4.69)
Repair, Maintenance and depreciation @ 840 920 745 970 869
per cent (2.92) (3.04) (2.42) (2.90) (2.82)
Harvesting and collection - - - - - - - - - -
Grading, storage, transport, packing - - - - - - - - - -
Market/mandi fee etc. - - - - - - - - - -
Miscellaneous 1800 1950 2(100) 2400 2063
per cent (6.26) (6.44) (6.81) (7.18) (6.69)
Interest on working capita l# 750 794 815 874 808
per cent (2.61) (2.62) (2.64) (2.61) (2.62)
Variable labour cost - - - - - - - - - -
Total Variable cost - - - - - - - - - -
Fixed cost including planting material,
field preparation cost, supporting material
and irrigation setup (Amortized over the
life time) ##
Material
Cost
649*
667* 689
* 731
* 684
*
18352 18854 19486 20678 19343
per cent (63.84) (62.26) (63.24) (61.84) (62.76)
Labour
Cost
368* 404
* 401
* 451
* 406
*
10396 11430 11329 12760 11479
per cent (36.16) (37.74) (36.76) (38.16) (37.24)
Total cost
1017* 1071
* 1090
* 1182
* 1090
*
28748 30284 30815 33438 30821
per cent ((100)) ((100)) ((100)) ((100)) ((100))
Total Revenue - - - - - - - - - -
Total Revenue –Total cost - - - - - - - - - -
Total Revenue – Variable Cost - - - - - - - - - -
Output produced per acre (quintals) - - - - - - - - - - Source: Primary Survey
* indicates amortization values of Mango crop
Note: All Variable cost items consist of two components
(i) Bearing period cost – that is already during the reference period (i.e.2008-09)
(ii) Cost during the plantation year/gestation period – that has been brought into the 2008-09 prices from the year of
plantation/gestation, using the wholesale price index of all commodities for Andhra Pradesh State
(@ Repair, maintenance and depreciation is 10 per cent discounted value of agricultural assets holding tractor &
implements and tube well motor etc., that is divided in proportionate to each crop sown during the year.
# Interest on working capital is interest paid on the loans/borrowing divided in proportionate to each crop sown during
the year.
## For amortization refer to the literature Subrahmanyam and Mohandoss (1982), Misra (1992), Sarma (1996), Chand
(1994) – the details given in Chapter Plan References.
The variable labour costs of harvesting and collection, grading, storage, transportation,
packing, market fee, etc. was not available as both mango and sweet-orange orchards were in
non-bearing stage under NHM scheme. Among different farm size holdings, the total cost per

73
acre reported to be highest 30,048 by large farmers followed by small farmers 28790,
marginal farmers 27,699 and medium farmers 27,101.
Commercial production of sweet oranges starts from 4th
year onwards. All sample farmers
expressed that the sweet orange orchards were in non-bearing stage at the time of field
survey. Therefore the estimates of production and net returns were not available for the sweet
orange as well. The average active life span of the sweet orange plant is reported to be 30
years, after which the garden is replaced by the new plantation, whereas the economic life of
the garden is reported to be 25 years.
Table 4.1.2b shows cost of cultivation per acre of sweet orange. The average cost was
measured at 30,821 of which a major proportion was spent on material cost (62.8 percent)
and labour cost (37.2 percent). On average per acre material cost constituted 19,343. Across
the material costs highest ratio constituted manure and fertilizers (26.7 percent) followed by
irrigation (17.8 percent), land preparation (13.6 percent) and pesticides (4.7 percent). The
highest proportion of labour cost was incurred on weeding and inter-cultural operations (16.8
percent) followed by topping transplantation etc. The estimates of variable costs and revenue
were not available due to crop being in bearing stage. Across the farmer size groups, total
cost per acre incurred on sweet orange orchards at non-bearing stage (3years) was 28,748
by the marginal farmers and the highest 33,438 by large farm size holdings.
4.1.3 Selected crops in Bihar
The economics of production (with costs and returns) have been briefly described here for the
selected horticultural crops, viz., mango and litchi in Bihar. It can be observed from Table
4.1.3a that total revenue accrued per acre of land from mango cultivation stood at 49289 per
acre per annum on an average. The cost of production of mango was estimated 26041 per
acre, on an average. Out of total cost, the variable cost constituted 87 per cent while fixed
cost amortized over the life time of mango crop constituted 23 per cent of the total cost. The
material cost constituted 86 percent of the total variable cost while labor component
constituted only 24 percent of the total variable cost. The net returns from mango cultivation
turned out 26643 per acre, excluding the fixed cost. The net returns (after subtracting fixed
cost) were measured at 23247 per acre. Across various farm size holdings, the returns per
acre were found highest among the small farmers ( 25937) while they were lowest among
the large farmers ( 22622).
In contrast to mango cultivation, the cost of production of litchi cultivation was much lower
because of lower fixed and variable cost although revenue earning from litchi crop was also
comparatively lower. Total revenue per acre from litchi cultivation accrued at 24925, on an
average (Table 4.1.3b). Total costs of production on the other hand, stood at 14925 per
acre. Total cost consisted of variable and fixed costs with respective shares of 88 and 12
percent. The share of material and labour cost in the total variable cost was 84 and 26 percent
respectively. The net return per acre from litchi cultivation thus turned out to 9999, that was
much lower compared to mango crop. The variation in returns from litchi across farm size
holdings was not very high while marginal farmers once again observed the highest returns
from litchi while medium farmers had lowest returns with other two categories lying in
between these two in terms of net returns from litchi cultivation.

74
Table 4.1.3a: Net returns per acre from horticultural crops – Mango
( per acre)
Farm Size Marginal Small Medium Large Total
Average Area Planted (acres) 0.18 0.36 0.63 2.03 0.75
Preparatory tillage/Digging of Pits (32 nos) 160.00
(0.74)
190.00
(0.78)
192.00
(0.70)
192.00
(0.65)
183.68
(0.71)
Manure & fertilizer 59.00
(2.72)
598.00
(2.46)
592.00
(2.17)
605.00
(2.03)
596.64
(2.29)
Transplanting & gap filling 3142.00
(14.46)
3502.00
(14.40)
3418.00
(12.53)
3270.00
(11.00)
3333.12
(12.80)
Irrigation, canal, electricity and diesel 840.00
(3.89)
1172.00
(4.82)
1058.00
(3.87)
1215.00
(4.08)
1071.36
(4.11)
Weeding and Inter cultural operations 240.00
(1.10)
325.00
(1.34)
275.00
(1.01)
288.00
(0.97)
282.24
(1.08)
Topping / pruning 320.00
(1.47)
375.00
(1.54)
350.00
(1.28)
342.00
(1.15)
346.88
(1.33)
Plant protection, pesticides etc. 392.00
(1.80)
415.00
(1.72)
510.00
(1.87)
480.00
(1.62)
449.28
(1.73)
Repair, maintenance and depreciation@10 per cent 846.20
(3.89)
1909.70
(7.85)
4087.00
(14.98)
6726.20
(22.62)
3702.70
(14.22)
Harvesting and collection 550.00
(2.53)
625.00
(2.57)
617.00
(2.27)
712.00
(2.39)
626.25
(2.40)
Grading, storage, transport, packing 1950.00
(8.98)
2125.00
(8.74)
2470.00
(9.07)
2080.00
(7.00)
2156.00
(8.28)
Market/mandi fee etc. 312.00
(1.44)
390.00
(1.60)
427.00
(1.57)
411.00
(1.38)
392.00
(1.50)
Miscellaneous (Watchman) 2250.00
(10.35)
1900.00
(7.81)
2400.00
(8.80)
2200.00
(7.40)
2187.50
(8.40) Interest on Working Capital# 809.20
(3.72)
964.00
(3.96)
1260.00
(4.62)
1491.00
(5.02)
1163.00
(4.47)
Variable labour cost 6110.00
(28.13)
6210.00
(25.54)
6175.00
(22.64)
5965.00
(20.06)
6155.00
(23.64)
Total Variable Cost 18511.40
(85.22)
20700.70
(85.13)
23831.00
(87.38)
25977.20
(87.37)
22645.65
(86.96)
Fixed cost including planting material, field
preparation cost, supporting material and
irrigation setup (Amortized over the life time)##
Material cost 2493.00
(11.48)
2705.00
(11.12)
2585.00
(9.48)
2792.60
(9.39)
2547.00
(9.78)
Labour cost 718.60
(3.30)
912.00
(3.75)
857.00
(3.14)
963.20
(3.24)
849.00
(3.26)
Total Cost 21723.00
(100.0)
24317.70
(100.0)
27273.00
(100.0)
29733.00
(100.0)
26041.65
(100.0)
Total Revenue 47550.00 50255.00 51776.00 52355.00 49289.00
Total Revenue - Total Cost 25827.00 25937.30 24503.00 22622.00 23247.35
Total Revenue - Variable Cost 29038.60 29554.30 27945.00 26377.80 26643.35
Output produced per acre (quintals) 42.00 47.00 45.00 49.50 45.74
Source: Primary Survey
Note: All variable cost items consist of two components:
(i) Bearing period cost - that is already during the reference period (i.e., 2008-09)
(ii) Cost during the plantation year/gestation period - that has been brought into the 2008-09 prices from the year of
plantation/gestation, using the wholesale price index of all commodities for Bihar state.
@ Repair, maintenance and depreciation is 10 per cent discounted value of agricultural assets holdings including tractor
& implements and tube well motor etc. that is divided in proportionate to each crop sown during the year.
# Interest on working capital is interest paid on the loans/borrowing divided in proportionate to each crop sown during
the year.
## Fixed cost has been amortized with 10 per cent discount rate.
(iii) In parenthesis percentage figures are shown.

75
Table 4.1.3b: Net returns per acre from horticultural crops – Litchi
( per acre)
Farm Size Marginal Small Medium Large Total
Average Area Planted (acres) 0.012 0.149 0.274 0.711 0.0280
Preparatory tillage/Digging of Pits 160.00
(1.44)
190.00
(1.42)
192.00
(1.25)
192.00
(1.05)
183.68
(1.23)
Manure & fertilizer 587.00
(5.29)
512.00
(3.82)
581.00
(3.78)
592.00
(3.24)
568.82
(3.81)
Transplanting & gap filling 1375.00
(12.39)
1917.00
(14.29)
1192.00
(7.75)
1264.00
(6.91)
1395.57
(9.35)
Irrigation, canal, electricity and diesel 712.00
(6.42)
810.00
(6.04)
888.00
(5.77)
818.00
(4.47)
828.32
(5.55)
Weeding and Inter cultural operations 179.00
(1.61)
212.00
(1.58)
208.00
(1.35)
168.00
(0.92)
196.75
(1.32)
Topping / pruning 270.00
(2.43)
281.00
(2.09)
323.00
(2.10)
292.00
(1.60)
299.17
(2.00)
Plant protection, pesticides etc. 469.00
(4.23)
385.00
(2.87)
312.00
(2.03)
510.00
(2.79)
390.39
(2.62)
Repair, maintenance and depreciation@ 10 per cent 846.20
(7.62)
909.70
(6.78)
1087.00
(7.07)
2726.20
(14.91)
1456.12
(9.76)
Harvesting and collection 854.00
(7.70)
765.00
(5.70)
811.00
(5.27)
739.00
(4.04)
785.23
(5.26)
Grading, storage, transport, packing 970.00
(8.74)
885.00
(6.60)
915.00
(5.95)
1065.00
(5.83)
944.75
(6.33)
Market/mandi fee etc. 416.00
(3.75)
530.00
(3.95)
809.00
(5.26)
665.00
(3.64)
654.39
(4.38)
Miscellaneous (Watchmen) 250.00
(2.25)
800.00
(5.96)
665.00
(4.32)
590.00
(3.23)
610.95
(4.09)
Interest on Working Capital# 609.00
(5.49)
820.00
(6.11)
998.00
(6.49)
1262.00
(6.90)
956.00
(6.41)
Variable labour cost 2819.00
(25.40)
3012.00
(22.45)
3734.00
(24.28)
4220.00
(23.08)
3897.09
(26.11)
Total Variable Cost 10516.20
(94.76)
12029.70
(89.66)
12715.00
(82.67)
15103.20
(82.62)
13167.23
(88.22)
Fixed cost including planting material, field
preparation cost, supporting material and
irrigation setup (Amortized over the life time)##
Material cost 309.00
(2.78)
946.00
(7.05)
1694.00
(11.01)
2291.00
(12.53)
1272.10
(8.52)
Labour cost 272.00
(2.46)
441.00
(3.29)
972.00
(6.32)
889.00
(4.86)
485.86
(3.26)
Total Cost 11097.20
(100.0)
13416.70
(100.0)
15381.00
(100.0)
18283.20
(100.0)
14925.19
(100.0)
Total Revenue 22937.00 23765.00 24552.00 29112.00 24925.11
Total Revenue - Total Cost 11839.80 10348.30 9171.00 10828.80 9999.92
Total Revenue - Variable Cost 12420.80 11735.30 11837.00 14009.80 11757.88
Output produced per acre (quintals) 40.00 38.75 36.25 39.80 38.08
Source: Primary Survey
Note: All variable cost items consist of two components:
(i) Bearing period cost - that is already during the reference period (i.e., 2008-09)
(ii) Cost during the plantation year/gestation period - that has been brought into the 2008-09 prices from the year of
plantation/gestation, using the wholesale price index of all commodities for Bihar state.
@ Repair, maintenance and depreciation is 10 per cent discounted value of agricultural assets holdings including tractor
& implements and tube well motor etc. that is divided in proportionate to each crop sown during the year.
# Interest on working capital is interest paid on the loans/borrowing divided in proportionate to each crop sown during
the year.
## Fixed cost has been amortized with 10 per cent discount rate.
(iii) In parenthesis percentage figures are shown.
A comparison of net returns from horticultural crops and non-horticultural crops reveals that
the net returns from horticultural crops especially mango remained considerably higher than
the traditional non-horticultural crops measured in terms of net monetary returns per acre of
land. In fact, net returns from mango stood more than double the net returns from traditional
crops like paddy, wheat, maize, lentil and gram. The returns from litchi were also
comparatively higher than all other field crops except the case of lentil whose returns at the

76
aggregate were slightly higher compared to returns from litchi crops. However, returns for
the marginal farmers were higher for litchi as well compared to all other crops. Marginal and
small farmers were found having edge in growing horticultural crops over the other
categories not only in terms of returns but also in terms of lower cost because of availability
of family lanour. Therefore, it can safely be concluded that horticulture appears as a more
profitable cultivation practice in general as compared to traditional kharif & rabi crops and it
is more so for the marginal and small farmers who otherwise find it difficult to survive on
agriculture in comparison to large farmers who have economies of scale in growing field
crops. Therefore, it is advisable for the small and marginal farmers to diversify into
horticultural crops in Bihar where generally the holdings size is small as marginal and small
farmers constitute more than 80 percent holdings in the state.
4.1.4 Selected crops in Rajasthan
Economics of production, cost and resources use in cultivation of horticultural crops, namely,
aonla, papaya, coriander and mango among the selected households in Rajasthan has been
presented in Tables 4.1.4a to Table 4.1.4d. As already indicated in the methodology section,
the data on economics of cultivation of these four crops were collected from different districts
of Rajasthan, i.e., Jaipur for aonla, Alwar and Banswara for papaya, Chittorgarh for coriander
and Banswara for mango for the reference year 2008-09. It was assumed that the expected
economic life of aonla, mango and papaya was 35 years, 40 years and 3 years, respectively.
The crop wise analysis of economics of cultivation of the selected horticultural crops has
been made in the following sections.
Table 4.1.4a presents the cost of cultivation, production and net returns from cultivation of
aonla crop for different categories of sample farmers. Among the sample farmers cultivating
aonla crop, 4 were marginal farmers, 13 were small farmers, 18 were medium farmers and 15
were large farmers. It may be seen that the average area covered under aonla crop was 3.3
acres per household. Among different categories of farmers, large farmers cultivated aonla in
highest area of 4.08 acres per household (HH), followed by medium farmers (3.25 acres) and
small farmers (3.11 acres). Marginal farmers cultivated aonla in 1.16 acres of land per
household. The total cost of cultivating aonla crop in the case of all farmers category was
20899 per acre, out of which, the total variable cost was 18584 per acre (88.9 per cent) and
total fixed cost was 2316 per acre. Out of this total fixed cost, 2093 (10.0 per cent) was
spent towards the material component and only 223 (1.1 per cent) was spent towards the
labour component. The total annual per-acre cost of cultivation of aonla was found to be
highest of 22694 for marginal farmers and lowest of 19697 for large farmers. The per-
acre cost of cultivation of aonla was comparatively less for large farmers because of use of
better agricultural tools and implements. Since the marginal farmers resorted to more labour
works, the average variable cost was more for them. The per-acre variable cost of cultivation
of aonla for marginal farmers was 21812 (96.1 per cent). It may be noted that the variable
labour cost alone was 5917 (26.1 per cent) per acre in the case of marginal farmers. The
marginal farmers spent 1070 per acre towards preparatory tillage whereas the large farmers
spent only 899 (4.6 per cent) per acre for the same.

77
Table 4.1.4a: Cost of cultivation, production and net returns per acre from Aonla crop
( per acre) Farm size Marginal Small Medium Large All farmers
Average area planted (acres) 1.16 3.11 3.25 4.08 3.30
Preparatory tillage 1069 850 852 752 820
(4.27) (3.41) (4.15) (3.48) (3.70)
Manure & fertilizer 6685 4082 4541 4452 4456
(26.73) (16.37) (22.13) (20.58) (20.12)
Transplanting & gap filling 80 205 167 177 178
(0.32) (0.82) (0.82) (0.82) (0.80)
Irrigation, canal, electricity and diesel 1436 1202 979 784 974
(5.74) (4.82) (4.77) (3.62) (4.40)
Weeding and Inter cultural operations 778 684 252 321 398
(3.11) (2.74) (1.23) (1.48) (1.80)
Topping / pruning 0 0 0 0 0
(0.00) (0.00) (0.00) (0.00) (0.00)
Plant protection, pesticides etc. 2537 2526 1695 1577 1879
(10.14) (10.13) (8.26) (7.29) (8.48)
Repair, maintenance and depreciation@ 1983 2267 2751 2113 2198
(7.93) (9.09) (13.40) (9.77) (9.92)
Harvesting and collection 0 0 0 10 4
(0.00) (0.00) (0.00) (0.05) (0.02)
Grading, storage, transport, packing 734 359 408 396 401
(2.94) (1.44) (1.99) (1.83) (1.81)
Market/mandi fee etc. 0 0 0 0 0
(0.00) (0.00) (0.00) (0.00) (0.00)
Miscellaneous 0 0 0 0 0
(0.00) (0.00) (0.00) (0.00) (0.00)
Interest on working capital# 129 112 230 558 388
(0.52) (0.45) (1.12) (2.58) (1.75)
Variable labour cost 5910 4928 3529 3692 4000
(23.63) (19.76) (17.20) (17.07) (18.06)
Total variable cost 21341 17213 15403 14831 15695
(85.33) (69.02) (75.06) (68.57) (70.87)
Fixed cost including planting material,
field preparation cost, supporting
material and irrigation setup
Material cost 2868 5144 3386 4445 4196
(11.47) (20.63) (16.50) (20.55) (18.95)
Labour cost 800 2583 1733 2354 2146
(3.20) (10.36) (8.44) (10.88) (9.69)
Total cost 25009 24941 20521 21630 22145
(100.00) (100.00) (100.00) (100.00) (100.00)
Total revenue 15011 14226 13703 11516 13057
Total revenue - total cost -9998 -10715 -6819 -10114 -9089
Total revenue - total variable cost -6330 -2988 -1701 -3315 -2746
Output produced per acre (quintals) 38.88 34.08 34.50 29.12 32.52
Source: Primary Survey
Notes: All variable cost items consist of two components:
(i) Bearing period cost - that is already during the reference period (i.e., 2008-09)
(ii) Cost during the plantation year/gestation period - that has been brought into the 2008-09 prices from the year of
plantation/gestation.
@ Repair, maintenance and depreciation is 10 per cent discounted value of agricultural assets holdings including
tractor & implements and tubewell motor etc. that is divided in proportionate to each crop sown during the year.
# Interest on working capital is interest paid on the loans/borrowing divided in proportionate to each crop sown during
the year.
Besides the variable labour cost, the shares of manure and fertilizer, irrigation and plant
protection in the total variable cost were prominent ones. These three components accounted
for about 45.1 per cent to 48.8 per cent of total variable cost for different farmer categories.
Repair, maintenance and depreciation cost was found to be another important component of
variable cost in cultivation of aonla crop. Medium farmers spent highest amount of 2749
(12.7 per cent) towards repair, maintenance and depreciation cost whereas the marginal
farmers, small farmers and large farmers spent 1982, 2268 and 1917 towards repair and
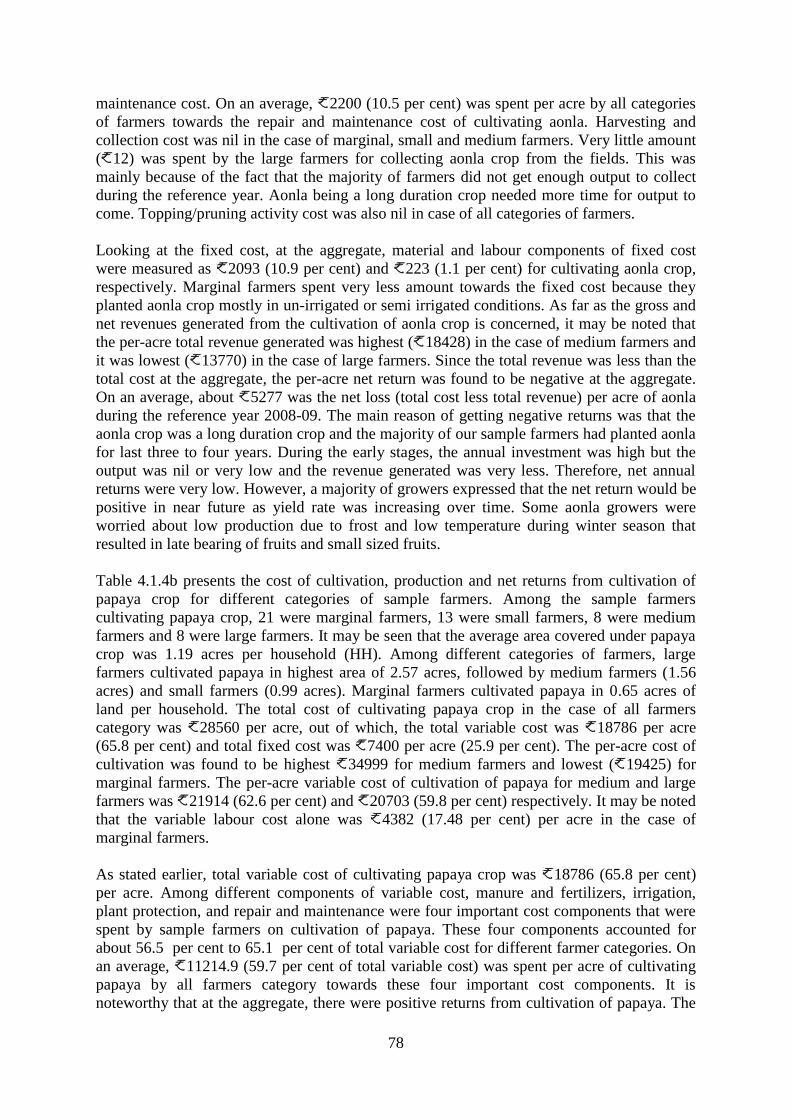
78
maintenance cost. On an average, 2200 (10.5 per cent) was spent per acre by all categories
of farmers towards the repair and maintenance cost of cultivating aonla. Harvesting and
collection cost was nil in the case of marginal, small and medium farmers. Very little amount
( 12) was spent by the large farmers for collecting aonla crop from the fields. This was
mainly because of the fact that the majority of farmers did not get enough output to collect
during the reference year. Aonla being a long duration crop needed more time for output to
come. Topping/pruning activity cost was also nil in case of all categories of farmers.
Looking at the fixed cost, at the aggregate, material and labour components of fixed cost
were measured as 2093 (10.9 per cent) and 223 (1.1 per cent) for cultivating aonla crop,
respectively. Marginal farmers spent very less amount towards the fixed cost because they
planted aonla crop mostly in un-irrigated or semi irrigated conditions. As far as the gross and
net revenues generated from the cultivation of aonla crop is concerned, it may be noted that
the per-acre total revenue generated was highest ( 18428) in the case of medium farmers and
it was lowest ( 13770) in the case of large farmers. Since the total revenue was less than the
total cost at the aggregate, the per-acre net return was found to be negative at the aggregate.
On an average, about 5277 was the net loss (total cost less total revenue) per acre of aonla
during the reference year 2008-09. The main reason of getting negative returns was that the
aonla crop was a long duration crop and the majority of our sample farmers had planted aonla
for last three to four years. During the early stages, the annual investment was high but the
output was nil or very low and the revenue generated was very less. Therefore, net annual
returns were very low. However, a majority of growers expressed that the net return would be
positive in near future as yield rate was increasing over time. Some aonla growers were
worried about low production due to frost and low temperature during winter season that
resulted in late bearing of fruits and small sized fruits.
Table 4.1.4b presents the cost of cultivation, production and net returns from cultivation of
papaya crop for different categories of sample farmers. Among the sample farmers
cultivating papaya crop, 21 were marginal farmers, 13 were small farmers, 8 were medium
farmers and 8 were large farmers. It may be seen that the average area covered under papaya
crop was 1.19 acres per household (HH). Among different categories of farmers, large
farmers cultivated papaya in highest area of 2.57 acres, followed by medium farmers (1.56
acres) and small farmers (0.99 acres). Marginal farmers cultivated papaya in 0.65 acres of
land per household. The total cost of cultivating papaya crop in the case of all farmers
category was 28560 per acre, out of which, the total variable cost was 18786 per acre
(65.8 per cent) and total fixed cost was 7400 per acre (25.9 per cent). The per-acre cost of
cultivation was found to be highest 34999 for medium farmers and lowest ( 19425) for
marginal farmers. The per-acre variable cost of cultivation of papaya for medium and large
farmers was 21914 (62.6 per cent) and 20703 (59.8 per cent) respectively. It may be noted
that the variable labour cost alone was 4382 (17.48 per cent) per acre in the case of
marginal farmers.
As stated earlier, total variable cost of cultivating papaya crop was 18786 (65.8 per cent)
per acre. Among different components of variable cost, manure and fertilizers, irrigation,
plant protection, and repair and maintenance were four important cost components that were
spent by sample farmers on cultivation of papaya. These four components accounted for
about 56.5 per cent to 65.1 per cent of total variable cost for different farmer categories. On
an average, 11214.9 (59.7 per cent of total variable cost) was spent per acre of cultivating
papaya by all farmers category towards these four important cost components. It is
noteworthy that at the aggregate, there were positive returns from cultivation of papaya. The

79
per-acre total revenue generated was highest ( 60321) in the case of medium farmers and
was the lowest ( 33514) in the case of marginal farmers. Since the total revenue was more
than the total cost at the aggregate, the net return was found to be positive in case of all
farmers (aggregate of all farmers).
Table 4.1.4b: Cost of cultivation, production and net returns per acre from Papaya crop
( per acre) Farm size Marginal Small Medium Large Total
Average area planted (acres) 0.65 0.99 1.56 2.57 1.19
Preparatory tillage 713 819 1055 928 882
(2.89) (3.03) (2.91) (2.85) (2.91)
Manure & fertilizer 3366 3038 3605 6564 4449
(13.65) (11.25) (9.93) (20.17) (14.67)
Transplanting & gap filling 571 536 547 586 563
(2.31) (1.98) (1.51) (1.80) (1.86)
Irrigation, canal, electricity and diesel 2070 2636 4040 2279 2677
(8.39) (9.76) (11.13) (7.01) (8.83)
Weeding and Inter cultural operations 0 0 0 0 0
(0.00) (0.00) (0.00) (0.00) (0.00)
Topping / pruning 0 0 0 0 0
(0.00) (0.00) (0.00) (0.00) (0.00)
Plant protection, pesticides etc. 1339 1172 1606 1820 1525
(5.43) (4.34) (4.42) (5.59) (5.03)
Repair, maintenance and depreciation@ 1982 2264 2757 1914 2182
(8.03) (8.38) (7.60) (5.88) (7.19)
Harvesting and collection 0 0 0 0 0
(0.00) (0.00) (0.00) (0.00) (0.00)
Grading, storage, transport, packing 490 1149 1129 931 918
(1.99) (4.26) (3.11) (2.86) (3.03)
Market/mandi fee etc. 0 0 0 0 0
(0.00) (0.00) (0.00) (0.00) (0.00)
Miscellaneous 0 0 0 0 0
(0.00) (0.00) (0.00) (0.00) (0.00)
Interest on working capital# 168 207 81 135 147
(0.68) (0.77) (0.22) (0.41) (0.48)
Variable labour cost 4383 4054 5553 3441 4232
(17.77) (15.02) (15.30) (10.58) (13.96)
Total variable cost 15083 15875 20372 18597 17575
(61.15) (58.80) (56.13) (57.15) (57.96)
Fixed cost including planting material, field
preparation cost, supporting material and irrigation
setup
3629 6039 10030 7555 6846
(14.71) (22.37) (27.63) (23.22) (22.58)
5955 5085 5894 6386 5903
(24.14) (18.84) (16.24) (19.63) (19.47)
Total cost 24667 26999 36296 32539 30324
(100.00) (100.00) (100.00) (100.00) (100.00)
Total revenue 33519 44620 56454 45638 44905
Total revenue - total cost 8851 17620 20159 13099 14581
Total revenue - total variable cost 18435 28745 36082 27040 27329
Output produced per acre (quintals) 48 82 78 52 63
Source: Primary Survey
Notes: All variable cost items consist of two components:
(i) Bearing period cost - that is already during the reference period (i.e., 2008-09)
(ii) Cost during the plantation year/gestation period - that has been brought into the 2008-09 prices from the year of
plantation/gestation.
@ Repair, maintenance and depreciation is 10 per cent discounted value of agricultural assets holdings including tractor &
implements and tubewell motor etc. that is divided in proportionate to each crop sown during the year.
# Interest on working capital is interest paid on the loans/borrowing divided in proportionate to each crop sown during the
year.

80
The per-acre net annual revenue generated was highest ( 25322) in the case of medium
farmers and was the lowest ( 14088) in the case of marginal farmers. The per-acre net
revenue generated was 18232 for all farmers category. The main reason of getting positive
net returns from cultivation of papaya was that the life span of papaya crop was near about
three years and the maximum production was realized by the sample farmers during the
reference year 2008-09 which was not possible in the case of long-duration crops like anola
and mango.
Table 4.1.4c: Cost of cultivation, production and net returns per acre from coriander crop
( per acre Farm size Marginal Small Medium Large Total
Average area planted (acres) 0 2.77 3.32 5.89 4.48
Preparatory tillage 0 524 564 536 543
(0.00) (4.78) (4.84) (4.52) (4.63)
Manure and fertilizer 0 1863 1811 2271 2106
(0.00) (16.99) (15.54) (19.15) (17.96)
Transplanting and gap filling 0 0 0 0 0
(0.00) (0.00) (0.00) (0.00) (0.00)
Irrigation, canal, electricity and diesel 0 625 603 573 586
(0.00) (5.70) (5.17) (4.83) (5.00)
Weeding and Inter cultural operations 0 10 32 29 28
(0.00) (0.09) (0.27) (0.24) (0.24)
Topping / pruning 0 0 0 0 0
(0.00) (0.00) (0.00) (0.00) (0.00)
Plant protection, pesticides etc. 0 428 467 433 442
(0.00) (3.91) (4.01) (3.65) (3.77)
Repair, maintenance and depreciation@ 0 2268 2749 1917 2200.16
(0.00) (20.68) (23.58) (16.17) (18.61)
Harvesting and collection 0 0 3 1 2
(0.00) (0.00) (0.03) (0.01) (0.02)
Grading, storage, transport, packing 0 403 420 320 355
(0.00) (3.67) (3.60) (2.70) (3.03)
Market/mandi fee etc. 0 0 0 0 0
(0.00) (0.00) (0.00) (0.00) (0.00)
Miscellaneous 0 0 0 0 0
(0.00) (0.00) (0.00) (0.00) (0.00)
Interest on working capital# 0 356 429 841 698.47
(0.00) (3.25) (3.68) (7.09) (5.82)
Variable labour cost 0 2031 2016 1897 1942
(0.00) (18.52) (17.29) (16.00) (16.57)
Total variable cost 0 8508 9095 8817 8869
(0.00) (77.59) (78.02) (74.35) (75.64)
Fixed cost including planting material,
field preparation cost, supporting
material and irrigation setup
Material
cost
0 1636 2109 2561 2353
(0.00) (14.92) (18.09) (21.59) (20.07)
Labour
cost
0 821 454 481 503
(0.00) (7.48) (3.89) (4.06) (4.29)
Total cost 0 10964 11658 11860 11725
(0.00) (100.00) (100.00) (100.00) (100.00)
Total revenue 0 17280 19021 16365 17193
Total revenue - total cost 0 6316 7363 4505 5468
Total revenue - total variable cost 0 8772 9926 7547 8324
Output produced per acre (quintals) 0.00 5.63 6.13 5.68 5.80
Source: Primary Survey
(i) Bearing period cost - that is already during the reference period (i.e., 2008-09)
(ii) Cost during the plantation year/gestation period - that has been brought into the 2008-09 prices from the year of
plantation/gestation.
@ Repair, maintenance and depreciation is 10 per cent discounted value of agricultural assets holdings including tractor &
implements and tubewell motor etc. that is divided in proportionate to each crop sown during the year.
# Interest on working capital is interest paid on the loans/borrowing divided in proportionate to each crop sown during the
year.
## Fixed cost has been amortised with 10 per cent discount rate.

81
Coriander is a short duration crop that takes about three to four months to get maturity. The
analysis on the cost of cultivation, output and returns from cultivation of coriander has been
based on the reference year 2008-09 data. The selected farmers of coriander crop belonged to
small, medium and large farmers. Not a single farmer was from marginal farmer category for
this study. Among the sample farmers cultivating coriander crop, 7 were small farmers, 19
were medium farmers and 24 were large farmers. It may be seen from Table 4.1.4c that the
average area covered under coriander crop was 4.48 acres per household. Among different
categories of farmers, large farmers cultivated coriander in highest area of 5.89 acres per
household, followed by medium farmers (3.32 acres) and small farmers (2.77 acres).
The variable cost of coriander ranged from 74.35 per cent to 78.02 per cent of total cost for
different farmer categories. The average variable cost was 8902 per acre whereas the
medium farmers spent highest amount of 9095 (78.02 per cent) towards the variable cost
and the small farmers spent lowest 8508 (77.59 per cent) per acre. Labour cost, manure and
fertilizers and repair and maintenance were the three major components that were spent by
the sample farmers on cultivation of coriander. These three components accounted for about
69.0 per cent to 72.4 per cent of total variable cost among different category of farmers. The
total fixed cost ( 2856) accounted for about 24.3 per cent of total cost of cultivating
coriander in an acre of land. The total fixed cost per acre was highest ( 3042) in the case of
large farmers and lowest ( 2457) in the case of small farmers. Total cost of cultivating
coriander crop in the case of all farmers category was 11759 per acre. The total per-acre
cost of cultivation was found highest ( 11860) for large farmers and lowest ( 10964) for
small farmers.
Similar to the case of papaya, farmers of coriander also earned positive returns from
cultivation of coriander. The per-acre revenue was highest ( 19021) in the case of medium
farmers and lowest ( 16365) for the large farmers. The net return was found to be positive in
all cases. The per-acre net return (total revenue - total cost) was also highest ( 7363) in the
case of medium farmers and lowest ( 4505) in the case of large farmers. The per-acre net
return from coriander was, on an average, 5434 at the aggregate.
Table 4.1.4d presents the cost of cultivation, production and net returns from cultivation of
mango crop for different categories of sample farmers who belonged to Banswara district of
Rajasthan. Among the sample farmers cultivating mango crop, 19 were marginal farmers, 12
were small farmers, 12 were medium farmers and 7 were large farmers. It may be seen that
the average area covered under mango crop was 2.36 acres per household. Among different
categories of farmers, large farmers cultivated mango in highest area of 6.90 acres per
household (HH), followed by medium farmers (2.74 acres) and small farmers (1.74 acres).
Marginal farmers cultivated mango in 0.82 acres of land per household.
Total cost of cultivating mango crop at the aggregate was 15612 per acre, out of which, the
total variable cost was 13218 per acre (84.7 per cent) and total fixed cost was 2395 per
acre. Out of this total fixed cost, 2127 (13.6 per cent) was spent towards the material
component and 268 (1.7 per cent) was spent towards the labour component. The per-acre
total cost of cultivation of mango was found to be highest ( 19895) for large farmers and
lowest ( 9233) for marginal farmers. The per-acre variable cost of cultivation of mango was
highest ( 16694) also in the case of large farmers category and was lowest ( 8820) for
marginal farmers category. It may be noted that the variable labour cost alone was 2077
(22.5 per cent) per acre in the case of marginal farmers and was 3401 (17.1 per cent) per

82
acre in the case of large farmers. The marginal farmers spent only 109 per acre towards
preparatory tillage whereas the large farmers spent 654 per acre towards preparatory tillage.
Table 4.1.4d: Net returns per acre from mango crop ( per acre)
Farm size Marginal Small Medium Large Total
Average area planted (acres) 0.82 1.74 2.74 6.90 2.36
Preparatory tillage 109 622 305 654 478
(0.89) (4.08) (1.72) (2.76) (2.52)
Manure & fertilizer 1696 2505 2964 3379 2884
(13.86) (16.43) (16.69) (14.28) (15.18)
Transplanting & gap filling 291 116 120 274 205
(2.37) (0.76) (0.68) (1.16) (1.08)
Irrigation, canal, electricity and diesel 1006 1238 1136 2058 1515
(8.22) (8.12) (6.40) (8.70) (7.97)
Weeding and Inter cultural operations 0 809 635 1899 1100
(0.00) (5.31) (3.57) (8.02) (5.79)
Topping / pruning 0 0 0 0 0
(0.00) (0.00) (0.00) (0.00) (0.00)
Plant protection, pesticides etc. 974 1825 597 2153 1503
(7.96) (11.97) (3.36) (9.10) (7.91)
Repair, maintenance and depreciation@ 1982 2269 2749 2117 2198
(16.19) (14.88) (15.48) (8.95) (11.57)
Harvesting and collection 0 0 0 0 0
(0.00) (0.00) (0.00) (0.00) (0.00)
Grading, storage, transport, packing 105 160 444 118 215
(0.86) (1.05) (2.50) (0.50) (1.13)
Market/mandi fee etc. 0 0 0 0 0
(0.00) (0.00) (0.00) (0.00) (0.00)
Miscellaneous 0 0 0 0 0
(0.00) (0.00) (0.00) (0.00) (0.00)
Interest on working capital# 136 14 78 31 73
(1.11) (0.09) (0.44) (0.13) (0.38)
Variable labour cost 2077 1664 1618 3401 2418
(16.97) (10.91) (9.11) (14.37) (12.73)
Total variable cost 8375 11222 10647 16084 12590
(68.42) (73.61) (59.94) (67.96) (66.25)
Fixed cost including planting material,
field preparation cost, supporting material
and irrigation setup
Material
cost
1308 1557 4955 4570 3709
(10.68) (10.21) (27.90) (19.31) (19.52)
Labour
cost
2557 2463 2160 3014 2617
(20.89) (16.16) (12.16) (12.74) (13.77)
Total cost 12241 15242 17762 23668 18917
(100.00) (100.00) (100.00) (100.00) (100.00)
Total revenue 0 0 40219 9296 15056
Total revenue - total cost -12241 -15242 22457 -14372 -3860
Total revenue - total variable cost -8375 -11222 29571 -6787 2466
Output produced per acre (quintals) 0 0 49 4 16
Source: Primary Survey
Notes: All variable cost items consist of two components:
(i) Bearing period cost - that is already during the reference period (i.e., 2008-09)
(ii) Cost during the plantation year/gestation period - that has been brought into the 2008-09 prices from the
year of plantation/gestation.
@ Repair, maintenance and depreciation is 10 per cent discounted value of agricultural assets holdings including
tractor & implements and tubewell motor etc. that is divided in proportionate to each crop sown during the year.
# Interest on working capital is interest paid on the loans/borrowing divided in proportionate to each crop sown
during the year.
Besides the variable labour cost, the shares of manure and fertilizer, irrigation, plant
protection and maintenance expenses in the total variable cost were major ones. These four
components accounted for about 56.95 to 67.77 per cent of total variable cost for different
farmer categories cultivating mango. On the aggregate, a sample farmer spent 2884 for

83
manure and fertilizer, 2200 towards the repair, maintenance and depreciation expenses,
1515 for irrigation and 1503 for plant protection. Harvesting and collection cost was nil in
all category farmers. This was mainly because of the fact that the majority of farmers did not
get enough output to collect during the reference year. Mango being a long duration crop
needed more time for output to come. Topping/pruning activity cost was also nil.
On an average, fixed cost was estimated at 6326 towards fixed cost out of which, 2127
(13.6 per cent) and 268 (1.7 per cent) were spent as part of the material cost and labour cost
respectively. As far as the gross and net returns generated from the cultivation of mango crop
is concerned, it may be noted that the per-acre total revenue generated was highest ( 40219)
in the case of medium farmers and was nil in the case of marginal and small farmers. Since
the total revenue was less than the total cost at the aggregate as well as all size of holdings
except that of medium farmers, the per-acre net return was found to be negative in all cases
except the medium farmers category. The per acre annual net return accrued to the medium
farmers was 26053 per acre as only few medium farmers cultivated mango since last fifteen
years and mostly their mango orchards were rejuvenated in 2008-09. The main reason of
getting negative returns by all other farmer categories was that mango crop being a long
duration crop was mostly in the initial years of bearing fruit. However, a majority expressed
that the net returns would be positive by next six to seven years.
To conclude, only because the long duration crops like mango and aonla did not reach fruit
bearing stage, the output and net returns were negligible. On the other hand, the shorter
duration crops like coriander and papaya yielded very good results in terms of output and net
returns. Thus, the cultivation of horticultural crops appears promising compared to other field
crops. It may be noted that the net returns from kharif crops at the aggregate among the
selected households in Rajasthan was 9661 per acre. Among different farmer categories,
medium farmers accrued highest net return of 10337 from kharif crops and marginal
farmers accumulated lowest net return of 8042 per acre. The net return from rabi crops was
11860 per acre and the medium farmers, large farmers, small farmers and marginal farmers
generated 12672, 12027, 10564 and 8752 per acre respectively from rabi crops. The
average net returns from foodgrains (bajra, maize, rice, jowar, wheat, and barley), pulses (tur,
urad and gram) and oilseeds (groundnut, soyabean, sesamum and mustard) were 10178,
13833 and 8195 per acre respectively.
The average net return from horticulture crops was 6627 per acre. The small farmers had
lowest net returns ( 244) while marginal farmers got little higher amount 3460 per acre
from cultivation of various horticultural crops. The medium farmers generated highest per-
acre net return of 11099 from various horticultural crops. The average net return from
horticultural crops was lower than that from non-horticultural crops due to low production
and early stages of long duration crops. However, among horticultural crops, short duration
crops like chilly, onion, garlic, tomato and vegetables fetched good returns and many farmers
were very much interested in growing these crops. It was encouraging to note that, after the
implementation of National Horticulture Mission scheme in Rajasthan, many farmers showed
keen interest in cultivation of horticultural crops with the expectation of generating good
returns.
4.1.5 Selected crops in Tamil Nadu
In Tamil Nadu, our analysis is restricted to three crops namely banana, mango and flowers.
Details regarding economics of production, cost and resource use in these three horticultural

84
crops is presented in Tables 4.1.5a to 4.1.5c. As regards banana, the average area planted by
all sample farmers worked out to 2.09 acres per household. Across various farm size
holdings, the average area planted by marginal farmers was just 1.1 acres, while banana
cultivated area by small, medium and large farmers was 2.6 acres, 4.3 acres and 7.5 acres,
respectively. Cost of cultivation was divided into variable cost and fixed cost while both the
costs included both material and labour components.
As could be seen from Table 4.1.5a, total variable cost for the cultivation of banana was to
the tune of 53897 per acre which constituted 96 per cent of the total cost of production.
Among the four categories of farmers, total variable cost ranged from 53250 to 55273 per
acre. The highest variable cost per acre was incurred by large farmers while the lowest was
by the marginal farmers. Among different components of variable cost, maximum (23.4 per
cent) consisted of interest on working capital. Within size groups of farmers, large farmers
spent the lowest 21.6 per cent of the total cost on interest on working capital whereas it was
24.07 per cent for the marginal farmers. The next component of major expenditure was on
manure and fertilizers followed by weeding and intercultural operation and plant protection.
Manure and fertilizer consisted of 17.4 per cent of the total cost followed by 13.06 per cent
and 13.01 per cent for weeding-intercultural practices and pesticides, respectively. The
market/mandi fee was found to be the lowest variable cost (0.25 per cent) per acre at the
aggregate.
The share of fixed cost was less than 4 per cent of total cost per acre at the aggregate. Fixed
cost had two components namely material cost and labour cost, the former worked out to 2.85
per cent of the total cost while the later was just 0.89 per cent of the total cost per acre for the
case of all sample framers. Total cost of cultivation per acre worked out to 55994 at the
aggregate. As is evident from the statistics in the table, total cost incurred by marginal, small,
medium and large farmers for the cultivation of an acre of banana was to the tune of 55250,
56750, 57408 and 58273, respectively. Against the above amount of cost incurred, the
average revenue earned by a farmer from the cultivation of an acre of banana was to the tune
of 155833. The large farmers made the highest revenue of 175000 per acre whereas the
lowest 150000 per acre was earned by the marginal farmers. The total revenue obtained by
small and medium farmers stood at 160000 and 170000 per acre, respectively. The
average net returns obtained by a sample farmer from an acre of banana were found to be
99839. The lowest net returns of 94750 per acre were secured by marginal farmers whereas
the highest 116727 net returns per acre of banana were obtained by the large farmers. The
small and medium farmers made a net return of 103250 and 112592 per acre,
respectively.
The average output produced by a sample farmer stood at 197 quintals of banana per acre.
The output of banana produced by marginal, small, medium and large farmers was 190
quintals, 210 quintals, 205 quintals and 215 quintals per acre respectively. The significant
point to be observed here is that as the area of operation increased, the cost also increased
among the four categories of sample farmers. But at the same time, the higher cost of
cultivation was compensated by higher net returns because of higher output produced per
acre. Thus, the higher cost of cultivation was suitably compensated by the higher output.

85
Table 4.1.5a: Cost of cultivation, production and net returns per acre from Banana crop
Farm Size Marginal Small Medium Large All
Farmers
Average area planted (acres) 1.10 2.60 4.30 7.50 2.09
Preparatory tillage 3000
(5.43)
2850
(5.02)
2600
(4.53)
2600
(4.46)
2899
(5.18)
Manure & Fertilizers 9000
(16.29)
10000
(17.62)
12000
(20.90)
12000
(20.59)
9726.67
(17.37)
Transplanting & gap filling 1000
(1.81)
1000
(1.76)
1000
(1.74)
1000
(1.72)
1000
(1.78)
Irrigation, Canal, electricity 3200
(5.79)
3500
(6.17)
3000
(5.23)
3150
(5.41)
3247
(5.80)
Weeding and inter cultural operations 7000
(12.67)
7500
(13.22)
8000
(13.94)
9000
(15.44)
7316
(13.06)
Topping & Pruning 3350
(6.06)
3350
(5.90)
2800
(4.87)
2800
(4.80)
3262
(5.83)
Plant protection, pesticides 7000
(12.67)
7500
(13.22)
8000
(13.93)
8000
(13.73)
7283
(13.01)
Repair maintenance & deprecation
Harvesting & collection
2000
(3.62)
1500
(2.64)
1000
(1.74)
500
(0.86)
1700
(3.04)
Grading, Storage, transport & packing 800
(1.45)
800
(1.41)
600
(1.07)
600
(1.03)
768
(1.37)
Market/mandi fee 150
(0.27)
150
(0.26)
100
(0.17)
100
(0.17)
142
(0.25)
Miscellaneous 700
(1.27)
700
(1.23)
500
(0.87)
500
(0.86)
668
(1.19)
Interest on working capital 13300
(24.07)
13000
(22.91)
12698
(22.12)
12593
(21.61)
13126
(23.44)
Variable Labor cost 2750
(4.98)
2900
(5.11)
2610
(4.55)
2430
(4.17)
2758
(4.93)
Total Variable Cost 53250
(96.38)
54750
(96.48)
54908
(95.65)
55273
(94.85)
53897
(96.26)
Fixed cost
Planting materials, fuel material,
preparation cost, supporting material
and irrigation
1520
(2.75)
1480
(2.60)
1930
(3.36)
2450
(4.20)
1593
(2.85)
Labour Cost 480
(0.87)
520
(0.92)
570
(0.99)
550
(0.94)
503
(0.89)
Total Cost 55250
(100.00)
56750
(100.00)
57408
(100.00)
58273
(100.00)
55994
(100.00)
Total Revenue 150000 160000 170000 175000 155833
Total Revenue – Total Cost 94750 103250 112592 116727 99839
Total Revenue – Total Variable Cost 96750 105250 115092 119727 101935
Output produced/acre (quintals) 190 210 205 215 197
Source: Primary Survey
Table 4.1.5b presents the economics of mango production. Mango, being a perennial crop
takes minimum 4 to 5 years to attain the bearing stage. The average area of mango crop
planted by all the sample farmers was 2.44 acres per household. The average area per
household in the case of marginal, small, medium and large farmers worked out to 1.30 acres,
2.90 acres, 5.40 acres and 8.20 acres, respectively. The total variable cost incurred towards
the cultivation of mango crop per acre by a sample farmer was 8578 which constituted 77
per cent of the total cost. The highest variable cost towards the cultivation of mango was
incurred by the large farmers which accounted for 11736 per acre whereas the lowest cost
to the tune of 7744 per acre was incurred by marginal farmers.

86
Table 4.1.5b: Cost of cultivation, production and net returns per acre from Mango crop
Source: Primary Survey
Variable cost consisted of preparatory tillage, manure, fertilizers, transplanting, gap filling,
plant protection, pesticides, repair & maintenance and variable labour cost. The major
component of variable cost expenditure was manure and fertilizer across all size groups of
farmers which accounted for 20 to 22 per cent of the total cost of cultivation per acre among
all size of holdings. Variable labour cost was found to be the second major item of
expenditure followed by repair and maintenance, plant protection and pesticides across all
size groups of farmers. Fixed cost consisted of material and labour cost. Material cost was the
major item of fixed cost which accounted for 16.46 per cent of the total cost per acre. An
amount of 2850 per acre was spent on material cost per acre by large farmers, the highest
among the four categories of farmers. The material cost was as low as 1680 per acre in case
of marginal farmers whereas it was 1900, 2100 per acre in case of small and medium
farmers, respectively. Labour cost accounted for around 6 per cent of the total cost among all
farmer categories.
Farm Size Marginal Small Medium Large All Farmers
Average area planted (acres) 1.30 2.90 5.40 8.20 2.44
Preparatory tillage 350
(3.48)
475
(3.92)
420
(3.26)
525
(3.41)
395.53
(3.57)
Manure & Fertilizers 2075
(20.67)
2450
(20.23)
2850
(22.12)
3100
(20.14)
2299.83
(20.74)
Transplanting & gap filling 240
(2.39)
210
(1.73)
235
(1.82)
260
(1.69)
232.63
(2.1)
Irrigation, Canal, electricity 450
(4.48)
525
(4.34)
470
(3.65)
540
(3.51)
474.03
(4.27)
Weeding and inter cultural operations 200
(1.99)
645
(5.33)
690
(5.36)
850
(5.52)
393.5
(3.55)
Topping & Pruning 40
(0.4)
50
(0.41)
45
(0.35)
40
(0.26)
43.1
(0.39)
Plant protection, pesticides 820
(8.16)
1160
(9.58)
1040
(8.07)
1350
(8.77)
949.4
(8.56)
Repair maintenance & deprecation 1030
(10.25)
1610
(13.29)
1925
(14.94)
1840
(11.95)
1313.43
(11.84)
Harvesting & collection 60
(0.6)
65
(0.54)
50
(0.39)
50
(0.32)
59.63
(0.54)
Grading, Storage, transport & packing 145
(1.45)
120
(0.99)
210
(1.63)
160
(1.04)
147.57
(1.33)
Market/mandi fee 0 0 0 0 0
Miscellaneous 0 0 0 0 0
Interest on working capital 360
(3.58)
395
(3.26)
447
(3.47)
761
(4.94)
393.02
(3.54)
Variable Labor cost 1974
(19.65)
1763
(14.56)
1542
(11.97)
2260
(14.68)
1876.77
(16.92)
Total Variable Cost 7744
(77.1)
9468
(78.19)
9924
(77.03)
11736
(76.23)
8578.45
(77.35)
Fixed cost
Planting materials, fuel
material, preparation
cost, supporting
material and irrigation
1680
(16.73)
1900
(15.69)
2100
(16.29)
2850
(18.51)
1826.47
(16.46)
Labour Cost 620
(6.17)
740
(6.11)
860
(6.67)
810
(5.26)
686.33
(6.19)
Total Cost 10044
(100.00)
12108
(100.00)
12884
(100.00)
15396
(100.00)
11091.25
(100.00)
Total Revenue 12500 14600 17400 18300 13832
Total Revenue – Total Cost 2456 2492 4516 2904 2740.75
Total Revenue – Total Variable Cost 4756 5132 7476 6564 5253.55
Output produced/acre (quintals) 4.31 5.03 6.00 6.31 4.77

87
The total cost of cultivation of mango was measured at 11091 per acre at the aggregate. The
total cost was as high as 15396 per acre for large farmers whereas it was 12500 per acre
for the marginal farmers. Small and medium farmers spent an amount of 14600 and
17400 towards the cultivation of an acre of mango. The net returns earned by a sample farmer
by cultivating mango were to the tune of 2740 per acre. Among the four categories of
farmers, the highest net returns of 4516 per acre were realized by medium farmers and the
lowest 2456 per acre was obtained by the marginal farmers. The small and large farmers
made net returns of 2492 and 2904 per acre. The net returns obtained from mango
cultivation were found to be much less compared to the net returns realized from banana and
flowers because of the low output realized because of crop mostly was in gestation period.
Most of the sample respondents growing mango reported that they started cultivating mango
trees very recently. As mentioned above, mango crop has a long gestation period and during
gestation period the farmers will have to spend on inputs and labour whereas no output could
be harvested until bearing period begins. This was the basic reason for the sample farmers
obtaining a meager output to the level of 4.77 quintals per acre.
The economics of flower cultivation among the selected households in Tamil Nadu is
presented in Table 4.1.5c. The average area of flower crop cultivated by the sample farmers
worked out to 2.39 acres per household. Costs were divided into variable cost and fixed cost.
Variable cost included different components while fixed cost was subdivided into material
cost and labour cost. The total variable cost worked out to 53108, consisting about 97 per
cent of the total cost of cultivation of flower per acre. Large farmers incurred a higher
variable cost of 54950 per acre closely followed by medium farmers ( 54890). The lowest
variable cost of 52500 per acre of flower cultivation was incurred by marginal farmers. In
the variable cost, interest on working capital was found to be highest 12000 which
constituted 22.4 per cent of the total cost. The next major item of variable cost was manure
and fertilizer that accountedfor 16.94 per cent ( 9200) of the total cost per acre. Weeding,
inter-cultural operations, toping, pruning, plant protection and pesticides were the other major
items of expenditure in the category of variable cost.
Under fixed cost, material cost worked out 1300 per acre by a sample farmer. Large farmers
incurred a material cost of 2080 per acre which was found to be the highest amount
compared to other categories of farmers. Marginal farmers spent the lowest amount of 1150
per acre on material cost compared to other farmers. As against this, the labour cost incurred
by a sample farmer accounted for a meager 1.06 per cent of the total cost of production per
acre.
The total cost of production for all the farmers taken together worked out to 54993 per acre.
Among the four categories, the total cost was high ( 57750) for large farmers followed by
medium ( 57190) farmers. The marginal farmers incurred the lowest total cost of cultivation
per acre 54300. Total revenue generated from an acre of flower crop by a sample farmer
was to the tune of 136211 against a total cost of 54993 per acre. The total revenue earned
by the large farmer was as high as 152700 per acre while it was low at 132450 per acre
for the marginal farmers. Compared to marginal and small farmers, the medium farmers
obtained higher total revenue of 142600 per acre. The net returns obtained by a sample
household from the cultivation of flower came to 81218 per acre. There were fluctuations in
the net returns for different categories of farmers. The highest net returns ( 94950) were
obtained by large farmers whereas the net returns of marginal farmers were low at 78150
per acre. The flower growers in our study secured an average output of 126.97 quintals of

88
flower per acre. The output produced by the marginal, small, medium and large farmers was
120 quintals, 135 quintals, 140 quintals and 142 quintals per acre. However, it may be noted
here that all the sample farmers irrespective of size groups earned a reasonable revenue and
net returns from flower cultivation which implies that NHM scheme was much helpful to
them to reap the benefit by growing horticultural crop.
Table 4.1.5c: Cost of cultivation, production and net returns per acre from Flower crop
Farm Size Marginal Small Medium Large All Farmers
Average area planted (acres) 1.05 2.80 6.10 9.20 2.393
Preparatory tillage 2850
(5.25)
2700
(4.89)
2400
(4.20)
2400
(4.16)
2741
(4.98)
Manure & Fertilizers 9200
(16.94)
10200
(18.49)
13000
(22.73)
13000
(22.51)
10054.7
(18.28)
Transplanting & gap filling 750
(1.38)
800
(1.45)
750
(1.31)
750
(1.30)
762.333
(1.39)
Irrigation, Canal, electricity 3000
(5.52)
2700
(4.89)
2300
(4.02)
2450
(4.24)
2819
(5.13)
Weeding and inter cultural operations 5000
(9.21)
5250
(9.52)
7000
(12.24)
7000
(12.12)
5381.67
(9.79)
Topping & Pruning 4000
(7.37)
4000
(7.25)
3000
(5.25)
3000
(5.19)
3840
(6.98)
Plant protection, pesticides 4000
(7.37)
4200
(7.61)
7000
(12.24)
7000
(12.12)
4529.33
(8.24)
Repair maintenance & deprecation
Harvesting & collection
1850
(3.41)
1200
(2.81)
900
(1.57)
900
(1.56)
1537.67
(2.80)
Grading, Storage, transport & packing 2000
(3.68)
1950
(3.54)
800
(1.40)
800
(1.39)
1795.67
(3.27)
Market/mandi fee 3000
(5.52)
2500
(4.53)
2000
(3.50)
2000
(3.46)
2716.67
(4.94)
Miscellaneous 3000
(5.52)
3000
(5.44)
3000
(5.25)
3000
(5.19)
3000
(5.46)
Interest on working capital 12000
(22.10)
13000
(23.57)
11000
(19.23)
11000
(19.05)
12086.7
(21.98)
Variable Labor cost 1850
(3.41)
1910
(3.46)
1740
(3.04)
1650
(2.86)
1844.2
()
Total Variable Cost 52500
(96.69)
53410
(96.83)
54890
(95.98)
54950
(95.15)
53108.9
(96.57)
Fixed
cost
Planting materials, fuel material,
preparation cost, supporting
material and irrigation
1280
(2.36)
1110
(2.01)
1560
(2.73)
2080
(3.60)
1300.2
(2.36)
Labour Cost 520
(0.96)
640
(1.16)
740
(1.29)
720
(1.25)
584.13
(1.06)
Total Cost 54300
(100.00)
55160
(100.00)
57190
(100.00)
57750
(100.00)
54993.2
(100.00)
Total Revenue 132450 139750 142600 152700 136211.3
Total Revenue – Total Cost 78150 84590 85410 94950 81218.1
Total Revenue – Total Variable Cost 79950 86340 87710 97750 83102.4
Output produced/acre (Quintals) 120 135 140 142 126.97
Source: Primary Survey
In this section we make a comparison of net returns from horticultural crops with the field
crops (Annexure Tables). As shown in the tables, the average net returns realized by a sample
household from kharif crop was 5947 per acre. Across different categories of farmers, small
farmers obtained higher net returns of 6978 per acre from kharif crop whereas marginal
farmers obtained the lowest net returns of 5390 per acre. The net returns generated by the
medium and large farmers were more or less equal to the tune of 6402 and 6501 per acre.
When compared to food grains, the net returns obtained from sugarcane was found to be
high. The net returns obtained from kharif paddy crop were 7301 per acre while the same
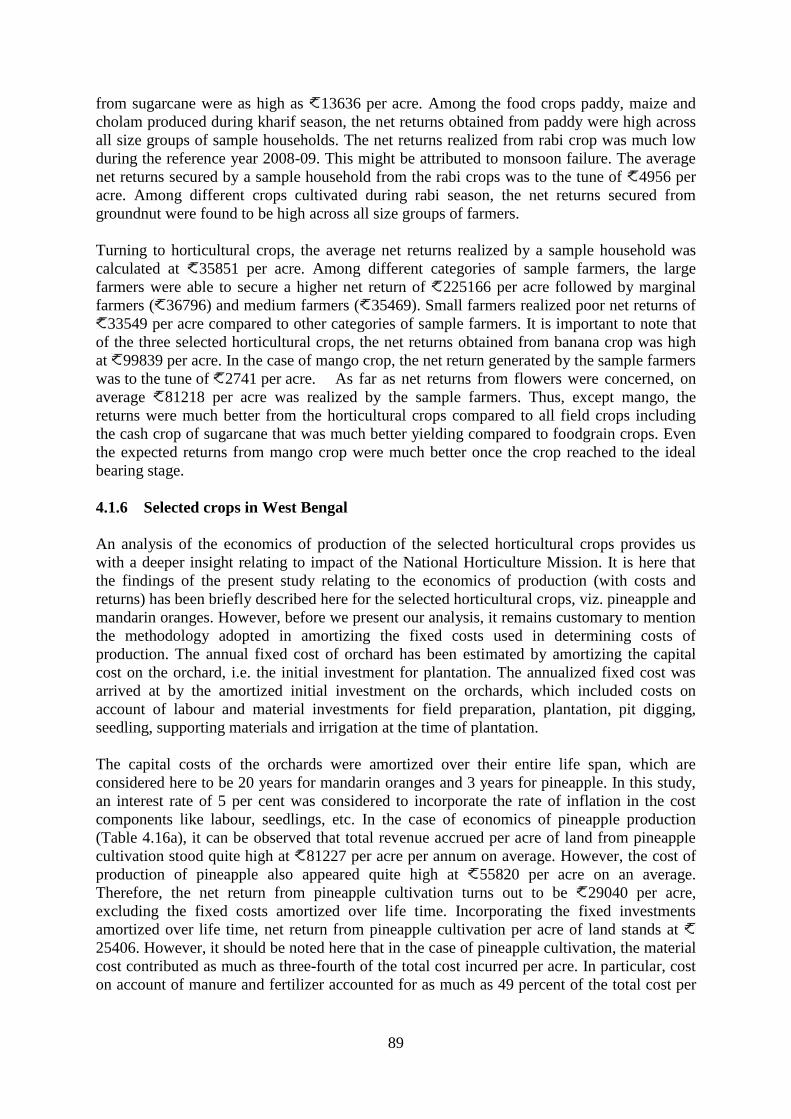
89
from sugarcane were as high as 13636 per acre. Among the food crops paddy, maize and
cholam produced during kharif season, the net returns obtained from paddy were high across
all size groups of sample households. The net returns realized from rabi crop was much low
during the reference year 2008-09. This might be attributed to monsoon failure. The average
net returns secured by a sample household from the rabi crops was to the tune of 4956 per
acre. Among different crops cultivated during rabi season, the net returns secured from
groundnut were found to be high across all size groups of farmers.
Turning to horticultural crops, the average net returns realized by a sample household was
calculated at 35851 per acre. Among different categories of sample farmers, the large
farmers were able to secure a higher net return of 225166 per acre followed by marginal
farmers ( 36796) and medium farmers ( 35469). Small farmers realized poor net returns of
33549 per acre compared to other categories of sample farmers. It is important to note that
of the three selected horticultural crops, the net returns obtained from banana crop was high
at 99839 per acre. In the case of mango crop, the net return generated by the sample farmers
was to the tune of 2741 per acre. As far as net returns from flowers were concerned, on
average 81218 per acre was realized by the sample farmers. Thus, except mango, the
returns were much better from the horticultural crops compared to all field crops including
the cash crop of sugarcane that was much better yielding compared to foodgrain crops. Even
the expected returns from mango crop were much better once the crop reached to the ideal
bearing stage.
4.1.6 Selected crops in West Bengal
An analysis of the economics of production of the selected horticultural crops provides us
with a deeper insight relating to impact of the National Horticulture Mission. It is here that
the findings of the present study relating to the economics of production (with costs and
returns) has been briefly described here for the selected horticultural crops, viz. pineapple and
mandarin oranges. However, before we present our analysis, it remains customary to mention
the methodology adopted in amortizing the fixed costs used in determining costs of
production. The annual fixed cost of orchard has been estimated by amortizing the capital
cost on the orchard, i.e. the initial investment for plantation. The annualized fixed cost was
arrived at by the amortized initial investment on the orchards, which included costs on
account of labour and material investments for field preparation, plantation, pit digging,
seedling, supporting materials and irrigation at the time of plantation.
The capital costs of the orchards were amortized over their entire life span, which are
considered here to be 20 years for mandarin oranges and 3 years for pineapple. In this study,
an interest rate of 5 per cent was considered to incorporate the rate of inflation in the cost
components like labour, seedlings, etc. In the case of economics of pineapple production
(Table 4.16a), it can be observed that total revenue accrued per acre of land from pineapple
cultivation stood quite high at 81227 per acre per annum on average. However, the cost of
production of pineapple also appeared quite high at 55820 per acre on an average.
Therefore, the net return from pineapple cultivation turns out to be 29040 per acre,
excluding the fixed costs amortized over life time. Incorporating the fixed investments
amortized over life time, net return from pineapple cultivation per acre of land stands at
25406. However, it should be noted here that in the case of pineapple cultivation, the material
cost contributed as much as three-fourth of the total cost incurred per acre. In particular, cost
on account of manure and fertilizer accounted for as much as 49 percent of the total cost per
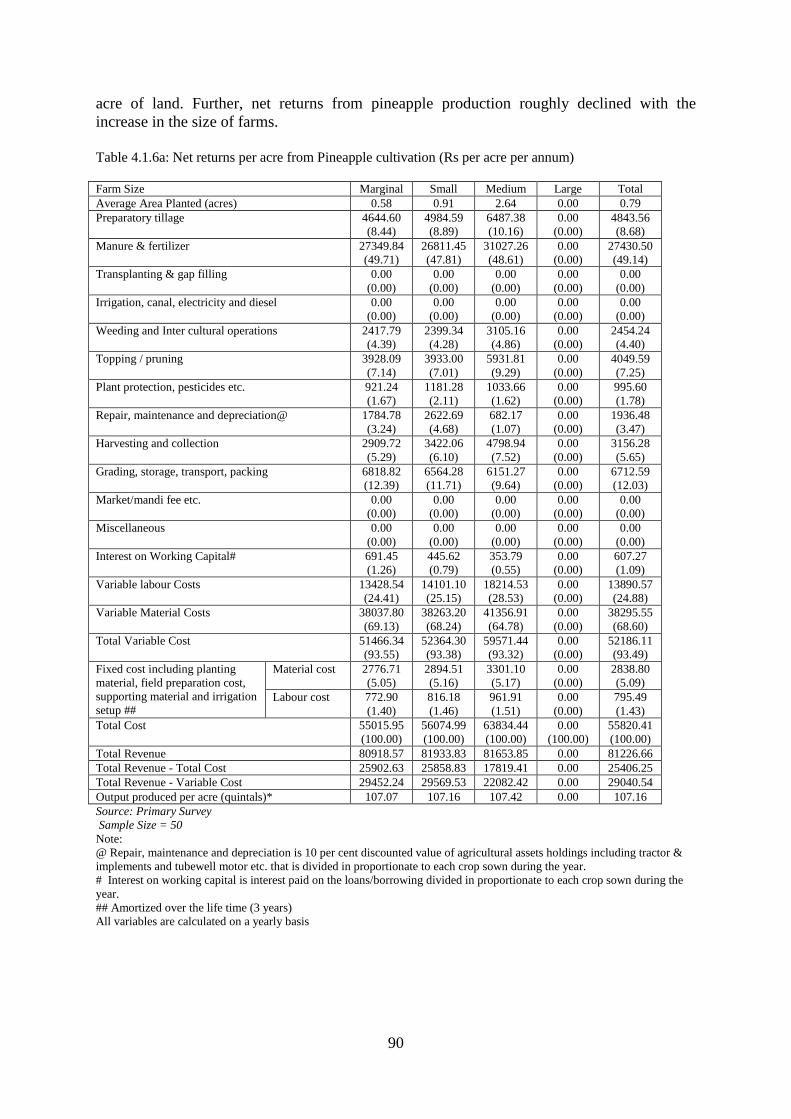
90
acre of land. Further, net returns from pineapple production roughly declined with the
increase in the size of farms.
Table 4.1.6a: Net returns per acre from Pineapple cultivation (Rs per acre per annum)
Farm Size Marginal Small Medium Large Total
Average Area Planted (acres) 0.58 0.91 2.64 0.00 0.79
Preparatory tillage 4644.60
(8.44)
4984.59
(8.89)
6487.38
(10.16)
0.00
(0.00)
4843.56
(8.68)
Manure & fertilizer 27349.84
(49.71)
26811.45
(47.81)
31027.26
(48.61)
0.00
(0.00)
27430.50
(49.14)
Transplanting & gap filling 0.00
(0.00)
0.00
(0.00)
0.00
(0.00)
0.00
(0.00)
0.00
(0.00)
Irrigation, canal, electricity and diesel 0.00
(0.00)
0.00
(0.00)
0.00
(0.00)
0.00
(0.00)
0.00
(0.00)
Weeding and Inter cultural operations 2417.79
(4.39)
2399.34
(4.28)
3105.16
(4.86)
0.00
(0.00)
2454.24
(4.40)
Topping / pruning 3928.09
(7.14)
3933.00
(7.01)
5931.81
(9.29)
0.00
(0.00)
4049.59
(7.25)
Plant protection, pesticides etc. 921.24
(1.67)
1181.28
(2.11)
1033.66
(1.62)
0.00
(0.00)
995.60
(1.78)
Repair, maintenance and depreciation@ 1784.78
(3.24)
2622.69
(4.68)
682.17
(1.07)
0.00
(0.00)
1936.48
(3.47)
Harvesting and collection 2909.72
(5.29)
3422.06
(6.10)
4798.94
(7.52)
0.00
(0.00)
3156.28
(5.65)
Grading, storage, transport, packing 6818.82
(12.39)
6564.28
(11.71)
6151.27
(9.64)
0.00
(0.00)
6712.59
(12.03)
Market/mandi fee etc. 0.00
(0.00)
0.00
(0.00)
0.00
(0.00)
0.00
(0.00)
0.00
(0.00)
Miscellaneous 0.00
(0.00)
0.00
(0.00)
0.00
(0.00)
0.00
(0.00)
0.00
(0.00)
Interest on Working Capital# 691.45
(1.26)
445.62
(0.79)
353.79
(0.55)
0.00
(0.00)
607.27
(1.09)
Variable labour Costs 13428.54
(24.41)
14101.10
(25.15)
18214.53
(28.53)
0.00
(0.00)
13890.57
(24.88)
Variable Material Costs 38037.80
(69.13)
38263.20
(68.24)
41356.91
(64.78)
0.00
(0.00)
38295.55
(68.60)
Total Variable Cost 51466.34
(93.55)
52364.30
(93.38)
59571.44
(93.32)
0.00
(0.00)
52186.11
(93.49)
Fixed cost including planting
material, field preparation cost,
supporting material and irrigation
setup ##
Material cost 2776.71
(5.05)
2894.51
(5.16)
3301.10
(5.17)
0.00
(0.00)
2838.80
(5.09)
Labour cost 772.90
(1.40)
816.18
(1.46)
961.91
(1.51)
0.00
(0.00)
795.49
(1.43)
Total Cost 55015.95
(100.00)
56074.99
(100.00)
63834.44
(100.00)
0.00
(100.00)
55820.41
(100.00)
Total Revenue 80918.57 81933.83 81653.85 0.00 81226.66
Total Revenue - Total Cost 25902.63 25858.83 17819.41 0.00 25406.25
Total Revenue - Variable Cost 29452.24 29569.53 22082.42 0.00 29040.54
Output produced per acre (quintals)* 107.07 107.16 107.42 0.00 107.16
Source: Primary Survey
Sample Size = 50
Note:
@ Repair, maintenance and depreciation is 10 per cent discounted value of agricultural assets holdings including tractor &
implements and tubewell motor etc. that is divided in proportionate to each crop sown during the year.
# Interest on working capital is interest paid on the loans/borrowing divided in proportionate to each crop sown during the
year.
## Amortized over the life time (3 years)
All variables are calculated on a yearly basis

91
Table 4.1.6b: Net returns per acre from Mandarin Orange cultivation
( per acre per annum) Farm Size Marginal Small Medium Large Total
Average Area Planted (acres) 0.84 2.50 0.00 0.00 0.87
Preparatory tillage 1306.76
(12.73)
1335.60
(13.53)
0.00
(0.00)
0.00
(0.00)
1307.33
(12.75)
Manure & fertilizer 1983.67
(19.33)
2236.08
(22.65)
0.00
(0.00)
0.00
(0.00)
1988.72
(19.39)
Transplanting & gap filling 0.00
(0.00)
0.00
(0.00)
0.00
(0.00)
0.00
(0.00)
0.00
(0.00)
Irrigation, canal, electricity and diesel 0.00
(0.00)
0.00
(0.00)
0.00
(0.00)
0.00
(0.00)
0.00
(0.00)
Weeding and Inter cultural operations 814.71
(7.94)
1016.82
(10.30)
0.00
(0.00)
0.00
(0.00)
818.75
(7.98)
Topping / pruning 511.56
(4.98)
502.74
(5.09)
0.00
(0.00)
0.00
(0.00)
511.39
(4.99)
Plant protection, pesticides etc. 0.00
(0.00)
0.00
(0.00)
0.00
(0.00)
0.00
(0.00)
0.00
(0.00)
Repair, maintenance and depreciation@ 1158.82
(11.29)
715.55
(7.25)
0.00
(0.00)
0.00
(0.00)
1149.95
(11.21)
Harvesting and collection 822.11
(8.01)
824.88
(8.36)
0.00
(0.00)
0.00
(0.00)
822.16
(8.02)
Grading, storage, transport, packing 783.30
(7.63)
895.44
(9.07)
0.00
(0.00)
0.00
(0.00)
785.54
(7.66)
Market/mandi fee etc. 0.00
(0.00)
0.00
(0.00)
0.00
(0.00)
0.00
(0.00)
0.00
(0.00)
Miscellaneous 0.00
(0.00)
0.00
(0.00)
0.00
(0.00)
0.00
(0.00)
0.00
(0.00)
Interest on Working Capital# 803.02
(7.82)
0.00
()
0.00
(0.00)
0.00
(0.00)
786.96
(7.67)
Variable Labour Cost 4380.86
(42.69)
5107.20
(51.73)
0.00
(0.00)
0.00
(0.00)
4395.39
(42.86)
Variable Material Costs 3803.08
(37.06)
2419.91
(24.51)
0.00
(0.00)
0.00
(0.00)
3775.42
(36.82)
Total Variable Cost 8183.94
(79.75)
7527.11
(76.24)
0.00
(0.00)
0.00
(0.00)
8170.80
(79.68)
Fixed cost including
planting material, field
preparation cost,
supporting material and
irrigation setup ##
Material
cost
1488.37
(14.50)
1691.42
(17.13)
0.00
(0.00)
0.00
(0.00)
1492.43
(14.55)
Labour cost 590.14
(5.75)
654.10
(6.63)
0.00
(0.00)
0.00
(0.00)
591.41
(5.77)
Total Cost 10262.45
(100.00)
9872.63
(100.00)
0.00
(100.00)
0.00
(100.00)
10254.65
(100.00)
Total Revenue 18452.38 18034.00 0.00 0.00 18444.01
Total Revenue - Total Cost 8189.93 8161.37 0.00 0.00 8189.36
Total Revenue - Variable Cost 10268.44 10506.89 0.00 0.00 10273.21
Output produced per acre (quintals) 9.83 9.60 0.00 0.00 9.83
Source: Primary Survey; Sample Size = 50
Note:
@ Repair, maintenance and depreciation is 10 per cent discounted value of agricultural assets holdings including tractor &
implements and tubewell motor etc. that is divided in proportionate to each crop sown during the year.
# Interest on working capital is interest paid on the loans divided in proportionate to each crop sown during the year.
## Amortized over the life time (20 years) * All variables are calculated on a yearly basis
In sharp contrast to pineapple cultivation, the cost of production and resource use in mandarin
orange cultivation (Table 4.1.6b) appears completely different. In fact, the total revenue
accrued per acre of land per annum from orange cultivation stood at 18444 on average.
While the total costs of production stood at 10255 per acre, cost on account of recurring
labour application every year (variable labour costs) claimed a share of 42.9 percent.
Including the fixed costs amortized over life time. The net return per acre from mandarin
orange cultivation turned out to 8189 on average, that was much lower as compared to
pineapple cultivation. It should be noted however that though the relative share of variable

92
labour cost was much higher in the case of orange production; in actual terms it was almost
three-times per unit of land for pineapple cultivation
A comparison of net returns from horticultural crops and non-horticultural crops (Annexure
Table) reveals that net return from horticultural crops like mandarin oranges and especially
pineapple remained considerably higher than the traditional non-horticultural crops measured
in terms of net monetary returns per acre of land. In fact, net return from pineapple stands
almost four times the net return from traditional crops like paddy. As such, it can safely be
said that horticulture appears as a more profitable cultivation practice in general as compared
to traditional kharif crops. However, rabi crops like ginger, potato, turmeric and chilly also
yielded a higher return, though their cultivation was confined to tiny tracts of land, mostly as
a backyard garden activity.
4.1.7 Selected crops in Haryana
Profitability is the main motive of production of agricultural commodities governing the
behaviour of producers. In reality, perceptions of profitability derive crop selection by the
farmers. Farmers opt for those crops which offer them the highest returns per unit of their
scarcest resources such as land and labour inputs. Profitability is catalytic factor in increasing
production of agricultural commodities. In this section, analysis of gross and net returns from
selected horticultural crops is presented based on data collected through field survey in
selected three districts (Sirsa, Hissar and Rohtak) in Haryana. The discussion is confined to
four horticultural crops namely, kinnow, guava, aonla and garlic. Further, net returns from
these four selected horticultural crops vis-à-vis other crops such as paddy, bajra, vegetables,
cotton, moong, flowers and sugarcane in kharif season, wheat, mustard, vegetables, summer
moong and gram in rabi season are compared. The costs considered for selected three fruit
(kinnow, guava and aonla) crops included variable as well as fixed costs. Variable costs
constituted preparatory tillage, manure and fertilizers, transplanting and gap filling, irrigation,
weeding and intercultural, topping/pruning, plant protection, harvesting and collection,
grading, storage, transport and packing, cost of labour and interest on working capital. Under
fixed costs, planting material, initial, preparatory tillage cost, supporting material and costs of
irrigation setup were considered. These were amortized over the lifetime of the plant. In case
of fourth selected horticultural crop i.e. garlic, only variable costs were considered. In case of
other crops, material and labour costs were considered appropriate for measuring net returns.
The net returns for each crop were worked out by subtracting costs from gross returns. Gross
returns for horticultural crops were calculated on the basis of the value of the main product
while by product was added in the case of other crops.
Kinnow is a variety of citrus fruit cultivated extensively in India and to some extent in
Haryana. With the availability of technology from the Agricultural Universities and the State
Department of Horticulture, farmers are getting inclined to grow kinnow on large scale. The
acreage under kinnow has been expanding rapidly in Haryana during the last couple of years.
The gross returns and net returns from kinnow cultivation on the sampled farms for the year
2008-09 are presented in Table 4.1.7a. The gross revenue per acre from kinnow cultivation
was 22100 at the aggregate among the sampled farmers. Significant differences were
observed across various categories of farmers. The yield rate per acre from kinnow
cultivation was found highest in small category households and therefore, gross returns were
also observed higher in this category in comparison to other categories of farm households. It
is expected that assistance received under NHM has reduced costs of farmers and helped
them in reaping higher net returns per acre from kinnow cultivation. The net returns from

93
kinnow cultivation at variable cost were 14327 per acre at the aggregate level. Class
variations were also noticed for net returns per acre and small farmers reaped higher net
returns compared to other categories of farm households. Looking at the components of cost
of cultivation, manure and fertilizers followed by plant protection measures were the most
important components besides preparatory tillage and irrigation at the aggregate level. The
proportion of cost components in variable and fixed costs varied across different farm size
categories but manure and fertilizers together dominated in each case.
Guava is a tropical fruit and it is grown successfully in tropical and sub-tropical regions. It is
a popular fruit and quite similar in shape to pear. It is available throughout the year except
summer season. It can tolerate high temperature and draught conditions but it is susceptible to
severe frost as it can kill the young plants and also can harm the fruits. Best quality guavas
are produced at low night temperature. The rains during harvesting period, however,
deteriorate the quality of the fruit. The plants begin bearing at an early age of 2-3 years but
they attain full bearing capacity at the age of 8-10 years. The yield of a plant depends on its
age and cultural practices.
Table-4.1.7a: Costs and net returns from cultivation of Kinnow on sample farms in Haryana
( per acre) Farm Size Marginal Small Medium Large overall
Average Area Planted (acre) 0 1.80 2.80 7.63 6.81
Preparatory tillage 0
1051.67
(11.41)
1134.29
(11.10)
1154.47
(12.78)
1151.80
(12.67)
Manure and fertilizer 0 2141.11
(23.23)
1952.12
(19.10)
1711.76
(18.94)
1728.24
(19.01)
Transplanting and gap filling 0 29.44
(0.32)
8.96
(0.09)
10.68
(0.12)
10.84
(0.12)
Irrigation, canal, electricity and diesel 0 938.89
(10.19)
1122.17
(10.98)
1046.33
(11.58)
1047.91
(11.53)
Weeding and intercultural operation 0 787.78
(8.55)
985.11
(9.64)
553.89
(6.13)
576.10
(6.34)
Topping/ pruning 0 588.89
(6.39)
428.57
(4.19)
378.36
(4.19)
383.52
(4.22)
Plant protection, pesticides etc. 0 1062.78
(11.53)
1943.87
(19.01)
1245.77
(13.79)
1274.12
(14.02)
Harvesting and collection 0 166.67
(1.81)
178.57
(1.75)
74.30
(0.82)
80.16
(0.88)
Grading, storage, transport and packing 0 0.00
(0.00)
69.64
(0.68)
75.70
(0.84)
74.38
(0.82)
Market/mandi fee 0 0.00
(0.00)
0.00
(0.00)
0.00
(0.00)
0.00
(0.00)
Miscellaneous 0 0.00
(0.00)
0.00
(0.00)
0.00
(0.00)
0.00
(0.00)
Interest on working capital 0 562.00
(6.10)
629.00
(6.15)
502.00
(5.56)
508.00
(5.59)
Labour cost 0 1262.78
(13.70)
1163.24
(11.38)
923.00
(10.210
938.21
(10.32)
Variable cost 0 8592.00
(93.22)
9615.54
(94.06)
7676.26
(84.950
7773.27
(85.51)
Fixed cost including planting material, field
preparation cost, supporting material and
irrigation setup (amortized over the life time)
0 625.15
(6.78)
607.56
(5.94)
1360.34
(15.05)
1317.07
(14.49)
Total Cost (variable + fixed) 0 9217.15
(100.00)
10223.10
(100.00)
9036.60
(100.00)
9090.34
(100.00)
Gross Revenue (GR) 0 25111.11 24982.14 21922.06 22100.78
Net Returns (GR-Total cost) 0 15893.96 14759.05 12885.46 13010.44
Net Returns (GR- Variable cost) 0 16519.11 15366.61 14245.80 14327.51
Yield per acre(quintals) 0 22.56 22.21 19.36 19.53
Source: Primary Survey

94
Table -4.1.7b: Costs and net returns from cultivation of Guava on sample farms in Haryana
( /acre)
Source: Primary Survey
The gross revenue per acre from cultivation of guava on sampled farms during 2008-09 was
27840 at the aggregate level. The corresponding figures for marginal, small, medium and
large farmers were 45333, 33000, 37215 and 23272, respectively. Thus gross revenue
was lowest for the large farmers. The same pattern was noticed for net returns per acre at the
variable cost. Marginal farmers were observed having better net returns in comparison to
other categories. After including fixed costs, the pattern did not change. Farm size variations
were common in yield per acre and medium farmers followed by marginal farmers reaped
higher yield rates in comparison to other categories. The pattern of costs incurred by the
farmers shows that like kinnow, manure and fertilizers together constituted higher share of
total cost at the aggregate as well as individual categories of farmers. Plant protection
measures and preparatory tillage which formed at least 10 per cent of the total cost were the
other major items of cost of cultivation. In addition, labour cost constituted 11.16 per cent of
the total costs at the aggregate level and in none of the case, it was less than 10 per cent.
Fixed cost was slightly above 10 per cent at the aggregate level. The highest share of fixed
costs was found in small farm category followed by large category farm households.
Farm Size Marginal Small Medium Large overall
Average Area Planted (acre) 0.96 1.83 1.40 3.53 2.35
Preparatory tillage 1229.14
(10.27)
1469.85
(12.76)
1636.19
(14.64)
1031.72
(12.88)
1179.71
(12.94)
Manure and fertilizer 2931.36
(24.49)
2361.52
(20.50)
2306.55
(20.63)
1765.60
(22.04)
1988.35
(21.80)
Transplanting and gap filling 4.69
(0.04)
6.06
(0.05)
6.31
(0.06)
4.85
(0.06)
5.18
(0.06)
Irrigation, canal, electricity and diesel 1061.23
(8.87)
1264.24
(10.98)
1147.38
(10.26)
889.70
(11.11)
979.68
(10.74)
Weeding and intercultural operation 1065.68
(8.90)
749.24
(6.50)
725.24
(6.49)
506.00
(6.32)
602.43
(6.61)
Topping/ pruning 237.04
(1.98)
227.27
(1.97)
321.43
(2.88)
180.60
(2.25)
209.62
(2.30)
Plant protection, pesticides etc. 1378.27
(11.52)
1445.45
(12.55)
1476.67
(13.21)
1221.09
(15.25)
1293.06
(14.18)
Harvesting and collection 459.26
(3.84)
272.73
(2.37)
346.43
(3.10)
157.46
(1.97)
217.72
(2.39)
Grading, storage, transport and packing 367.41
(3.07)
200.00
(1.74)
107.14
(0.96)
79.85
(1.00)
116.76
(1.28)
Market/mandi fee 0.00
(0.00)
0.00
(0.00)
0.00
(0.00)
0.00
(0.00)
0.00
(0.00)
Miscellaneous 0.00
(0.00)
0.00
(0.00)
0.00
(0.00)
0.00
(0.00)
0.00
(0.00)
Interest on working capital 723.00
(6.04)
665.00
(5.77)
656.00
(5.87)
466.00
(5.82)
532.00
(5.83)
Labour cost 1590.12
(13.29)
1502.12
(13.04)
1296.31
(11.60)
821.87
(10.26)
1017.42
(11.16)
Variable cost 11047.20
(92.31)
10163.48
(88.23)
10025.64
(89.69)
7124.73
(88.96)
8141.94
(89.28)
Fixed cost including planting material,
field preparation cost, supporting
material and irrigation setup (amortized
over the life time)
920.14
(7.69)
1355.40
(11.77)
1152.48
(10.31)
884.50
(11.04)
977.38
(10.72)
Total Cost (variable + fixed) 11967.34
(100.00)
11518.88
(100.00)
11178.12
(100.00)
8009.23
(100.00)
9119.32
(100.00)
Gross Revenue (GR) 45333.33 33000.00 37215.71 23272.39 27840.71
Net Returns (GR-Total cost) 33366.00 21481.12 26037.59 15263.16 18721.39
Net Returns (GR- Variable cost) 34286.14 22836.52 27190.07 16147.66 19698.77
Yield per acre(quintals) 29.78 20.64 32.93 20.07 22.62

95
Table-4.1.7c: Costs and net returns from cultivation of Aonla on sample farms in Haryana
( per acre)
Farm Size Marginal Small Medium Large overall
Average area planted (acre) 0 0 0.75 6.75 5.25
Preparatory tillage 0 0 1300.00
(20.82)
1302.47
(15.49)
1302.38
(15.63)
Manure and fertilizer 0 0 1185.00
(18.97)
1469.07
(17.47)
1458.93
(17.51)
Transplanting and gap filling 0 0 5.00
(0.08)
3.46
(0.04)
3.51
(0.04)
Irrigation, canal, electricity and diesel 0 0 1025.00
(16.41)
805.86
(9.59)
813.69
(9.77)
Weeding and intercultural operation 0 0 712.50
(11.41)
472.78
(5.62)
481.34
(5.78)
Topping/ pruning 0.00
(0.00)
0.00
(0.00)
0.00
(0.00)
Plant protection, pesticides, etc. 0 0 541.67
(8.67)
866.05
(10.30)
854.46
(10.26)
Harvesting and collection 0 0 0.00
(0.00)
298.77
(3.55)
288.10
(3.46)
Grading, storage, transport and packing 0 0 0.00
(0.00)
197.53
(2.35)
190.48
(2.29)
Market/mandi fee 0 0 0.00
(0.00)
0.00
(0.00)
0.00
(0.00)
Miscellaneous 0 0 0.00
(0.00)
0.00
(0.00)
0.00
(0.00)
Interest on working capital 359.00
(5.75)
439.00
(5.22)
436.00
(5.23)
Labour cost 0 0 762.50
(12.21)
858.70
(10.21)
855.27
(10.27)
Variable cost 0 0 5890.67
(94.32)
6713.69
(79.85)
6684.15
(80.24)
Fixed cost including planting material, field
preparation cost, supporting material and
irrigation setup (amortized over the life time)
0 0 354.50
(5.68)
1693.72
(20.15)
1645.89
(19.76)
Total Cost (variable + fixed) 0 0 6245.17
(100.00)
8407.41
(100.00)
8330.04
(100.00)
Gross Revenue (GR) 0 0 16666.67 37259.26 36523.81
Net Returns (GR-Total cost) 0 0 10421.50 28851.85 28193.76
Net Returns (GR- Variable cost) 0 0 10776.00 30545.57 29839.65
Yield per acre(quintals) 0 0 15.33 24.5679 24.24
Source: Primary Survey
Aonla is an important fruit crop indigenous to Indian sub-continent which can be grown
successfully in dry and neglected regions. The area under aonla has been expanding rapidly
in the last couple of years. With the growing popularity for alternate medicines, health foods
and herbal products the demand for aonla fruit products is increasing rapidly. This fruit is
highly nutritive with a great medicinal value. In addition, it is rich source of vitamin C. As
aonla fruit is highly perishable in nature, its storage is extremely necessary. The demand for
aonla is increasing both internally and externally. Its popularity as anti disease agent would
boost demand further. The increasing knowledge of its medicinal qualities would increase
demand in future and these developments can benefit farmers if proper strategy to enhance
yield, post harvest technology and processing is evolved.
The productivity of aonla crop on sampled farms in selected districts was found higher than
kinnow and guava. Gross revenue per acre from its cultivation was observed 36523 at the
aggregate level. Unexpectedly, there was a huge gap in gross revenue per acre from aonla
cultivation on medium and large farms. After subtracting variable costs, farmers reaped
29839 per acre during 2008-09. After adding the fixed costs, net returns per acre became

96
lesser by around 1500 per acre. Variable cost constituted around 80 per cent of the total
cost and remaining 20 per cent belonged to fixed cost. Among various components of
variable cost, manure, fertilizer and preparatory tillage together constituted more than 30 per
cent of total variable cost (Table 4.1.7c).
Table 4.1.7d: Costs and net returns from cultivation of Garlic on sample farms in Haryana
( /acre)
Source: Primary Survey
Garlic is known for its valuable condiment for food and a remedy for various ailments and
physiological disorders. It is a short duration crop and occupies land only for six months. In
selected three districts gross revenue per acre from garlic cultivation was 68480 at the
aggregate level (Table 4.1.7d). It is essential to mention that this is the highest returns among
our sampled farmers of all the four horticultural crops. After subtracting variable costs, from
gross revenue, net return per acre from garlic cultivation was computed as 40612 at the
aggregate level. The comparable figures for marginal, small, medium and large farmers were
36350, 29744, 43261 and 41345, respectively. Clearly, medium farmers reaped higher
net returns in comparison to all other categories. The cost structure for garlic cultivation
indicates that transplanting followed by harvesting, manure and fertilizers were the major
cost components. Proportion of each cost component varied across the farm size categories
but these components dominated in each category.
Comparison of net returns from selected horticultural crops vis-à-vis other crops is presented
in Annexure Tables. Results show that net returns from cultivation of flowers followed by
garlic cultivation were higher in comparison to traditional crops grown in Haryana such as
paddy, cotton and bajra in kharif season and wheat, mustard, vegetables and summer moong
Particulars Marginal Small Medium Large Overall
Average area planted (acre) 1.00 0.50 0.63 0.83 0.73
Preparatory tillage 2500.00
(9.56)
2400.00
(7.01)
2080.00
(7.78)
2755.00
(9.97)
2517.14
(9.03)
Manure and fertilizers 1500.00
(5.74)
3467.00
(10.12)
3520.00
(13.16)
3085.00
(11.16)
3151.43
(11.31)
Transplanting and gap filling 6000.00
(22.94)
6667.00
(19.46)
4480.00
(16.75)
5220.00
(18.88)
5177.14
(18.58)
Irrigation, canal, electricity and diesel 3000.00
(11.47)
3667.00
(10.70)
2100.00
(7.85)
1500.00
(5.43)
1942.86
(6.97)
Weeding and intercultural operations 2000.00
(7.65)
1933.00
(5.64)
1840.00
(6.88)
3020.00
(10.92)
2531.43
(9.08)
Plant protection, pesticides etc. 500.00
(1.91)
2333.00
(6.81)
1800.00
(6.73)
1810.00
(6.55)
1777.14
(6.38)
Harvesting and collection 4000.00
(15.30)
6000.00
(17.52)
4800.00
(17.95)
3700.00
(13.38)
4228.57
(15.17)
Grading, storage, transport and packing 1500.00
(5.74)
800.00
(2.34)
1140.00
(4.26)
1510.00
(5.46)
1342.86
(4.82)
Market/mandi fee 0.00
(0.00)
0.00
(0.00)
0.00
(0.00)
0.00
(0.00)
0.00
(0.00)
Miscellaneous 0.00
(0.00)
0.00
(0.00)
0.00
(0.00)
0.00
(0.00)
0.00
(0.00)
Interest on working capital 450.00
(1.72)
589.00
(1.72)
459.00
(1.72)
475.00
(1.72)
479.00
(1.72)
Labour cost 4700.00
(17.97)
6400.00
(18.68)
4520.00
(16.90)
4570.00
(16.53)
4720.00
(16.94)
Variable cost 26150.00
(100.00)
34256.00
(100.00)
26739.00
(100.00)
27645.00
(100.00)
27867.57
(100.00)
Gross Revenue (GR) 62500.00 64000.00 70000.00 68990.00 68480.00
Net returns(Variable cost) 36350.00 29744.00 43261.00 41345.00 40612.43
Yield per acre (quintals) 25.00 30.00 28.00 24.70 26.11

97
in rabi season. The horticultural crop namely, aonla also provided net returns worth 29840
per acre at the aggregate level. Guava harnessed 19699 per acre. Among the selected
horticultural crops, kinnow exhibited lowest net returns from its cultivation because the crop
was mostly in the initial years of fruit bearing and therefore, yield rate was found lower in
comparison to full bearing stage. At the aggregate net returns from traditional crops like
sugarcane, cotton, paddy, wheat and mustard were noticed lower than the selected
horticultural crops except kinnow which showed lower profitability due to the above cited
reason. Farm size variations were found significant in net returns obtained from the
cultivation of various crops. However, any relationship in farm size and net returns could not
be ascertained.
4.2 Use of human labour in horticultural versus non horticultural crops
One of the objectives of National Horticultural Mission was to create opportunities for
employment generation for skilled and unskilled persons, especially unemployed youth in the
villages in addition to enhancing horticultural production, improving nutritional security and
providing income support to farm households. From the analysis done in the previous section
it was seen that value of productivity as well as net returns were higher from the horticultural
crops as compared to traditional foodgrains, pulses and oilseeds and other commercial crops.
In this section, we discuss labour absorption in various activities among our selected
horticultural crops with a comparison of labour absorption among field and horticultural
crops.
In the horticultural crops, labour requirement is higher compared to field crops as in the
plantation crops labour is required for initial plantation, during the gestation period and
during the period when plant is bearing fruit. The labour is required for initial land
preparation, digging pits, lining, sowing nursery, refilling top soil, planting nursery and other
miscellaneous activities. During the gestation period labour uses include inter-culture
operations, manure and fertilizers, insecticides, weeding, irrigation, mulching, shading and
other miscellaneous activities. The manpower requirement at the time of fruit bearing
includes topping and pruning, manure and fertilizers, weeding, harvesting and collection,
grading, storage and marketing.
Table 4.2.1 depicts a comparative statistics of number of days of labour employed for all
activities including sowing, transplanting, growing, harvesting and marketing of a crop by
our selected households in Karnataka. The total numbers of days of employment per acre
generated on the traditional foodgrain crops varied from 21 days for paddy, 9 days for wheat,
12 days for coarse cereals and 8 days and pulses and oilseeds, respectively. In the case of
commercial crops, employment generated varied from 24 days per acre on sugarcane to only
12 days in cotton. Compared to these crops, man days of employment generated was much
higher, 61 days in vegetable crops, 106 days in all fruit crops including the selected grapes
and pomegranate and 67 days on floriculture and aromatic and medicinal crops. Only fodder
crops stood somewhat closer to horticultural crops with average 60 man days per acre. In the
latter case, more number of days of employment was on account of manual harvesting,
collection, transportation, chopping and feeding the animals. Thus, horticultural crops had
advantage over traditional food crops not only in terms of higher productivity, value addition
and net profitability but they also provided better employment to the households in
comparison to all other crops grown on the field in Karnataka. There was possibility of
further value addition and more employment generation in case farmers preferred to
undertake some processing of the horticultural crops at the field level.
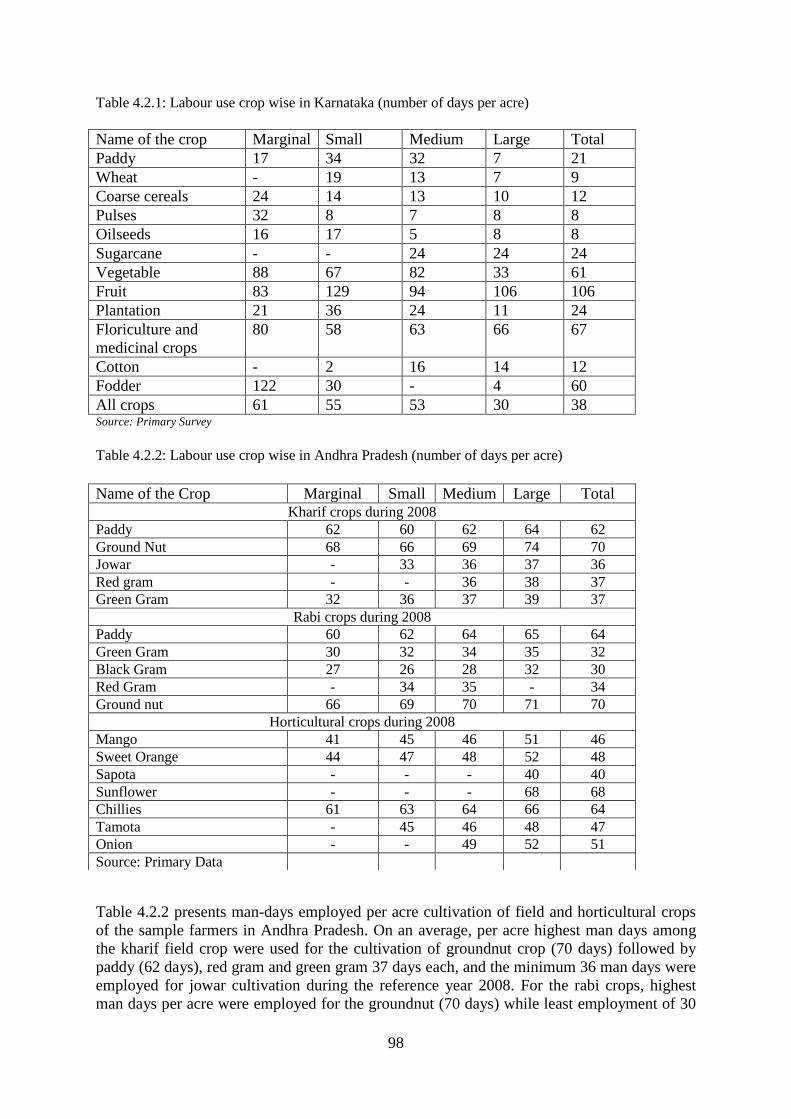
98
Table 4.2.1: Labour use crop wise in Karnataka (number of days per acre)
Name of the crop Marginal Small Medium Large Total
Paddy 17 34 32 7 21
Wheat - 19 13 7 9
Coarse cereals 24 14 13 10 12
Pulses 32 8 7 8 8
Oilseeds 16 17 5 8 8
Sugarcane - - 24 24 24
Vegetable 88 67 82 33 61
Fruit 83 129 94 106 106
Plantation 21 36 24 11 24
Floriculture and
medicinal crops
80 58 63 66 67
Cotton - 2 16 14 12
Fodder 122 30 - 4 60
All crops 61 55 53 30 38 Source: Primary Survey
Table 4.2.2: Labour use crop wise in Andhra Pradesh (number of days per acre)
Table 4.2.2 presents man-days employed per acre cultivation of field and horticultural crops
of the sample farmers in Andhra Pradesh. On an average, per acre highest man days among
the kharif field crop were used for the cultivation of groundnut crop (70 days) followed by
paddy (62 days), red gram and green gram 37 days each, and the minimum 36 man days were
employed for jowar cultivation during the reference year 2008. For the rabi crops, highest
man days per acre were employed for the groundnut (70 days) while least employment of 30
Name of the Crop Marginal Small Medium Large Total Kharif crops during 2008
Paddy 62 60 62 64 62
Ground Nut 68 66 69 74 70
Jowar - 33 36 37 36
Red gram - - 36 38 37
Green Gram 32 36 37 39 37
Rabi crops during 2008
Paddy 60 62 64 65 64
Green Gram 30 32 34 35 32
Black Gram 27 26 28 32 30
Red Gram - 34 35 - 34
Ground nut 66 69 70 71 70
Horticultural crops during 2008
Mango 41 45 46 51 46
Sweet Orange 44 47 48 52 48
Sapota - - - 40 40
Sunflower - - - 68 68
Chillies 61 63 64 66 64
Tamota - 45 46 48 47
Onion - - 49 52 51
Source: Primary Data
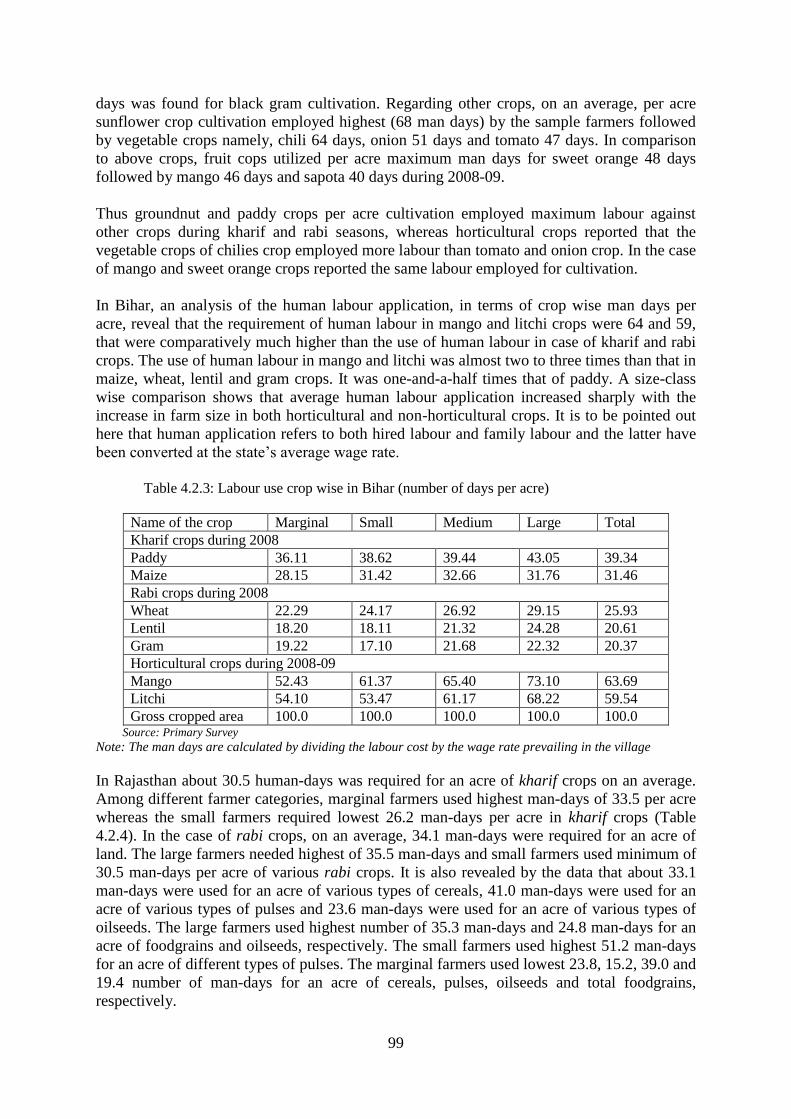
99
days was found for black gram cultivation. Regarding other crops, on an average, per acre
sunflower crop cultivation employed highest (68 man days) by the sample farmers followed
by vegetable crops namely, chili 64 days, onion 51 days and tomato 47 days. In comparison
to above crops, fruit cops utilized per acre maximum man days for sweet orange 48 days
followed by mango 46 days and sapota 40 days during 2008-09.
Thus groundnut and paddy crops per acre cultivation employed maximum labour against
other crops during kharif and rabi seasons, whereas horticultural crops reported that the
vegetable crops of chilies crop employed more labour than tomato and onion crop. In the case
of mango and sweet orange crops reported the same labour employed for cultivation.
In Bihar, an analysis of the human labour application, in terms of crop wise man days per
acre, reveal that the requirement of human labour in mango and litchi crops were 64 and 59,
that were comparatively much higher than the use of human labour in case of kharif and rabi
crops. The use of human labour in mango and litchi was almost two to three times than that in
maize, wheat, lentil and gram crops. It was one-and-a-half times that of paddy. A size-class
wise comparison shows that average human labour application increased sharply with the
increase in farm size in both horticultural and non-horticultural crops. It is to be pointed out
here that human application refers to both hired labour and family labour and the latter have
been converted at the state’s average wage rate.
Table 4.2.3: Labour use crop wise in Bihar (number of days per acre)
Name of the crop Marginal Small Medium Large Total
Kharif crops during 2008
Paddy 36.11 38.62 39.44 43.05 39.34
Maize 28.15 31.42 32.66 31.76 31.46
Rabi crops during 2008
Wheat 22.29 24.17 26.92 29.15 25.93
Lentil 18.20 18.11 21.32 24.28 20.61
Gram 19.22 17.10 21.68 22.32 20.37
Horticultural crops during 2008-09
Mango 52.43 61.37 65.40 73.10 63.69
Litchi 54.10 53.47 61.17 68.22 59.54
Gross cropped area 100.0 100.0 100.0 100.0 100.0 Source: Primary Survey
Note: The man days are calculated by dividing the labour cost by the wage rate prevailing in the village
In Rajasthan about 30.5 human-days was required for an acre of kharif crops on an average.
Among different farmer categories, marginal farmers used highest man-days of 33.5 per acre
whereas the small farmers required lowest 26.2 man-days per acre in kharif crops (Table
4.2.4). In the case of rabi crops, on an average, 34.1 man-days were required for an acre of
land. The large farmers needed highest of 35.5 man-days and small farmers used minimum of
30.5 man-days per acre of various rabi crops. It is also revealed by the data that about 33.1
man-days were used for an acre of various types of cereals, 41.0 man-days were used for an
acre of various types of pulses and 23.6 man-days were used for an acre of various types of
oilseeds. The large farmers used highest number of 35.3 man-days and 24.8 man-days for an
acre of foodgrains and oilseeds, respectively. The small farmers used highest 51.2 man-days
for an acre of different types of pulses. The marginal farmers used lowest 23.8, 15.2, 39.0 and
19.4 number of man-days for an acre of cereals, pulses, oilseeds and total foodgrains,
respectively.

100
Table 4.2.4: Labour use crop wise in Rajasthan (number of days per acre)
Farm size -> Marginal Small Medium Large Total
Kharif crops during 2008
Bajra 37.0 35.2 33.7 30.7 32.5
Groundnut 33.3 30.1 34.0 33.0 33.2
Guar 22.6 23.6 21.5 21.2 21.7
Maize 30.7 19.0 31.1 37.3 32.3
Soyabean 23.4 23.7 13.6 25.4 22.6
Tur 11.7 93.8 0.0 66.7 61.8
Rice 28.0 27.1 35.7 45.8 38.1
Urad 24.3 38.7 15.5 35.5 29.5
Cotton 79.2 10.4 0.0 20.8 45.6
Jowar 0.0 29.2 18.1 16.0 18.3
Sesamum 0.0 20.0 16.4 20.3 18.9
Sugarcane 0.0 0.0 0.0 75.0 75.0
Total kharif 33.5 26.2 28.8 31.9 30.5
Rabi crops during 2008
Wheat 35.1 33.7 36.5 41.6 38.6
Gram 9.6 21.0 37.7 31.8 31.8
Mustard 20.8 17.7 18.6 20.4 19.7
Maize 35.9 44.3 0.0 41.7 39.4
Barley 0.0 27.7 30.5 33.9 32.4
Total rabi 33.2 30.5 33.2 35.5 34.1
Horticultural crops during 2008-09
Aonla 55.9 63.4 49.7 53.3 54.6
Brinjal 16.7 29.0 52.1 35.1 38.8
Chilli 51.6 42.6 45.7 44.3 45.3
Mango 38.6 34.4 31.5 53.5 42.0
Onion 55.7 20.3 40.8 36.7 37.8
Papaya 119.4 76.2 97.0 84.1 93.2
Tomato 65.2 50.3 47.2 46.4 48.4
Ber 0.0 18.7 0.0 45.0 36.2
Bael 0.0 11.8 20.9 12.5 13.7
Coriander 0.0 23.8 20.6 19.8 20.4
Garlic 0.0 24.2 30.9 35.3 32.3
Guava 0.0 36.7 10.7 13.7 12.7
Gunda/ Lisoda 0.0 46.0 0.0 0.0 46.0
Isabgoal 0.0 14.1 20.4 23.0 21.0
Mosambi 0.0 17.9 0.0 49.0 32.7
Anar 0.0 0.0 19.6 22.4 21.7
Cucumber 0.0 0.0 51.3 0.0 51.3
Fenugreek 0.0 0.0 28.3 30.3 29.1
Lemon 0.0 0.0 14.1 22.0 17.3
Cauliflowar 0.0 0.0 0.0 57.3 57.3
Kinnow 0.0 0.0 0.0 37.0 37.0
Lady finger 0.0 0.0 0.0 37.3 37.3
Water melon 0.0 0.0 0.0 34.2 34.2
Total horticultural crops 72.2 46.5 36.3 36.5 39.8
Average (all crops) 42.3 33.1 32.0 34.0 33.7 Source: Primary Survey
As far as the use of human labour in various horticultural crops is concerned, an average of
39.8 man-days was required per acre of horticultural crops. The marginal farmers used
highest of 72.2 man-days while the medium farmers used lowest 36.3 man-days per acre for
various horticultural crops. The horticultural crops were more labour intensive compared to
non-horticultural crops as average man-days required for an acre of horticultural crops was

101
higher than that of non-horticultural crops. On an average, 54.6 man-days was required for an
acre of aonla. The small farmers used highest 63.4 man-days whereas the medium farmers
employed lowest 49.7 man-days per acre of aonla. In the case of mango, about 42.0 man-days
were used per acre on an average. The large farmers utilized highest 53.5 man-days while the
medium farmers used a minimum 31.5 man-days for an acre of mango during the reference
year. In the case of papaya, about 93.2 man-days were used per acre on average that was the
highest among all crops cultivated by the sample farmers. Marginal farmers used highest
119.4 man-days for papaya while a lowest 76.2 man days was required by small farmers for
the same crop.
For the coriander crop, an average number of 20.4 man-days were employed per acre. The
small farmers used highest 23.8 man-days whereas the large farmers used minimum 19.8
man-days per acre for the cultivation of coriander. It was also observed that the long duration
crops required more labour days per annum compared to the short duration crops. However,
the annual requirement of human labour declines after few years in case of these long
duration crops.
It could be understood from Table 4.2.5 that among the selected farmers in Tamil Nadu the
man days used for all the kharif crops by the sample households on an average worked out to
20.76 per acre. It is evident from the table that marginal farmers, compared to other
categories, used more man days per acre (21.6). The man days required by the large farmers
was found to be low at 18.2. Among different kharif crops, paddy required more man days
which ranges from 26 to 29 per acre whereas the fodder crop cholam employed the minimum
man days to the tune of 6 to 9 per acre. As regards rabi crop, the man days required on an
average worked out to 19.99 per acre. Here again, the man days used by the small farmers
were found to be high at 20.75 per acre whereas the large farmers used only 17.5 man days
per acre. Likewise the kharif crops, in the rabi also paddy consumed more man days when
compared to other rabi crops. Paddy on an average required 29.15 man days per acre. The
least number of man days used was for ragi crop (12.65) followed by pulses (13.87).
Groundnut required 24.27 man days per acre.
It may be observed form Table 4.2.5 that for horticultural crops, the sample farmers used
27.57 man days on an average per acre. As in the case of kharif and rabi crops, the same kind
of variation existed among the four categories of sample households cultivating horticultural
crops regarding the use of man days. The numbers of man days used by marginal farmers for
all horticultural crops were found to be high at 28.6 while the same for large farmers worked
out to 24.0 per acre. The small and medium farmers used 26.83 man days and 25.17 man
days per acre respectively in case of all horticultural crops. Among the different horticultural
crops cultivated by the sample farmers, the highest number of man days used was for banana
crop (36.64), followed by mango crop (34.71) and the lowest number of man days required
was for vegetables (20.18). As far as the use of human labour for kharif, rabi and horticultural
crops were concerned a special feature found from the data was that the man days of human
labour used varied depending upon the size of the farm. There was a negative relationship
between the size of farm and requirement of man days; as the size of farm increased the use
of human labour decreased and vice-versa. Table 4.2.5 shows that the use of human labour in
case of all crops on an average worked out to 23.65, 22.11, 20.73 and 19.90 man days per
acre for marginal, small, medium and large farmers, respectively.

102
Table 4.2.5: Labour use crop wise in Tamil Nadu (number of days per acre)
Farm Size Marginal Small Medium Large Total
Kharif crops during 2008
Paddy 29 27 27 26 28.15
Maize 17 15 13 13 15.86
Groundnut 25 23 23 21 24.12
Sugarcane 28 26 25 25 27.03
Cholam 9 9 7 6 8.65
Total Kharif 21.60 20.00 19.00 18.20 20.76
Rabi crops during 2008
Paddy 30 28 28 27 29.15
Pulses 15 13 11 11 13.87
Groundnut 25 24 22 22 24.27
Ragi 13 13 11 10 12.65
Total Rabi 20.75 19.50 18.00 17.50 19.99
Horticultural crops during 2008-09
Banana 37 35 32 30 36.64
Mango 35 33 30 30 34.71
Other fruits - 25 24 22 24.45
Vegetables 20 21 20 18 20.18
Plantation crops 26 24 22 22 25.37
Spices & Condiments - - - - -
Flowers 25 23 23 22 24.07
Medicinal crops - - - - -
Others - - - - -
Total Horticultural crop 28.60 26.83 25.17 24.00 27.57
Average (all crops) 23.65 22.11 20.73 19.90 22.77 Source: Primary Survey
In West Bengal, analysis of the human labour application (crop-wise man-days per acre)
reveals that the requirement of human labour in pineapple production was comparatively
much higher than the use of human labour in case of mandarin oranges (Table 4.2.6). In
particular, the use of human labour in pineapple cultivation was almost two-and-a-half times
than that in the case of mandarin oranges. A size-class wise comparison shows that average
human labour application increased sharply with the increase in farm-size in the case of both
pineapple and mandarin orange production. It should be noted here that in this analysis,
human labour application refers to both hired labour and family labour, converted at regional
average wage rates.
Comparing labour employment across various crops in West Bengal, the total man days
employed in kharif crops varied between 74 in paddy to 80 in millet and maize. The variation
was much higher in rabi crops, viz., 65 mandays in chillies, 54 in ginger, 48 in potato and 89
in turmeric. Comparing these figures with the horticultural crops, pineapple employed much
higher mandays averaging at 139 man days while orange and tea plantation employed around
55 man days and broom stick employed only 33 man days. Thus among the selected
pineapple crop employment provision was highest compared to all other crops while
mandarin orange employed less than the cereal and vegetable crops. The man days
employment figures were not available across various categories of households in West

103
Bengal as there was no data for the large farmers and most of the crops in rabi, kharif and
horticulture category were not grown by the medium farmers.
Table 4.2.6: Labour use crop wise in West Bengal (number of days per acre)
Name of the crop Marginal Small Medium Large Total
Kharif crops during 2008
Maize 54.27 61.28 0.00 0.00 80.05
Millet 63.88 0.00 0.00 0.00 80.88
Paddy 74.30 77.90 77.08 0.00 74.41
Rabi crops during 2008
Chillie 66.00 63.47 0.00 0.00 65.37
Ginger 54.61 49.83 0.00 0.00 54.49
Potato 48.51 46.60 0.00 0.00 48.46
Turmeric 89.25 0.00 0.00 0.00 89.25
Horticultural crops during 2008-09
Pineapple 134.29 141.01 182.15 0.00 138.90
Mandarin Orange 54.77 63.86 0.00 0.00 54.94
Broom Stick 32.89 0.00 0.00 0.00 32.89
Tea 51.74 55.22 62.28 0.00 54.90 Source: Primary Survey
Note:
1. Labour days include family labour days,
2. Use of variable labour per year for horticultural crops,
3. The man days are calculated by dividing the labour cost by the wage rate prevailing in the village
The information on labour use for the selected horticultural and other crops grown by the
farmers in the selected districts of Haryana is presented in Table 4.2.7. As shown in the table,
garlic generated highest employment per acre in terms of labour days. Among traditional
crops, cotton, flowers and moong (rabi) generated at least 20 days of employment.
Vegetables also generated 16 days per acre employment in kharif season and 14 days per acre
employment during the rabi season in Haryana. The average use of labour in horticultural
crops was around 29 man days per acre. But, marginal farmers utilized higher number of man
days per acre in the cultivation of horticultural crops in comparison to other categories of the
farmers. To conclude, horticultural crops such as flowers, vegetable and fruit crops show
greater potential of generating employment as compared to cereals and other food grain
crops. Commercial crops like cotton too generate relatively higher employment in
comparison to several other crops. Among horticultural crops, generation of employment
depends on the type of fruit and vegetable crops. An examination of activity wise use of
human labour in cultivation of selected horticultural crops revealed that marginal farmers
used more than average number of labour days in growing these crops. Major activities
consuming higher share of human labour were pit making, seedling, weeding and plant
protection measures irrespective of farm size.

104
Table 4.2.7: Labour use crop wise in Haryana (number of days per acre)
Source: Primary Survey
4.3 Marketing channels of horticultural crops
After harvesting and packing where do farmers market their produce is seen in this section.
Marketing of agricultural commodities in India, especially that of grains is mostly done
through the network of regulated markets under the Agricultural Produce Marketing
Committee Act (APMC) that hitherto was binding on the both the sellers and the buyers until
recently when the Act was liquidated and direct entry of buyers is allowed to procure the
produce from the farm. However, in the case of horticultural crops, generally there is no
provision in the regulated mandis for handling of horticultural crops such as fruits and
vegetables. Therefore, there is a separate network of wholesale markets for the horticultural
crops. However, like grains, all the horticultural crops are not sold through regulated or
wholesale markets and there are multiple players in the sale of horticultural crops.
In horticultural farming, where prices are rarely regulated, financial viability depends as
much upon business and marketing skills as on the farmer's technical expertise. It is high-
value crops which are often a crucial component of viable small farms. If farmers are to
increase production, more attention needs to be paid to the fact that their output must be
Name of the crop Marginal Small Medium Large Total
Kharif crops
Paddy 0 11 18 14 15
Bajra 14 5 10 6 6
Vegetable 13 40 17 14 16
Maize 0 0 13 0 13
Cotton 0 32 24 22 22
Moong 0 0 20 8 8
Gwar 0 0 20 7 7
Jowar 7 4 6 8 7
Flower 27 0 17 0 22
Arhar 0 2 10 27 17
Sugarcane 0 0 0 7 7
Til (sesamum) 0 0 0 3 3
Rabi crops
Wheat 9 8 11 11 11
Mustard 17 9 13 11 11
Vegetable 16 25 13 14 14
Barseem 0 3 3 7 6
Jowar 0 0 6 8 7
Moong 0 0 20 0 20
Gram 0 0 0 10 10
Sugarcane 0 0 0 7 7
Barley 0 0 0 7 7
Selected Horticultural crops
Garlic 81 117 88 94 94
Kinnow 0 21 22 16 16
Guava 28 23 22 15 18
Aonla 0 0 13 15 14

105
marketed at a rewarding price. Proper marketing facilities wound not only provide good
amount of cash income to farmers but also encourage further developments in both
production and processing of the horticultural crops.
In Karnataka, Agricultural Produce Marketing Committee Yards and APMC Act includes the
marketing of horticultural produces also. But in practice only few horticultural products that
are less perishable like coconut, areca nut, potato and onions are marketed through APMC’s
that is around 6 percent of the total production of horticultural crops. Most of the vegetables
and fruits in larger cities and towns are traded in the central market area, usually municipal
market. The wholesale trade of fruits and vegetables is carried out by small auction sales or
negotiated sales in terms of baskets/bags etc. In Karnataka, some special efforts have been
made to improve marketing of horticultural products. However, these initiatives remained
concentrated mostly in Bangalore and other big city centres and there is generally a lack of
backward linkage up to the producers in the villages. Table 4.3.1 presents marketing channels
thorough which selected horticultural crops were being sold by our selected households.
There were mainly four or five channels through which our selected horticultural crops were
being sold including wholesale market, local market, government agency and merchants and
pre arranged contracts.
Table 4.3.1: Marketing channels through which horticultural products were sold by the
selected households (percentage of households) - Karnataka
Wholes
ale
market
Local
market
Village
directly
Coop-
erative
Govt
agencies
Intermediaries
at the farm
gate
Merchant or
pre arranged
Contract
Others Aggreg
ate
Grapes
Marginal 0.0 0.0 0.0 0.0 100.0 0.0 0.0 0.0 100.0
Small 0.0 42.9 0.0 0.0 28.6 0.0 28.6 0.0 100.0
Medium 28.6 0.0 0.0 0.0 42.9 28.6 0.0 0.0 100.0
Large 15.8 10.5 0.0 0.0 31.6 15.8 21.1 5.3 100.0
Total 14.7 14.7
35.3 14.7 17.7 2.9 100.0
Pomegranate
Marginal 0.0 0.0 0.0 0.0 33.3 0.0 66.7 0.0 100.0
Small 10.0 0.0 0.0 10.0 30.0 10.0 30.0 10.0 100.0
Medium 14.3 0.0 0.0 28.6 14.3 0.0 14.3 28.6 100.0
Large 7.7 7.7 0.0 15.4 38.5 7.7 23.1 0.0 100.0
Total 9.1 3.0 0.0 15.2 30.3 6.1 27.3 9.1 100.0
Floriculture
Marginal 56.4 2.6 7.7 0.0 10.3 2.6 15.4 5.1 100.0
Small 55.0 25.0 0.0 5.0 15.0 0.0 0.0 0.0 100.0
Medium 20.0 0.0 40.0 0.0 40.0 0.0 0.0 0.0 100.0
Large 33.3 16.7 16.7 0.0 0.0 0.0 0.0 33.3 100.0
Total 51.4 10.0 8.6 1.4 12.9 1.4 8.6 5.7 100.0
Aromatic and medicinal plants
Marginal 14.3 0.0 0.0 0.0 14.3 28.6 0.0 42.9 100.0
Small 18.2 0.0 9.1 0.0 18.2 9.1 36.4 9.1 100.0
Medium 14.3 14.3 0.0 0.0 28.6 14.3 28.6 0.0 100.0
Large 0.0 0.0 0.0 0.0 0.0 100.0 0.0 0.0 100.0
Total 15.4 3.9 3.9 0.0 19.2 19.2 23.1 15.4 100.0 Source: Primary Survey
In the case of grapes, around 15 percent of the total sale was done through wholesale market,
local market in the nearby town and intermediaries at the farm gate level, each. Around 35
percent of grapes were sold through government agencies and remaining 20 percent were
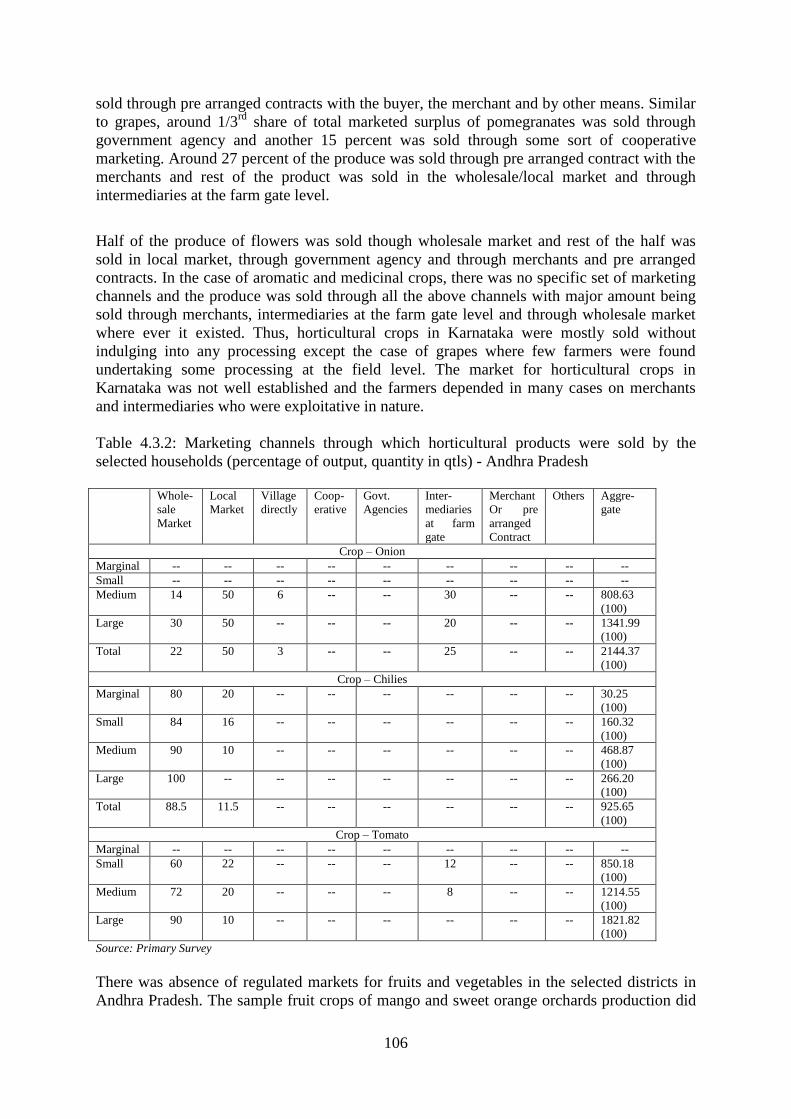
106
sold through pre arranged contracts with the buyer, the merchant and by other means. Similar
to grapes, around 1/3rd
share of total marketed surplus of pomegranates was sold through
government agency and another 15 percent was sold through some sort of cooperative
marketing. Around 27 percent of the produce was sold through pre arranged contract with the
merchants and rest of the product was sold in the wholesale/local market and through
intermediaries at the farm gate level.
Half of the produce of flowers was sold though wholesale market and rest of the half was
sold in local market, through government agency and through merchants and pre arranged
contracts. In the case of aromatic and medicinal crops, there was no specific set of marketing
channels and the produce was sold through all the above channels with major amount being
sold through merchants, intermediaries at the farm gate level and through wholesale market
where ever it existed. Thus, horticultural crops in Karnataka were mostly sold without
indulging into any processing except the case of grapes where few farmers were found
undertaking some processing at the field level. The market for horticultural crops in
Karnataka was not well established and the farmers depended in many cases on merchants
and intermediaries who were exploitative in nature.
Table 4.3.2: Marketing channels through which horticultural products were sold by the
selected households (percentage of output, quantity in qtls) - Andhra Pradesh
Whole-
sale
Market
Local
Market
Village
directly
Coop-
erative
Govt.
Agencies
Inter-
mediaries
at farm
gate
Merchant
Or pre
arranged
Contract
Others Aggre-
gate
Crop – Onion
Marginal -- -- -- -- -- -- -- -- --
Small -- -- -- -- -- -- -- -- --
Medium 14 50 6 -- -- 30 -- -- 808.63
(100)
Large 30 50 -- -- -- 20 -- -- 1341.99
(100)
Total 22 50 3 -- -- 25 -- -- 2144.37
(100)
Crop – Chilies
Marginal 80 20 -- -- -- -- -- -- 30.25
(100)
Small 84 16 -- -- -- -- -- -- 160.32
(100)
Medium 90 10 -- -- -- -- -- -- 468.87
(100)
Large 100 -- -- -- -- -- -- -- 266.20
(100)
Total 88.5 11.5 -- -- -- -- -- -- 925.65
(100)
Crop – Tomato
Marginal -- -- -- -- -- -- -- -- --
Small 60 22 -- -- -- 12 -- -- 850.18
(100)
Medium 72 20 -- -- -- 8 -- -- 1214.55
(100)
Large 90 10 -- -- -- -- -- -- 1821.82
(100)
Source: Primary Survey
There was absence of regulated markets for fruits and vegetables in the selected districts in
Andhra Pradesh. The sample fruit crops of mango and sweet orange orchards production did
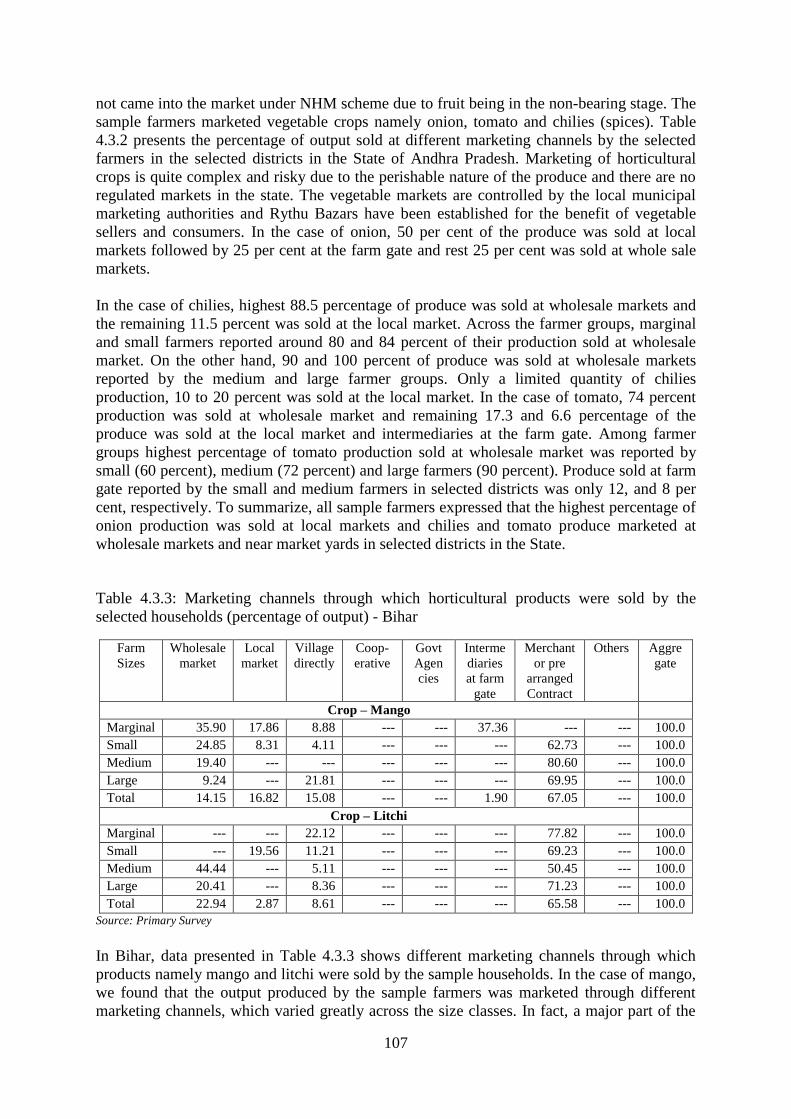
107
not came into the market under NHM scheme due to fruit being in the non-bearing stage. The
sample farmers marketed vegetable crops namely onion, tomato and chilies (spices). Table
4.3.2 presents the percentage of output sold at different marketing channels by the selected
farmers in the selected districts in the State of Andhra Pradesh. Marketing of horticultural
crops is quite complex and risky due to the perishable nature of the produce and there are no
regulated markets in the state. The vegetable markets are controlled by the local municipal
marketing authorities and Rythu Bazars have been established for the benefit of vegetable
sellers and consumers. In the case of onion, 50 per cent of the produce was sold at local
markets followed by 25 per cent at the farm gate and rest 25 per cent was sold at whole sale
markets.
In the case of chilies, highest 88.5 percentage of produce was sold at wholesale markets and
the remaining 11.5 percent was sold at the local market. Across the farmer groups, marginal
and small farmers reported around 80 and 84 percent of their production sold at wholesale
market. On the other hand, 90 and 100 percent of produce was sold at wholesale markets
reported by the medium and large farmer groups. Only a limited quantity of chilies
production, 10 to 20 percent was sold at the local market. In the case of tomato, 74 percent
production was sold at wholesale market and remaining 17.3 and 6.6 percentage of the
produce was sold at the local market and intermediaries at the farm gate. Among farmer
groups highest percentage of tomato production sold at wholesale market was reported by
small (60 percent), medium (72 percent) and large farmers (90 percent). Produce sold at farm
gate reported by the small and medium farmers in selected districts was only 12, and 8 per
cent, respectively. To summarize, all sample farmers expressed that the highest percentage of
onion production was sold at local markets and chilies and tomato produce marketed at
wholesale markets and near market yards in selected districts in the State.
Table 4.3.3: Marketing channels through which horticultural products were sold by the
selected households (percentage of output) - Bihar
Farm
Sizes
Wholesale
market
Local
market
Village
directly
Coop-
erative
Govt
Agen
cies
Interme
diaries
at farm
gate
Merchant
or pre
arranged
Contract
Others Aggre
gate
Crop – Mango
Marginal 35.90 17.86 8.88 --- --- 37.36 --- --- 100.0
Small 24.85 8.31 4.11 --- --- --- 62.73 --- 100.0
Medium 19.40 --- --- --- --- --- 80.60 --- 100.0
Large 9.24 --- 21.81 --- --- --- 69.95 --- 100.0
Total 14.15 16.82 15.08 --- --- 1.90 67.05 --- 100.0
Crop – Litchi
Marginal --- --- 22.12 --- --- --- 77.82 --- 100.0
Small --- 19.56 11.21 --- --- --- 69.23 --- 100.0
Medium 44.44 --- 5.11 --- --- --- 50.45 --- 100.0
Large 20.41 --- 8.36 --- --- --- 71.23 --- 100.0
Total 22.94 2.87 8.61 --- --- --- 65.58 --- 100.0
Source: Primary Survey
In Bihar, data presented in Table 4.3.3 shows different marketing channels through which
products namely mango and litchi were sold by the sample households. In the case of mango,
we found that the output produced by the sample farmers was marketed through different
marketing channels, which varied greatly across the size classes. In fact, a major part of the

108
output produced by marginal farmers was channeled to the intermediaries at the farm gate
(37.36 percent), which acted as a pre-dominant marketing channel for the marginal farmers.
On the other hand, major part of the output produced by the small, medium and large farmers
was marketed to the merchant/traders on pre-arranged contracts. It reflected pre-arranged
contract (67.05 percent) was the major channel in marketing the produce at the overall level,
followed by local market (16.82 percent), directly to the consumers at village (15.08 percent)
and wholesale market (14.15 percent). The government or cooperative agencies did not play
any significant role in marketing the output in the study area.
In the case of litchi also it was observed that there was a complete absence of formal
marketing channels like government agencies, cooperatives etc. Most of the output produced
by all the categories of farmers was sold to merchant/traders on pre-arranged contracts. At the
overall, 65.58 per cent of the produced quantity was sold on pre-arranged contract, followed
by wholesale markets (22.94 percent), directly to the villagers (8.61 percent) and local market
(2.87 percent).
In Rajasthan, Table 4.3.4 shows the sale of output of selected horticultural crops, viz., aonla,
papaya, coriander and mango through various marketing channels. The analysis of marketing
of aonla through different channels revealed that about 36.06 quintals of aonla per
household(HH) was sold through various marketing channels out of which, 54.52 per cent
was sold in wholesale market, 38.27 per cent was sold by pre arranged contract and 7.21
percent was sold through intermediaries. Among various farmer categories, the large farmers
sold highest amount of output of 40.67 quintals per HH, out of which 59.02 per cent was sold
in wholesale market and 40.98 per cent was sold through pre arranged contracts. The small
farmers sold 36.15 quintals of mango per HH, out of which 57.45 per cent was sold in
wholesale market and 42.55 per cent was sold through pre arranged contracts. The medium
farmers sold 35.44 quintals of mango per HH, out of which 42.01 per cent was sold in
wholesale market, 37.62 per cent was sold through pre arranged contract and 20.38 per cent
was sold through intermediaries.
The total papaya production of 73.14 quintals/HH was marketed through various channels out
of which 62.65% was sold in the wholesale market. However, about 21.06 per cent of total
papaya output was sold on pre-arranged contract and 13.40 per cent of total papaya output
was sold through intermediaries at farm gate. Only 2.90 per cent of total papaya output was
sold in the nearby local market. Among various farmer categories, the large farmers sold
highest amount of output of 135.00 quintals per HH, out of which 62.96 per cent was sold in
wholesale market, 14.81 per cent was sold through pre-arranged contract and 22.22 per cent
was sold through intermediaries. The medium farmers sold 109.38 quintals of papaya per
HH, out of which 42.86 per cent was sold in the wholesale market and 28.57 per cent each
was sold through pre arranged contract and through intermediaries. The small farmers sold
80.92 quintals of papaya per HH, out of which 61.31 per cent was sold in the wholesale
market, 34.22 per cent was sold through pre arranged contract and 4.47 per cent was sold at
local market. A major part of output by marginal farmers was also sold trough wholesale
markets.

109
Table 4.3.4: Marketing channels through which horticultural products were sold by
the selected households (Qtls per hh) - Rajasthan
Wholesale
market
Local market Intermediaries at
farm gate
Merchant or pre
arranged Contract
Others Aggregate
Aonla
Marginal 21.25 (100.00) 0.00 (0.00) 0.00 (0.00) 0.00 (0.00) 0.00 (0.00) 21.25 (100.00)
Small 20.77 (57.45) 0.00 (0.00) 0.00 (0.00) 15.38 (42.55) 0.00 (0.00) 36.15 (100.00)
Medium 14.89 (42.01) 0.00 (0.00) 7.22 (20.38) 13.33 (37.62) 0.00 (0.00) 35.44 (100.00)
Large 24.00 (59.02) 0.00 (0.00) 0.00 (0.00) 16.67 (40.98) 0.00 (0.00) 40.67 (100.00)
Total 19.66 (54.52) 0.00 (0.00) 2.60 (7.21) 13.80 (38.27) 0.00 (0.00) 36.06 (100.00)
Papaya
Marginal 28.14 (90.92) 2.81 (9.08) 0.00 (0.00) 0.00 (0.00) 0.00 (0.00) 30.95 (100.00)
Small 49.62 (61.31) 3.62 (4.47) 0.00 (0.00) 27.69 (34.22) 0.00 (0.00) 80.92 (100.00)
Medium 46.88 (42.86) 0.00 (0.00) 31.25 (28.57) 31.25 (28.57) 0.00 (0.00) 109.38 (100.00)
Large 85.00 (62.96) 0.00 (0.00) 30.00 (22.22) 20.00 (14.81) 0.00 (0.00) 135.00 (100.00)
Total 45.82 (62.65) 2.12 (2.90) 9.80 (13.40) 15.40 (21.06) 0.00 (0.00) 73.14 (100.00)
Coriander
Marginal NA NA NA NA NA NA NA NA NA NA NA NA
Small 15.57 (100.00) 0.00 (0.00) 0.00 (0.00) 0.00 (0.00) 0.00 (0.00) 15.57 (100.00)
Medium 19.58 (96.12) 0.00 (0.00) 0.00 (0.00) 0.79 (3.88) 0.00 (0.00) 20.37 (100.00)
Large 33.21 (100.00) 0.00 (0.00) 0.00 (0.00) 0.00 (0.00) 0.00 (0.00) 33.21 (100.00)
Total 25.56 (98.84) 0.00 (0.00) 0.00 (0.00) 0.30 (1.16) 0.00 (0.00) 25.86 (100.00)
Mango
Marginal 0.00 (0.00) 0.00 (0.00) 0.00 (0.00) 0.00 (0.00) 0.00 (0.00) 0.00 (0.00)
Small 0.00 (0.00) 0.00 (0.00) 0.00 (0.00) 0.00 (0.00) 0.00 (0.00) 0.00 (0.00)
Medium 0.00 (0.00) 0.00 (0.00) 14.83 (82.60) 3.13 (17.40) 0.00 (0.00) 17.96 (100.00)
Large 0.00 (0.00) 0.00 (0.00) 0.00 (0.00) 100.00 (100.00) 0.00 (0.00) 100.00 (100.00)
Total 0.00 (0.00) 0.00 (0.00) 3.56 (19.44) 14.75 (80.56) 0.00 (0.00) 18.31 (100.00)
Source: Primary Survey
Note: Figures in parentheses are the percentage of total output of respective crops sold.
In the case of coriander, a total amount of 25.86 quintals/HH was marketed through
various channels out of which as high as 98.84 per cent was sold in the wholesale
market. Remaining 1.16 per cent of total coriander output was sold on pre-arranged
contract. Among various farmer categories, the large farmers sold highest amount of
output of 33.21 quintals per HH and this entire output was sold in the wholesale
market. The medium farmers sold 20.37 quintals of coriander per HH, out of which
96.12 per cent was sold in the wholesale market and remaining 3.88 per cent was sold
through pre arranged contract. The small farmers sold 15.57 quintals of coriander per
HH and this entire amount of output was sold in the wholesale market. The marginal
farmers did not cultivate coriander crop.
Mango crop was mostly planted under the NHM programme among our selected
households and thereby most of the plantations were still in the gestation period at the
time of survey in Rajasthan. On average, about 18.31 quintals of mango per HH were
marketed through various channels out of which 80.56 per cent was sold on pre-
arranged contract and 19.44 per cent was sold through intermediaries at the farm gate.
Among various farmer categories, the large farmers sold highest amount of output of
100 quintals per HH and this entire amount of output was sold on pre-arranged
contract. Medium farmers sold 17.96 quintals per HH out of which 17.4 per cent was
sold on pre-arranged contract and 82.6 per cent was sold through intermediaries at the
farm gate. Marginal and small farmers did not sell any quantity because most of their
mango crop was still in gestation period therefore they did not market any production
during the reference year 2008-09.
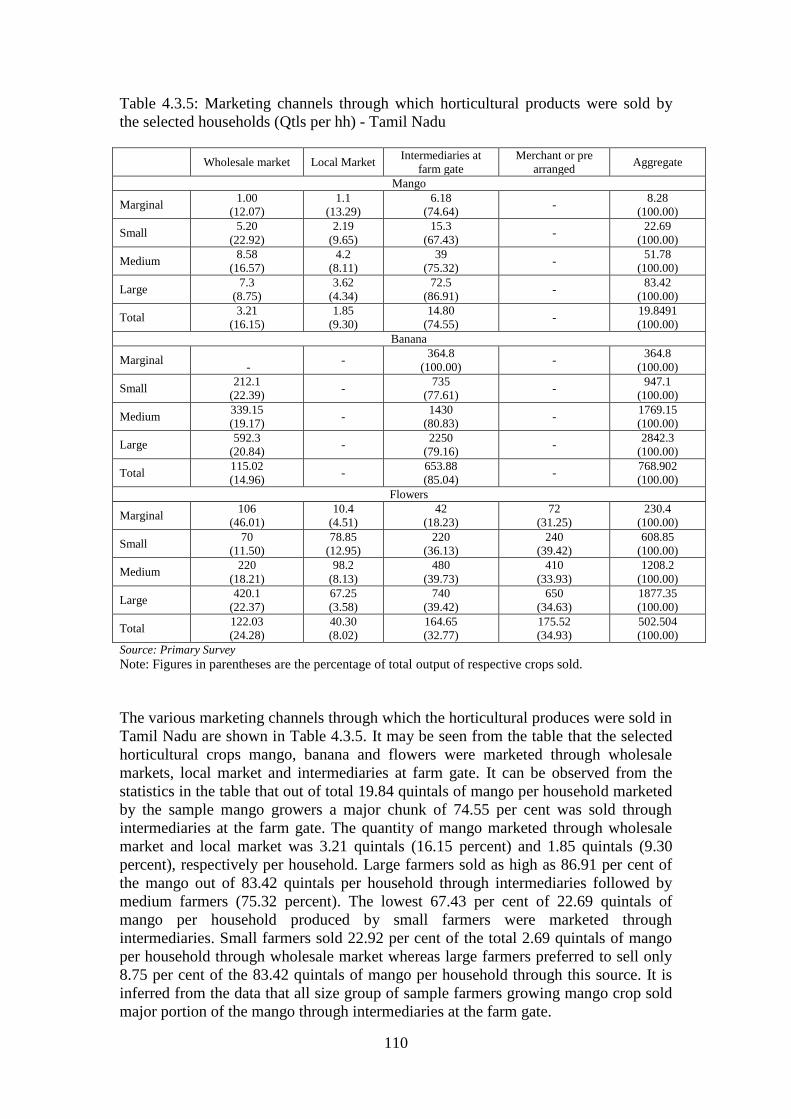
110
Table 4.3.5: Marketing channels through which horticultural products were sold by
the selected households (Qtls per hh) - Tamil Nadu
Wholesale market Local Market
Intermediaries at
farm gate
Merchant or pre
arranged Aggregate
Mango
Marginal 1.00
(12.07)
1.1
(13.29)
6.18
(74.64) -
8.28
(100.00)
Small 5.20
(22.92)
2.19
(9.65)
15.3
(67.43) -
22.69
(100.00)
Medium 8.58
(16.57)
4.2
(8.11)
39
(75.32) -
51.78
(100.00)
Large 7.3
(8.75)
3.62
(4.34)
72.5
(86.91) -
83.42
(100.00)
Total 3.21
(16.15)
1.85
(9.30)
14.80
(74.55) -
19.8491
(100.00)
Banana
Marginal -
- 364.8
(100.00) -
364.8
(100.00)
Small 212.1
(22.39) -
735
(77.61) -
947.1
(100.00)
Medium 339.15
(19.17) -
1430
(80.83) -
1769.15
(100.00)
Large 592.3
(20.84) -
2250
(79.16) -
2842.3
(100.00)
Total 115.02
(14.96) -
653.88
(85.04) -
768.902
(100.00)
Flowers
Marginal 106
(46.01)
10.4
(4.51)
42
(18.23)
72
(31.25)
230.4
(100.00)
Small 70
(11.50)
78.85
(12.95)
220
(36.13)
240
(39.42)
608.85
(100.00)
Medium 220
(18.21)
98.2
(8.13)
480
(39.73)
410
(33.93)
1208.2
(100.00)
Large 420.1
(22.37)
67.25
(3.58)
740
(39.42)
650
(34.63)
1877.35
(100.00)
Total 122.03
(24.28)
40.30
(8.02)
164.65
(32.77)
175.52
(34.93)
502.504
(100.00)
Source: Primary Survey
Note: Figures in parentheses are the percentage of total output of respective crops sold.
The various marketing channels through which the horticultural produces were sold in
Tamil Nadu are shown in Table 4.3.5. It may be seen from the table that the selected
horticultural crops mango, banana and flowers were marketed through wholesale
markets, local market and intermediaries at farm gate. It can be observed from the
statistics in the table that out of total 19.84 quintals of mango per household marketed
by the sample mango growers a major chunk of 74.55 per cent was sold through
intermediaries at the farm gate. The quantity of mango marketed through wholesale
market and local market was 3.21 quintals (16.15 percent) and 1.85 quintals (9.30
percent), respectively per household. Large farmers sold as high as 86.91 per cent of
the mango out of 83.42 quintals per household through intermediaries followed by
medium farmers (75.32 percent). The lowest 67.43 per cent of 22.69 quintals of
mango per household produced by small farmers were marketed through
intermediaries. Small farmers sold 22.92 per cent of the total 2.69 quintals of mango
per household through wholesale market whereas large farmers preferred to sell only
8.75 per cent of the 83.42 quintals of mango per household through this source. It is
inferred from the data that all size group of sample farmers growing mango crop sold
major portion of the mango through intermediaries at the farm gate.

111
As could be seen from Table 4.3.5 that banana cultivated by the sample respondents
was sold through two sources only namely, wholesale market and intermediaries at
the farm gate. Out of the total quantity of 768.90 quintals of banana per household,
85.04 per cent of the produce was sold through intermediaries. It is interesting to note
that the marginal farmers sold the entire quantity through intermediaries as they didn’t
want to take the strain of harvesting and transporting the produce to the market.
Among the other three categories of farmers, medium size group of farmers sold over
80 per cent of the 1769.15 quintals of banana per household through intermediaries
followed by marginal farmers. Small farmers preferred to market 22.39 per cent of the
947.1 quintals of banana per household through wholesale market whereas medium
and large farmers sold 19.17 per cent and 20.84 per cent of the produce through
wholesale market, respectively.
Sample households who cultivated flowers, marketed their output through wholesale
market, local market, intermediaries and through merchants. Out of the total quantity
of 502.50 quintals produced per household, 34.93 per cent and 32.77 per cent of the
produces were sold through merchant and intermediaries, respectively. Over 24 per
cent of the flowers harvested were sold through wholesale market. Marginal farmers
sold maximum quantity of 46.01 per cent of the 230.40 quintals of flower per
household through wholesale market whereas small farmers sold a maximum of 39.42
per cent of the 608.85 quintals per household through merchants. Medium farmers
sold maximum 39.73 per cent of the 1208.2 quintals per household through
intermediaries. Large farmer preferred to sell maximum quantity of 39.42 per cent of
1870.35 quintals per household through intermediaries.
The common feature observed from the above analysis is that of the different
marketing channels, intermediaries played a key role in marketing the production of
all the three selected crops mango, banana and flowers in the sample area which
shows the ineffective marketing system existing in the marketing of agricultural
commodities in the state.
In West Bengal, the horticultural crops grown by the sample households were
pineapple and mandarin oranges which are perishable in nature. In the study region
the variety of pineapple and mandarin oranges cultivated were more suitable for
consumption in raw instead of preserving the same in cans. The details of marketing
channels through which these crops were disposed of by the selected households is
given in Table 4.3.6. The pineapple produced by the sample farmers were marketed
through different marketing channels that varied greatly across the size-classes. In
fact, a major part of output produced by the marginal farmers was channelled to the
intermediaries at the farm gate, which acts as the predominant marketing channel for
the marginal farmers. On the other hand, a major part of the output produced by the
large farmers was marketed to the wholesale market of the nearest town. This in turn
reflects that while the large farmers are able to sell their output directly to the
wholesale market (and perceivably obtain relatively higher price of output), the small
farmers, on the other hand, are often compelled to sell their output at the farm-gate to
the intermediaries. On the whole, the share of output sold at the wholesale market
stood at about 55 percent, while that for intermediaries and local markets stood at 28
percent and 16.5 percent, respectively. Only less than one percent of the output was
sold to the village directly by the farmers. Government agencies or the cooperative
agencies did not play any role in marketing of output in the study region.
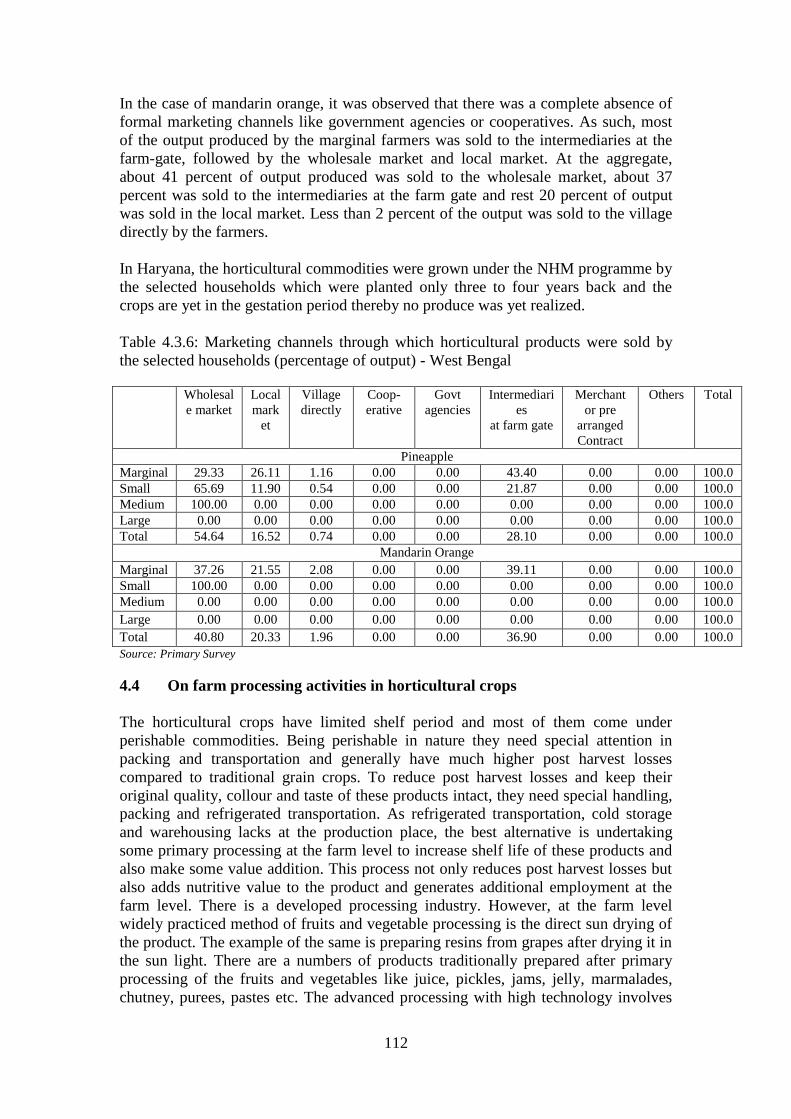
112
In the case of mandarin orange, it was observed that there was a complete absence of
formal marketing channels like government agencies or cooperatives. As such, most
of the output produced by the marginal farmers was sold to the intermediaries at the
farm-gate, followed by the wholesale market and local market. At the aggregate,
about 41 percent of output produced was sold to the wholesale market, about 37
percent was sold to the intermediaries at the farm gate and rest 20 percent of output
was sold in the local market. Less than 2 percent of the output was sold to the village
directly by the farmers.
In Haryana, the horticultural commodities were grown under the NHM programme by
the selected households which were planted only three to four years back and the
crops are yet in the gestation period thereby no produce was yet realized.
Table 4.3.6: Marketing channels through which horticultural products were sold by
the selected households (percentage of output) - West Bengal
Wholesal
e market
Local
mark
et
Village
directly
Coop-
erative
Govt
agencies
Intermediari
es
at farm gate
Merchant
or pre
arranged
Contract
Others Total
Pineapple
Marginal 29.33 26.11 1.16 0.00 0.00 43.40 0.00 0.00 100.0
Small 65.69 11.90 0.54 0.00 0.00 21.87 0.00 0.00 100.0
Medium 100.00 0.00 0.00 0.00 0.00 0.00 0.00 0.00 100.0
Large 0.00 0.00 0.00 0.00 0.00 0.00 0.00 0.00 100.0
Total 54.64 16.52 0.74 0.00 0.00 28.10 0.00 0.00 100.0
Mandarin Orange
Marginal 37.26 21.55 2.08 0.00 0.00 39.11 0.00 0.00 100.0
Small 100.00 0.00 0.00 0.00 0.00 0.00 0.00 0.00 100.0
Medium 0.00 0.00 0.00 0.00 0.00 0.00 0.00 0.00 100.0
Large 0.00 0.00 0.00 0.00 0.00 0.00 0.00 0.00 100.0
Total 40.80 20.33 1.96 0.00 0.00 36.90 0.00 0.00 100.0
Source: Primary Survey
4.4 On farm processing activities in horticultural crops
The horticultural crops have limited shelf period and most of them come under
perishable commodities. Being perishable in nature they need special attention in
packing and transportation and generally have much higher post harvest losses
compared to traditional grain crops. To reduce post harvest losses and keep their
original quality, collour and taste of these products intact, they need special handling,
packing and refrigerated transportation. As refrigerated transportation, cold storage
and warehousing lacks at the production place, the best alternative is undertaking
some primary processing at the farm level to increase shelf life of these products and
also make some value addition. This process not only reduces post harvest losses but
also adds nutritive value to the product and generates additional employment at the
farm level. There is a developed processing industry. However, at the farm level
widely practiced method of fruits and vegetable processing is the direct sun drying of
the product. The example of the same is preparing resins from grapes after drying it in
the sun light. There are a numbers of products traditionally prepared after primary
processing of the fruits and vegetables like juice, pickles, jams, jelly, marmalades,
chutney, purees, pastes etc. The advanced processing with high technology involves
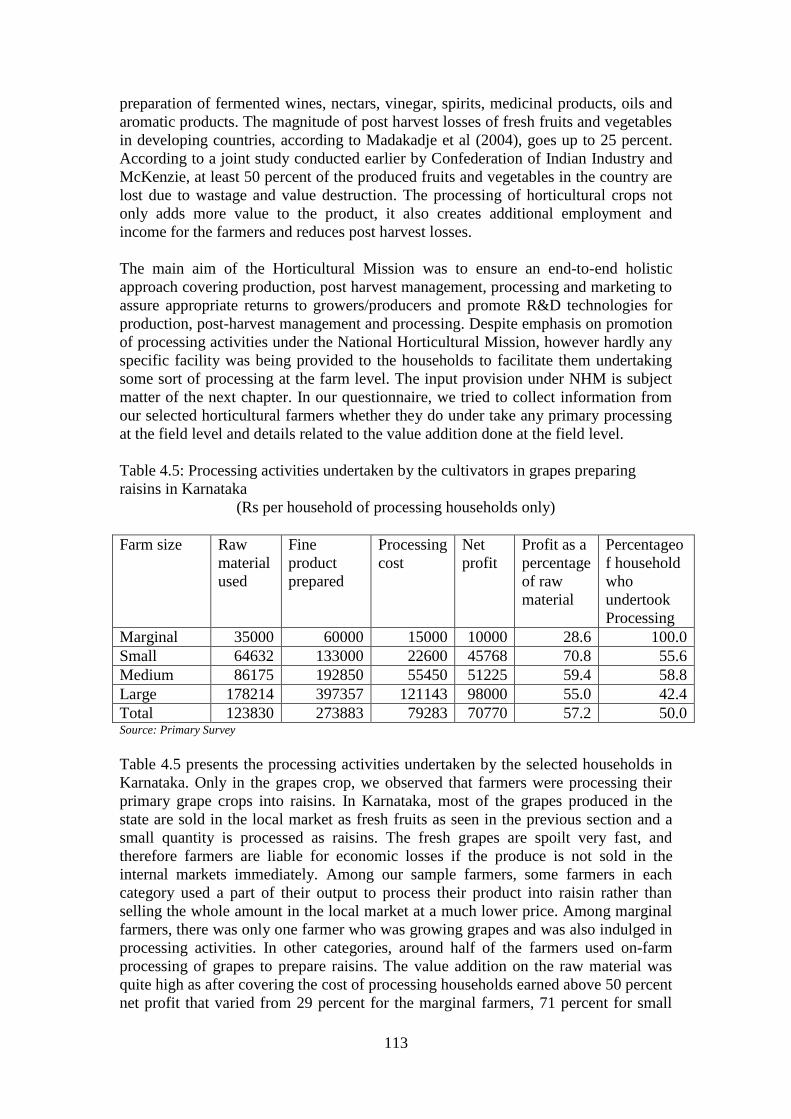
113
preparation of fermented wines, nectars, vinegar, spirits, medicinal products, oils and
aromatic products. The magnitude of post harvest losses of fresh fruits and vegetables
in developing countries, according to Madakadje et al (2004), goes up to 25 percent.
According to a joint study conducted earlier by Confederation of Indian Industry and
McKenzie, at least 50 percent of the produced fruits and vegetables in the country are
lost due to wastage and value destruction. The processing of horticultural crops not
only adds more value to the product, it also creates additional employment and
income for the farmers and reduces post harvest losses.
The main aim of the Horticultural Mission was to ensure an end-to-end holistic
approach covering production, post harvest management, processing and marketing to
assure appropriate returns to growers/producers and promote R&D technologies for
production, post-harvest management and processing. Despite emphasis on promotion
of processing activities under the National Horticultural Mission, however hardly any
specific facility was being provided to the households to facilitate them undertaking
some sort of processing at the farm level. The input provision under NHM is subject
matter of the next chapter. In our questionnaire, we tried to collect information from
our selected horticultural farmers whether they do under take any primary processing
at the field level and details related to the value addition done at the field level.
Table 4.5: Processing activities undertaken by the cultivators in grapes preparing
raisins in Karnataka
(Rs per household of processing households only)
Farm size Raw
material
used
Fine
product
prepared
Processing
cost
Net
profit
Profit as a
percentage
of raw
material
Percentageo
f household
who
undertook
Processing
Marginal 35000 60000 15000 10000 28.6 100.0
Small 64632 133000 22600 45768 70.8 55.6
Medium 86175 192850 55450 51225 59.4 58.8
Large 178214 397357 121143 98000 55.0 42.4
Total 123830 273883 79283 70770 57.2 50.0 Source: Primary Survey
Table 4.5 presents the processing activities undertaken by the selected households in
Karnataka. Only in the grapes crop, we observed that farmers were processing their
primary grape crops into raisins. In Karnataka, most of the grapes produced in the
state are sold in the local market as fresh fruits as seen in the previous section and a
small quantity is processed as raisins. The fresh grapes are spoilt very fast, and
therefore farmers are liable for economic losses if the produce is not sold in the
internal markets immediately. Among our sample farmers, some farmers in each
category used a part of their output to process their product into raisin rather than
selling the whole amount in the local market at a much lower price. Among marginal
farmers, there was only one farmer who was growing grapes and was also indulged in
processing activities. In other categories, around half of the farmers used on-farm
processing of grapes to prepare raisins. The value addition on the raw material was
quite high as after covering the cost of processing households earned above 50 percent
net profit that varied from 29 percent for the marginal farmers, 71 percent for small
114
farmers, 59 percent for medium farmers and 55 percent for the large farmers. Thus, it
appears that farmers are ready for taking up available opportunities for adding value
to their product on the farm. As it was easy to take such activities in the case of grapes
there was overwhelming response from the farmers. The same was not the case with
other selected crops, namely pomegranate, flowers and medicinal crops for which
simple sun-dry was not sufficient and it required large investment for undertaking
primary processing. Thereby, farmers were selling their product in the raw form
mostly in the local market.
4.5 Summary of the chapter
Per acre net profits (over total cost) of grapes was measured at 26 thousand in
Karnataka. The net profit from pomegranate was measured at 13.5 thousand per
acre. The realized profit of floriculture crops in Karnataka averaged at 15.7
thousand whereby only large and marginal farmers had positive profit amounting to
27 thousand and 17.7 thousand, respectively while small and medium farmers
incurred losses amounting to 5 thousand and 3 thousand, respectively. The net
profit over variable cost of medicinal and aromatic crops averaged at 11 thousand
and net profit over total cost averaged at 4.6 thousand. In Andhra Pradesh both the
crops namely mango and sweet orange were in the gestation period and therefore
there was no revenue or income earned in the cultivation of the these two crops. In the
case of mango in Bihar, net returns (after subtracting fixed and variable cost) were
measured at 23247 per acre. In contrast to mango cultivation, the net return per acre
from litchi cultivation turned out to 9999. In Rajasthan, on average, about 5277
was the net loss per acre of aonla mainly due to crop being in gestation period as
majority of our sample farmers had undertaken new plantation during the last three to
four years. The per-acre net return from coriander was, on an average, 5434. Like
the case of aonla, mango also did not reach fruit bearing stage, and therefore, the
output and net returns were negligible. In Tamil Nadu, our analysis was restricted to
three crops namely banana, mango and flowers. The average revenue earned by a
farmer from the cultivation of an acre of banana was to the tune of 155833. The net
returns earned by a sample farmer by cultivating mango were to the tune of 2740
per acre. Net returns obtained by a sample household from the cultivation of flower
crop in Tamil Nadu was 81218 per acre. In the case of economics of pineapple
production in West Bengal, net returns turned out to 25406. Net return per acre from
mandarin orange cultivation turned out to 8189. The net returns from kinnow
cultivation in Haryana were 14327 per acre at the aggregate. Farmers reaped
28339 per acre from guava during 2008-09. In the case of garlic, net return per acre
was computed as 40612 at the aggregate level.
One of the objectives of NHM was to create opportunities for employment generation
for skilled and unskilled persons, especially unemployed youth in the villages. In
Karnataka, horticultural crops had advantage over traditional food crops not only in
terms of higher productivity, value addition and net profitability but they also
provided better employment to the households in comparison to all other crops grown
on the field. There was possibility of further value addition and more employment
generation in case farmers preferred to undertake some processing of the horticultural
crops at the field level. In Andhra Pradesh, among horticultural crops vegetable crop
namely chilies employed more labour than tomato and onion crop. In the case of
selected crops in the state, mango and sweet orange reported the same amount of

115
labour employed for cultivation. In Bihar, the requirement of human labour in mango
and litchi crops were 64 and 59, that were comparatively two to three times more than
that in maize, wheat, lentil and gram crops. It was one-and-a-half times that of paddy.
In Rajasthan horticultural crops were more labour intensive compared to non-
horticultural crops as average man-days required for an acre of horticultural crops was
higher than that of non-horticultural crops. In Tamil Nadu, the man days used for all
the kharif crops by the sample households on an average worked out to 20.76 per acre.
For horticultural crops, the sample farmers used 27.57 man days on average per acre.
In West Bengal, total man days employed varied between 74 in paddy to 80 in millet
and maize, 65 in chilies, 54 in ginger, 48 in potato and 89 in turmeric, 139 in
pineapple. In Haryana among traditional crops, cotton, flowers and moong generated
around 20 days of employment while average use of labour in horticultural crops was
around 29 man days per acre.
After harvesting and packing where do farmers market their produce is of interest. In
the case of grapes in Karnataka, whole sale market, local market in the nearby town
and intermediaries at the farm gate level were used by the selected farmers to dispose
of their produce. Similar to grapes, marketed surplus of pomegranates was sold
through government agency and through some sort of cooperative marketing. and pre
arranged contract with the merchants. Half of the produce of flowers was sold though
wholesale market and rest of the half was sold in local market, through government
agency and through merchants and pre arranged contracts. Aromatic and medicinal
crops were sold through merchants, intermediaries at the farm gate level and through
wholesale markets.
There was absence of regulated markets for fruits and vegetables in the selected
districts in Andhra Pradesh. The sample farmers marketed vegetable crops namely
onion, tomato and chilies through local municipal marketing authorities and Rythu
Bazars and whole sale markets. In Bihar, mango output was marketed through
intermediaries at the farm gate, merchant/traders through pre-arranged contracts and
directly to the consumers at village and wholesale markets. Litchi was also mostly
sold to merchant/traders on pre-arranged contracts. In Rajasthan, aonla, papaya,
coriander and mango were sold through wholesale market, pre arranged contracts and
through intermediaries. The selected horticultural crops namely mango, banana and
flowers in Tamol Nadu were marketed through wholesale markets, local market and
intermediaries at farm gate. The pineapple and orange produced by the sample
farmers in West Bengal were marketed through intermediaries at the farm gate,
wholesale market and local market. In Haryana, the horticultural commodities were
yet in the gestation period. Horticultural crops were mostly sold without indulging
into any processing except the case of grapes in Bangalore where few farmers were
found undertaking some processing at the field level.
116
ANNEXURE - 4.1
The Cost of Production of Perennial Crops
The cost of production of perennial crops differs from that of annual crops by
manifolds. First, in case of annual crops there is none or very little gestation period
between the initial investment in terms of plantation of crop and receiving the final
output. In case of perennial (plantation) crops, however, the gestation period varies
from 3-4 years to 8-10 years. The cultivators are subjected to a huge investment and a
long waiting period before they get their first output on the planted crops. Second,
unlike annual crops, which yield only for one period and have to be replanted again,
there is an extended period of output flow in the case of plantation crops. Third,
productivity of plantation crops may vary according to the age of the trees (in their
youth, maturity and old age periods) whereas productivity of annual crops may remain
constant (or a gradual increase) over a period of time.
Due to the gestation period in the beginning and extended output flows in the later
periods in plantation crops, the method of estimating cost of production as applicable
in annual crops cannot be applied on the plantation crops. Precise estimation of cost of
cultivation in plantation crops therefore necessitates availability of information on
price and quantity of inputs and output of these crops for their entire life period. It is
very difficult to get such information from the planters of these crops who hardly
maintain account for such a long period of time.
However, to examine the cost and returns of perennial crops in India mostly
homogeneous costs and returns are assumed for different age periods of plants
(Chand, 1994). Samples are drawn for different age groups/periods of trees3. From
such a sample the quantity and value of inputs and outputs are obtained for each age
group by dividing the total life of the perennial crops in homogenous periods. In this
way estimated returns and cost over life time of the plants are mixture of production
and cost of different plants of various age groups. We have used the same
methodology in our calculation of cost of production.
We could gather the data related to inputs used and their paid out price and output
produced by the planters during the current year (2009-10 prices) or at the most few
years back. In addition, we could also get the cost estimates for the initial plantation
as well as the amount spent during the gestation period of the plants. As our sample
for the perennial crops namely, grapes, pomegranates, flowers and medicinal plants
consisted of different age periods ranging from one year to the last year of the life of
the plant, we could compile the data on cost and returns for different age groups of
plants from the given data for the current year itself.
Since variable cost estimates were given by the planter at current prices, thereby these
cost estimates for different size groups refer to the simple average of expenditure
given by different planters in the respective size classes. Thus our estimates for the
variable cost for different size groups are average amount spent during the current
3 See for example Gupta and George (1974), Subrahmanyam and Mohandoss (1982), Misra (1992),
Sarma (1996) .

117
year by the planters in the respective size groups on labour used, manure and
fertilizer, pesticides and insecticides, irrigation, repair and maintenance etc. The
variable cost includes interest on working capital, which is one-year payment on the
amount borrowed by planters during the current or previous years. The variable cost
also includes depreciation, which is calculated over the value of all the fixed assets of
the planters using a discount rate of 10 percent.
As discussed above, the plantation crops differ from annual crops in terms of their
long gestation period between the initial investment and first output. Therefore
cultivators of plantation crops are subject to a fixed cost, comprising the plantation
cost plus the cost incurred during the gestation period. The plantation cost includes
initial land preparation cost, cost of digging pits, lining, cost of plants or nursery,
refilling with top soil, planting and other miscellaneous charges. The cost incurred
during the gestation period includes expenses on inter-culture, manure and fertilizers,
insecticides, weeding, irrigation, mulching, shading and other miscellaneous charges.
The case of fixed cost is different from that of variable cost. Fixed cost is incurred in
the initial years of plantation till the plants start yielding whereas the variable cost is
subject to every year expenses after the plant starts yielding. Therefore it becomes
necessary to apportion the fixed cost over the life span of the plant to get the estimates
of total cost incurred on a particular plant during a year. For apportioning the fixed
cost we have assumed the optimum life period for grapes 15 years, pomegranate 30
years, flowers 10 years and medicinal and aromatic crops 5 years. The discount rate
used is the same as used for depreciation, i.e., 10 percent. The following annual
amortization method4 is used for calculating annual value of fixed cost:-
i
P = B ---------------------
1 - (1 + i) - n
Where P = is the amount of annual payment
B = is the initial amount
n = is number of years (life period of plantation)
i = is the interest or discount rate (10 per cent in the present case)
It is to mention here that the estimates for fixed cost were given by the planters at the
current prices irrespective of the age of the plant. Therefore the given amount of fixed
cost was amortized over the life period of plant to get per annum cost for this one time
expenditure.
4 Subrahmanyam and Mohandoss (1982)

118
Chapter 5
Impact of NHM on the Expansion of Horticultural Crops
Government of India launched the National Horticulture Mission (NHM) during the 10th plan,
with effect from 2005-06. The thrust of the Mission is area-based, regionally differentiated
cluster approach for development of horticulture crops, having comparative advantage. This is
a Centrally Sponsored Scheme in which Government of India provided 100 per cent
assistance to the State Missions during 10th
Plan. During the 11th
Plan, the assistance from the
Union Government was 85 per cent with 15 per cent contribution by the state government.
Across the total budget expenditure on agriculture and allied activities, nearly 3 per cent of the
expenditure had been incurred on this programme. For implementation of the NHM
programme in 18 States, an amount of 630 crore was provided during 2005-06, 1,000
crore during 2006-07, 1150 crore during 2007-08 and 1100 crore during 2008-09.
Presently, the Scheme is being implemented in 18 States and 2 UTs covering 344 districts of
the country for the development of potential crops. In order to see the working of NHM at the
ground level, in terms of area and yield expansion at the household level and distribution of
stipulated subsidies and various tools and implements among the households growing
horticultural crops, a household survey was carried out among a selected number of
households growing various horticultural crops. This chapter analyses the impact of National
Horticulture Mission at the household level in the selected states.
5.1 Impact of National Horticulture Mission
In India, policy makers realized the potential of horticultural sector to diversify agriculture,
efficient land use, optimum utilization of natural resources and creating employment
opportunities for rural masses during the 1980s. As a result, planned investment for
horticultural development increased significantly in the country. The fund allocation for
horticultural sector increased from 24.2 crore in the Seventh Five Year Plan to Rs. 1453 crore
in the Ninth and to Rs. 5650 crore in the Tenth Five Year Plan. During the Tenth Five Year
Plan, centrally sponsored scheme on Technology Mission for Integrated development of
horticulture in the North Eastern region was implemented and continued during the Eleventh
Five Year Plan. This scheme was further extended to Jammu and Kashmir, Himachal Pradesh
and Uttrakhand. The main objective of this Mission was to provide full support for
horticultural development in these states.
During this millennium, problems and constraints of unexploited potential of horticultural
sector in the country were pointed out and therefore, National Horticulture Mission was
launched during 2005-06 covering research, production, post harvest management, processing
and marketing of horticultural crops. The Mission envisaged two fold increase in horticulture
production by 2011-12 reaching to 300 million tonnes with a growth rate of 6 per cent per
annum. Under the Mission, eight North Eastern states, Jammu and Kashmir, Himachal
Pradesh Uttrakhand are not covered since these states are receiving benefits under the
Technology Mission for Integrated Development of Horticulture. The NHM aims to promote
holistic growth of horticultural sector through area specific strategies to enhance production,
nutritional security and to provide income support to farm households.

119
5.1.1 Impact of NHM on area and yield of horticultural crops in Karnataka
In Chapter 2, it was seen that after implementation of NHM in Karnataka, the programme had
overall positive impact on the horticultural crops as area growth increased from 0.8 per cent
per annum during the before NHM period of 2000-2004 to 2.7 per cent per annum during the
post NHM period of 2004-2008. Similarly, yield growth rate that was negative during the
before NHM period (-4.1 per cent per annum), observed a very high growth rate of 6.5 per
cent per annum during the post NHM period. The above trends were observed in the historical
data of area and yield for the whole of Karnataka. In this section, we try to validate the above
trends observed at the state level with the ground level information collected through our field
survey. In our questionnaire, we collected information about the area sown and yield rate of
our selected horticultural crops for the baseline year 2004-05 and the following years up to
2008-09. Thus, we collected information on area sown, output produced in quantity and value
terms and area/productivity expansion via rejuvenation/protection through NHM resource
provision for consecutive five years, i.e., 2004-05, 2005-06, 2006-07, 2007-08 and 2008-09.
The results need to be interpreted with caution as farmers hardly keep written records and the
replies were mostly based on memory.
Table 5.1.1a: Impact of NHM on area and yield of selected farmers in Karnataka
Year Area cultivated in acres per household Yield rate obtained quintals per acre
Marginal Small Medium Large Total Marginal Small Medium Large Total
Grapes
2004-05 0.03 0.06 0.85 1.32 0.51 20.00 35.00 45.49 44.29 43.83
2005-06 0.03 0.10 1.09 1.69 0.66 30.00 46.67 50.69 46.17 47.20
2006-07 0.03 0.10 1.26 1.82 0.72 40.00 47.50 50.16 48.56 48.87
2007-08 0.03 0.15 1.35 2.04 0.80 35.00 31.11 45.49 50.94 48.19
2008-09 0.03 0.30 1.58 2.60 1.03 50.00 50.93 51.04 57.65 55.34
GR from 2004-
05 to 2008-09
(0.0) (54.2) (17.0) (18.8) (19.6) (28.4) (16.1) (3.3) (6.9) (6.2)
Pomegranate
2004-05 0.07 0.25 0.70 0.93 0.45 7.00 9.81 21.81 4.72 10.04
2005-06 0.09 0.18 0.69 0.78 0.40 11.00 19.46 40.54 4.08 17.08
2006-07 0.08 0.31 0.94 0.87 0.49 24.78 30.73 46.00 9.92 25.71
2007-08 0.10 0.39 0.91 1.20 0.60 14.50 16.75 61.41 8.58 23.49
2008-09 0.07 0.46 1.15 1.05 0.62 29.50 11.63 21.69 12.81 15.79
GR from 2004-
05 to 2008-09
(3.1) (22.0) (14.5) (5.2) (9.3) (61.1) (20.1) (17.0) (41.3) (19.8)
Flower
2004-05 0.11 0.11 0.06 - 0.07 6.33 5.55 34.67 - 10.18
2005-06 0.14 0.11 0.09 0.03 0.09 9.15 5.32 17.33 128.00 19.75
2006-07 0.21 0.15 0.09 0.35 0.21 13.73 5.34 17.85 22.85 16.29
2007-08 0.27 0.16 0.11 0.38 0.24 11.54 8.22 29.07 23.26 17.06
2008-09 0.42 0.33 0.12 0.38 0.33 12.90 11.21 28.24 27.24 17.65
GR from 2004-
05 to 2008-09
(40.3) (37.3) (20.3) (358.4) (53.4) (22.6) (21.6) (3.2) -(21.1) (21.2)
Aromatic and Medicinal Plants
2004-05 0.08 0.16 0.19 0.14 0.13 34.00 45.76 14.00 57.33 39.60
2005-06 0.06 0.19 0.21 0.15 0.15 44.29 48.19 5.20 57.65 40.00
2006-07 0.07 0.27 0.19 0.15 0.17 36.94 36.58 22.00 54.12 38.12
2007-08 0.14 0.31 0.19 0.10 0.19 44.83 39.68 23.08 50.91 39.59
2008-09 0.25 0.45 0.40 0.18 0.32 44.24 54.98 49.14 69.00 53.47
GR from 2004-
05 to 2008-09
(42.6) (30.2) (27.9) (13.5) (27.2) (8.4) (7.1) (94.5) (6.0) (8.8)
Source: Primary Survey

120
Table 5.1.1b: Impact of NHM on value of productivity ( per acre at reference year price)
Year Value of productivity ( per acre
at reference year price)
Input quantity obtained through NHM
(acre per household)
Margin
al
Small Medium Large Total Margin
al
Small Medium Large Total
Grapes
2004-05 16000 46500 62578 52215 54173 0.03 0.02 0.40 0.69 0.26
2005-06 30000 55167 78003 69914 70922 0.00 0.03 0.17 0.43 0.15
2006-07 60000 57167 70833 76699 74010 0.00 0.00 0.23 0.38 0.14
2007-08 31500 40333 67130 79519 73455 0.00 0.03 0.29 0.41 0.16
2008-09 65000 85305 79902 98317 92261 0.00 0.18 0.57 0.88 0.37
GR from 04-
05 to 08-09
(61.6) (26.1) (7.3) (17.7) (15.0) - - - - -
Pomegranate
2004-05 12000 10929 38950 4902 14933 0.05 0.11 0.53 0.04 0.14
2005-06 14545 30268 95021 22512 43878 0.03 0.00 0.00 0.00 0.01
2006-07 37111 29021 80153 61925 60463 0.03 0.07 0.07 0.02 0.04
2007-08 28000 20124 41404 42598 37375 0.03 0.08 0.00 0.16 0.07
2008-09 62000 18251 28247 55988 39356 0.01 0.07 0.36 0.29 0.16
GR from 04-
05 to 08-09
(68.3) (33.2) (12.0) (133.6) (49.7) - - - - -
Flower
2004-05 33017 27966 33778 - 30895 0.03 0.04 0.03 0.00 0.02
2005-06 39034 11832 43000 208457 45461 0.00 0.00 0.00 0.02 0.00
2006-07 35276 16739 48308 42605 35598 0.02 0.04 0.00 0.00 0.02
2007-08 47079 27995 65600 41133 42212 0.21 0.02 0.03 0.29 0.15
2008-09 50302 28530 55882 53405 45292 0.19 0.14 0.00 0.00 0.09
GR from 04-
05 to 08-09
(12.2) (13.2) (15.2) -(17.7) (12.8) - - - - -
Aromatic and Medicinal Plants
2004-05 17474 13599 6877 16667 13519 0.03 0.08 0.00 0.00 0.03
2005-06 18857 16461 9227 15588 14754 0.02 0.02 0.00 0.00 0.01
2006-07 25647 21208 10815 18235 19166 0.04 0.07 0.00 0.00 0.03
2007-08 23746 25671 10431 20545 22023 0.07 0.16 0.09 0.00 0.08
2008-09 29546 31979 24191 22670 28429 0.17 0.29 0.27 0.10 0.20
GR from 04-
05 to 08-09
(15.2) (23.9) (44.9) (8.4) (20.8) - - - - -
Source: Primary Survey
Table 5.1.1 presents net sown area under grapes, pomegranate, flower and medicinal and
aromatic crops and yield rate obtained by the selected farmers from the year 2004-05 up to
2008-09. As all the four crops fall in the category of perennial crops, year to year fluctuations
in the sown area at the farm level that are common in the field crops generally do not happen
in perennial crop. In the latter case, once planted, these crops have some gestation period and
they bear fruit for longer period and thereby it is not economical for farmers to uproot such
crops annually unless the plants have grown older and loose efficiency in the yield level. This
is also visible from the data presented in the table which shows that in all the four crops there
is continuous increase in area under these crops and hardly any decline is visible.
The area under grapes increased from 0.51 acres per household in the year 2004-05 to 1.03
acres in the year 2008-09. Area under pomegranate increased from 0.45 acres per household
in 2004-05 to 0.62 acres per household in 2008-09. The area under flower increased from 0.07
acres per household to 0.33 acres per household and aromatic crops increased from 0.13 acres
to 0.32 acres per household for the same time period. Area under these four crops increased
121
among all farm size holdings. On average, area under grapes increased by 20 per cent per
annum among the selected households during the last four years of implementation of NHM.
Area increase in pomegranate was 9 per cent per annum while flower and medicinal crops
area increased at 53 and 27 per cent per annum during the same time period.
Compared to constant increase in area, there were wide fluctuations in the yield rate of all the
four selected crops as revealed by Table 5.1.1. There were fluctuations in yield rate among all
farm size categories during the different years but on an average there was increasing trend in
overall yield rate of all the four crops. The average yield of grapes increased from 44 quintals
per acre in 2004-05 to 55 quintals in 2008-09 among the selected households. The rate of
growth in yield rate was around 6 per cent per annum from 2004-05 to 2008-09. The average
yield of pomegranate fluctuated from a low level of 10 quintals per acre in 2004-05 up to 26
quintals in 2006-07 and again came down to 16 quintals in 2008-09. The overall growth in
yield rate was impressive 20 per cent per annum because of extreme values of low and high
yield rate among different farmers across different years. The case of flowers was even more
complex as selected farmers were growing different varieties of flowers and clubbing them
together led to wider fluctuations in average productivity. Overall yield rate of flowers
increased from 10 quintals per acre in 2004-05 to 20 quintals in 2005-06 that came down to 18
quintals per acre in the next three years. Once again because of the low base year, overall
growth rate in the yield of flowers was above 20 per cent per annum. The yield of aromatic
and medicinal plants was more stable compared to pomegranate and flowers. Per acre yield
rate of medicinal crops hovered around 40 quintals per acre in all the four years, except in the
last year it increased to 53 quintals per acre thus recording a growth rate of 9 per cent per
annum from 2004-05 to 2008-09. Table 5.3 presents value of productivity at the reference
year prices for the same crops and time period. The growth in value of output is also in the
same direction as that of growth in yield rate in physical terms.
Thus, although area and yield growth rate in the selected crops appears impressive, however,
it would be naïveté to interpret the volume of growth shown by the table, primarily because
data collected from the farmers is based on their memory and therefore is amenable to
inaccuracy. One can consider with firmness only the direction rather than the volume depicted
by the above trends. The doubt on the high growth in yield also arises when one compares
increase in yield of selected crops from the secondary data (see Chapter 2). The latter supports
above trends only partly, although direction in area growth is validated fully by the secondary
data. Concluding the above analysis, NHM appears to have succeeded in raising area under
horticultural crops in the state but difficult to say with firmness whether it has the same effect
with respect to the yield level.
5.1.2 Impact of NHM on area and yield of horticultural crops in Andhra Pradesh
Table 5.1.2 presents area per household of mango and sweet orange orchards in selected
districts of the state during the period starting from the beginning of NHM up to the reference
period 2008-09. Per household mango area was reported as 0.32 acres during 2005-06 that
increased to 3.60 acres in 2008-09. There was consistent increase in are under mango after
beginning of the NHM. Per household cultivated area under mango increased among all group
of farmers after 2005-06 under NHM Scheme due to financial assistance as well as
infrastructure like supply of planting material etc., provided by the state government.
Similar to mango, area cultivated under sweet orange also increased tremendously during the
period of NHM scheme, i.e., from 2005-06 up to the reference period of 2008-09. At the
aggregate, per household area under sweet orange increased from 0.57 acres at the beginning

122
of 2005-06 to 2.61 acres during the reference year of 2008-09. Across the farm size groups,
per household area of sweet orange increased among all size classes. Most of the sample
farmers expressed the opinion that mango gardens were better than sweet orange because the
latter requires regular water supply and favourable climate conditions compared to the former
and the crop is more vulnerable to diseases as compared to mango. The surveyed farmers
could not provide details about yield of both the crops as area under both these crops was in
the period of gestation and no fruit was yet realized by the surveyed farmers. Therefore, it is
not possible to verify the secondary information as presented in chapter 2 with that of primary
household level information on yield level.
Table 5.1.2: Impact of NHM on area and yield of selected farmers in Andhra Pradesh
Year Area cultivated in acres per household Yield rate obtained quintals per acre*
Marginal Small Medium Large Total Marginal Small Medium Large Total
Crop - Mango
2004-05 NA NA NA NA NA NA NA NA NA NA
2005-06 0.26 0.34 0.32 0.60 0.32 NA NA NA NA NA
2006-07 0.79 2.03 1.52 2.90 1.58 NA NA NA NA NA
2007-08 1.31 3.37 2.81 5.41 2.76 NA NA NA NA NA
2008-09 1.55 4.31 3.71 7.38 3.60 NA NA NA NA NA
Crop - Sweet Orange
2005-06 0.50 0.70 0.42 0.63 0.57 NA NA NA NA NA
2006-07 0.73 1.12 0.85 1.19 0.99 NA NA NA NA NA
2007-08 0.73 1.74 2.38 2.50 1.96 NA NA NA NA NA
2008-09 1.65 2.46 2.89 3.11 2.61 NA NA NA NA NA
Source: Primary Survey Note: NA = Not available
5.1.3 Impact of NHM on area and yield of horticultural crops in Bihar
National Horticulture Mission (NHM) in Bihar was launched in 2006-07 to promote holistic
approach of the horticulture sector covering fruits, vegetable seed production, spices, aromatic
plants, betel-vine and flowers. As mentioned earlier this study covers two sample crops,
namely mango & litchi in two districts of Bihar. Table 5.1.3 presents a comparative analysis
of area and yield of mango and litchi. The data shows that the average area under the mango
cultivation was 0.26 acre per household during 2004-05 which increased to 2.03 acres per
household during 2009-10. On the other hand, the average yield declined to 45.74 quintals per
acre during 2009-10 from 59.14 quintals per acre during 2004-05. The increase in area was
found from 2006-07, the year of implementation of the programme and it was constant up to
2009-10. But the yield rate was found decreased to 38.02 quintal per acre during 2006-07
from 59.14 quintals per acre in 2004-05. It increased to 45.74 quintal per acre during 2009-10
mainly due to non-bearing of new plants during the first three years and thus, the yield rate
was found declining during 2006-07 to 2008-09.
In the case of litchi, same trend was recorded. The average area under litchi cultivation was
0.069 acres per household during 2004-05 which increased to 0.280 acres per household
during 2009-10. On the other hand, the average yield increased marginally to 38.08 quintals
per acre during 2009-10 from 32.17 quintals per acre during 2004-05. During 2006-07 to
2008-09, the yield rate was found declining mainly because of non-bearing period of the new
plants. Therefore, one can conclude from the above analysis that whereas the NHM
programme has clearly helped in bringing more area under horticultural crops in Bihar, its
effect on yield has yet to ascertain after the new plantations complete the gestation period.
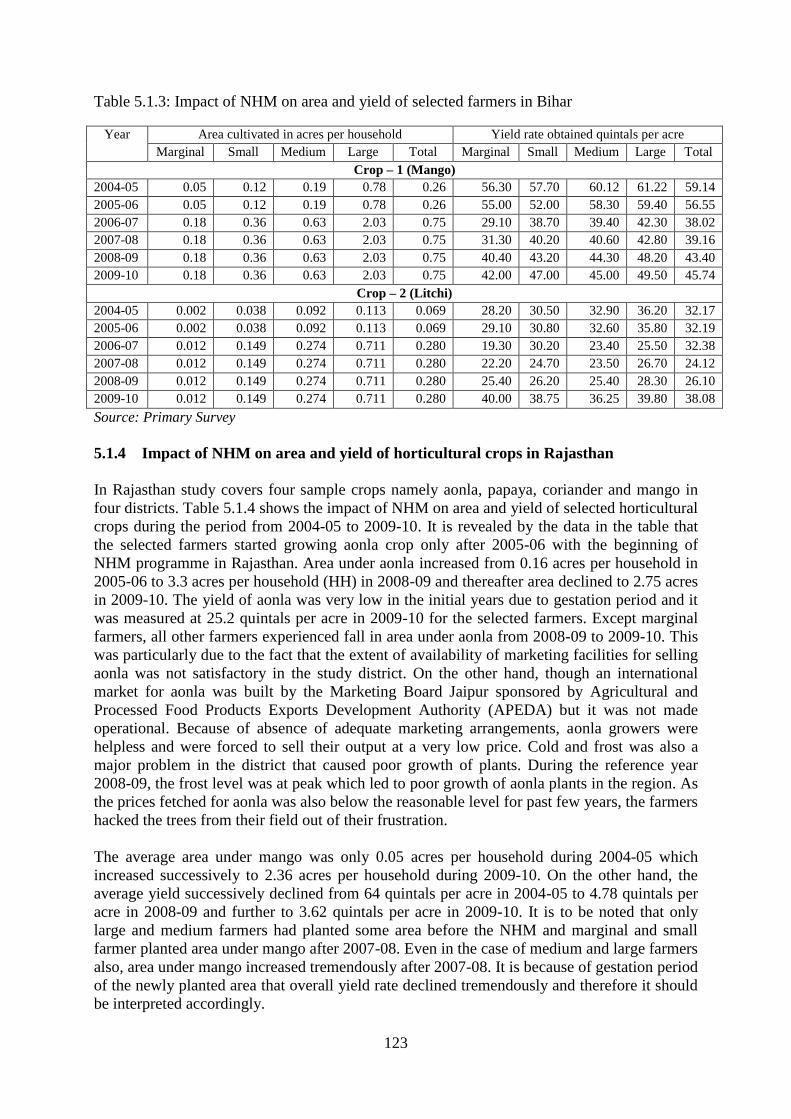
123
Table 5.1.3: Impact of NHM on area and yield of selected farmers in Bihar
Year Area cultivated in acres per household Yield rate obtained quintals per acre
Marginal Small Medium Large Total Marginal Small Medium Large Total
Crop – 1 (Mango)
2004-05 0.05 0.12 0.19 0.78 0.26 56.30 57.70 60.12 61.22 59.14
2005-06 0.05 0.12 0.19 0.78 0.26 55.00 52.00 58.30 59.40 56.55
2006-07 0.18 0.36 0.63 2.03 0.75 29.10 38.70 39.40 42.30 38.02
2007-08 0.18 0.36 0.63 2.03 0.75 31.30 40.20 40.60 42.80 39.16
2008-09 0.18 0.36 0.63 2.03 0.75 40.40 43.20 44.30 48.20 43.40
2009-10 0.18 0.36 0.63 2.03 0.75 42.00 47.00 45.00 49.50 45.74
Crop – 2 (Litchi)
2004-05 0.002 0.038 0.092 0.113 0.069 28.20 30.50 32.90 36.20 32.17
2005-06 0.002 0.038 0.092 0.113 0.069 29.10 30.80 32.60 35.80 32.19
2006-07 0.012 0.149 0.274 0.711 0.280 19.30 30.20 23.40 25.50 32.38
2007-08 0.012 0.149 0.274 0.711 0.280 22.20 24.70 23.50 26.70 24.12
2008-09 0.012 0.149 0.274 0.711 0.280 25.40 26.20 25.40 28.30 26.10
2009-10 0.012 0.149 0.274 0.711 0.280 40.00 38.75 36.25 39.80 38.08
Source: Primary Survey
5.1.4 Impact of NHM on area and yield of horticultural crops in Rajasthan
In Rajasthan study covers four sample crops namely aonla, papaya, coriander and mango in
four districts. Table 5.1.4 shows the impact of NHM on area and yield of selected horticultural
crops during the period from 2004-05 to 2009-10. It is revealed by the data in the table that
the selected farmers started growing aonla crop only after 2005-06 with the beginning of
NHM programme in Rajasthan. Area under aonla increased from 0.16 acres per household in
2005-06 to 3.3 acres per household (HH) in 2008-09 and thereafter area declined to 2.75 acres
in 2009-10. The yield of aonla was very low in the initial years due to gestation period and it
was measured at 25.2 quintals per acre in 2009-10 for the selected farmers. Except marginal
farmers, all other farmers experienced fall in area under aonla from 2008-09 to 2009-10. This
was particularly due to the fact that the extent of availability of marketing facilities for selling
aonla was not satisfactory in the study district. On the other hand, though an international
market for aonla was built by the Marketing Board Jaipur sponsored by Agricultural and
Processed Food Products Exports Development Authority (APEDA) but it was not made
operational. Because of absence of adequate marketing arrangements, aonla growers were
helpless and were forced to sell their output at a very low price. Cold and frost was also a
major problem in the district that caused poor growth of plants. During the reference year
2008-09, the frost level was at peak which led to poor growth of aonla plants in the region. As
the prices fetched for aonla was also below the reasonable level for past few years, the farmers
hacked the trees from their field out of their frustration.
The average area under mango was only 0.05 acres per household during 2004-05 which
increased successively to 2.36 acres per household during 2009-10. On the other hand, the
average yield successively declined from 64 quintals per acre in 2004-05 to 4.78 quintals per
acre in 2008-09 and further to 3.62 quintals per acre in 2009-10. It is to be noted that only
large and medium farmers had planted some area before the NHM and marginal and small
farmer planted area under mango after 2007-08. Even in the case of medium and large farmers
also, area under mango increased tremendously after 2007-08. It is because of gestation period
of the newly planted area that overall yield rate declined tremendously and therefore it should
be interpreted accordingly.

124
Table 5.1.4: Impact of NHM on area and yield of selected farmers in Rajasthan
Area cultivated in acres per household Yield rate obtained quintals per acre
Year Marginal Small Medium Large Total Marginal Small Medium Large Total
Anola
2004-05 0.00 0.00 0.00 0.00 0.00 0.00 0.00 0.00 0.00 0.00
2005-06 0.00 0.35 0.00 0.23 0.16 0.00 0.00 0.00 0.00 0.00
2006-07 0.63 1.19 1.36 0.88 1.11 0.00 0.00 0.00 0.00 0.00
2007-08 0.91 2.63 1.89 2.31 2.13 0.00 3.66 0.00 0.00 1.17
2008-09 1.16 3.11 3.25 4.08 3.30 18.36 11.61 10.22 9.98 10.70
2009-10 1.16 2.96 2.42 3.41 2.75 20.52 20.42 32.64 22.88 25.20
Papaya
2004-05 0.00 0.00 0.00 0.00 0.00 0.00 0.00 0.00 0.00 0.00
2005-06 0.00 0.00 0.00 0.00 0.00 0.00 0.00 0.00 0.00 0.00
2006-07 0.00 0.00 0.16 0.00 0.03 0.00 0.00 0.00 0.00 0.00
2007-08 0.14 0.38 1.12 0.70 0.45 0.00 0.00 11.19 0.00 4.43
2008-09 0.65 0.99 1.56 2.57 1.19 47.55 81.68 70.07 52.49 61.35
2009-10 0.79 1.00 1.24 2.37 1.17 53.20 165.70 154.47 101.98 111.21
Coriander
2004-05 0.00 0.58 0.69 1.67 1.14 0.00 3.94 5.68 5.13 5.17
2005-06 0.00 0.76 0.69 1.64 1.16 0.00 4.89 6.21 5.03 5.28
2006-07 0.00 0.63 2.25 3.35 2.55 0.00 5.37 6.11 4.76 5.24
2007-08 0.00 1.16 2.25 3.44 2.67 0.00 5.54 6.14 5.44 5.67
2008-09 0.00 2.77 3.32 5.89 4.48 0.00 5.63 6.13 5.68 5.80
2009-10 0.00 1.70 1.78 5.21 3.41 0.00 5.73 6.46 5.57 5.76
Mango
2004-05 0.00 0.00 0.21 0.00 0.05 0.00 0.00 64.00 0.00 64.00
2005-06 0.00 0.00 0.21 1.29 0.23 0.00 0.00 72.00 0.00 15.65
2006-07 0.00 0.00 0.21 2.37 0.38 0.00 0.00 68.00 0.00 8.90
2007-08 0.00 1.13 0.48 2.94 0.80 0.00 0.00 35.09 0.00 5.03
2008-09 0.82 1.74 2.74 6.90 2.36 0.00 0.00 15.94 1.51 4.78
2009-10 0.85 1.74 2.74 6.90 2.36 0.00 0.00 9.11 2.64 3.62
Source: Primary Survey
Relative to aonla and mango, papaya crop is a shorter duration crop that lasts mostly for 3
years. During 2004-05 and 2005-06, there was not a single sample farmer cultivating papaya
crop. The per household area under papaya increased from 0.03 acres in 2006-07 to 1.19 acres
in 2008-09 and then declined to 1.17 acres in 2009-10. The increase in area was
comparatively higher for the medium and large farmers than that of marginal and small
farmers. Because of the gestation period, the yield was low in the initial years and it increased
from 4 quintals per acre in first year of plantation to 61 quintals in the second year and further
to 111 quintals per acre in the third year, the latest year for which data was collected for the
selected farmers.
The cultivated area of coriander crop increased from 1.14 acres in 2004-05 to 4.48 acers in
2008-09 and came down to 3.41 acres per household among the selected farmers. The average
yield for the whole period was 5.49 quintals per acre. Some farmers expressed that
government supplied CS-6 variety of coriander which was not a good variety as compared to
local traditional varieties. The traditional variety of coriander had higher yield and also the
produce was of better quality. Another reason of reduced area under coriander crop was the
lack of interest of the farmers in the study district of Chittorgarh. The farmers in the districts
were more interested to cultivate isabgol and garlic since these crops fetched good returns.
5.1.5 Impact of NHM on area and yield of horticultural crops in Tamil Nadu

125
In Tamil Nadu impact of NHM is studied for three crops namely, mango, banana and flowers.
Table 5.1.5 presents the area cultivated and yield realized by the selected farmers in the state
during the period starting from 2004-05 up to 2009-10. Banana is an annual crop which the
sample respondents were cultivating even before beginning of the NHM. After the launch of
NHM scheme the farmers were motivated to bring more area under banana cultivation
because of various facilities provided by the government under the scheme. The overall area
of banana cultivated worked out to 1.11 acres per household during 2004-05 which marginally
rose to 1.12 acres during 2008-09 and further increased to 1.29 acres during 2009-10. Looking
at the yield level of banana crop, there were wide fluctuations in the yield obtained by
different farm size holdings may be due to different agricultural practices followed by these
groups. The average yield obtained marginally increased from 196 quintals per acre in 2004-
05 to 198 quintals per acre in 2008-09 that further rose to 224 quintals during 2009-10. Thus,
there was a slight increase in area as well as yield of banana among the selected farmers in
post NHM period.
Table 5.1.5: Impact of NHM on area and yield of selected farmers in Tamil Nadu
Year Area cultivated in acres per household Yield rate obtained in quintals per acre
Mango
Marginal Small Medium Large Total Marginal Small Medium Large Total
2004-05 0.40 0.70 2.00 3.70 0.77 0 0 0 0 0.00
2005-06 0.40 0.70 2.00 3.70 0.77 0 0 0 0 0.00
2006-07 0.40 0.70 2.00 3.70 0.77 0 0 0 0 0.00
2007-08 0.40 0.70 2.00 3.70 0.77 1.5 2.0 2.8 3.5 1.85
2008-09 0.40 0.70 2.00 3.70 0.77 4.31 5.03 6.0 6.31 4.77
2009-10 0.40 0.70 2.00 3.70 0.77 8.2 9.7 12.9 18.0 9.49
Banana
2004-05 0.60 1.20 2.60 4.00 1.11 172 230 230 241 196
2005-06 0.71 1.00 2.10 3.20 1.04 210 260 212 232 223
2006-07 0.68 1.300 2.40 3.66 1.15 220 192 217 210 212
2007-08 0.66 1.24 2.36 3.71 1.12 180 236 235 196 202
2008-09 0.60 1.20 2.60 4.10 1.12 190 210 205 215 198
2009-10 0.72 1.34 2.92 4.90 1.29 230 222 196 242 224
Flowers
2004-05 0.02 0.40 1.0 0.9 0.27 110 126 132 121 117
2005-06 0.03 0.42 1.1 0.9 0.29 136 132 146 132 136
2006-07 0.36 0.40 1.0 1.2 0.48 117 116 152 126 122
2007-08 0.38 0.50 1.2 1.3 0.55 128 141 143 151 134
2008-09 0.04 0.50 1.1 1.6 0.34 120 135 140 142 127
2009-10 0.05 0.62 1.4 1.5 0.41 142 128 162 158 142
Source: Primary Survey
In the case of mango crop, on an average, per household cultivated area was recorded as 0.40
acre, 0.70 acre, 2.00 acres and 3.70 acres for marginal, small, medium and large farmers,
respectively which remained constant during the study period, i.e., from 2004-05 to 2009-10.
The average area under mango crop per household worked out to 0.77 acres. Mango, being a
perennial crop, had gestation period almost the whole period for which data was collected.
Thereby, there was no yield in the initial years and sample respondents started securing some
yield after 2007-08 while the plantation had not reached the ideal yielding stage yet and
therefore average yield was not comparable with mango plantations.

126
The area under flowers was miniscule but it constantly increased from 2004-05 to 2008-09
across all size group of farmers. The average area cultivated by all sample respondents
worked out to 0.27 acres in 2004-05 which increased to 0.34 acres during 2008-09. Average
yield of all farmers, on an average, increased by 8.5 per cent per annum. The average yield
was 117 quintals per acre during 2004-05 which rose to 127 quintals per acre during 2008-
2009. The increase in area and yield of selected horticultural crops from 2004-05 to 2008-09
could be attributed to the working of NHM Scheme implemented since 2005-06.
5.1.6 Impact of NHM on area and yield of horticultural crops in West Bengal
Table 5.1.6 presents comparative picture of area and productivity of pineapple and mandarin
oranges among the selected farmers in West Bengal. On an average, the area cultivated under
pineapple increased only marginally over the period 2004-05 to 2009-10, from 0.76 acres to
0.79 acres per household. In the case of mandarin oranges, the average area steadily increased
over the period. While per household area under mandarin was less than pineapple in 2004-05
whereas it overtook the latter in 2009-10. Among different farm size holdings, pineapple was
grown by all categories except the large farmers, mandarin orange were grown only by
marginal and small farmers. The increase in area under both these crops was consistent among
different farm size holdings. It should be noted that these findings are in tune with the earlier
findings made on secondary data of the selected fruit crops, as has been analyzed in the
second chapter.
Table 5.1.6: Impact of NHM on area and yield of selected farmers in West Bengal -
Year Area cultivated in acres per household Yield rate obtained quintals per acre*
Marginal Small Medium Large Total Marginal Small Medium Large Total
Pineapple
2004-05 0.55 0.89 2.61 0.00 0.76 105.11 105.66 103.87 0.00 105.18
2005-06 0.54 0.89 2.61 0.00 0.76 105.39 107.35 105.24 0.00 105.89
2006-07 0.54 0.89 2.61 0.00 0.75 104.31 106.58 103.65 0.00 104.86
2007-08 0.54 0.89 2.61 0.00 0.75 104.83 104.96 105.79 0.00 104.92
2008-09 0.54 0.89 2.61 0.00 0.75 105.56 105.27 104.08 0.00 105.40
2009-10 0.58 0.91 2.64 0.00 0.79 107.06 107.42 107.16 0.00 107.16
Mandarin Oranges
2004-05 .69 1.50 0.00 0.00 .71 9.80 9.55 0.00 0.00 9.79
2005-06 .69 1.50 0.00 0.00 .71 9.95 9.61 0.00 0.00 9.94
2006-07 .70 1.80 0.00 0.00 .72 10.08 9.61 0.00 0.00 10.07
2007-08 .71 1.80 0.00 0.00 .74 10.43 9.56 0.00 0.00 10.41
2008-09 .83 2.50 0.00 0.00 .86 9.59 9.60 0.00 0.00 9.59
2009-10 .84 2.50 0.00 0.00 .87 9.83 9.60 0.00 0.00 9.83
Source: Primary Survey * Calculated on a yearly basis; Sample Size = 50
In the case of yield rate for pineapple as well as mandarin orange, one can see marginal
fluctuations in yield rate among all the categories of farmer households. In comparison to
2004-05, yield rate of pineapple among marginal farmers increased by 1.78 per cent in 2009-
10. The corresponding figures for small and medium farmers were 1.39 per cent and 3.87 per
cent, respectively. The yield rate of mandarin orange fluctuated among the marginal and small
farmers over the same period. The overall yield rate of mandarin increased continuously from
2004-05 up to 2007-08 but came down tremendously during 2008-09 and increased slightly in
the next year. Summing up, there was slight increase in area under both these crop after the
implementation of NHM but the programme failed to stabilize the yield rate at least in the
case of mandarin orange.
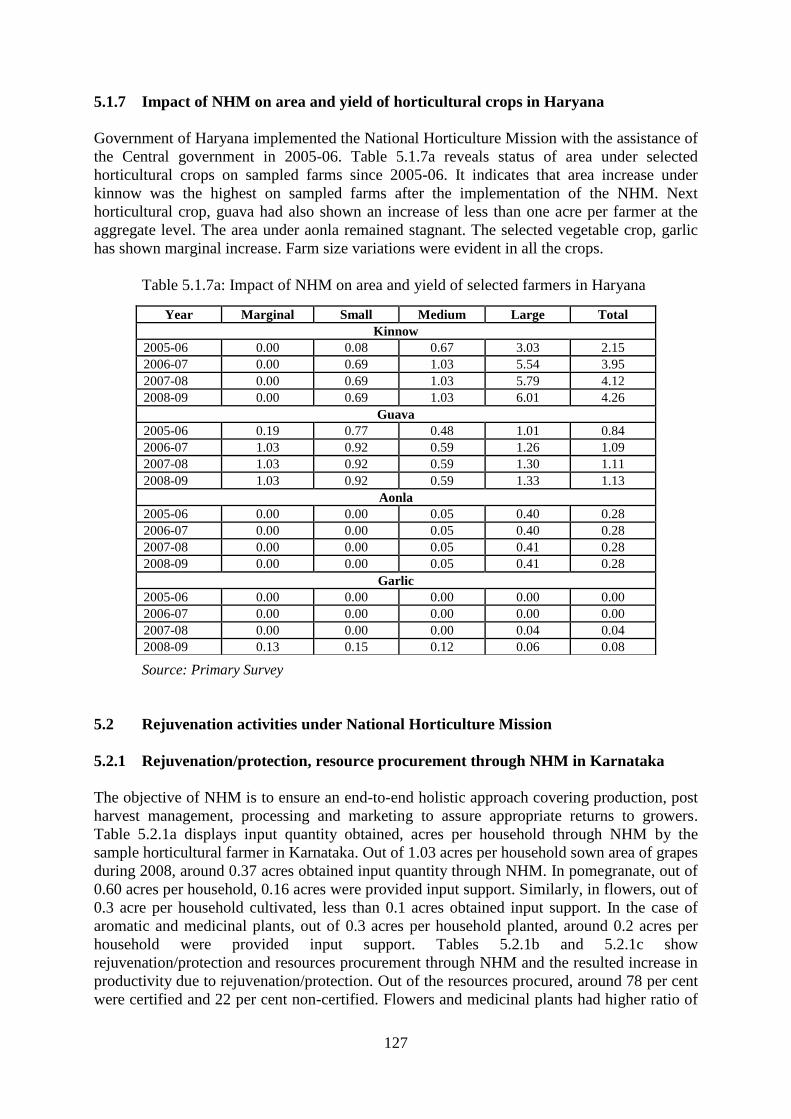
127
5.1.7 Impact of NHM on area and yield of horticultural crops in Haryana
Government of Haryana implemented the National Horticulture Mission with the assistance of
the Central government in 2005-06. Table 5.1.7a reveals status of area under selected
horticultural crops on sampled farms since 2005-06. It indicates that area increase under
kinnow was the highest on sampled farms after the implementation of the NHM. Next
horticultural crop, guava had also shown an increase of less than one acre per farmer at the
aggregate level. The area under aonla remained stagnant. The selected vegetable crop, garlic
has shown marginal increase. Farm size variations were evident in all the crops.
Table 5.1.7a: Impact of NHM on area and yield of selected farmers in Haryana
Source: Primary Survey
5.2 Rejuvenation activities under National Horticulture Mission
5.2.1 Rejuvenation/protection, resource procurement through NHM in Karnataka
The objective of NHM is to ensure an end-to-end holistic approach covering production, post
harvest management, processing and marketing to assure appropriate returns to growers.
Table 5.2.1a displays input quantity obtained, acres per household through NHM by the
sample horticultural farmer in Karnataka. Out of 1.03 acres per household sown area of grapes
during 2008, around 0.37 acres obtained input quantity through NHM. In pomegranate, out of
0.60 acres per household, 0.16 acres were provided input support. Similarly, in flowers, out of
0.3 acre per household cultivated, less than 0.1 acres obtained input support. In the case of
aromatic and medicinal plants, out of 0.3 acres per household planted, around 0.2 acres per
household were provided input support. Tables 5.2.1b and 5.2.1c show
rejuvenation/protection and resources procurement through NHM and the resulted increase in
productivity due to rejuvenation/protection. Out of the resources procured, around 78 per cent
were certified and 22 per cent non-certified. Flowers and medicinal plants had higher ratio of
Year Marginal Small Medium Large Total
Kinnow
2005-06 0.00 0.08 0.67 3.03 2.15
2006-07 0.00 0.69 1.03 5.54 3.95
2007-08 0.00 0.69 1.03 5.79 4.12
2008-09 0.00 0.69 1.03 6.01 4.26
Guava
2005-06 0.19 0.77 0.48 1.01 0.84
2006-07 1.03 0.92 0.59 1.26 1.09
2007-08 1.03 0.92 0.59 1.30 1.11
2008-09 1.03 0.92 0.59 1.33 1.13
Aonla
2005-06 0.00 0.00 0.05 0.40 0.28
2006-07 0.00 0.00 0.05 0.40 0.28
2007-08 0.00 0.00 0.05 0.41 0.28
2008-09 0.00 0.00 0.05 0.41 0.28
Garlic
2005-06 0.00 0.00 0.00 0.00 0.00
2006-07 0.00 0.00 0.00 0.00 0.00
2007-08 0.00 0.00 0.00 0.04 0.04
2008-09 0.13 0.15 0.12 0.06 0.08
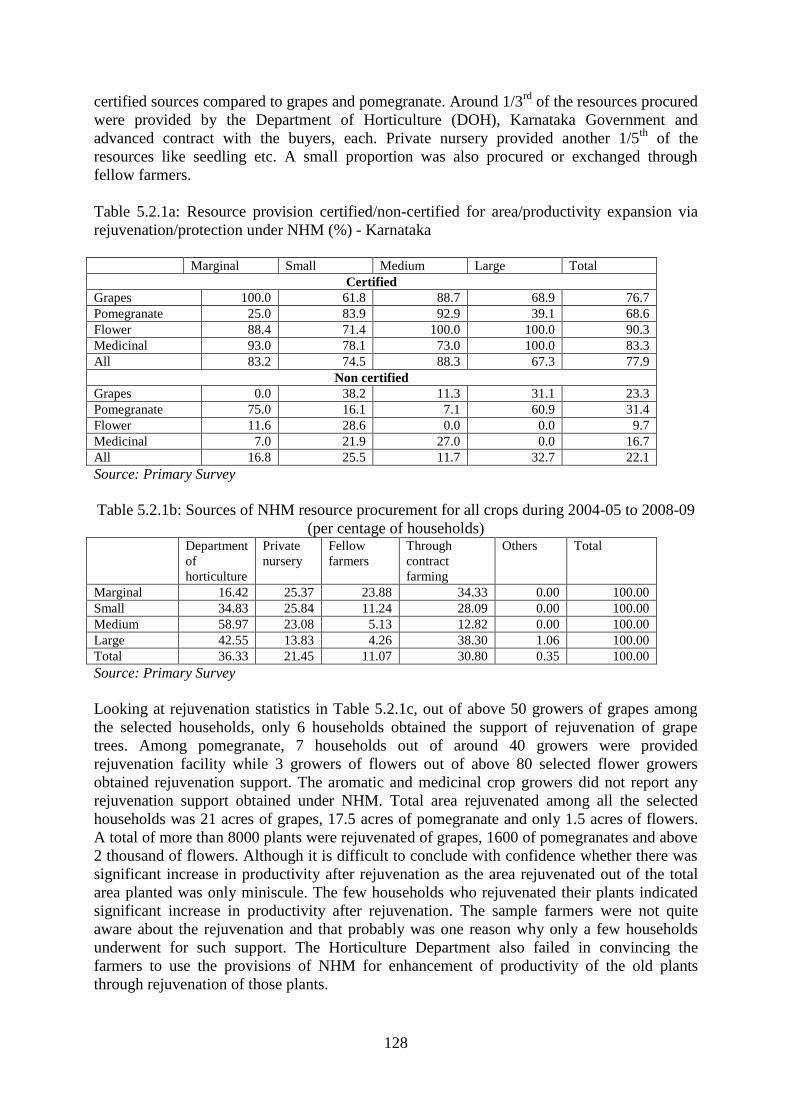
128
certified sources compared to grapes and pomegranate. Around 1/3rd
of the resources procured
were provided by the Department of Horticulture (DOH), Karnataka Government and
advanced contract with the buyers, each. Private nursery provided another 1/5th
of the
resources like seedling etc. A small proportion was also procured or exchanged through
fellow farmers.
Table 5.2.1a: Resource provision certified/non-certified for area/productivity expansion via
rejuvenation/protection under NHM (%) - Karnataka
Marginal Small Medium Large Total
Certified
Grapes 100.0 61.8 88.7 68.9 76.7
Pomegranate 25.0 83.9 92.9 39.1 68.6
Flower 88.4 71.4 100.0 100.0 90.3
Medicinal 93.0 78.1 73.0 100.0 83.3
All 83.2 74.5 88.3 67.3 77.9
Non certified
Grapes 0.0 38.2 11.3 31.1 23.3
Pomegranate 75.0 16.1 7.1 60.9 31.4
Flower 11.6 28.6 0.0 0.0 9.7
Medicinal 7.0 21.9 27.0 0.0 16.7
All 16.8 25.5 11.7 32.7 22.1
Source: Primary Survey
Table 5.2.1b: Sources of NHM resource procurement for all crops during 2004-05 to 2008-09
(per centage of households) Department
of
horticulture
Private
nursery
Fellow
farmers
Through
contract
farming
Others Total
Marginal 16.42 25.37 23.88 34.33 0.00 100.00
Small 34.83 25.84 11.24 28.09 0.00 100.00
Medium 58.97 23.08 5.13 12.82 0.00 100.00
Large 42.55 13.83 4.26 38.30 1.06 100.00
Total 36.33 21.45 11.07 30.80 0.35 100.00
Source: Primary Survey
Looking at rejuvenation statistics in Table 5.2.1c, out of above 50 growers of grapes among
the selected households, only 6 households obtained the support of rejuvenation of grape
trees. Among pomegranate, 7 households out of around 40 growers were provided
rejuvenation facility while 3 growers of flowers out of above 80 selected flower growers
obtained rejuvenation support. The aromatic and medicinal crop growers did not report any
rejuvenation support obtained under NHM. Total area rejuvenated among all the selected
households was 21 acres of grapes, 17.5 acres of pomegranate and only 1.5 acres of flowers.
A total of more than 8000 plants were rejuvenated of grapes, 1600 of pomegranates and above
2 thousand of flowers. Although it is difficult to conclude with confidence whether there was
significant increase in productivity after rejuvenation as the area rejuvenated out of the total
area planted was only miniscule. The few households who rejuvenated their plants indicated
significant increase in productivity after rejuvenation. The sample farmers were not quite
aware about the rejuvenation and that probably was one reason why only a few households
underwent for such support. The Horticulture Department also failed in convincing the
farmers to use the provisions of NHM for enhancement of productivity of the old plants
through rejuvenation of those plants.

129
Table 5.2.1c: Rejuvenation/protection provided under NHM and resultant increase in
productivity in Karnataka
Sr
No
Details of the items Marginal
Small
Medium
Large
Total
Name of the crops for which rejuvenation or protection support was provided under NHM (No of households)
1 Grapes - 1 - 5 6
2 Pomegranate - 3 3 1 7
3 Floriculture 2 - 1 - 3
Existing area rejuvenated /protected under the Mission (total acres)
1 Grapes - 3.0 - 18.0 21.0
2 Pomegranate - 4.0 7.5 6.0 17.5
3 Floriculture 0.5 - 1.0 - 1.5
Number of trees rejuvenated /protected
1 Grapes - 500 - 7560 8060
2 Pomegranate - 800 800 - 1600
3 Floriculture 580 - 1500 - 2080
Productivity enhancement as a result of rejuvenation (%)
1 Grapes - 50.0 - 61.2 56.0
2 Pomegranate - 15.0 8.7 - 11.4
3 Floriculture 33.7
50.0 - 34.0
Source: Primary Survey
5.2.2 Rejuvenation/protection, resource procurement through NHM in AP
Out of 200 sample farmers of both mango and sweet orange orchards, no farmer was found
having used the facility of rejuvenation programme under the scheme. Table 5.2.2 reveals that
the mango and sweet orange sample farmers revealed that the NHM was the main source
regarding the supply of planting material. It was found that out of 200 sample farmers, 86 per
cent of households expressed that the planting material was supplied by the Department of
Horticulture through (NHM) and 15 per cent households reported that the material supplied
was by the private nurseries. All sample farmers reported that they made use of available good
quality planting material like nursery through NHM during the period from 2004-05 to 2009-
10.
5.2.3 Rejuvenation/protection, resource procurement provision in Bihar
No case of rejuvenation/protection was found in the case of mango and litchi crops among the
sample households in Bihar. However, the state annual action plan of NHM for the years
2006-07 and 2007-08 shows that out of 13 components of NHM, rejuvenation/protection
component was included but the financial achievement level for the years as stated above was
just 15 per cent. The mission envisages coverage of large areas under improved varieties of
horticultural crops. The data presented in Table 5.3.3 shows the sources of NHM resource
procurement for the sample households during the period 2006-07 to 2008-09. It may be noted
that about 71.00 per cent of total NHM resource procurement by the sample households was
through State Department of Horticulture. The private nurseries provided 21.00 per cent
whereas fellow/progressive farmers provided 8.00 per cent of total NHM resource
procurement by the beneficiaries’ households. The role of fellow/progressive farmers does not
appear significant.

130
Table 5.2.2: Sources of NHM resource procurement in Andhra Pradesh
during 2004-05 to 2009-10
(percentage of households)
Size of Household Department of
Horticulture
Private
Nursery
Mango
Marginal 100 --
Small 90 10
Medium 75 25
Large 75 25
Landless -- --
Total 85 15
Sweet Orange
Marginal 100 --
Small 75 25
Medium 85 15
Large 83 17
Landless -- --
Total 86 14
Source: Primary Survey
Table 5.2.3: Sources of NHM resource procurement in Bihar
during 2004-05 to 2009-10 (Percentage of households)
Farm
Size
Department
of
Horticulture
Private
Nursery
Fellow
Farmers
Through
contract
farming
Others Total/
All
Marginal 70.59 29.41 0.00 0.00 0.00 100.00
Small 77.27 22.73 0.00 0.00 0.00 100.00
Medium 69.77 11.63 18.60 0.00 0.00 100.00
Large 66.67 33.33 0.00 0.00 0.00 100.00
Total 71.00 21.00 8.00 0.00 0.00 100.00 Source: Primary Survey
5.2.4 Rejuvenation/protection, resource procurement through NHM in Rajasthan
Table 5.2.4 shows the area under rejuvenation/protection, resources procurement through
NHM and the resulted increase in productivity due to rejuvenation/protection in Rajasthan. No
cases of rejuvenation were found in the case of aonla, papaya and coriander. Four farmers in
the case of mango were involved in rejuvenation/protection through NHM. The average area
under rejuvenation of mango was 0.20 acres per household. Among various farmer categories,
only medium and large farmers rejuvenated 0.42 acres and 0.71 acres per household,
respectively. The rejuvenation activities under NHM in the study districts were not performed
well for the selected crops. The sample farmers expressed that they were not aware about the
procedure and mandatory conditions for rejuvenation of horticultural crops. The horticulture
supervisors were also not well trained in convincing the farmers to use these provisions of
NHM for their benefits.
Table 5.2.4 shows the extent of increase in area and productivity of selected horticultural
crops due to rejuvenation/protection supported by the NHM. It may be seen that about 8 per
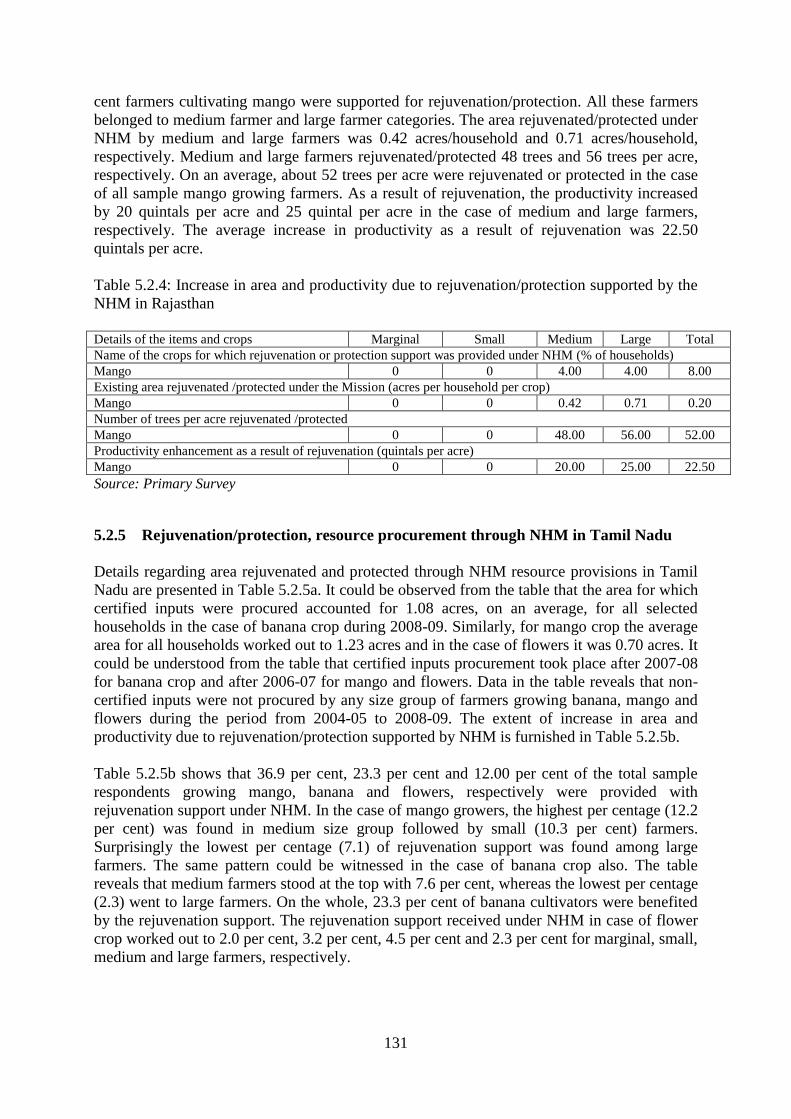
131
cent farmers cultivating mango were supported for rejuvenation/protection. All these farmers
belonged to medium farmer and large farmer categories. The area rejuvenated/protected under
NHM by medium and large farmers was 0.42 acres/household and 0.71 acres/household,
respectively. Medium and large farmers rejuvenated/protected 48 trees and 56 trees per acre,
respectively. On an average, about 52 trees per acre were rejuvenated or protected in the case
of all sample mango growing farmers. As a result of rejuvenation, the productivity increased
by 20 quintals per acre and 25 quintal per acre in the case of medium and large farmers,
respectively. The average increase in productivity as a result of rejuvenation was 22.50
quintals per acre.
Table 5.2.4: Increase in area and productivity due to rejuvenation/protection supported by the
NHM in Rajasthan
Details of the items and crops Marginal Small Medium Large Total
Name of the crops for which rejuvenation or protection support was provided under NHM (% of households)
Mango 0 0 4.00 4.00 8.00
Existing area rejuvenated /protected under the Mission (acres per household per crop)
Mango 0 0 0.42 0.71 0.20
Number of trees per acre rejuvenated /protected
Mango 0 0 48.00 56.00 52.00
Productivity enhancement as a result of rejuvenation (quintals per acre)
Mango 0 0 20.00 25.00 22.50
Source: Primary Survey
5.2.5 Rejuvenation/protection, resource procurement through NHM in Tamil Nadu
Details regarding area rejuvenated and protected through NHM resource provisions in Tamil
Nadu are presented in Table 5.2.5a. It could be observed from the table that the area for which
certified inputs were procured accounted for 1.08 acres, on an average, for all selected
households in the case of banana crop during 2008-09. Similarly, for mango crop the average
area for all households worked out to 1.23 acres and in the case of flowers it was 0.70 acres. It
could be understood from the table that certified inputs procurement took place after 2007-08
for banana crop and after 2006-07 for mango and flowers. Data in the table reveals that non-
certified inputs were not procured by any size group of farmers growing banana, mango and
flowers during the period from 2004-05 to 2008-09. The extent of increase in area and
productivity due to rejuvenation/protection supported by NHM is furnished in Table 5.2.5b.
Table 5.2.5b shows that 36.9 per cent, 23.3 per cent and 12.00 per cent of the total sample
respondents growing mango, banana and flowers, respectively were provided with
rejuvenation support under NHM. In the case of mango growers, the highest per centage (12.2
per cent) was found in medium size group followed by small (10.3 per cent) farmers.
Surprisingly the lowest per centage (7.1) of rejuvenation support was found among large
farmers. The same pattern could be witnessed in the case of banana crop also. The table
reveals that medium farmers stood at the top with 7.6 per cent, whereas the lowest per centage
(2.3) went to large farmers. On the whole, 23.3 per cent of banana cultivators were benefited
by the rejuvenation support. The rejuvenation support received under NHM in case of flower
crop worked out to 2.0 per cent, 3.2 per cent, 4.5 per cent and 2.3 per cent for marginal, small,
medium and large farmers, respectively.

132
Table 5.2.5a: Area rejuvenated/protected through NHM resource
provision in Tamil Nadu
(area in acre per household under rejuvenation)
Year Area for which certified inputs procured
Marginal Small Medium Large Total
Banana
2007-08 0.10 0.15 0.40 0.70 0.17
2008-09 0.19 0.38 0.81 1.39 1.08
Mango
2006-07 0.10 0.10 0.30 0.40 0.14
2007-08 0.25 0.35 0.75 1.50 0.38
2008-09 0.42 0.72 1.34 2.58 1.23
Flowers
2006-07 0.01 0.02 0.12 0.25 0.03
2007-08 0.06 0.10 0.28 0.40 0.11
2008-09 0.09 0.21 0.54 0.83 0.70
Source: Primary Survey
Table 5.2.5b: Increase in area and productivity due to rejuvenation/ protection
supported by the NHM in Tamil Nadu
Details of the Items Marginal Small Medium Large Total
Name of the crops for which rejuvenation or protection support was provided under NHM
(% of households)
Mango 7.4 10.3 12.2 7.1 36.9
Banana 6.2 7.2 7.6 2.3 23.3
Flowers 2.0 3.2 4.5 2.3 12.0
Area expansion by rejuvenation (acres per household per crop)
Mango 0.13 0.24 0.43 0.80 0.41
Banana 0.04 0.13 0.27 0.47 0.36
Flowers 0.03 0.07 0.18 0.27 0.23
Existing area rejuvenated under the NHM (acres per household per crop)
Mango 0.42 0.72 1.34 2.58 1.23
Banana 0.19 0.38 0.81 1.39 1.08
Flowers 0.09 0.21 0.54 0.83 0.70
Number of trees per acre rejuvenated
Mango 5 22 74 140 22
Banana 45 52 48 55 47.44
Flowers 80 90 85 95 83.6
Productivity enhancement as a result of rejuvenation (quintals per acre)
Mango 0 0 0 0 0
Banana 11 17 18 19 14
Flowers - - - - -
Source: Primary Survey
Area expansion by rejuvenation took place under NHM. Table indicates that the area
expansion of mango crop per household was the highest (0.80 acres) for large farmers
followed by medium farmers while the marginal farmers had the lowest of 0.13 acres per
household. The average area increased under mango worked out to 0.41 acres for all
households. With regard to banana crop, the table shows that the average area expanded by
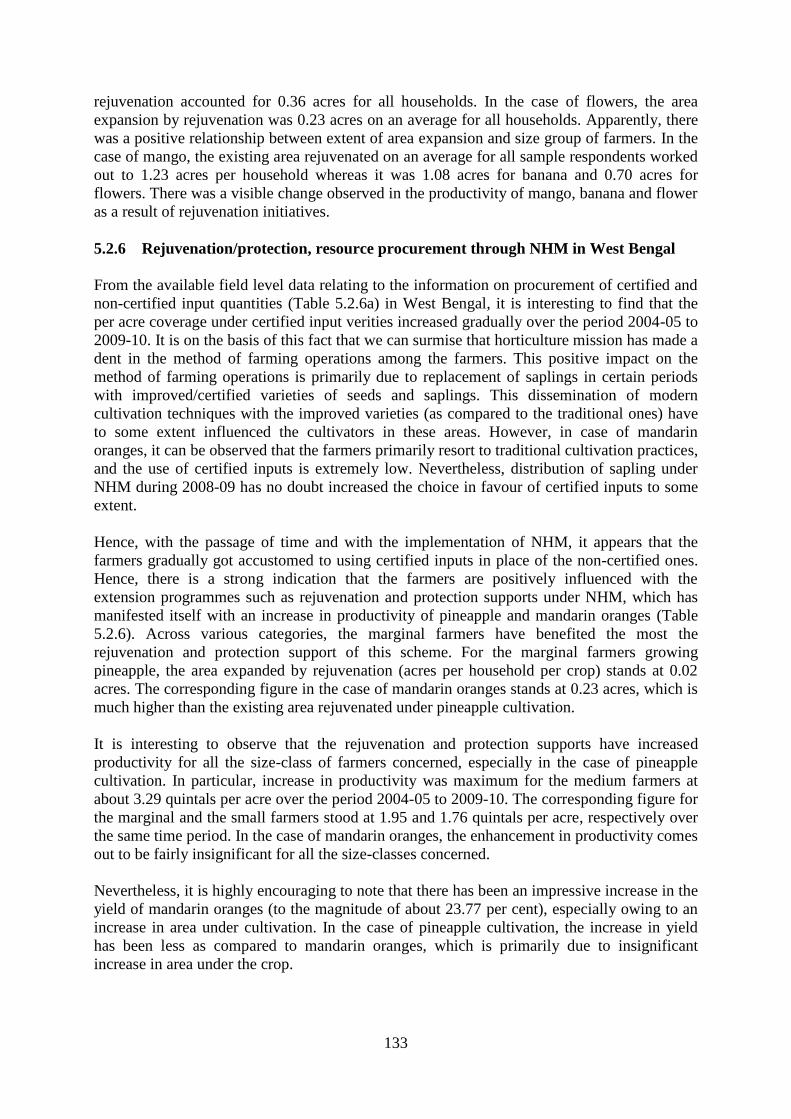
133
rejuvenation accounted for 0.36 acres for all households. In the case of flowers, the area
expansion by rejuvenation was 0.23 acres on an average for all households. Apparently, there
was a positive relationship between extent of area expansion and size group of farmers. In the
case of mango, the existing area rejuvenated on an average for all sample respondents worked
out to 1.23 acres per household whereas it was 1.08 acres for banana and 0.70 acres for
flowers. There was a visible change observed in the productivity of mango, banana and flower
as a result of rejuvenation initiatives.
5.2.6 Rejuvenation/protection, resource procurement through NHM in West Bengal
From the available field level data relating to the information on procurement of certified and
non-certified input quantities (Table 5.2.6a) in West Bengal, it is interesting to find that the
per acre coverage under certified input verities increased gradually over the period 2004-05 to
2009-10. It is on the basis of this fact that we can surmise that horticulture mission has made a
dent in the method of farming operations among the farmers. This positive impact on the
method of farming operations is primarily due to replacement of saplings in certain periods
with improved/certified varieties of seeds and saplings. This dissemination of modern
cultivation techniques with the improved varieties (as compared to the traditional ones) have
to some extent influenced the cultivators in these areas. However, in case of mandarin
oranges, it can be observed that the farmers primarily resort to traditional cultivation practices,
and the use of certified inputs is extremely low. Nevertheless, distribution of sapling under
NHM during 2008-09 has no doubt increased the choice in favour of certified inputs to some
extent.
Hence, with the passage of time and with the implementation of NHM, it appears that the
farmers gradually got accustomed to using certified inputs in place of the non-certified ones.
Hence, there is a strong indication that the farmers are positively influenced with the
extension programmes such as rejuvenation and protection supports under NHM, which has
manifested itself with an increase in productivity of pineapple and mandarin oranges (Table
5.2.6). Across various categories, the marginal farmers have benefited the most the
rejuvenation and protection support of this scheme. For the marginal farmers growing
pineapple, the area expanded by rejuvenation (acres per household per crop) stands at 0.02
acres. The corresponding figure in the case of mandarin oranges stands at 0.23 acres, which is
much higher than the existing area rejuvenated under pineapple cultivation.
It is interesting to observe that the rejuvenation and protection supports have increased
productivity for all the size-class of farmers concerned, especially in the case of pineapple
cultivation. In particular, increase in productivity was maximum for the medium farmers at
about 3.29 quintals per acre over the period 2004-05 to 2009-10. The corresponding figure for
the marginal and the small farmers stood at 1.95 and 1.76 quintals per acre, respectively over
the same time period. In the case of mandarin oranges, the enhancement in productivity comes
out to be fairly insignificant for all the size-classes concerned.
Nevertheless, it is highly encouraging to note that there has been an impressive increase in the
yield of mandarin oranges (to the magnitude of about 23.77 per cent), especially owing to an
increase in area under cultivation. In the case of pineapple cultivation, the increase in yield
has been less as compared to mandarin oranges, which is primarily due to insignificant
increase in area under the crop.
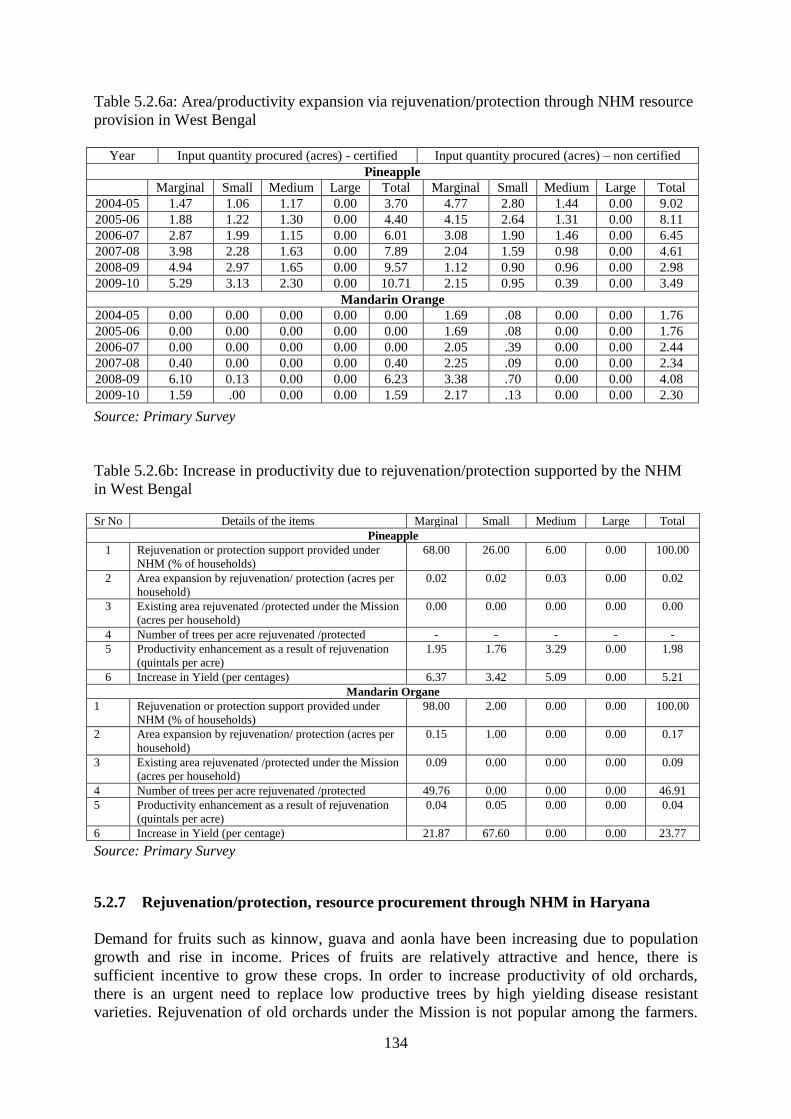
134
Table 5.2.6a: Area/productivity expansion via rejuvenation/protection through NHM resource
provision in West Bengal
Year Input quantity procured (acres) - certified Input quantity procured (acres) – non certified
Pineapple
Marginal Small Medium Large Total Marginal Small Medium Large Total
2004-05 1.47 1.06 1.17 0.00 3.70 4.77 2.80 1.44 0.00 9.02
2005-06 1.88 1.22 1.30 0.00 4.40 4.15 2.64 1.31 0.00 8.11
2006-07 2.87 1.99 1.15 0.00 6.01 3.08 1.90 1.46 0.00 6.45
2007-08 3.98 2.28 1.63 0.00 7.89 2.04 1.59 0.98 0.00 4.61
2008-09 4.94 2.97 1.65 0.00 9.57 1.12 0.90 0.96 0.00 2.98
2009-10 5.29 3.13 2.30 0.00 10.71 2.15 0.95 0.39 0.00 3.49
Mandarin Orange
2004-05 0.00 0.00 0.00 0.00 0.00 1.69 .08 0.00 0.00 1.76
2005-06 0.00 0.00 0.00 0.00 0.00 1.69 .08 0.00 0.00 1.76
2006-07 0.00 0.00 0.00 0.00 0.00 2.05 .39 0.00 0.00 2.44
2007-08 0.40 0.00 0.00 0.00 0.40 2.25 .09 0.00 0.00 2.34
2008-09 6.10 0.13 0.00 0.00 6.23 3.38 .70 0.00 0.00 4.08
2009-10 1.59 .00 0.00 0.00 1.59 2.17 .13 0.00 0.00 2.30
Source: Primary Survey
Table 5.2.6b: Increase in productivity due to rejuvenation/protection supported by the NHM
in West Bengal Sr No Details of the items Marginal Small Medium Large Total
Pineapple
1 Rejuvenation or protection support provided under
NHM (% of households)
68.00 26.00 6.00 0.00 100.00
2 Area expansion by rejuvenation/ protection (acres per
household)
0.02 0.02 0.03 0.00 0.02
3 Existing area rejuvenated /protected under the Mission
(acres per household)
0.00 0.00 0.00 0.00 0.00
4 Number of trees per acre rejuvenated /protected - - - - -
5 Productivity enhancement as a result of rejuvenation
(quintals per acre)
1.95 1.76 3.29 0.00 1.98
6 Increase in Yield (per centages) 6.37 3.42 5.09 0.00 5.21
Mandarin Organe
1 Rejuvenation or protection support provided under
NHM (% of households)
98.00 2.00 0.00 0.00 100.00
2 Area expansion by rejuvenation/ protection (acres per
household)
0.15 1.00 0.00 0.00 0.17
3 Existing area rejuvenated /protected under the Mission
(acres per household)
0.09 0.00 0.00 0.00 0.09
4 Number of trees per acre rejuvenated /protected 49.76 0.00 0.00 0.00 46.91
5 Productivity enhancement as a result of rejuvenation
(quintals per acre)
0.04 0.05 0.00 0.00 0.04
6 Increase in Yield (per centage) 21.87 67.60 0.00 0.00 23.77
Source: Primary Survey
5.2.7 Rejuvenation/protection, resource procurement through NHM in Haryana
Demand for fruits such as kinnow, guava and aonla have been increasing due to population
growth and rise in income. Prices of fruits are relatively attractive and hence, there is
sufficient incentive to grow these crops. In order to increase productivity of old orchards,
there is an urgent need to replace low productive trees by high yielding disease resistant
varieties. Rejuvenation of old orchards under the Mission is not popular among the farmers.

135
The main reason cited was low rate of subsidy for rejuvenation. Most of beneficiary farmers
established orchards after implementation of the NHM during 2005-06. It is urgent to
rejuvenate unproductive gardens by replanting and adopting scientific cultivation methods.
Farmers with old orchards need to be motivated to follow improved cultivation methods.
Along with this, farmers may be encouraged to adopt latest available technology. It is felt that
level of subsidy for rejuvenation of old orchards may be reconsidered and revised without
losing time.
5.3 Resource provision under the National Horticulture Mission
National Horticultural Mission intends to cover a large area under improved varieties of
horticultural crops. As per the NHM guidelines (GOI, 2010) the assistance for cultivation will
be for a maximum area of 4 hectares per beneficiary, spread over a period of three years. The
ratio of assistance would be 60:20:20 in first, second and third year depending upon the type
of crop and survival of plants. Assistance for second year will be subject to 75 per cent
survival of the new gardens and for the third year assistance will be subject to 90 per cent
survival of plants. Cost of raising new plantations will vary from crop to crop depending on
nature of crops (perennial to non-perennial) and number of plants per hectare. As per the
guidelines, the assistance amount will be provided on the expenditure on planting material and
cost of inputs including that for Integrated Nutrient Management (INM) and Integrated Pest
Management (IPM). Given the above guidelines and the budget provided to the state
governments under NHM, the assistance was provided to the farmers growing horticultural
crops in different states. In the following section we analyze the resource provision made to
the selected farmers in different states.
5.3.1 NHM reaching to the households with resource provision in Karnataka
Given the budget provided to Karnataka under NHM, the state governments provided
assistance to the farmers growing horticultural crops through the Department of Horticulture.
Table 5.3.1 provides details of promotional activities provided to the sample farmers in
Karnataka cultivating grapes, pomegranate, flowers and aromatic/medicinal crops.
We enquired the sample farmers about how NHM helped them to grow area under
horticultural crops. The sample farmers indicated that the best help provided by the NHM was
in terms of providing them planting material like nursery or seedling. Around half of the
selected households indicated that they were provided with the planting material for growing
horticultural crops. Around 1/5th
of the selected households indicated that they were provided
help in putting up poly house ventilation, insect proof net and putting up infrastructure for
sprinkler irrigation. Around 15 per cent of them pointed out that they obtained help in putting
up INM or IPM. Same numbers of households also indicated that there was capacity building
activities, like provision of training on technical know-how about horticultural crops. Help for
organic farming for certification or vermin compost was provided to around 10 per cent of the
selected households. Among other facilities provided to a few selected households (less than 5
per cent) includes, provision of pump house, storage/community tank; post harvest
management and mobile processing unit; rejuvenation with improved cultivars; seed
production; provision of mother stock under poly cover; green house, shade net and plastic
tunnel etc. Among different farm size holdings, the input provision to different farmers was
found evenly distributed and no trend was observed towards any particular size class of
holdings. However, some provisions under NHM like upgrading the existing tissue culture
unit; raising root stock seedling under net house conditions; soil sterilization system with

136
boilers; and precision farming implements like GPS, GIS and censor applications were hardly
benefited by the selected households of any size class perhaps because of their more technical
nature as well as because of high cost involved.
Table 5.3.1: How did NHM help households to increase their area under horticultural crops
(Percentage of households saying yes to the following questions)
Description Marginal Small Medium Large Total
Making available good quality planting material like
nursery
54.2 42.9 51.4 49.1 49.1
Rejuvenation with improved cultivars 1.7 1.6 5.7 7.3 3.8
Upgrading the existing tissue culture unit 0.0 1.6 0.0 0.0 0.5
Mother stock block maintenance under poly cover to
protect from adverse weather conditions
0.0 1.6 5.7 3.6 2.4
Raising root stock seedlings under net house
conditions
0.0 1.6 0.0 1.8 0.9
Poly house with ventilation, insect proof netting,
fogging and sprinkler irrigation
1.7 15.9 34.3 40.0 21.2
Pump house to provide sufficient irrigation
with/without storage tank, community tank
1.7 4.8 2.9 10.9 5.2
Soil sterilization-steam sterilization system with
boilers
0.0 1.6 0.0 1.8 0.9
Establishment of new garden or seed production 0.0 4.8 0.0 5.5 2.8
Protected cultivation like green house, shade net,
plastic tunnel etc
1.7 0.0 2.9 3.6 1.9
Precision farming implements, e.g., computer, GPS,
GIS, sensors and application control
0.0 1.6 0.0 3.6 1.4
Promotion of integrated nutrient management or
integrated pest management
6.8 19.0 17.1 18.2 15.1
Help provided for organic farming (vermi compost
unit, certification etc.)
5.1 12.7 5.7 10.9 9.0
Post harvest management like pack house, storage
unit, mobile processing unit etc
0.0 6.3 2.9 7.3 4.2
Training and capacity building 5.1 9.5 20.0 25.5 14.2
Source: Primary Survey
5.3.2 NHM reaching to the households with resource provision in Andhra Pradesh
Mango and sweet orange sample farmers interviewed through structured questionnaire about
the impact of area under NHM scheme in the districts of Ranga Reddy, Nalgonda, Kurnool
and Prakasam in Andhra Pradesh. Table 5.3.2 shows the perception of farmers of both mango
and sweet orange orchards expressed their opinion regarding NHM scheme activities. Out of
200 sample farmers, all sample farmers expressed that NHM activities had helped them in
raising area of mango and sweet orange gardens, establishment of nursery from both private
and public sectors and supply of good quality planting material, supply of poly cover to
protect from adverse weather conditions, establishment of new gardens. Protected cultivation
like green house, shade net etc., assistance for IPM/INM activities, establishment of varmi
compost units, farm mechanization, post harvest management activities like pack houses, cold
storage units, training and capacity building activities. Further, above 95 per cent sample
farmers and farm size groups were satisfied with activities under NHM scheme like
rejuvenation, poly house and sprinkler irrigation and without pump house irrigation. The other

137
activities namely tissue culture, soil sterilization and precision farming activities were not
found existing among the selected crops of mango and sweet orange as expressed by the
farmers.
Regarding the opinion about the NHM activities as given by the selected farmers in the field
survey, all farmers positively responded on the activities like establishment of nursery
gardens, supply of good quality plating material, IPM/INM, varmi compost units and training
and awareness programmes etc. The other activities had also helped the farmers in area
expansion of horticultural crops under NHM scheme reported by 95 per cent of sample
farmers. To summarize, The NHM helped the farmers with resources (planting material) as
well as extension activities (capacity building) which led to expansion of the existing area
under horticultural crops and also brought in new planting under horticultural crops.
Table 5.3.2: Did NHM help households to increase their area under horticultural crops
(percentage of households saying yes to the following questions)
Description Marginal Small Medium Large Total
available good quality planting material like
nursery 100.00 100.00 100.00 100.00 100.00
Rejuvenation with improved cultivars 95.00 96.00 100.00 97.00 97.75
Upgrading the existing tissue culture unit
Mother stock block maintenance under poly
cover to protect from adverse weather conditions 100.00 100.00 100.00 100.00 100.00
Raising root stock seedlings under net house
conditions 100.00 100.00 100.00 100.00 100.00
Poly house with ventilation, insect proof netting,
fogging and sprinkler irrigation 95.00 100.00 100.00 100.00 98.75
Pump house to provide sufficient irrigation
with/without storage tank, community tank 100.00 90.00 95.00 95.00 95.00
Soil sterilization-steam sterilization system with
boilers -- -- -- --
Establishment of new garden or seed production 100.00 100.00 100.00 100.00 100.00
Protected cultivation like green house, shade net,
plastic tunnel etc 100.00 100.00 100.00 100.00 100.00
Precision farming implements, e.g., computer,
GPS, GIS, sensors and application control -- -- -- -- --
Promotion of integrated nutrient management or
integrated pest management 100.00 100.00 100.00 100.00 100.00
Help provided for organic farming (Vermi
compost unit, certification etc.) 100.00 100.00 100.00 100.00 100.00
Post harvest management like pack house,
storage unit, mobile processing unit etc. 100.00 100.00 100.00 100.00 100.00
Training and capacity building 100.00 100.00 100.00 100.00 100.00
Source: Primary Survey
5.3.3 NHM reaching to the households with resource provision in Bihar
Farmers in Bihar were benefitted through various promotional activities undertaken by the
state government through NHM. Table 5.3.3 shows the proportion of sample farmers
benefitted through these promotional activities. Needless to mention, besides establishment of
new gardens (45 per cent), provisions of many other crucial activities were supposed to have
significant impact on horticultural crops. However, the study finds that 27 per cent farmers
benefitted by making available good quality planting materials followed by promotion of
INM/IPM (26 per cent), training and capacity building (25 per cent) and help provided for

138
organic farming (24 per cent). But majority of sample farmers were benefitted only in few of
these activities. There was no help provided under various activities like rejuvenation,
upgrading the existing tissue culture, mother stock maintenance, raising root stock seedling,
poly house/pump house facility and post harvest management activities beside more
mechanical activities like precision farming. Therefore, one can conclude that the NHM
resource provision in Bihar was not satisfactory as farmers either were not provided the above
mentioned facilities or the farmers were not provided with the proper knowledge of the same
and as a result many of the farmers could not participate in availing the above mentioned help
under the NHM programme.
Table 5.3.3: Promotional activities of NHM to increase area under horticultural crops
% of households saying ‘yes’) Descriptions Marginal Small Medium Large Total
Making available good quality planting material like
nursery
3
(17.65)
8
(36.36)
11
(25.55)
5
(27.78)
27
(27.00)
Rejuvenation with improved cultivars 0
(0.00)
0
(0.00)
0
(0.00)
0
(0.00)
0
(0.00)
Upgrading the existing tissue culture unit 0
(0.00)
0
(0.00)
0
(0.00)
0
(0.00)
0
(0.00)
Mother stock block maintenance under poly cover to
protect from adverse weather conditions
0
(0.00)
0
(0.00)
0
(0.00)
0
(0.00)
0
(0.00)
Raising root stock seedlings under net house conditions 0
(0.00)
0
(0.00)
0
(0.00)
0
(0.00)
0
(0.00)
Polyhouse with ventilation, insect proof netting, fogging
and sprinkler irrigation
0
(0.00)
0
(0.00)
0
(0.00)
0
(0.00)
0
(0.00)
Pump house to provide sufficient irrigation with/without
storage tank, community tank
0
(0.00)
0
(0.00)
0
(0.00)
0
(0.00)
0
(0.00)
Soil sterilization-steam sterilization system with boilers 0
(0.00)
0
(0.00)
0
(0.00)
0
(0.00)
0
(0.00)
Establishment of new garden or seed production 11
(64.71)
10
(44.45)
20
(46.51)
4
(22.22)
45
(45.00)
Protected cultivation like green house, shade net, plastic
tunnel etc
0
(0.00)
0
(0.00)
0
(0.00)
0
(0.00)
0
(0.00)
Precision farming implements, e.g., computer, GPS, GIS,
sensors and application control
0
(0.00)
0
(0.00)
0
(0.00)
0
(0.00)
0
(0.00)
Promotion of integrated nutrient management or integrated
pest management
2
(11.76)
6
(27.27)
11
(25.58)
7
(38.89)
26
(26.00)
Help provided for organic farming (vermi compost unit,
certification etc.)
3
(17.65)
5
(22.73)
9
(20.93)
7
(38.89)
24
(24.00)
Post harvest management like pack house, storage unit,
mobile processing unit etc
0
(0.00)
0
(0.00)
0
(0.00)
0
(0.00)
0
(0.00)
Training and capacity building 4
(23.53)
7
(31.82)
3
(20.93)
5
(27.78)
25
(25.00)
Total 17
(100.0)
22
(100.0)
43
(100.0)
18
(100.0)
100
(100.0)
Source: Primary Survey
5.3.4 NHM reaching to the households with resource provision in Rajasthan
The Mission envisages coverage of large areas under improved varieties of horticultural crops.
As per the guidelines, the assistance amount will be provided on account of the expenditure
on planting material and cost of inputs including that for INM/IPM etc. Accordingly,
Rajasthan government provided assistance to the sample farmers cultivating aonla, mango,
papaya and coriander. Table 5.3.4a shows the sources of NHM resource procurement for
sample farmers during the period from 2004-05 to 2009-10. It may be noted that about 75 per
139
cent of total NHM resource procurement to the sample farmers was through Department of
Horticulture. The private nursery provided 15 per cent whereas the private shops provided 10
per cent of total NHM resource procurement to the beneficiary farmers.
Table 5.3.4a: Sources of NHM resource procurement for all crops during 2004-05 to 2009-10
(Percentage of households)
Department of
horticulture
Private
nursery
Fellow farmers Through contract
farming
Others (private
shops)
Marginal 68.18 15.91 0.00 0.00 15.91
Small 80.00 11.11 0.00 0.00 8.89
Medium 77.19 17.54 0.00 0.00 5.26
Large 74.07 14.81 0.00 0.00 11.11
Landless 0.00 0.00 0.00 0.00 0.00
Total 75.00 15.00 0.00 0.00 10.00
Source: Primary Survey
Table 5.3.4b: Promotional activities of NHM (No of HHs saying 'Yes')
Description Farmer categories
Marginal Small Medium Large Total
Making available good quality planting material like
nursery
42 44 56 54 196
(95.45) (97.78) (98.25) (100.00) (98.00)
Rejuvenation with improved cultivars 0 0 2 2 4
(0.00) (0.00) (3.51) (3.70) (2.00)
Upgrading the existing tissue culture unit 0
(0.00)
0 0 0 0
(0.00) (0.00) (0.00) (0.00)
Mother stock block maintenance under poly cover to
protect from adverse weather conditions
0 0 0 1 1
(0.00) (0.00) (0.00) (1.85) (0.50)
Raising root stock seedlings under net house conditions 0 0 0 1 1
(0.00) (0.00) (0.00) (1.85) (0.50)
Polyhouse with ventilation, insect proof netting,
fogging and sprinkler irrigation
1 16 40 44 101
(2.27) (35.56) (70.18) (81.48) (50.50)
Pump house to provide sufficient irrigation
with/without storage tank, community tank
0 0 1 0 1
(0.00) (0.00) (1.75) (0.00) (0.50)
Soil sterilization-steam sterilization system with boilers 0 0 0 0 0
(0.00) (0.00) (0.00) (0.00) (0.00)
Establishment of new garden or seed production 15 20 26 20 81
(34.09) (44.44) (45.61) (37.04) (40.50)
Protected cultivation like green house, shade net,
plastic tunnel etc
0 0 0 1 1
(0.00) (0.00) (0.00) (1.85) (0.50)
Precision farming implements, e.g., computer, GPS,
GIS, sensors and application control
0 0 0 0 0
(0.00) (0.00) (0.00) (0.00) (0.00)
Promotion of integrated nutrient management or
integrated pest management
35 38 56 53 182
(79.55) (84.44) (98.25) (98.15) (91.00)
Help provided for organic farming (vermi compost
unit, certification etc.)
0 0 3 3 6
(0.00) (0.00) (5.26) (5.56) (3.00)
Post harvest management like pack house, storage unit,
mobile processing unit etc
0 0 0 0 0
(0.00) (0.00) (0.00) (0.00) (0.00)
Training and capacity building 37 36 44 44 161
(84.09) (80.00) (77.19) (81.48) (80.50)
Total 44 45 57 54 200
(100.00) (100.00) (100.00) (100.00) (100.00)
Source: Primary Survey
Note: Figures in parentheses are per centages of HHs saying ' Yes'.
140
Farmers were also benefitted though various promotional activities undertaken through NHM.
Table 5.3.4b shows the proportion of sample farmers benefitted through these promotional
activities. The majority of sample farmers were benefitted by few of these activities. About 98
per cent farmers opined that they made use of available good quality planting material like
nursery through NHM. About 50.5 per cent farmers were found to use poly house with
ventilation, insect proof netting, fogging and sprinkler irrigation. Only 2.27 per cent of
marginal framers and 35.56 per cent of small farmers were associated with these activities. As
high as 91 per cent farmers said that they used and promoted integrated nutrient management
(INM) or integrated pest management (IPM). Also 40.5 per cent farmers said that they
established new garden or seed production unit with the use of NHM assistance. On an
average, about 80.5 per cent farmers said that they actively participated in the training and
capacity building programmes facilitated through NHM.
However, there were many other activities and provisions under NHM that were not utilized
by the sample farmers. None of the farmers were associated with upgrading the existing tissue
culture unit, soil sterilization and steam sterilization system with boilers, precision farming
implements, e.g., computer, GIP, GIS, sensors and application control. Not a single farmer
was found to use the modernized post harvest management system like pack house, storage
unit, mobile processing unit etc. It may be noted that only one farmer said that he adopted the
protected cultivation like green house, shade net, plastic tunnel etc. Only one medium farmer
was found to use the pump house to provide sufficient irrigation with/without storage tank or
community tank. Only 3 per cent farmers said that they started the vermi compost unit and
only one farmer was found to adopt organic farming. Only 2 per cent farmers had rejuvenated
orchard with improved cultivars. Only 4 farmers cultivating mango were found to rejuvenate
their mango orchards. Only one farmer said that he did mother stock block maintenance under
poly cover to protect from adverse weather. Only one farmer indicated of raising root stock
seedlings under net house conditions. Thus, there is huge scope for expanding these activities
among farmers. However, it was true that some farmers did not fulfill eligibility criteria to
avail some of the facilities provided under NHM.
5.3.5 NHM reaching to the households with resource provision in Tamil Nadu
One of the objectives of NHM scheme was to bring more area under horticultural crops with
improved varieties. NHM resource procurement particulars in Tamil Nadu are illustrated in
Table 5.3.5a. It is understood from the table that the source of resource procurement over 60
per cent of the sample respondents was department of horticulture followed by private nursery
(14 per cent). Other sources of procurements were fellow farmers and others from the period
2004-05 to 2009-10. Department of horticulture was the source of procurement for nearly 63
per cent of the marginal farmers and over 62 per cent of the small farmers which shows that
the government department of horticulture played a major role in the NHM resource
procurement
Table 5.3.5b shows the promotional activities of NHM. With regard to the question on
availability of good quality planting materials, like nursery. Nearly 95 per cent of the sample
households answered in the affirmative, whereas in the case of rejuvenation with improved
cultivators a majority (76 per cent) of sample households replied in the negative. Only 8.65
per cent of the sample respondents had poly house with ventilation, insect proof setting,
fogging and sprinkler irrigation. Table reveals that a majority (80 per cent) of the sample
households availed the facility of promotion of integrated nutrient management or integrated
pest management. A vast majority of 88 per cent of the sample households participated in the

141
training and capacity building program conducted under NHM scheme. However, other
promotional activities such as upgrading the existing tissue culture unit, mother stock block
maintenance under poly cover to protect from adverse weather conditions etc., were not
availed by any of the sample household.
Table 5.3.5a: Source of NHM resource procurement during 2004-05 to 2009-10 in Tamil
Nadu
(Per centage of household)
Farm Size Department of
Horticulture
Private
nursery
Fellow
farmers
Through
Contract farm
Others
Marginal 62.9 11.3 8.9 - 16.9
Small 62.1 21.6 8.10 - 8.10
Medium 52.6 26.3 5.26 - 15.8
Large 60.0 20.0 - - 20.00
Total 61.30 16.00 8.00 - 14.70 Source: Primary Survey
Table: 5.3.5b Promotional Activities of NHM (No of HHs saying Yes)
Description Marginal Small Medium Large Total
Making available good quality planting material like nursery 85
(95.5)
34
(91.9)
18
(95.0)
5
(100)
142
(94.7)
Rejuvenation with improved cultivators 21
(24.0)
9
(24.0)
5
(26.0)
1
(20.0)
36
(24.0)
Upgrading the existing tissue culture unit - - - - -
Mother stock block maintenance under poly cover to protect
from adverse weather conditions
- - - - -
Raising root stock seedlings under net house conditions - - - - -
Polyhouse with ventilation, insect proof netting, fogging and
sprinkler irrigation
5
(5.6)
4
(10.8)
3
(15.8)
1
(20.0)
4.37
(8.65)
Pump house to provide sufficient irrigation with /without
storage tank, community tank
- - - - -
Soil sterilization stem sterilization system with boilers - - - - -
Establishment of new garden or seed production 20
(22.5)
11
(29.7)
6
(31.6)
2
(40.0)
39
(26.0)
Protected cultivation like green house, shade net, plastic
tunnel
18
(20.2)
8
(21.6)
5
(26.3)
2
(40.0)
33
(22.0)
Precision farming implements - - 3
(15.8)
1
(20.0)
4
(2.6)
Promotion of integrated nutrient management or intigrated
pest management
70
(78.7)
30
(81.1)
15
(78.9)
5
(100.0)
120
(80.0)
Help provided for organic farming (vermin compost unit,
mobile processing unit)
- - - - -
Post harvest management like pack house, storage unit,
mobile processing unit
- - 3
(15.8)
3
(60.0)
6
(4.0)
Training and capacity building 81
(91.0)
33
(89.1)
15
(78.9)
3
(60.00)
132
(88.0)
Note: Figures in parentheses are per centage of HHs saying ‘Yes’
5.3.6 NHM reaching to the households with resource provision in West Bengal

142
In the present study we classify the sources of NHM resource procurement for pineapple and
mandarin oranges into six broad categories namely, i) Department of Horticulture, ii) Private
Nursery, iii) Open Market, vi) Fellow Farmers, v) Self owned, and vi) None (for those haven’t
procured saplings from any of the sources. Note that NHM resources here refer to provision of
saplings only, and not cash subsidies. Sources like contract farming has not been considered
as such contracts do not operate in the study region concerned.
Among these categories, private nurseries appear to play an important role in case of
provision of pineapple saplings, followed by the self-owned saplings and sapling obtained
from fellow farmers (Table 5.3.6a). A size-class-wise analysis reveals that while the larger
pineapple producers depend heavily on private nurseries, the smaller producers in contrast
grow sapling by themselves to a much greater extent. The role of fellow farmers also appears
significant in this respect. It is highly disturbing to note that provision of sapling from
government agencies is completely absent in case of pineapple cultivation. In the case of
mandarin oranges a majority of the saplings are purchased from open markets, while an even
greater proportion of farmers have not opted for any of the sources mentioned here. However,
8.67 per cent of farmers have obtained sapling directly from the Department of Horticulture.
Table 5.3.6a: Sources of NHM resource procurement (sapling) for selected crops in WB
during 2004-05 to 2009-10 (percentage of households)
Dept. of
Horticulture
Private
Nursery
Open
Market
Fellow
Farmers
Self
Owned
None All
Pineapple
Marginal 0.00 30.64 3.68 21.32 26.96 17.40 100.00
Small 0.00 34.62 15.38 24.36 16.67 8.97 100.00
Medium 0.00 41.67 27.78 16.67 5.56 8.33 100.00
Large 0.00 0.00 0.00 0.00 0.00 0.00 0.00
Total 0.00 32.33 8.17 21.83 23.00 14.67 100.00
Mandarin Orange
Marginal 8.84 1.53 38.44 4.08 1.36 47.11 100.00
Small 0.00 8.33 41.67 8.33 0.00 41.67 100.00
Medium 0.00 0.00 0.00 0.00 0.00 0.00 0.00
Large 0.00 0.00 0.00 0.00 0.00 0.00 0.00
Total 8.67 1.67 38.50 4.17 1.32 47.00 100.00
Source: Primary Survey
Needless to mention, besides better extension facilities and improved marketing and
processing infrastructure, provisions of many other crucial aspects is supposed to have
significant positive impact in upholding horticultural production and enhancement of
horticultural cultivation. However, the study finds that only a few beneficiary farmer
households were benefitted from such extension, development and crop promotion activities
(Table 5.3.6b). In fact, while about 24 per cent of the sample beneficiary households
benefitted of rejuvenation with improved varieties, only 28 per cent were benefitted through
training and capacity building activities. About 21 per cent of the farmers benefited from
increased availability of good quality planting materials like nursery.
It has been discussed earlier that the farmers engaged in mandarin orange cultivation were
dependent on organic manure and traditional methods of pest control. The mandarin orange
producers, on the other hand, were invasive to divulge active influence of fertilizer dealers
and middlemen in their areas. Post harvest management facilities like pack house, storage
units, and mobile processing units were seen nowhere in these areas. Obviously the

143
cumulative effect of non-existence and non-performance of such important items of modern
agriculture had negative impact on the growth of horticultural development in both the
districts studied in West Bengal.
Table 5.3.6b: Did NHM help households to increase their area under horticultural crops
(Per centage of households saying yes to the following questions)
Description Marginal Small Medium Large Total
Making available good quality planting
material like nursery 19 (22.89) 2 (14.29) 0 (0.00) 0 (0.00) 21 (21.00)
Rejuvenation with improved varieties 24 (28.92) 0 (0.00) 0 (0.00) 0 (0.00) 24 (24.00)
Upgrading the existing tissue culture unit 0 (0.00) 0 (0.00) 0 (0.00) 0 (0.00) 0 (0.00)
Mother stock block maintenance under poly
cover to protect from adverse weather 9 (10.84) 2 (14.29) 0 (0.00) 0 (0.00) 11 (11.00)
Raising root stock seedlings under net house
conditions 6 (7.23) 1 (7.14) 0 (0.00) 0 (0.00) 7 (7.00)
Polyhouse with ventilation, insect proof
netting, fogging and sprinkler irrigation 0 (0.00) 0 (0.00) 0 (0.00) 0 (0.00) 0 (0.00)
Pump house to provide sufficient irrigation
with/without storage tank, community tank 0 (0.00) 0 (0.00) 0 (0.00) 0 (0.00) 0 (0.00)
Soil sterilization-steam sterilization system
with boilers 0 (0.00) 0 (0.00) 0 (0.00) 0 (0.00) 0 (0.00)
Establishment of new garden or seed
production 14 (16.87) 3 (21.43) 0 (0.00) 0 (0.00) 17 (17.00)
Protected cultivation like green house, shade
net, plastic tunnel etc 0 (0.00) 0 (0.00) 0 (0.00) 0 (0.00) 0 (0.00)
Precision farming implements, e.g., computer,
GPS, GIS, sensors and application control 0 (0.00) 0 (0.00) 0 (0.00) 0 (0.00) 0 (0.00)
Promotion of integrated nutrient management
or integrated pest management 0 (0.00) 0 (0.00) 0 (0.00) 0 (0.00) 0 (0.00)
Help provided for organic farming (vermi
compost unit, certification etc.) 0 (0.00) 0 (0.00) 0 (0.00) 0 (0.00) 0 (0.00)
Post harvest management like pack house,
storage unit, mobile processing unit etc 0 (0.00) 0 (0.00) 0 (0.00) 0 (0.00) 0 (0.00)
Training and capacity building 18 (21.69) 9 (64.29) 1 (33.33) 0 (0.00) 28 (28.00)
Total 83
(100.00)
14
(100.00)
3
(100.00) 0 (0.00)
100
(100.00)
Source: Primary Survey
5.3.7 NHM reaching to the households with resource provision in Haryana
During the field survey, selected farmers were asked questions regarding role of the NHM in
area expansion under the horticultural crops. They opined that provision of seedling and
material inputs facilitated area expansion under these crops. Response of farmers related to
capacity building through training was not encouraging. Moreover, farmers’ responses
regarding provision of processing facilities, marketing and procurement were found
disappointing as none of them expressed positive opinion on implementation of these facilities
(Table 5.3.6).
The statistics presented in table highlights the importance of providing seedling and material
inputs in better outcomes of the Mission. Also, these findings indicate towards partial
implementation of the Mission since it does not provide crucial facilities such as marketing
and procurement to the beneficiaries. In fact, these facilities to the NHM beneficiaries can
play a major role in the development of horticultural sector in Haryana. Despite these

144
limitations, outcome in expanding area under horticultural crops has been found encouraging
at the state level. But, potential could be realized better with area expansion under these crops
in districts like Gurgaon and Kaithal. Further, coverage of the Mission in terms of farmers is
low as compared to requirement to diversity cropping pattern and to enhance livelihood
security of the farmers through adoption of horticultural crops. In order to realize yield
potential, government will have to bridge demand supply gap that afflicts the availability of
quality seedlings/seeds, remodel agriculture extension services and leverage private sector
capabilities to encourage processing of fruits.
Table 5.3.7: Did NHM help farm households to increase their area under horticultural crops
(Percentage of farmers saying yes)
Source: Primary Survey
5.4 Subsidy provision under National Horticulture Mission
5.4.1 Subsidy provision under NHM in Karnataka
Table 5.4.1 shows the details of the activities and crops for which subsidy was provided under
NHM, investment undertaken by the selected households and the share of subsidy amount
provided out of total investment. Among the 212 selected farmers growing horticultural crops,
subsidy was provided for short and long term investment on the farm including drip irrigation,
poly cover, bird net and green house, community and cement water tank, HTP spray pump
among long term investment and nursery, seedling and plantation, fertilizer and plant
protection pesticide, neem oil and neem powder and maintenance activities among the short
term investment.
Item Marginal Small Medium Large Total
Making available good quality planting material like nursery 100 100 100 100 100
Rejuvenation with improved cultivars - - - - -
Upgrading the existing tissue culture unit - - - - -
Mother stock block maintenance under poly cover to protect
from adverse weather conditions
- - - - -
Raising root stock seedlings under net house conditions - - - - -
Polyhouse with ventilation, insect proof netting, fogging and
sprinkler irrigation
- - - - -
Pump set to provide sufficient irrigation with/without storage
tank, community tank
- - 3.45 1 1.33
Soil sterilization-steam sterilization system with boilers - - 3.45 - 0.67
Establishment of new garden or seed production - - - - -
Protected cultivation like green house, shade net, plastic
tunnel etc
- - - - -
Precision farming implements, e.g., computer, GPS,GIS,
sensors and application control
- - 3.45 - 0.67
Promotion of integrated nutrient management or integrated
pest management
- - - - -
Help provided for organic farming (vermi-compost unit,
certification etc.)
- - - 1 0.67
Post harvest management like pack house, storage unit,
mobile processing unit, etc
- - - -
Training and capacity building 37.5 23.08 27.59 23 24.67

145
Table 5.4.1: Details of subsidy provided under NHM in Karnataka
SN Details of the items Marginal Small Medium Large Total
details of activities for which subsidy was provided (% of households)
1 Drip Irrigation 3.4 27.0 62.9 65.5 36.3
2 Fertilizer and Pesticide Plant protection 23.7 36.5 22.9 21.8 26.9
3 HTP Spray Pump 3.4 1.6 8.6 21.8 8.5
4 Neem Oil and Neem Powder 10.2 11.1 2.9 5.5 8.0
5 Nursary, Seedling and Plantation 52.5 39.7 40.0 47.3 45.3
6 Polycover, Bird net and Green house 0.0 1.6 5.7 10.9 4.2
7 Community and Cement Water Tank 3.4 0.0 0.0 1.8 1.4
8 Maintenance and others 35.6 19.0 11.4 14.5 21.2
Crops wise distribution of farmers obtaining subsidy (% of households)
1 Grape 2.6 20.9 44.4 64.4 34.5
2 Pomegranate 10.3 27.9 31.5 23.1 22.7
3 Floriculture 56.4 26.7 7.4 4.8 23.6
4 Aromatic and medicinal plants 21.8 23.3 14.8 2.9 14.9
5 Other tree crops 9.0 1.2 1.9 4.8 4.3
Sum Total 100.0 100.0 100.0 100.0 100.0
Amount of aggregate investment ( per acre of aggregate net sown area)
1 Drip Irrigation 678 8514 4846 1978 3187
2 Fertilizer and Pesticide Plant Protection 2008 1406 1707 477 852
3 HTP Spray Pump 131 17 131 273 211
4 Neem Oil and Neem Powder 117 127 2 7 27
5 Nursary, Seedling and Plantation 4897 5610 1260 892 1770
6 Polycover, Bird net and Green house 0 416 461 173 237
7 Community and Cement Water Tank 33 0 0 29 21
8 Maintenance and others 4575 1577 284 438 775
Sum Total 12439 17665 8690 4266 7080
Amount of subsidy provided by NHM ( per acre of aggregate net sown area)
1 Drip Irrigation 219 997 1701 729 878
2 Fertilizer and Pesticide Plant protection 752 588 369 95 233
3 HTP Spray Pump 35 17 73 109 88
4 Neem Oil and Neem Powder 91 71 2 2 16
5 Nursary, Seedling and Plantation 1765 1971 578 379 687
6 Polycover, Bird net and Green house 0 208 230 96 125
7 Community and Cement Water Tank 22 0 0 6 5
8 Maintenance and others 1478 426 113 202 283
Sum Total 4360 4277 3066 1618 2314
Subsidy as a per centage of investment (%)
1 Drip Irrigation 32.3 11.7 35.1 36.9 27.5
2 Fertilizer and Pesticide Plant protection 37.4 41.8 21.6 20.0 27.3
3 HTP Spray Pump 26.7 100.0 55.9 39.8 41.5
4 Neem Oil and Neem Powder 77.4 56.3 80.0 37.5 58.1
5 Nursary, Seedling and Plantation 36.0 35.1 45.9 42.4 38.8
6 Polycover, Bird net and Green house - 50.0 50.0 55.7 52.8
7 Community and Cement Water Tank 66.7 - - 20.9 24.5
8 Maintenance and others 32.3 27.0 39.9 46.0 36.5
Sum Total 35.1 24.2 35.3 37.9 32.7
Source: Own Field Survey
Among all activities, the highest numbers of households received subsidy was for nursery and
other planting material (45 per cent); drip irrigation (36 per cent); plant protection (27 per
cent); maintenance activities (21 per cent); while for other activities like spray pump, neem
protection, green house and water tank less than 10 per cent households obtained any subsidy.
Looking at the farm size and crop wise distribution of subsidy, marginal farmers obtained
higher subsidy for floriculture and medicinal crops as these farmers had higher share of these
crops in the cropping pattern of horticultural crops as discussed in Chapter 4. The distribution
of subsidy was almost even for all the four crops among small farmers while medium and
large farmers obtained much higher share of subsidy for grapes and pomegranate as their
146
share of horticultural crops was higher for these two crops. The aggregate amount of
investment per acre of total net sown area was around 7 thousand. The highest amount of
investment was on drip irrigation 3 thousand per acre of net sown area of all selected
household irrespective of the crop they were growing. Drip irrigation was followed by
planting material 1.8 thousand per acre of net sown area, and less than 1 thousand for
other activities like plant protection, maintenance and so on. Among various farm size
holdings, highest investment in the case of marginal farmers was on seedling material,
maintenance and plant protection. Small and medium farmers had highest investment on drip
irrigation, plant protection and plantation material. Likewise, large farmers invested highest
amount on drip irrigation followed by planting material and maintenance.
Out of total investment of 7 thousand per acre of net sown area, the subsidy amount was
2.3 thousand per acre. Subsidy was highest for drip irrigation, followed by plantation material,
maintenance, plant protection and so on. At the aggregate, subsidy proportion of total
investment was 33 per cent that varied from 35 per cent in the case of marginal farmers, 24
per cent for the small farmers, 35 per cent for the medium farmers and highest 38 per cent for
the large farmers. Among various activities, subsidy coverage of total investment exceeded 50
per cent for neem oil/powder and poly cover/green house albeit investment in these activities
was too small. Among the activities for which investment was high, namely drip irrigation,
planting material, plant protection and maintenance activities, the share of subsidy was 27 per
cent in the former two and around 36 per cent in the latter two.
5.4.2 Subsidy provision under NHM in Andhra Pradesh
Table 5.4.2 provides details of the items in which subsidy was provided and also details of
investment and the proportion of subsidy components in the total investment made. Out of
200 sample farmers, around 1/4th
of them were benefitted by the area expansion activity,
IPM/INM assistance and farm mechanization implements while only 2 beneficiaries
established organic farming units.
Table shows the details of subsidy provided by NHM on different components of mango and
sweet orange orchards for the sample farmers. Under area expansion, average household
investment was estimated at 42,192 while it was highest 67,488 for the large farmers and
lowest 20,093 for the marginal farmers. Per household subsidy provided towards plant
material, inputs, irrigation, inter cropping, etc., was 19,465 and it was highest 29979 for
the large farmers and lowest 8,334 for the marginal farmers. The subsidy as a per centage of
investment per household under area expansion programme ranged between 41 to 46 per cent
among the selected sample households. Under Integrated Pest Management (IPM) and
Integrated Nutrient Management (INM), NHM encouraged adoption of these techniques to
reduce the cost of production and to promote ecological horticulture. Under the scheme, 50
per cent cost as assistance provided to a maximum of 415 per acre on the inputs. Per
household investment under this activity was reported to be 21,534 on an average and the
subsidy amount for the same was recorded as 16,058 that was around 75 per cent of the total
investment amount.
NHM encouraged the promotion of organic farming in fruit crops and vegetables through
organic certification. Assistance was provided amounting to 15,000 per each unit under the
activity. Among our selected farmers in Andhra Pradesh, only two farmers had established
organic farming units. One farmer each from small and marginal farmers groups invested
37,300 and 41,250 on organic farming. On the investment on organic farming a subsidy
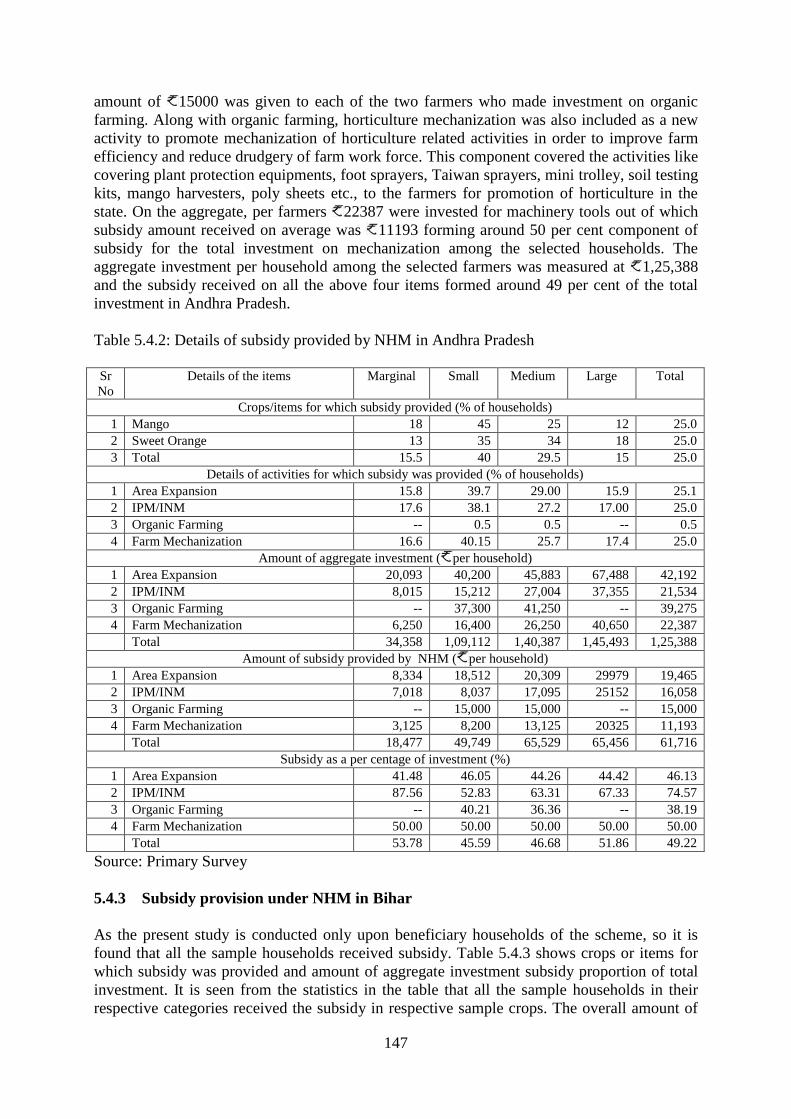
147
amount of 15000 was given to each of the two farmers who made investment on organic
farming. Along with organic farming, horticulture mechanization was also included as a new
activity to promote mechanization of horticulture related activities in order to improve farm
efficiency and reduce drudgery of farm work force. This component covered the activities like
covering plant protection equipments, foot sprayers, Taiwan sprayers, mini trolley, soil testing
kits, mango harvesters, poly sheets etc., to the farmers for promotion of horticulture in the
state. On the aggregate, per farmers 22387 were invested for machinery tools out of which
subsidy amount received on average was 11193 forming around 50 per cent component of
subsidy for the total investment on mechanization among the selected households. The
aggregate investment per household among the selected farmers was measured at 1,25,388
and the subsidy received on all the above four items formed around 49 per cent of the total
investment in Andhra Pradesh.
Table 5.4.2: Details of subsidy provided by NHM in Andhra Pradesh
Sr
No
Details of the items Marginal Small Medium Large Total
Crops/items for which subsidy provided (% of households)
1 Mango 18 45 25 12 25.0
2 Sweet Orange 13 35 34 18 25.0
3 Total 15.5 40 29.5 15 25.0
Details of activities for which subsidy was provided (% of households)
1 Area Expansion 15.8 39.7 29.00 15.9 25.1
2 IPM/INM 17.6 38.1 27.2 17.00 25.0
3 Organic Farming -- 0.5 0.5 -- 0.5
4 Farm Mechanization 16.6 40.15 25.7 17.4 25.0
Amount of aggregate investment ( per household)
1 Area Expansion 20,093 40,200 45,883 67,488 42,192
2 IPM/INM 8,015 15,212 27,004 37,355 21,534
3 Organic Farming -- 37,300 41,250 -- 39,275
4 Farm Mechanization 6,250 16,400 26,250 40,650 22,387
Total 34,358 1,09,112 1,40,387 1,45,493 1,25,388
Amount of subsidy provided by NHM ( per household)
1 Area Expansion 8,334 18,512 20,309 29979 19,465
2 IPM/INM 7,018 8,037 17,095 25152 16,058
3 Organic Farming -- 15,000 15,000 -- 15,000
4 Farm Mechanization 3,125 8,200 13,125 20325 11,193
Total 18,477 49,749 65,529 65,456 61,716
Subsidy as a per centage of investment (%)
1 Area Expansion 41.48 46.05 44.26 44.42 46.13
2 IPM/INM 87.56 52.83 63.31 67.33 74.57
3 Organic Farming -- 40.21 36.36 -- 38.19
4 Farm Mechanization 50.00 50.00 50.00 50.00 50.00
Total 53.78 45.59 46.68 51.86 49.22
Source: Primary Survey
5.4.3 Subsidy provision under NHM in Bihar
As the present study is conducted only upon beneficiary households of the scheme, so it is
found that all the sample households received subsidy. Table 5.4.3 shows crops or items for
which subsidy was provided and amount of aggregate investment subsidy proportion of total
investment. It is seen from the statistics in the table that all the sample households in their
respective categories received the subsidy in respective sample crops. The overall amount of

148
investment, which includes both variable and fixed costs, was 24345. Across farm size
categories, it was 5316 on marginal farms, 9830 on small farms, 65382 on medium
farms and 24345 at the aggregate. The amount of subsidy was given in two parts viz., in
terms of sapling and cash for maintenance in 2nd
& 3rd
year of the plantation subject to the
rates of survival of plants. The table reveals that the subsidy as a per centage of total
investment was 61.02 at aggregate. However, it was higher at 66.78 per cent on marginal
farms, followed by 60.65 per cent on small farms, 58.11 per cent on medium farms and 54.13
per cent on the large farms. It further reveals that the per centage of cash subsidy across the
farms was 2 to 4 times higher compared to the subsidy given in purchase of sapling for the
selected crops of maize and litchi.
Table 5.4.3: Details of subsidy provided by NHM in Bihar
S N Details of the items Marginal
Small
Medium
Large
Total
Crops/items for which subsidy provided (% of households)
1 Maize 10 (20.00) 9 (18.00) 22 (44.00) 9 (18.00) 50 (100.00)
2 Litchi 7 (14.00) 13 (26.00) 21 (42.00) 9 (18.00) 50 (100.00)
Details of activities for which subsidy was provided (% of households)
1 Area Expansion 17 (17.00) 22 (22.00) 43 (43.00) 18 (18.00) 100 (100.00)
Amount of aggregate investment ( per household)
1 Aggregate Investment
(Variable + Fixed)
5316.40 9830.50 20120.00 65382.50 24345.40
Amount of subsidy provided by NHM ( per household)
1 Sapling 1070 1650 2372 8040 3515
2 Cash 2480 4313 9319 27352 11340
3 Total 3550 5963 11691 35392 14855
Subsidy as a per centage of investment (%)
1 Sapling 20.13 16.78 11.79 12.30 14.44
2 Cash 46.65 43.87 46.32 41.83 46.58
3 Total 66.78 60.65 58.11 54.13 61.02
Source: Primary Survey
5.4.4 Subsidy provision under NHM in Rajasthan
Table 5.4.4 shows the details of subsidy provided under NHM in Rajasthan. Among 200
sample farmers who received subsidy under NHM, 50 farmers each cultivated aonla, papaya,
coriander and mango. In the case of farmers availing subsidy for aonla, 4 were marginal
farmers, 13 were small farmers, 18 were medium farmers and 15 were large farmers. Among
farmers availed subsidy for papaya, 21 were marginal farmers, 13 were small farmers, 8 were
medium farmers and 8 were large farmers. Among farmers availed subsidy for coriander, 7
were small farmers, 19 were medium farmers and 24 were large farmers. Among mango
farmers 19 marginal farmers, 12 small farmers, 7 medium and large farmers each, received
subsidy.
It may be seen from Table 5.4.4 that planting material, fertilizer, pesticides and other inputs
and drip/sprinkler were the major items for which subsidy was provided to the beneficiary
farmers in Rajasthan. Few farmers also received subsidy for the activities like establishing
vermi compost units and model nursery. Among the sample farmers, about 68 per cent aonla
growers, 22 per cent of papaya growers, 34 per cent of mango growers and 64 per cent of
coriander growers were subsidized for drip/sprinkler. Only one farmer cultivating papaya crop

149
got subsidy for establishing vermi compost unit while 3 other farmers cultivating coriander
and 2 farmers cultivating mango crop also got subsidy for establishing vermi compost units.
Only one model nursery was established by a large farmer for papaya crop with subsidy from
NHM.
Table 5.4.4: Details of subsidy provided by NHM in Rajasthan
Sl.
No.
Details of the items Marginal Small Medium Large Total
(A) Crop-wise distribution of farmers availing subsidy (% of households)
1 Anola 8 26 36 30 100
2 Papaya 42 26 16 16 100
3 Corriander 0 14 38 48 100
4 Mango 38 24 24 14 100
(B) Details of activities for which subsidy was provided (% of households)
1 Anola Planting Mat. 8 26 36 30 100
2 Fert.Pesticidses and other inputs 8 26 36 30 100
3 Drip/Spriklar 2 16 28 22 68
4 Varmi Compost 0 0 0 0 0
5 Model Nursury 0 0 0 0 0
6 Papaya Planting Mat. 42 26 16 16 100
7 Fert.Pesticidses and other inputs 42 26 16 16 100
8 Drip/Spriklar 0 4 10 8 22
9 Varmi Compost 0 0 0 2 2
10 Model Nursury 0 0 0 2 2
11 Corriander Planting Mat. 0 14 38 48 100
12 Fert.Pesticidses and other inputs 0 14 38 48 100
13 Drip/Spriklar 0 4 26 34 64
14 Varmi Compost 0 0 4 2 6
15 Model Nursury 0 0 0 0 0
16 Mango Planting Mat. 38 24 24 14 100
17 Fert.Pesticidses and other inputs 38 24 24 14 100
18 Drip/Spriklar 0 6 14 14 34
19 Varmi Compost 0 0 2 2 4
20 Model Nursury 0 0 0 0 0
(C) Amount of aggregate investment ( per household)
1 Anola Planting Mat. 4163 11204 8700 12870 10239
2 Fert.Pesticidses and other inputs 9713 26142 20300 30030 23891
3 Drip/Spriklar 4800 58846 30056 55091 38624
4 Varmi Compost 0 0 0 0 0
5 Model Nursury 0 0 0 0 0
6 Papaya Planting Mat. 1821 3423 5419 5494 3401
7 Fert.Pesticidses and other inputs 4249 7988 12644 12819 7935
8 Drip/Spriklar 0 4423 27375 33375 10870
9 Varmi Compost 0 0 0 7500 1200
10 Model Nursury 0 0 0 75000 12000
11 Corriander Planting Mat. 0 3631 5527 11796 8271
12 Fert.Pesticidses and other inputs 0 8472 12897 27523 19298
13 Drip/Spriklar 0 21429 45526 99688 68150
14 Varmi Compost 0 0 6316 2500 3600
15 Model Nursury 0 0 0 0 0
16 Mango Planting Mat. 2907 6345 10135 20181 7885
17 Fert.Pesticidses and other inputs 6784 14805 23648 47090 18399
18 Drip/Spriklar 0 7250 59750 124857 33560
19 Varmi Compost 0 0 5000 8571 1200
20 Model Nursury 0 0 0 0 0
Source: Primary Survey

150
Table 5.4.4: Details of subsidy provided by NHM in Rajasthan - Contd
Details of the items Marginal Small Medium Large Total
(D) Amount of subsidy provided by NHM ( per household)
1 Anola Planting Mat. 2875 7612 6524 9124 7295
2 Fert.Pesticidses and other inputs 6708 17760 15223 21290 17022
3 Drip/Spriklar 3360 41192 21039 2827 19401
4 Varmi Compost 0 0 0 0 0
5 Model Nursury 0 0 0 0 0
6 Papaya Planting Mat. 1217 2397 3945 3952 2398
7 Fert.Pesticidses and other inputs 2840 5593 9204 9220 5595
8 Drip/Spriklar 0 3096 19875 23288 7711
9 Varmi Compost 0 0 0 3750 600
10 Model Nursury 0 0 0 37500 6000
11 Corriander Planting Mat. 0 1720 2935 5603 4046
12 Fert.Pesticidses and other inputs 0 4013 6848 13074 9440
13 Drip/Spriklar 0 15714 32113 70052 48028
14 Varmi Compost 0 0 3158 1250 1800
15 Model Nursury 0 0 0 0 0
16 Mango Planting Mat. 1453 4639 8474 15120 5816
17 Fert.Pesticidses and other inputs 3391 10824 18228 35280 13200
18 Drip/Spriklar 0 5208 41825 87400 23524
19 Varmi Compost 0 0 2500 4286 1200
20 Model Nursury 0 0 0 0 0
(E) Subsidy as a per centage of investment (%)
1 Anola Planting Mat. 69.1 67.9 75 70.9 71.2
2 Fert.Pesticidses and other inputs 69.1 67.9 75 70.9 71.2
3 Drip/Spriklar 70 70 70 5.1 50.2
4 Varmi Compost 0 0 0 0 0
5 Model Nursury 0 0 0 0 0
6 Papaya Planting Mat. 66.8 70 72.8 71.9 70.5
7 Fert.Pesticidses and other inputs 66.8 70 72.8 71.9 70.5
8 Drip/Spriklar 0 70 72.6 69.8 0
9 Varmi Compost 0 0 0 50 50
10 Model Nursury 0 0 0 50 50
11 Corriander Planting Mat. 0 47.4 53.1 47.5 48.9
12 Fert.Pesticidses and other inputs 0 47.4 53.1 47.5 48.9
13 Drip/Spriklar 0 73.3 70.5 70.3 70.5
14 Varmi Compost 0 0 50 50 50
15 Model Nursury 0 0 0 0 0
16 Mango Planting Mat. 50 73.1 83.6 74.9 73.8
17 Fert.Pesticidses and other inputs 50 73.1 77.1 74.9 71.7
18 Drip/Spriklar 0 71.8 70 70 70.1
19 Varmi Compost 0 0 50 50 50
20 Model Nursury 0 0 0 0 0
Source: Primary Survey
Aggregate investment for planting material was highest 10239 per household in the case of
aonla crop and was lowest 3401 per household in the case of papaya crop. The aggregate
investment on fertilizer, pesticide and other inputs was highest 23891 per household in the
case of aonla crop. The aggregate investment on fertilizer, pesticide and other inputs in the
case of papaya, coriander and mango was 7935, 19298 and 18399 per household,
respectively. Coriander crop farmers invested highest aggregate amount 68150 on
drip/sprinkler while papaya growers invested lowest amount 10870 per household.
Coriander crop growers invested highest aggregate amount 3600 per household on vermi
compost unit whereas the mango and papaya growers spent lowest aggregate amount of

151
1200 per household each on the same. Papaya growers invested 12000 per household on
model nursery.
The amount of subsidy provided by NHM for planting material was highest 7295 per HH
for aonla crop and was lowest of 2398 for papaya crop. The amount of subsidy provided
through NHM for fertilizer, pesticides and other inputs was maximum 17022 per HH for
aonla crop whereas the papaya farmers received minimum amount of 5595 per HH for the
same. Coriander growers received highest subsidy amount of 48028 and 1800 per HH for
drip/sprinkler and vermi compost units, respectively. On the other hand, papaya growers
received minimum subsidy of 7711 and 600 per HH, for the above two purposes,
respectively. The papaya growers also received subsidy of 6000 per HH for establishing the
model nursery.
The farmers cultivating aonla received subsidy amount of 71.2 per cent of investment for each
of the planting material and fertilizer pesticides and other inputs. Medium farmers got highest
of 75 per cent subsidy for each of these activities whereas the small farmers received
minimum of 67.9 per cent subsidy for each of these activities. On an average, the farmers
cultivating aonla received 50.2 per cent subsidy for drip/sprinkler. The farmers cultivating
papaya received 70.5 per cent subsidy for each of the planting material and fertilizer
pesticides and other inputs. All papaya growers received the subsidy of 70.9 per cent for
drip/sprinkler. Large farmers cultivating papaya received the subsidy of 50 per cent for each
of vermi compost unit and model nursery.
The farmers cultivating coriander received the subsidy of 48.9 per cent for each of the
planting material and fertilizer pesticides and other inputs, which was the lowest than that for
the farmers cultivating other study crops. On an average, a coriander grower received 70.5 per
cent subsidy for drip/sprinkler, medium and large farmers cultivating coriander received 50
per cent each for establishing vermi compost unit. The farmers cultivating mango received the
subsidy of 73.8 per cent for planting material and 71.7 per cent for fertilizer, pesticides and
other inputs. Mango growers also received 50 per cent subsidy for establishing vermi compost
unit and 70.1 per cent subsidy for drip/sprinkler.
5.4.5 Subsidy provision under NHM in Tamil Nadu
The details of subsidy provided under NHM scheme in Tamil Nadu are depicted in Table
5.4.5. All the 150 sample households cultivating mango, banana and flowers availed subsidy.
The subsidy was provided for planting materials, fertilizer, pesticides, other inputs,
drip/sprinkler irrigation, vermi compost and modern nursery for all the three selected crops
mango, banana and flowers. All the 50 sample households growing mango crop received
subsidy for planting material, fertilizer, pesticides, other inputs and vermi compost. Forty
eight per cent of the sample respondents received subsidy for drip/sprinkler irrigation and
none of the sample farmers received subsidy for modern nursery. In the case of banana, none
of the sample respondents got subsidy for planting materials, drip/ sprinkler irrigation and
modern nursery while all respondents received subsidy for fertilizer, pesticides, other inputs
and vermi compost. All the 50 sample farmers of flowers availed the subsidy for fertilizer,
pesticides, other inputs and vermi compost. Majority of large and small size groups of
farmers availed drip/sprinkler irrigation subsidy and the total number of sample households
in this case was 15.

152
Table 5.4.5: Details of subsidy provided by NHM in Tamil Nadu
Details of the Items Marginal Small Medium Large Total
A) Cropwise distribution of farmers availing subsidy
Mango 31 12 6 1 50
Banana 29 13 6 2 50
Krishnagiri 29 12 7 2 50
B) Details of activities for which subsidy was provided ( no. of households)
Mango Planting Material 31 12 6 1 50
Fertilizers, pesticides and other inputs 31 12 6 1 50
Drip/Sprinkler 11 6 5 2 24
Vermi compost 31 12 6 1 50
Modern Nursery 0 0 0 0 0
Banana Planting Material 0 0 0 0 0
Fertilizers, pesticides and other inputs 29 13 6 2 50
Drip/Sprinkler 0 0 0 0 0
Vermi compost 29 13 6 2 50
Modern Nursery 0 0 0 0 0
Flowers Planting Material 0 0 0 0 0
Fertilizers, pesticides and other inputs 29 12 7 2 50
Drip/Sprinkler 5 3 4 3 15
Vermi compost 29 12 7 2 50
Modern Nursery 0 0 0 0 0
C) Amount of aggregate investment ( per household)
Mango Planting Material 2102 5200 9405 18218 4045
Fertilizers, pesticides and other inputs 3985 9870 17841 34545 7672
Vermi compost 10443 13702 22236 33800 13107
Drip/Sprinkler 996 2468 4460 8636 7475
Modern Nursery 0 0 0 0 0
Banana Planting Material 0 0 0 0 0
Fertilizers, pesticides and other inputs 4380 8865 16920 29160 8642
Drip/Sprinkler 0 0 0 0 0
Vermi compost 900 2025 4200 7290 1844
Modern Nursery 0 0 0 0 0
Flowers Planting Material 0 0 0 0 0
Fertilizers, pesticides and other inputs 1200 2970 0 0 1409
Drip/Sprinkler 5475 7905 18200 51870 9696
Vermi compost 218 525 0 0 253
Modern Nursery 0 0 0 0 0
D) Amount of subsidy provided by NHM ( per household)
Mango Planting Material 1617 4004 7238 14014 3113
Fertilizers, pesticides and other inputs 3066 7592 13724 26572 5901
Drip/Sprinkler 8033 10540 17105 26000 10083
Vermi compost 766 1898 3431 6643 1475
Modern Nursery 0 0 0 0 0
Banana Planting Material 0 0 0 0 0
Fertilizers, pesticides and other inputs 2920 5910 11280 19440 5361
Drip/Sprinkler 0 0 0 0 0
Vermi compost 600 1350 2800 4860 1230
Modern Nursery 0 0 0 0 0
Flowers Planting Material 0 0 0 0 0
Fertilizers , pesticides and other inputs 800 1980 0 0 940
Drip/Sprinkler 3650 5270 13685 39000 6858
Vermi compost 145 350 0 0 168
Modern Nursery 0 0 0 0 0
E) Subsidy as per centage of investment (%)
Mango Planting Material 70.00 70.00 70.00 70.00 70.00
Fertilizers, pesticides and other inputs 70.00 70.00 70.00 70.00 70.00
Drip/Sprinkler 70.00 70.00 70.00 70.00 70.00
Vermi compost 70.00 70.00 70.00 70.00 70.00
Modern Nursery 0.00 0.00 0.00 0.00 0.00
Banana Planting Material 0.00 0.00 0.00 0.00 0.00
Fertilizers, pesticides and other inputs 50.00 50.00 50.00 50.00 50.00
Drip/Sprinkler 0.00 0.00 0.00 0.00 0.00
Vermi compost 50.00 50.00 50.00 50.00 50.00
Modern Nursery 0.00 0.00 0.00 0.00 0.00
Flowers Planting Material 0.00 0.00 0.00 0.00 0.00
Fertilizers, pesticides and other inputs 50.00 50.00 0.00 0.00 25.00
Drip/Sprinkler 50.00 50.00 33.00 33.00 41.50
Vermi compost 50.00 50.00 0.00 0.00 25.00
Modern Nursery 0.00 0.00 0.00 0.00 0.00

153
Looking at the total investment undertaken by the beneficiaries, in the case of mango, the
highest amount of investment was on vermi compost which worked out to 13107 per
household whereas in the case of banana and flowers, the highest investment was on fertilizer,
pesticides and drip/sprinkler irrigation, respectively. The least investment of 7475 per
household could be found in drip and sprinkler irrigation in the case of mango crop. The
lowest amount of 1844 and 253 per household was invested on vermi compost in the case
of banana and flower crops, respectively. Across the different categories of farmers, large
farmers invested highest amount compared to other categories of farmers on fertilizers,
pesticides and other inputs per household in the case of mango and banana, respectively. The
lowest investment of 996 per household was made by marginal farmers on drip sprinkler
irrigation in case of mango crop. The same category invested the lowest amount on vermi
compost in case of banana and flowers per household compared to other categories of farmers.
It is significant to note that the highest subsidy amount of 10083 per household in the case
of mango was provided to drip/sprinkler irrigation whereas the lowest amount of 1475 per
household was given to vermi compost. Among the four categories of sample respondents, the
large farmers were provided the highest amount of subsidy per household to the tune of
26752 for fertilizer, pesticides and other inputs followed by 26000 for drip/sprinkler
irrigation incase of mango crop, whereas the lowest amount of 766 per household for vermi
compost was paid to marginal farmers. In the case of banana, subsidy was provided for only
two activities viz., fertilizer, pesticides, other inputs and vermi compost. The subsidy amount
provided for these two activities was 5361 and 1230 per household, respectively. As in the
case of mango the highest amount of subsidy per household was provided to large farmers
when compared to other three categories of farmers. In the case of flowers, the subsidy
provided per household on an average ranged from 168 to 6858. The highest amount of
subsidy was provided for drip/sprinkler irrigation.
The amount of subsidy formed 70 per cent of the total investment made each on planting
material, fertilizer, pesticides, other inputs, drip/sprinkler irrigation and vermi compost in case
of mango crop across all categories of sample farmers. In the case of banana, the quantum of
subsidy constituted a uniform 50 per cent of the investment, each on fertilizer, pesticides,
other inputs and drip/sprinkler irrigation for all the sample respondents. With regard to flower
crop, subsidy as a per centage of investment on fertilizer, pesticides and other inputs and drip
and sprinkler irrigation in the case of marginal and small famers each worked out to an equal
50 per cent while the overall average was 25 per cent. In the case of drip/sprinkler irrigation,
the subsidy amount received formed 41.50 per cent of the investment on average. The
medium and large farmers got an equal 33 per cent of the investment as subsidy under NHM
scheme. The average amount of subsidy as per centage of investment worked out to 25 per
cent for vermi compost.
5.4.6 Subsidy provision under NHM in West Bengal
The implementation of National Horticulture Mission with its basic conjecture of holistic
approach assigned due importance on subsidy provision for the resource-poor farmers. The
main component for which subsidy was provided was area expansion and rejuvenation (Table
5.4.6). In fact, while 56 per cent of the households received subsidy under area expansion
programme, another 23 per cent received subsidy for rejuvenation programme. Apart from
these two groups, the rest 21 per cent got subsidy was under both the programmes. The
aggregate investment that was undertaken by the households was 27158, on an average,
while large farmers invested 171088 and the marginal farmers only 18000. The amount of

154
subsidy provision was very low, only 698 at the aggregate whereby large farmers obtained
1800 per household while marginal farmers obtained only 547. It comes out that the total
value of subsidy provided under the scheme through cash/sapling formed only 3.85 per cent of
the total investment made, which in the case of marginal farmers was 5 per cent of the
investment while it was only 1 per cent in the case of large farmers.
Table 5.4.6: Details of subsidy provided by NHM in West Bengal
Sl
No
Details of the items Marginal Small Medium Large Total
Crops/items for which subsidy provided (% of households)
1 Pineapple 34 (34.0) 13 (13.0) 3 (3.0) 0 (0.0) 50 (50.0)
2 Mandarin Oranges 49 (49.0) 1 (1.0) 0 (0.0) 0 (0.0) 50 (50.0)
3 None 0 (0.0) 0 (0.0) 0 (0.0) 0 (0.0) 0 (0.0)
4 None 0 (0.0) 0 (0.0) 0 (0.0) 0 (0.0) 0 (0.0)
Details of activities for which subsidy was provided (% of households)
1 Area Expansion 39 (39.0) 14 (14.0) 3 (3.0) 0 (0.0) 56 (56.0)
2 Rejuvenation 23 (23.0) 0 (0.0) 0 (0.0) 0 (0.0) 23 (23.0)
3 Both Area Expansion &
Rejuvenation
21 (21.0) 0 (0.0) 0 (0.0) 0 (0.0) 21 (21.0)
4 None 0 (0.0) 0 (0.0) 0 (0.0) 0 (0.0) 0 (0.0)
Amount of aggregate investment (Rs per household)
1 Aggregate Investment (Variable +
Fixed)
18000.30 50610.11 171088.46 0.00 27158.32
2 None 0.00 0.00 0.00 0.00 0.00
3 None 0.00 0.00 0.00 0.00 0.00
4 None 0.00 0.00 0.00 0.00 0.00
Amount of subsidy provided by NHM (Rs per household)
1 Cash 546.69 1357.14 1800.00 0.00 697.7
2 Sapling 418.86 0.00 0.00 0.00 347.60
3 Total Subsidy 965.54 1357.14 1800.00 0.00 1045.40
4 None 0.00 0.00 0.00 0.00 0.00
Subsidy as a per centage of investment (%)
1 Cash 3.04 2.68 1.05 0.00 2.57
2 Sapling 2.33 0.00 0.00 0.00 1.28
3 Total Subsidy 5.36 2.68 1.05 0.00 3.85
4 None 0.00 0.00 0.00 0.00 0.00
Source: Prmiary Survey
5.4.7 Subsidy provision under NHM in Haryana
Agricultural subsidies played an important role in the growth of agricultural sector in
Haryana. Moreover, subsidies have been an integral part of government programmes launched
from time to time to increase productivity of the crops and for the development of emerging
agricultural sectors such as horticulture. An examination of Table 5.4.7 reveals that growers
of selected horticultural crops, i.e., kinnow, guava, aonla and garlic received subsidy under the
scheme. The highest per centage of farmers receiving subsidy was noticed for kinnow
followed by guava. Subsidies were provided for seedling, fertilizer, pesticides, drip irrigation
and water tank. It seems that every beneficiary received subsidy for seedling. In particular,
subsidy for water tank and drip irrigation was availed only by large farmers.
The total investment by the beneficiary farmers varied for different components viz., the
highest amount was invested on water tank followed by seedling, drip irrigation, fertilizer and
pesticides and maintenance. The subsidies provided in value terms, for seedling was 13307

155
per household and large farmers were the greatest beneficiaries. The average subsidy utilized
for creation of water tank was as high as 138986 per beneficiary. On the other hand,
negligible amount of subsidy was utilized for spray pumps. We have also computed share of
subsidy in total investment by the beneficiary farmers for seedling, fertilizer, pesticides, spray
pumps, drip irrigation and water tanks. The highest share was noticed for seedling followed
by water tank and drip irrigation. As expected, wide variations were noticed across various
classes of farmers and subsidy per centage ranged from nil to 100 per cent (Table 5.4.7).
Table 5.4.7: Details of subsidy provided under the NHM in Haryana
Source: Primary Survey
5.5 Capacity building under National Horticulture Mission
Capacity building at the farmers’ end through training of the households and trainers at the
village level, frontline demonstrations, advertisement and publicity constitutes elementary part
of NHM programme. Under this component, extension workers of the Horticultural
Sl
No.
Item Marginal Small Medium Large Total
Crops for which subsidy provided (per cent of grower)
1 Kinnow 0.00 38.46 41.38 76.00 62.00
2 Guava 87.50 53.85 44.83 20.00 31.33
3 Aonla 0.00 0.00 6.90 4.00 4.00
4 Garlic 12.50 30.77 27.59 11.00 16.00
Details of items for which subsidy was provided (per cent of grower)
1 Seedling 100.00 100.00 100.00 99.00 99.33
2 Fertilizer 100.00 100.00 65.52 55.00 63.33
3 pesticides 75.00 53.85 48.28 48.00 50.00
4 Maintenance 50.00 30.77 41.38 27.00 31.33
5 Spray pump 12.50 0.00 3.45 3.00 3.33
6 Drip irrigation 0.00 0.00 3.45 33.00 22.67
7 Water tank 0.00 0.00 0.00 39.00 26.00
Amount of aggregate investment (Rs per grower)
1 Seedling 1993.75 4156.15 4679.66 19494.76 14363.77
2 Fertilizer 2612.50 2592.31 2962.07 7594.00 5999.33
3 pesticides 1837.50 1307.69 2757.93 6434.50 5019.53
4 Maintenance 2700.00 2123.08 2920.69 3911.50 3500.33
5 Spray pump 112.50 0.00 27.59 34.00 34.00
6 Drip irrigation 0.00 0.00 0.00 16402.00 10934.67
7 Water tank 0.00 0.00 0.00 218100.00 145400.00
Amount of subsidy provided by NHM (Rs per grower)
1 Seedling 1993.75 3906.15 4549.31 17974.76 13307.57
2 Fertilizer 2400.00 2166.69 2799.83 5911.95 4798.38
3 pesticides 1837.50 1230.77 2757.93 4896.50 4004.87
4 Maintenance 2700.00 2123.08 2920.69 3911.50 3500.33
5 Spray pump 56.25 0.00 13.79 29.00 25.00
6 Drip irrigation 0.00 0.00 0.00 15237.06 10158.04
7 Water tank 0.00 0.00 0.00 208480.00 138986.67
Subsidy as a per centage of investment (per cent)
1 Seedling 100.00 93.98 97.21 92.20 92.65
2 Fertilizer 91.87 83.58 94.52 77.85 79.98
3 pesticides 100.00 94.12 100.50 76.10 79.79
4 Maintenance 100.00 100.00 100.00 100.00 100.00
5 Spray pump 50.00 0.00 50.00 85.29 73.53
6 Drip irrigation 0.00 0.00 0.00 92.90 92.90
7 Water tank 0.00 0.00 0.00 95.59 95.59

156
Departments of state government, agricultural universities and various other agencies hold
training programme for the farmers to disseminate knowledge about various aspects of
horticulture cultivation, post harvest management and basic processing and packaging of the
horticultural products.
5.5.1 Capacity building under NHM in Karnataka
Among our selected sample farmers only a few reported of having attended any capacity
building and obtained such knowledge through training programmes under NHM. Table 5.5.1
shows training and dissemination facility provided to the sample farmers by various
departments as well as the place where training was held and the frequency of such trainings.
It may be noted that the training was provided to the sample farmers by various departments
albeit numbers of household reported having obtained training was really very small. State
Horticulture Department and Krishi Vigyan Kendra (KVK) under agricultural universities
were found to arrange more number of trainings followed by Kisan Call Centre, Cooperatives
and other local bodies.
Table 5.5.1: Sources of training/dissemination activity provided to the farmers under NHM
Details of training Marginal Small Medium Large Total
Training provided to the households (per centage)
State Horticulture Department 5.1 9.5 17.1 14.5 10.8
State Agricultural University / KVKs 1.7 3.2 5.7 5.5 3.8
Kisan Call Centre 1.7 0.0 0.0 0.0 0.5
Cooperatives / Local Bodies 0.0 0.0 0.0 1.8 0.5
Input Dealers/
Private Company Representatives
0.0 0.0 2.9 0.0 0.5
Any other 1.7 0.0 2.9 9.1 3.3
Place where training was held (per centage of hh)
Within village 3.4 3.2 5.7 3.6 3.8
Nearby village 3.4 4.8 2.9 1.8 3.3
Nearby town 1.7 1.6 5.7 3.6 2.8
District headquarters 1.7 1.6 2.9 16.4 5.7
State capital 0.0 1.6 2.9 0.0 0.9
Any other 0.0 0.0 8.6 5.5 2.8
Average no of days training held 3.3 1.5 2.6 5.8 3.8
Frequency (no of times training
held)
1.3 2.4 1.6 2.1 1.9
Source: Primary Survey
On average, around 11 per cent of the selected households indicated that they attended such
trainings held by the State Horticultural Department and 4 per cent selected households
reported that they attended training held by the agricultural universities. The other sources of
training were only miniscule. Trainings were mostly held within or nearby village, town or in
the nearest district headquarters. The numbers of days of training was mostly for 3 to 4 days
and it was held once or twice in a year’s time.
The per centage of households attending training was higher among medium and large
farmers in comparison to marginal and small farmers. Whereas 15 per cent of large farmers
and 17 per cent of medium farmers attended training held by the Horticultural Department,
157
only 5 per cent marginal farmers and 10 per cent small farmers attended the same. In the case
of state agricultural universities also more than 5 per cent of medium and large farmers
attended training whereas only 2 per cent of marginal farmers and 3 per cent of small farmers
attended the same. As capacity building was not carried out to the desired extent, it had
consequences on farmers’ poor participation in some of the activities underlined in NHM like
upgrading existing tissue culture units, raising root stock seedling under net house conditions,
soil sterilization and precision farming implements like use of computer, GPS, GIS and
sensors.
5.5.2 Capacity building under NHM in Andhra Pradesh
The Mission is involved in Human Resource Development activities for promotion of
horticultural crops in Andhra Pradesh. Intensive trainings were given to the growers at the
field level and Horticultural Training Institutes were established at regional level, besides
conducting exposure visits to build the capacities and to transfer the technology for integrated
development of horticulture crops in the state. The beneficiaries identified under NHM would
invariably be covered under HRD progrmme especially, farmers identified for area expansion
programme, IPM/INM, organic farming, rejuvenation etc. The training programmes were
conducted by NHM as well as reputed private and NGO Sector. The ADH selected resource
persons including retired personal of horticulture department, KVK’s and progressive farmers
etc.
State Horticulture Mission was established at Hyderabad and nine Regional Horticulture
Training institutes were established in the state. The selected farmers expressed about training
activities provided by SHM scheme that are summarized in Table 5.5.2. Agricultural
University conducted one training programme at village level to supply good quality planting
material and also organized a training programme at district Head Quarters and Krishi Vigyan
Kendras also conducted one training programme for two days at district head quarters for the
gardeners. All categories of sample farmers attended this training programme. Kissan call
centre organized two days motivation programme for benefits of horticultural farmers at
village level during the reference year. On the whole, out of 200 farmers 97 per cent farmers
reported of having some capacity building. Input dealers organized two programmes, one
programme was conducted at mandal head-quarters and the other programme was organized
with in the village. Non-Governmental Organizations played a vital role in dissemination
activities.
5.5.3 Capacity building under NHM in Bihar
The sample farmers in Bihar availed the capacity building facility under NHM programme to
learn about the adoption of modern techniques in horticulture. Table 5.5.3 shows the different
aspects of training and dissemination facility provided to the sample farmers. It may be noted
that the training was provided to the sample farmers through various sources. Out of these
sources, the state department of horticulture was the prime one followed by the SAU, others
(friends, relatives and progressive farmers), KVKs and input dealers. On an average, the
frequency of the training organized was 1.33 times by the state department of horticulture,
0.04 times by SAU, 0.03 times by others, 0.02 times by KVK and 0.01 by input dealers.
Sources like Kisan Call Centres (KCCs), Co-operatives/Local Bodies, Special Research
Stations and NGOs did not play any role in providing extension backup to the sample farmers.
The training session arranged for about 0.59 day per household per year through state

158
department of horticulture followed by 0.04 day per household each by SAU and KVK and
0.01 day by input dealers and others.
Table 5.5.2: Sources of training/ dissemination activity provided to the farmers in AP Details of training Marginal Small Medium Large Total
Frequency if the training provided during the year
State Horticulture Department
State Agricultural University/Colleges 1 1 1 1 1
Krishi Vigyan Kendras 1 1 1 1 1
Kisan Call Centre
Cooperatives/ Local Bodies
Input Dealers/ Private Company representatives 2 2 2 2 2
Special Research Stations set up by the Government
Non Government Organizations (NGOs) 2 2 2 2 2
Average number of days per household during the year
State Horticulture Department
State Agricultural University/Colleges 2 2 2 2 2
Krishi Vigyan Kendras 1 1 1 1 1
Kisan Call Centre 2 2 2 2 2
Cooperatives/ Local Bodies
Input Dealers/ Private Company representatives 2 2 2 2 2
Special Research Stations set up by the Government
Non Government Organizations (NGOs) 4 3 4 4 4
Training sessions organized within village or nearby village (% of households)
State Horticulture Department
State Agricultural University/Colleges 100.00 100.00 100.00 100.00 100.00
Krishi Vigyan Kendras 90.91 95.65 90.91 100.00 94.00
Kisan Call Centre 95.65 90.91 100.00 100.00 97.00
Cooperatives/ Local Bodies
Input Dealers/ Private Company representatives 100.00 86.96 90.91 100.00 92.00
Special Research Stations set up by the Government
Non Government Organizations (NGOs) 100.00 100.00 100.00 100.00 100.00
Training sessions organized within town/district or state capital (% of households)
State Horticulture Department
State Agricultural University/Colleges 54.55 73.91 72.73 60.00 68.00
Krishi Vigyan Kendras 100.00 100.00 100.00 100.00 100.00
Kisan Call Centre
Cooperatives/ Local Bodies
Input Dealers/ Private Company representatives 45.45 65.22 72.73 60.00 62.00
Special Research Stations set up by the Government
Non Government Organizations (NGOs) 63.64 73.91 72.73 60.00 70.00
Source: Primary Survey
It may also be noted that about 52 per cent of the sample households got the training within
the village or nearby village by state department of horticulture followed by KVK (3 per cent
of the sample households) and input dealers and others (2 per cent of the sample households).
Further, majority of the sample farmers preferred to attend the training within the village or
nearby village, thereby only 2 per cent or less of the sample farmers attended the trainings
outside their own village or nearby village meaning thereby in town or state capital. Thus, the
training provided among the selected households was only once during the NHM period and
mostly it was organized by the State Horticulture Department. The training on an average was
only for half a day per beneficiary and more than 50 per cent of the beneficiaries attended the
training only within the village.

159
Table 5.5.3: Sources of Training/Dissemination Activity Provided to the Farmers in Bihar
Details of training Marginal
Small
Medium
Large
Total
Frequency of the training provided during the year
State Horticulture Department 1.22 1.37 1.44 1.29 1.33
State Agricultural University / Colleges 0.00 0.00 0.00 0.15 0.04
Krishi Vigyan Kendras 0.00 0.00 0.07 0.02 0.02
Kisan Call Centre 0.00 0.00 0.00 0.00 0.00
Cooperatives / Local Bodies 0.00 0.00 0.00 0.00 0.00
Input Dealers / Private Company Representatives 0.03 0.00 0.02 0.00 0.01
Special Research Stations set up by the Government 0.00 0.00 0.00 0.00 0.00
Non Government Organisations (NGOs) 0.00 0.00 0.00 0.00 0.00
Any other (Relative/Prog. Farmers, etc.) 0.00 0.00 0.00 0.13 0.03
Average number of days per household during the year
State Horticulture Department 0.67 0.53 0.59 0.56 0.59
State Agricultural University / Colleges 0.00 0.00 0.00 0.16 0.04
Krishi Vigyan Kendras 0.00 0.00 0.09 0.03 0.04
Kisan Call Centre 0.00 0.00 0.00 0.00 0.00
Cooperatives / Local Bodies 0.00 0.00 0.00 0.00 0.00
Input Dealers / Private Company Representatives 0.02 0.00 0.01 0.00 0.01
Special Research Stations set up by the Government 0.00 0.00 0.00 0.00 0.00
Non Government Organisations (NGOs) 0.00 0.00 0.00 0.00 0.00
Any other 0.00 0.00 0.00 0.06 0.01
Training sessions organized within village or nearby village (% of households)
State Horticulture Department 11.00 16.00 19.00 6.00 52.00
State Agricultural University / Colleges 0.00 0.00 0.00 0.00 0.00
Krishi Vigyan Kendras 0.00 0.00 2.00 1.00 3.00
Kisan Call Centre 0.00 0.00 0.00 0.00 0.00
Cooperatives / Local Bodies 0.00 0.00 0.00 0.00 0.00
Input Dealers / Private Company Representatives 2.00 0.00 0.00 0.00 2.00
Special Research Stations set up by the Government 0.00 0.00 0.00 0.00 0.00
Non Government Organisations (NGOs) 0.00 0.00 0.00 0.00 0.00
Any other 0.00 0.00 0.00 2.00 2.00
Training sessions organized within town/district or state capital (% of households)
State Horticulture Department 0.00 0.00 3.00 0.00 0.00
State Agricultural University / Colleges 0.00 0.00 0.00 2.00 2.00
Krishi Vigyan Kendras 0.00 0.00 0.00 0.00 0.00
Kisan Call Centre 0.00 0.00 0.00 0.00 0.00
Cooperatives / Local Bodies 0.00 0.00 0.00 0.00 0.00
Input Dealers / Private Company Representatives 0.00 0.00 1.00 0.00 1.00
Special Research Stations set up by the Government 0.00 0.00 0.00 0.00 0.00
Non Government Organisations (NGOs) 0.00 0.00 0.00 0.00 0.00
Any other 0.00 0.00 0.00 0.00 0.00
Source: Primary Survey
5.5.4 Capacity building under NHM in Rajasthan
In Rajasthan, under this component, the beneficiary farmers and extension personnel were
imparted training at different places at regular interval. Our sample farmers also availed this
facility under NHM programme to learn about the adoption of modern techniques in
horticulture. Table 5.5.4 shows the different aspects of training and dissemination facility
provided to the sample farmers. It may be noted that the training was provided to the sample
farmers through various sources on an average of 1.62 times per household per year. The
medium farmers participated in training and dissemination activities for the highest, 1.86
times, while the marginal farmers participated in training and dissemination activities for the
lowest of 1.34 times per household per year. State Horticulture Department and Krishi Vigyan
Kendra (KVK) were found to arrange more number of trainings of 0.65 and 0.61 times per
household per year, respectively whereas the Cooperatives/Local Bodies and Non

160
Government Organizations (NGOs) arranged less number of the training and dissemination
activities of 0.01 times per household per year, each.
Table 5.5.4: Sources of training/dissemination activity provided to the farmers in Rajasthan
Details of training Farmer categories
Marginal Small Medium Large Total
(A) Frequency of the training provided during the year (No. per household per year)
State Horticulture Department 0.52 0.78 0.65 0.65 0.65
State Agricultural University / Colleges 0.00 0.00 0.07 0.04 0.03
Krishi Vigyan Kendras 0.77 0.62 0.54 0.52 0.61
Kisan Call Centre 0.00 0.07 0.05 0.02 0.04
Cooperatives / Local Bodies 0.00 0.00 0.00 0.02 0.01
Input Dealers / Private Company Representatives 0.00 0.00 0.00 0.00 0.00
Special Research Stations set up by the Government 0.00 0.16 0.21 0.24 0.16
Non Government Organisations (NGOs) 0.00 0.00 0.02 0.00 0.01
Any other 0.05 0.02 0.32 0.07 0.13
All sources 1.34 1.64 1.86 1.56 1.62
(B) Average number of days per household during the year
State Horticulture Department 0.70 0.96 1.09 1.41 1.06
State Agricultural University / Colleges 0.00 0.00 0.00 0.19 0.05
Krishi Vigyan Kendras 1.73 0.11 1.04 0.98 0.97
Kisan Call Centre 0.00 0.04 0.04 0.09 0.05
Cooperatives / Local Bodies 0.00 0.00 0.00 0.13 0.04
Input Dealers / Private Company Representatives 0.00 0.00 0.00 0.00 0.00
Special Research Stations set up by the Government 0.00 0.47 0.44 0.67 0.41
Non Government Organisations (NGOs) 0.00 0.00 0.02 0.00 0.01
Any other 0.07 0.16 0.28 0.43 0.25
All sources 2.50 1.73 2.89 3.89 2.82
(C) Training sessions organized within village or nearby village (% of households)
State Horticulture Department 9.09 17.78 12.28 18.52 14.50
State Agricultural University / Colleges 0.00 0.00 0.00 0.00 0.00
Krishi Vigyan Kendras 15.91 0.00 12.28 9.26 9.50
Kisan Call Centre 0.00 0.00 0.00 0.00 0.00
Cooperatives / Local Bodies 0.00 0.00 0.00 0.00 0.00
Input Dealers / Private Company Representatives 0.00 0.00 0.00 0.00 0.00
Special Research Stations set up by the Government 0.00 0.00 0.00 0.00 0.00
Non Government Organisations (NGOs) 0.00 0.00 1.75 0.00 0.50
Any other 2.27 0.00 3.51 0.00 1.50
All sources 27.27 17.78 29.82 27.78 26.00
Table 5.7 Continued.
(D) Training sessions organized within town/district or state capital (% of households)
State Horticulture Department 22.73 20.00 22.81 20.37 21.50
State Agricultural University / Colleges 0.00 0.00 7.02 3.70 3.00
Krishi Vigyan Kendras 43.18 6.67 26.32 29.63 26.50
Kisan Call Centre 0.00 2.22 3.51 1.85 2.00
Cooperatives / Local Bodies 0.00 0.00 0.00 1.85 0.50
Input Dealers / Private Company Representatives 0.00 0.00 0.00 0.00 0.00
Special Research Stations set up by the Government 0.00 15.56 15.79 20.37 13.50
Non Government Organisations (NGOs) 0.00 0.00 0.00 0.00 0.00
Any other 0.00 2.22 5.26 7.41 4.00
All sources 65.91 46.67 80.70 85.19 71.00
Source: Primary Survey
As far as the number of days of training per household per year is concerned, the same table
also shows that, on an average, the training sessions arranged for about 2.82 days per

161
household per year through different agencies. The large farmers attended maximum of 3.89
days of training per household per year whereas small farmers attended minimum of 1.73 days
of training per household per year through different agencies. State horticulture department
and Krishi Vigyan Kendra (KVK) imparted training sessions of 1.06 days per household per
year and 0.97 days per household per year, respectively. On the other hand, as low as 0.04
days of training per household per year and 0.01 days of training per household per year
training were imparted through cooperatives/ local bodies and non government organizations
(NGOs), respectively.
It may also be noted that about 26 per cent training sessions were organized within village or
nearby village through different agencies out of which the State Horticulture Department and
Krishi Vigyan Kendra (KVK) organized 14.50 per cent and 9.50 per cent training sessions,
respectively. Among the farmer categories, medium farmers participated in about 29.82 per
cent training sessions whereas only 17.78 per cent training sessions were attended by small
farmers in their villages or their nearby villages. Unlike Bihar, majority of the training
sessions (71 per cent) were organized at town/district headquarters or state capital. About
85.19 per cent of such training sessions were attended by the large farmers while only 46.67
per cent of such training sessions were attended by the small farmers. State Horticulture
Department and Krishi Vigyan Kendra (KVK) organized as high as 21.50 per cent and 26.50
per cent training sessions within town/districts or state capital respectively. Special Research
Stations also organized training sessions within town/districts or state capital. About 15.56 per
cent, 15.79 per cent, and 20.37 per cent training sessions were attended by the small farmers,
medium farmers and large farmers respectively. Kisan Call Centre and cooperatives/local
bodies also organized 2.00 per cent and 0.50 per cent training sessions respectively within
town/districts or state capital.
5.5.5 Capacity building under NHM in Tamil Nadu
Training and demonstrations are necessary for the farmers to know the modern technologies
and methods of cultivation and practice them on the field. Imparting training to the farmers as
well as to the extension workers and capacity building were considered as a part of the NHM
scheme in Tamil Nadu. The sample beneficiary farmers participated in the training
programme and availed the facilities under NHM. The information regarding the sources of
training and dissemination activities provided to the sample respondents is presented in Table
5.5.5.
As far as frequency of the training was concerned it was 1.87 times per household per year
through all sources. The frequency of training provided to large farmers on an average
worked out to 2.23 times per household per year which was found to be the highest frequency
among all the four categories of sample respondents and the lowest being 1.55 per cent in case
of marginal farmers. Training was imparted by different sources and among them the State
Horticulture Department stood first with a frequency of 0.66 timed on an average per
household per year followed by Krishi Vigyan Kendras (0.58 times), while the Kisan Call
centre provided the least frequency of 0.15 times, on an average per household per year. The
average number of days training provided through all sources was 2.75 per household per year
whereas it was high at 3.83 days for large farmers. The average number of days training
provided was the lowest for small farmers as the figures worked out to 1.87 days per
household per year. Among the different sources of training, the State Horticulture
Department occupied the first place with an average number of 1.10 days of training per
household during the year closely followed by Krishi Vigyan Kendra (1.09 days). It is evident
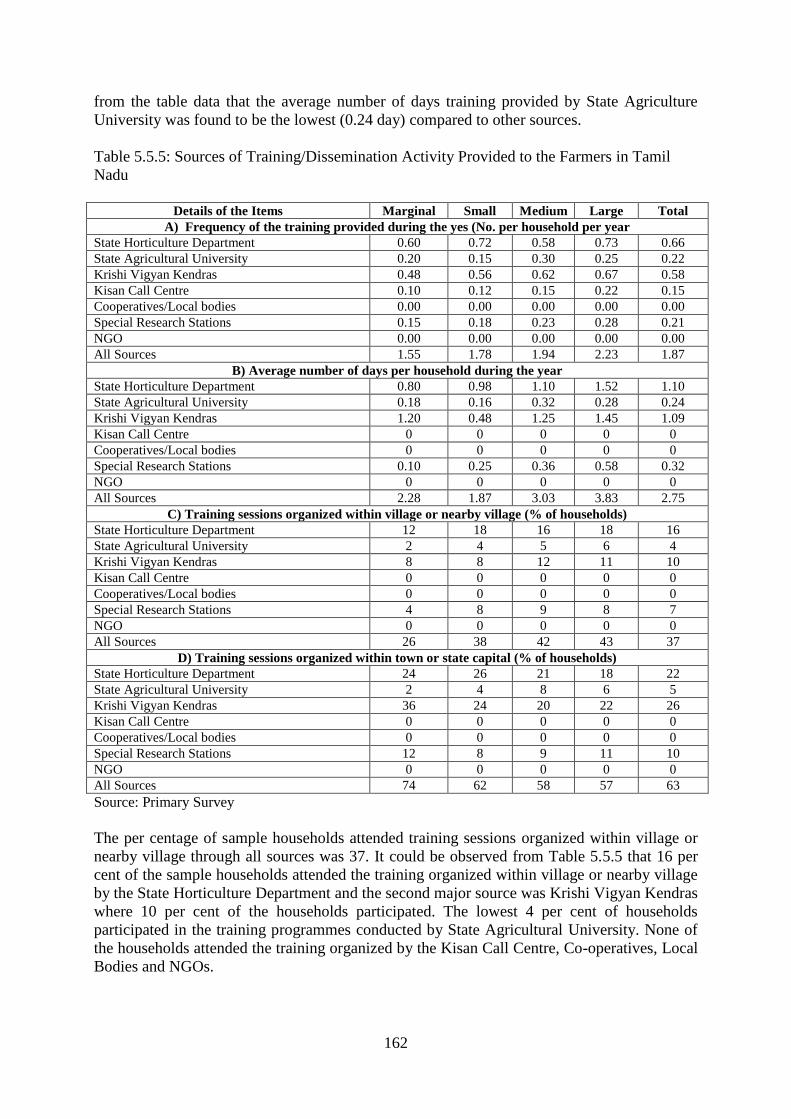
162
from the table data that the average number of days training provided by State Agriculture
University was found to be the lowest (0.24 day) compared to other sources.
Table 5.5.5: Sources of Training/Dissemination Activity Provided to the Farmers in Tamil
Nadu
Details of the Items Marginal Small Medium Large Total
A) Frequency of the training provided during the yes (No. per household per year
State Horticulture Department 0.60 0.72 0.58 0.73 0.66
State Agricultural University 0.20 0.15 0.30 0.25 0.22
Krishi Vigyan Kendras 0.48 0.56 0.62 0.67 0.58
Kisan Call Centre 0.10 0.12 0.15 0.22 0.15
Cooperatives/Local bodies 0.00 0.00 0.00 0.00 0.00
Special Research Stations 0.15 0.18 0.23 0.28 0.21
NGO 0.00 0.00 0.00 0.00 0.00
All Sources 1.55 1.78 1.94 2.23 1.87
B) Average number of days per household during the year
State Horticulture Department 0.80 0.98 1.10 1.52 1.10
State Agricultural University 0.18 0.16 0.32 0.28 0.24
Krishi Vigyan Kendras 1.20 0.48 1.25 1.45 1.09
Kisan Call Centre 0 0 0 0 0
Cooperatives/Local bodies 0 0 0 0 0
Special Research Stations 0.10 0.25 0.36 0.58 0.32
NGO 0 0 0 0 0
All Sources 2.28 1.87 3.03 3.83 2.75
C) Training sessions organized within village or nearby village (% of households)
State Horticulture Department 12 18 16 18 16
State Agricultural University 2 4 5 6 4
Krishi Vigyan Kendras 8 8 12 11 10
Kisan Call Centre 0 0 0 0 0
Cooperatives/Local bodies 0 0 0 0 0
Special Research Stations 4 8 9 8 7
NGO 0 0 0 0 0
All Sources 26 38 42 43 37
D) Training sessions organized within town or state capital (% of households)
State Horticulture Department 24 26 21 18 22
State Agricultural University 2 4 8 6 5
Krishi Vigyan Kendras 36 24 20 22 26
Kisan Call Centre 0 0 0 0 0
Cooperatives/Local bodies 0 0 0 0 0
Special Research Stations 12 8 9 11 10
NGO 0 0 0 0 0
All Sources 74 62 58 57 63
Source: Primary Survey
The per centage of sample households attended training sessions organized within village or
nearby village through all sources was 37. It could be observed from Table 5.5.5 that 16 per
cent of the sample households attended the training organized within village or nearby village
by the State Horticulture Department and the second major source was Krishi Vigyan Kendras
where 10 per cent of the households participated. The lowest 4 per cent of households
participated in the training programmes conducted by State Agricultural University. None of
the households attended the training organized by the Kisan Call Centre, Co-operatives, Local
Bodies and NGOs.

163
When compared to the per centage of sample households attended the training programme
organized within village or nearby village, the per centage of households participated in the
training organized within town or state capital by all sources was found to be more, the former
being 37 per cent the latter worked out to 63 per cent. Among the different categories of
farmers, the highest 74 per cent of marginal sample households participated in the training
organized within town or state capital by all farmers, whereas only 57 per cent of the large
farmers attended the same. The reason behind more per centage of sample households
preferred to attend the training organized within town or state capital might be due to their
inclination towards visiting towns and cities and to have a change of atmosphere.
5.5.6 Capacity building under NHM in West Bengal
It was presumed that the extension activities of the state and district horticultural officers with
training and dissemination activities might have a positive impact on area expansion,
rejuvenation and growing interest for enhancing horticultural cultivation among the farmers.
However, after compilation of information on all the aspects of capacity building, it was
revealed that such dissemination and extension activities provided by the district horticulture
and agriculture officials made only a sorry figure (Table 5.5.6). It is revealed by the statistics
that about 44 per cent of the households obtained training either from government or non-
government organizations. But the average number of days of training per households stood at
merely 0.71 days (0.41 days by State Horticulture Department and 0.30 days by NGOs), even
though the trainings were organized mostly nearby in the periphery of the villages.
In spite of the existence of numerous state-sponsored organizations, the survey found that
only the State Horticulture Department imparted training and provided extension services to
the farmers. The role of State Agricultural Universities and Colleges, Krishi Vigyan Kendras,
Kisan Call Centres, the Cooperatives and Local Bodies, and the Special Research Stations
made a very negligible impact on cultivation of horticultural crops in the study area. Although
the farmers were non-committal to divulge any fact about input dealers and private company
representatives, they (the farmers) vehemently argued for active participation and contribution
of such public enterprises for augmentation and agricultural development in the study area.
5.5.7 Capacity building under NHM in Haryana
The performance of different categories of farmers varied in terms of yield rates for kinnow,
guava, aonla and garlic in Haryana. Although, several factors determine yield rates, extension
through training plays an important role. Information provided in Table 5.5.7 reveals that
State Horticulture Department and Krishi Vigyan Kendras organized trainings for the
growers. Sometimes, training was organized by Research Stations. The data presented in the
table suggests that average number of trainings was less than two during 2008-09. The time of
training was less than one day.
Frequency of the training provided by the State Horticulture Department to NHM
beneficiaries was 1.75 trainings during the year 2008-09. Further, marginal farmers received
one training against two reported by other categories of farmers. In addition, State Agriculture
Universities organized one and two trainings for small and large farmers during the same year.
It seems that training was given for a very short duration. There is no evidence of trainings
organized by any institution within the village or nearby village. Beneficiaries of the NHM
opined that training should be organized frequently to update their knowledge on technology
related aspects. Participation of the sample farmers in the NHM training as revealed by Table

164
5.5.7 around 20.67 per cent of the farmers attended training organized by the State
Department of Horticulture as these farmers were beneficiaries of the Mission. Respondents
informed during the discussion that they were not satisfied with the training programmes
organized by various institutions to impart knowledge about activities and package of
practices for cultivation of horticultural crops under the Mission. Moreover, training was of
very short duration and it was not sufficient to provide full details.
Table 5.5.6: Sources of training/dissemination activity provided to the farmers in WB
Details of training Marginal Small Medium Large Total
Per centage of Households provided with training 33 (39.76) 9 (64.29) 2 (66.67) 0 (0.00) 44
(44.00)
Frequency of the training provided during the year (per household)
State Horticulture Department 0.52 1.64 1.67 0.00 0.71
State Agricultural University / Colleges 0.00 0.00 0.00 0.00 0.00
Krishi Vigyan Kendras 0.00 0.00 0.00 0.00 0.00
Kisan Call Centre 0.00 0.00 0.00 0.00 0.00
Cooperatives / Local Bodies 0.00 0.00 0.00 0.00 0.00
Input Dealers / Private Company Representatives 0.00 0.00 0.00 0.00 0.00
Special Research Stations set up by the
Government 0.00 0.00 0.00 0.00 0.00
Non Government Organizations (NGOs) 0.18 0.00 0.00 0.00 0.15
Any other 0.00 0.00 0.00 0.00 0.00
Average number of days per household during the year
State Horticulture Department 0.52 1.64 1.67 0.00 0.41
State Agricultural University / Colleges 0.00 0.00 0.00 0.00 0.00
Krishi Vigyan Kendras 0.00 0.00 0.00 0.00 0.00
Kisan Call Centre 0.00 0.00 0.00 0.00 0.00
Cooperatives / Local Bodies 0.00 0.00 0.00 0.00 0.00
Input Dealers / Private Company Representatives 0.00 0.00 0.00 0.00 0.00
Special Research Stations set up by the
Government 0.00 0.00 0.00 0.00 0.00
Non Government Organisations (NGOs) 0.36 0.00 0.00 0.00 0.30
Any other 0.00 0.00 0.00 0.00 0.00
Training sessions organized within village or nearby village (% of households)
State Horticulture Department 18 (18.0) 9 (9.0) 2 (2.0) 0 (0.0) 29 (29.0)
State Agricultural University / Colleges 0 (0.0) 0 (0.0) 0 (0.0) 0 (0.0) 0 (0.0)
Krishi Vigyan Kendras 0 (0.0) 0 (0.0) 0 (0.0) 0 (0.0) 0 (0.0)
Kisan Call Centre 0 (0.0) 0 (0.0) 0 (0.0) 0 (0.0) 0 (0.0)
Cooperatives / Local Bodies 0 (0.0) 0 (0.0) 0 (0.0) 0 (0.0) 0 (0.0)
Input Dealers / Private Company Representatives 0 (0.0) 0 (0.0) 0 (0.0) 0 (0.0) 0 (0.0)
Special Research Stations set up by the
Government 0 (0.0) 0 (0.0) 0 (0.0) 0 (0.0) 0 (0.0)
Non Government Organisations (NGOs) 15 (15.0) 0 (0.0) 0 (0.0) 0 (0.0) 15 (15.0)
Any other 0 (0.0) 0 (0.0) 0 (0.0) 0 (0.0) 0 (0.0)
Training sessions organized within town/district or state capital (% of households)
State Horticulture Department 0 (0.0) 0 (0.0) 0 (0.0) 0 (0.0) 0 (0.0)
State Agricultural University / Colleges 0 (0.0) 0 (0.0) 0 (0.0) 0 (0.0) 0 (0.0)
Krishi Vigyan Kendras 0 (0.0) 0 (0.0) 0 (0.0) 0 (0.0) 0 (0.0)
Kisan Call Centre 0 (0.0) 0 (0.0) 0 (0.0) 0 (0.0) 0 (0.0)
Cooperatives / Local Bodies 0 (0.0) 0 (0.0) 0 (0.0) 0 (0.0) 0 (0.0)
Input Dealers / Private Company Representatives 0 (0.0) 0 (0.0) 0 (0.0) 0 (0.0) 0 (0.0)
Special Research Stations set up by the
Government 0 (0.0) 0 (0.0) 0 (0.0) 0 (0.0) 0 (0.0)
Non Government Organisations (NGOs) 0 (0.0) 0 (0.0) 0 (0.0) 0 (0.0) 0 (0.0) Source: Primary Survey
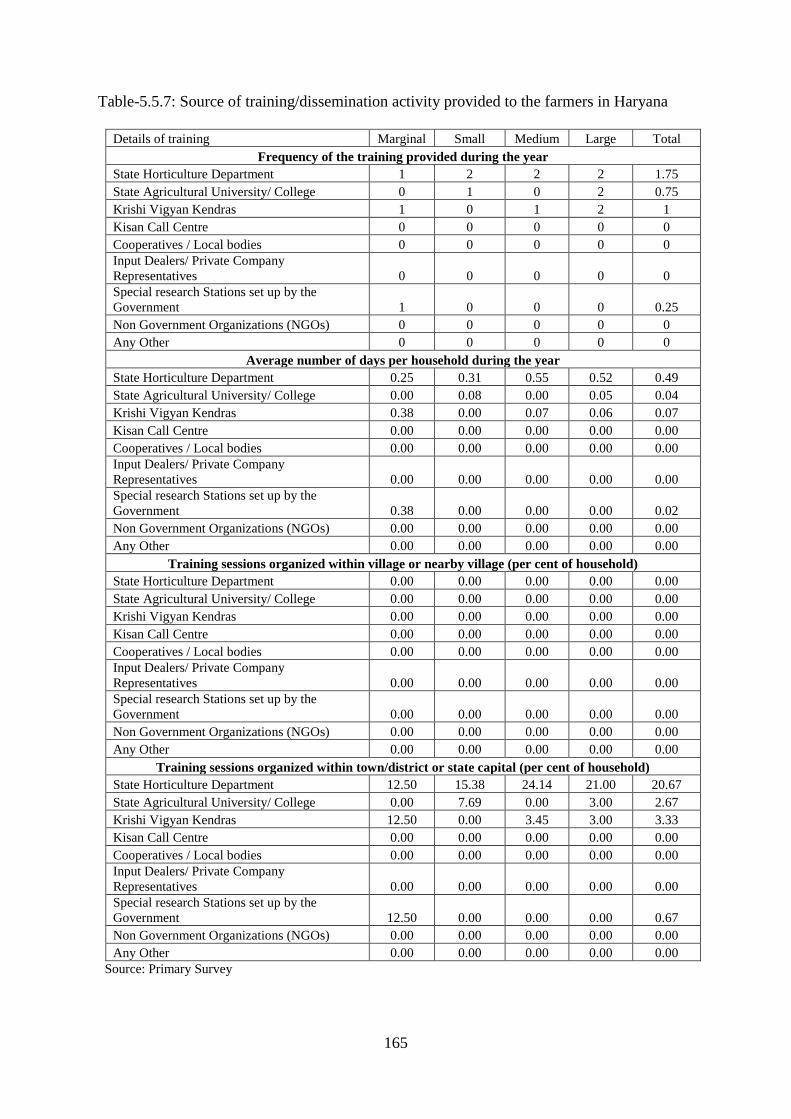
165
Table-5.5.7: Source of training/dissemination activity provided to the farmers in Haryana
Details of training Marginal Small Medium Large Total
Frequency of the training provided during the year
State Horticulture Department 1 2 2 2 1.75
State Agricultural University/ College 0 1 0 2 0.75
Krishi Vigyan Kendras 1 0 1 2 1
Kisan Call Centre 0 0 0 0 0
Cooperatives / Local bodies 0 0 0 0 0
Input Dealers/ Private Company
Representatives 0 0 0 0 0
Special research Stations set up by the
Government 1 0 0 0 0.25
Non Government Organizations (NGOs) 0 0 0 0 0
Any Other 0 0 0 0 0
Average number of days per household during the year
State Horticulture Department 0.25 0.31 0.55 0.52 0.49
State Agricultural University/ College 0.00 0.08 0.00 0.05 0.04
Krishi Vigyan Kendras 0.38 0.00 0.07 0.06 0.07
Kisan Call Centre 0.00 0.00 0.00 0.00 0.00
Cooperatives / Local bodies 0.00 0.00 0.00 0.00 0.00
Input Dealers/ Private Company
Representatives 0.00 0.00 0.00 0.00 0.00
Special research Stations set up by the
Government 0.38 0.00 0.00 0.00 0.02
Non Government Organizations (NGOs) 0.00 0.00 0.00 0.00 0.00
Any Other 0.00 0.00 0.00 0.00 0.00
Training sessions organized within village or nearby village (per cent of household)
State Horticulture Department 0.00 0.00 0.00 0.00 0.00
State Agricultural University/ College 0.00 0.00 0.00 0.00 0.00
Krishi Vigyan Kendras 0.00 0.00 0.00 0.00 0.00
Kisan Call Centre 0.00 0.00 0.00 0.00 0.00
Cooperatives / Local bodies 0.00 0.00 0.00 0.00 0.00
Input Dealers/ Private Company
Representatives 0.00 0.00 0.00 0.00 0.00
Special research Stations set up by the
Government 0.00 0.00 0.00 0.00 0.00
Non Government Organizations (NGOs) 0.00 0.00 0.00 0.00 0.00
Any Other 0.00 0.00 0.00 0.00 0.00
Training sessions organized within town/district or state capital (per cent of household)
State Horticulture Department 12.50 15.38 24.14 21.00 20.67
State Agricultural University/ College 0.00 7.69 0.00 3.00 2.67
Krishi Vigyan Kendras 12.50 0.00 3.45 3.00 3.33
Kisan Call Centre 0.00 0.00 0.00 0.00 0.00
Cooperatives / Local bodies 0.00 0.00 0.00 0.00 0.00
Input Dealers/ Private Company
Representatives 0.00 0.00 0.00 0.00 0.00
Special research Stations set up by the
Government 12.50 0.00 0.00 0.00 0.67
Non Government Organizations (NGOs) 0.00 0.00 0.00 0.00 0.00
Any Other 0.00 0.00 0.00 0.00 0.00
Source: Primary Survey

166
5.6 Perceptions of households about National Horticulture Mission
The perceptions of the beneficiary farmers about their experiences in cultivating various
horticultural crops with the help of NHM assistance are very helpful in reviewing the
performance of the Mission. We posed some qualitative questions to the selected beneficiaries
and sought their views by ticking the relevant options provided in the questionnaire. These
questions were in general and not related to any specific crop and they were kept in objective
form like whether the farmer being surveyed was provided any material input, financial
assistance, subsidy etc., while some others questions enquired how NHM help the households
to expand their area under horticultural crops, whether by shifting to horticultural crops
farmers income and employment has gone up and so on.
5.6.1 Perceptions of households about NHM in Karnataka
Table 5.6.1 shows perceptions of households about the performance of NHM in the study
region. Inquiring about how NHM has helped them to increase their area under horticultural
crops, a majority of the beneficiaries (52 per cent) indicated that NHM helped them by
providing seedling/nursery for increasing the area under horticultural crops. Another 28 per
cent beneficiaries indicated that NHM helped them by providing material inputs like fertilizer
and plant protection. However, NHM failed completely in making provision of processing
facility, providing market for the end product or facilitating them through procurement and
building capacity by proper training as less than 10 per cent selected beneficiary households
obtained the above mentioned facilities. Among selected farm size holdings, there was no
much difference in the resource provision for area expansion of horticultural crops.
About half of the selected farmers agreed that financial assistance through NHM as well as
subsidy provision in terms of direct payment was a good point of the NHM Programme. On
the other hand, more than 90 per cent of the households disagreed on infrastructure and
capacity building activities by the NHM programme. Only 10 per cent households indicated
that there was any awareness camp or training programme held under National Horticultural
Mission and only 6 per cent households pointed out that some infrastructure building
activities were under taken by this programme. Among the farm size holdings, the proportion
of farmers obtaining financial assistance or subsidy was more or less even among all size
classes.
To our question to the selected beneficiaries whether and in what way NHM has helped
increasing the employment opportunities for the farmers and agricultural labourers. Around
60 per cent of all farmers expressed that NHM helped in increasing the employment
opportunities for the farmers through expansion of area under horticultural crops. There was,
however, no special subsidy for farmers having shifted from the field (foodgrains or
commercial) crops to horticultural crops. This is clear from farmers’ response as 60 per cent
farmers indicated that employment opportunities increased by expansion in area under
horticultural crops but only 12 per cent beneficiaries indicated that there was increase in
employment because of subsidy provision for the land being shifted from field to horticultural
crops. Perhaps introducing specified subsidy for those who shift their area from other crops to
horticultural crops may lead to not only rapid expansion in area under horticultural crops but
also to employment opportunities for all. Similarly, NHM failed in its objective of increasing
employment opportunities by encouraging on farm processing activities, as hardly any
subsidy was provided for that purpose as pointed out above. Only 10 per cent of the selected
beneficiaries agreed that NHM has increased employment opportunities by establishing

167
horticultural processing units in the local areas. Regarding the effects of NHM on the income
levels of the farmers, about 38 per cent of beneficiaries revealed that their income has increased
up to 20 per cent and another 32 per cent indicated that their income increased up to 40 per cent
after adopting horticultural crops. Around 15 per cent of the selected beneficiary farmers pointed
out that their income has not increased al all after adopting horticultural crops with all help of
NHM and availing their subsidy benefits.
Table 5.6.1: Perception of households about the NHM (% of households) in Karnataka
Marginal Small Medium Large Total
How NHM has helped you to increase your area under horticultural crops
By providing seedling/nursery 57.6 46.0 51.4 54.5 52.4
By providing material inputs 25.4 27.0 28.6 32.7 28.3
By capacity building (providing training) 5.1 6.3 14.3 9.1 8.0
By providing processing facilities 1.7 3.2 11.4 10.9 6.1
By providing market for our end product 0.0 1.6 2.9 3.6 1.9
By providing procurement facility 10.2 1.6 8.6 9.1 7.1
What are the good points in the policy towards NHM
Financial assistance 39.0 57.1 60.0 54.5 51.9
Building infrastructure 5.1 1.6 14.3 5.5 5.7
Capacity Building (awareness camps / training etc) 5.1 7.9 17.1 14.5 10.4
Subsidy provision 59.3 44.4 45.7 49.1 50.0
Any other 0.0 1.6 2.9 0.0 0.9
Do you think NHM has increased employment opportunities for the farmers and agricultural labourers, How?
By increasing area under manually operated horticultural crops 62.7 57.1 62.9 58.2 59.9
By establishing horticultural processing units in the local areas 3.4 7.9 11.4 20.0 10.4
By providing subsidy to those who have diversified their crops from field
to horticultural crops 8.5 17.5 14.3 7.3 11.8
No NHM has not increased employment in any way 13.6 11.1 20.0 9.1 12.7
Do you think your income has grown up after horticultural crops with the help of NHM. If yes how much
less than 20 % 32.2 41.3 34.3 41.8 37.7
20 to 40 % 44.1 28.6 31.4 25.5 32.5
40 to 60 % 6.8 9.5 11.4 18.2 11.3
60 to 100 % 1.7 0.0 2.9 5.5 2.4
No increase at all 15.3 20.6 17.1 9.1 15.6
Are farmers in your village aware about the National Horticulture Mission, How?
They have actively benefited from the subsidies provided by the NHM 76.3 66.7 85.7 67.3 72.6
They actively participate in the training programmes provided by the
NHM 6.8 17.5 22.9 14.5 14.6
They have benefited from the infrastructural building up being done by
the NHM 1.7 1.6 8.6 5.5 3.8
They have been able to raise their area under horticultural crops with the
help of NHM 16.9 23.8 2.9 25.5 18.9
No they stand aloof and completely unaware about the activities of NHM 6.8 1.6 5.7 9.1 5.7
What changes do you suggest to make NHM more effective
Increase the subsidy amount 10.2 17.5 10.3 24.5 16.3
NHM should provide better awareness about the scheme 6.1 8.8 27.6 6.1 10.3
Provide concessional credit facility under NHM 6.1 10.5 0.0 8.2 7.1
Better input provision – irrigation, fertilizer, pesticides etc. 14.3 15.8 24.1 18.4 17.4
Better facilities for post harvest like pack house, cold storage, better
market for the end product 14.3 15.8 10.3 16.3 14.7
Provision of nursery, better seedling and plantation 12.2 8.8 6.9 8.2 9.2
Timely provision of subsidy without delay 2.0 0.0 3.5 4.1 2.2
Provision of organic inputs like vermin-compost, manure etc. 8.2 1.8 3.5 0.0 3.3
Capacity building by organizing more training camps and dissemination
activities 18.4 10.5 10.3 6.1 11.4
More subsidy for drip irrigation 4.1 8.8 6.1 5.4
NHM should provide subsidy for other horticultural crops also 4.1 1.8 3.5 2.0 2.7
Source: Primary Survey
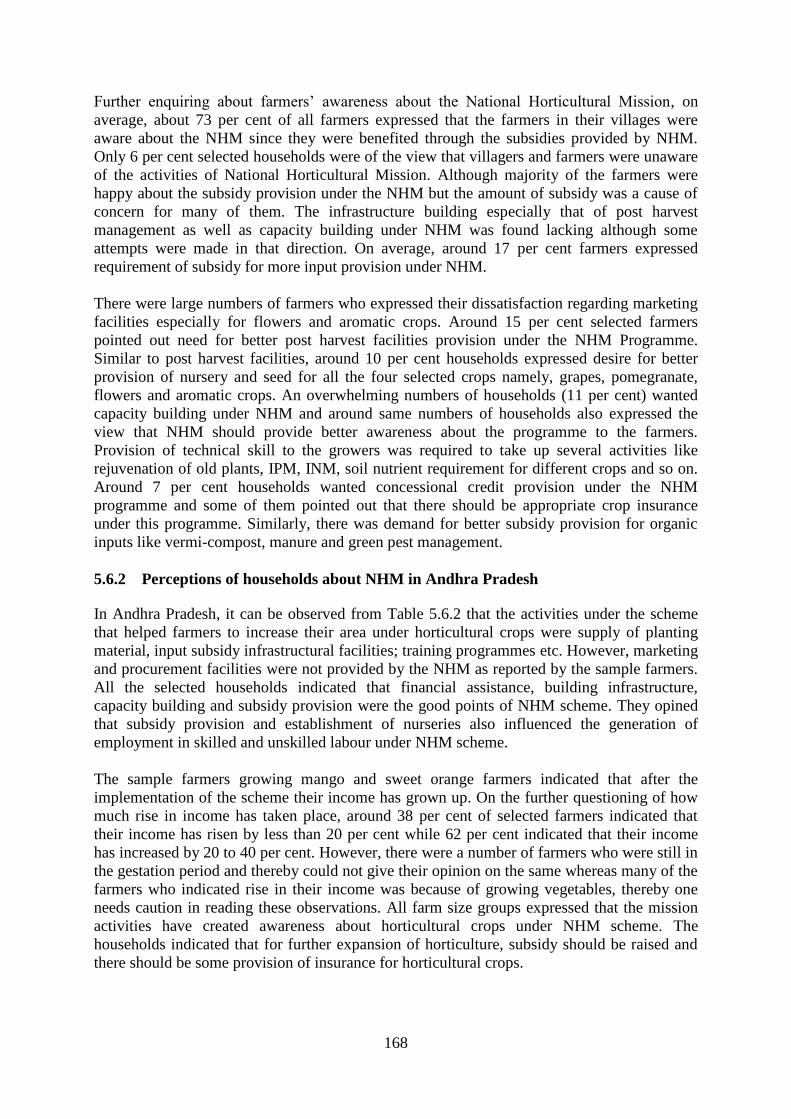
168
Further enquiring about farmers’ awareness about the National Horticultural Mission, on
average, about 73 per cent of all farmers expressed that the farmers in their villages were
aware about the NHM since they were benefited through the subsidies provided by NHM.
Only 6 per cent selected households were of the view that villagers and farmers were unaware
of the activities of National Horticultural Mission. Although majority of the farmers were
happy about the subsidy provision under the NHM but the amount of subsidy was a cause of
concern for many of them. The infrastructure building especially that of post harvest
management as well as capacity building under NHM was found lacking although some
attempts were made in that direction. On average, around 17 per cent farmers expressed
requirement of subsidy for more input provision under NHM.
There were large numbers of farmers who expressed their dissatisfaction regarding marketing
facilities especially for flowers and aromatic crops. Around 15 per cent selected farmers
pointed out need for better post harvest facilities provision under the NHM Programme.
Similar to post harvest facilities, around 10 per cent households expressed desire for better
provision of nursery and seed for all the four selected crops namely, grapes, pomegranate,
flowers and aromatic crops. An overwhelming numbers of households (11 per cent) wanted
capacity building under NHM and around same numbers of households also expressed the
view that NHM should provide better awareness about the programme to the farmers.
Provision of technical skill to the growers was required to take up several activities like
rejuvenation of old plants, IPM, INM, soil nutrient requirement for different crops and so on.
Around 7 per cent households wanted concessional credit provision under the NHM
programme and some of them pointed out that there should be appropriate crop insurance
under this programme. Similarly, there was demand for better subsidy provision for organic
inputs like vermi-compost, manure and green pest management.
5.6.2 Perceptions of households about NHM in Andhra Pradesh
In Andhra Pradesh, it can be observed from Table 5.6.2 that the activities under the scheme
that helped farmers to increase their area under horticultural crops were supply of planting
material, input subsidy infrastructural facilities; training programmes etc. However, marketing
and procurement facilities were not provided by the NHM as reported by the sample farmers.
All the selected households indicated that financial assistance, building infrastructure,
capacity building and subsidy provision were the good points of NHM scheme. They opined
that subsidy provision and establishment of nurseries also influenced the generation of
employment in skilled and unskilled labour under NHM scheme.
The sample farmers growing mango and sweet orange farmers indicated that after the
implementation of the scheme their income has grown up. On the further questioning of how
much rise in income has taken place, around 38 per cent of selected farmers indicated that
their income has risen by less than 20 per cent while 62 per cent indicated that their income
has increased by 20 to 40 per cent. However, there were a number of farmers who were still in
the gestation period and thereby could not give their opinion on the same whereas many of the
farmers who indicated rise in their income was because of growing vegetables, thereby one
needs caution in reading these observations. All farm size groups expressed that the mission
activities have created awareness about horticultural crops under NHM scheme. The
households indicated that for further expansion of horticulture, subsidy should be raised and
there should be some provision of insurance for horticultural crops.

169
Table 5.6.2: Perception of households about the NHM (% of households) in Andhra Pradesh
Details of training Marginal Small Medium Large Total
How NHM has helped you to increase your area under horticultural crops
By providing seedling/nursery 100.00 100.00 100.00 100.00 100.00
By providing material inputs 100.00 95.24 100.00 100.00 99.00
By capacity building (providing training) 100.00 100.00 100.00 100.00 100.00
By providing processing facilities 77.78 90.48 76.92 85.71 84.00
By providing market for our end product
By providing procurement facility
What are the good points in the policy towards NHM
Financial assistance 100.00 100.00 100.00 100.00 100.00
Building infrastructure 100.00 100.00 100.00 100.00 100.00
Capacity Building (awareness camps/training etc) 100.00 100.00 100.00 100.00 100.00
Subsidy provision 100.00 100.00 100.00 100.00 100.00
Any other
Do you think NHM has increased employment opportunities for the famers and agricultural labourers, How?
By increasing area under horticultural crops that are
manually operated 100.00 100.00 100.00 100.00 100.00
By establishing horticultural processing units in the
local areas 100.00 100.00 100.00 100.00 100.00
By providing subsidy to those who have diversified 100.00 100.00 100.00 100.00 100.00
Their crops from field to horticultural crops
No NHM has not increased employment in any way
Do you think your income has grown up after adopting horticultural crops with the help of NHM. If yes how much
Less than 20% 44.44 38.10 38.46 28.57 38.00
20 to 40% 55.56 61.90 61.54 71.43 62.00
40 to 60%
60 to 100%
No increase at all
Are farmers in your village aware about the National Horticulture Mission, How?
They have actively benefited from the subsidies 100.00 100.00 100.00 100.00 100.00
provided by the NHM
They actively participate in the training programmes
provided by the NHM 100.00 100.00 100.00 100.00 100.00
They have benefited from the infrastructural building
up being done by the NHM 66.67 90.48 76.92 85.71 82.00
They have been able to raise their area under
horticultural crops with the help of NHM 100.00 100.00 100.00 100.00 100.00
No they stand aloof and completely unaware about the
activities of NHM
What changes do you suggest to make NHM more effective – mention
1. In adequate technical and field staff
2. Enhance the subsidy because labour wages are increasing
3. Introduce the insurance scheme of horticultural crops whenever natural calamity of horticultural
Crops. Source: Primary Survey
5.6.3 Perceptions of households about NHM in Bihar
Table 5.6.3 shows various perceptions of households about the performance in the sample
districts of Bihar. All the sample farmers indicated that NHM helped them by providing
seedlings/saplings for increasing the area under horticultural crops. While on an average 48
per cent of all farmers expressed that NHM helped them by providing training to the farmers.
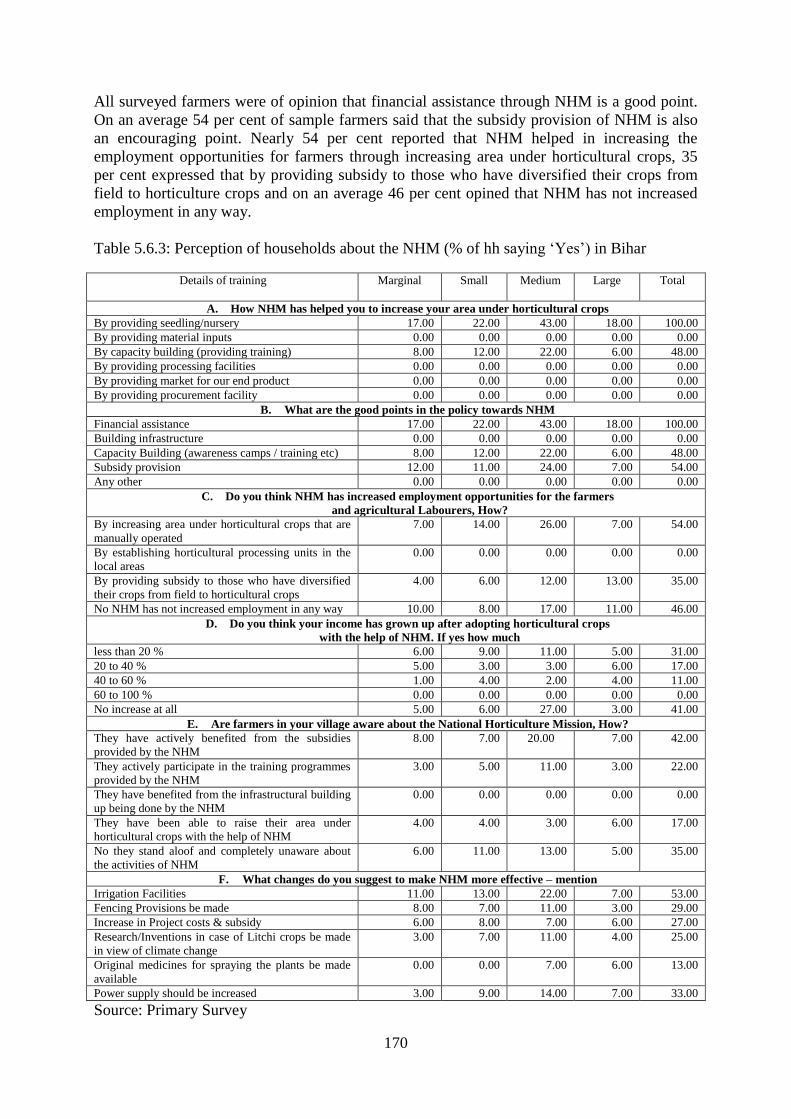
170
All surveyed farmers were of opinion that financial assistance through NHM is a good point.
On an average 54 per cent of sample farmers said that the subsidy provision of NHM is also
an encouraging point. Nearly 54 per cent reported that NHM helped in increasing the
employment opportunities for farmers through increasing area under horticultural crops, 35
per cent expressed that by providing subsidy to those who have diversified their crops from
field to horticulture crops and on an average 46 per cent opined that NHM has not increased
employment in any way.
Table 5.6.3: Perception of households about the NHM (% of hh saying ‘Yes’) in Bihar
Details of training Marginal
Small
Medium
Large
Total
A. How NHM has helped you to increase your area under horticultural crops
By providing seedling/nursery 17.00 22.00 43.00 18.00 100.00
By providing material inputs 0.00 0.00 0.00 0.00 0.00
By capacity building (providing training) 8.00 12.00 22.00 6.00 48.00
By providing processing facilities 0.00 0.00 0.00 0.00 0.00
By providing market for our end product 0.00 0.00 0.00 0.00 0.00
By providing procurement facility 0.00 0.00 0.00 0.00 0.00
B. What are the good points in the policy towards NHM
Financial assistance 17.00 22.00 43.00 18.00 100.00
Building infrastructure 0.00 0.00 0.00 0.00 0.00
Capacity Building (awareness camps / training etc) 8.00 12.00 22.00 6.00 48.00
Subsidy provision 12.00 11.00 24.00 7.00 54.00
Any other 0.00 0.00 0.00 0.00 0.00
C. Do you think NHM has increased employment opportunities for the farmers
and agricultural Labourers, How?
By increasing area under horticultural crops that are
manually operated
7.00 14.00 26.00 7.00 54.00
By establishing horticultural processing units in the
local areas
0.00 0.00 0.00 0.00 0.00
By providing subsidy to those who have diversified
their crops from field to horticultural crops
4.00 6.00 12.00 13.00 35.00
No NHM has not increased employment in any way 10.00 8.00 17.00 11.00 46.00
D. Do you think your income has grown up after adopting horticultural crops
with the help of NHM. If yes how much
less than 20 % 6.00 9.00 11.00 5.00 31.00
20 to 40 % 5.00 3.00 3.00 6.00 17.00
40 to 60 % 1.00 4.00 2.00 4.00 11.00
60 to 100 % 0.00 0.00 0.00 0.00 0.00
No increase at all 5.00 6.00 27.00 3.00 41.00
E. Are farmers in your village aware about the National Horticulture Mission, How?
They have actively benefited from the subsidies
provided by the NHM
8.00 7.00 20.00 7.00 42.00
They actively participate in the training programmes
provided by the NHM
3.00 5.00 11.00 3.00 22.00
They have benefited from the infrastructural building
up being done by the NHM
0.00 0.00 0.00 0.00 0.00
They have been able to raise their area under
horticultural crops with the help of NHM
4.00 4.00 3.00 6.00 17.00
No they stand aloof and completely unaware about
the activities of NHM
6.00 11.00 13.00 5.00 35.00
F. What changes do you suggest to make NHM more effective – mention
Irrigation Facilities 11.00 13.00 22.00 7.00 53.00
Fencing Provisions be made 8.00 7.00 11.00 3.00 29.00
Increase in Project costs & subsidy 6.00 8.00 7.00 6.00 27.00
Research/Inventions in case of Litchi crops be made
in view of climate change
3.00 7.00 11.00 4.00 25.00
Original medicines for spraying the plants be made
available
0.00 0.00 7.00 6.00 13.00
Power supply should be increased 3.00 9.00 14.00 7.00 33.00
Source: Primary Survey

171
Regarding the impact of NHM on income levels of the farmers, about 31 per cent told that
their income has increased up to 20 per cent after adopting horticultural crops, 17 per cent said
that their income increased by 20 to 40 per cent and only 11 per cent were of the view that
their income increased by 40 to 60 per cent. However, 41 per cent sample farmers reported
that their income did not increase after adopting the NHM may be due to poor survival rate of
the plant and shrinkage of litchi crop from the field due to climate factors.
As regards the awareness about the NHM in the village sample farmers were asked some
qualitative questions. The farmers reported that they benefitted from the subsidies provided by
the NHM (42 per cent), actively participated in the trainings (22 per cent), able to raise their
area under horticultural crops with the help of NHM (17 per cent) and 35 per cent of sample
farmers reported that they stood aloof and completely unaware about the activities of NHM.
Moreover, suggestions were also sought from the sample farmers to make the NHM scheme
more effective. Out of total sample farmers 53 per cent suggested to provide irrigational
facilities in the field because horticultural crops require regular irrigation. Since irrigation
facilities were linked with power supply, so 33 per cent of sample farmers suggested to raise
power supply in the rural areas. About 29 per cent suggested for making fencing provision of
the orchards so that cattle grazing problem could be checked. Increase in project costs and
subsidy was also suggested by 27 per cent of sample farmers mainly due to increasing input
costs. Since the climate change was badly affecting the survival and growth rate of
horticultural crops in general and litchi in particular, so 25 per cent suggested for new
researches/inventions to suit the changing pattern of climate. About 13 per cent of sample
farmers suggested ensuring supply of original medicines for spraying the plants.
5.6.4 Perceptions of households about NHM in Rajasthan
Table 5.6.4 shows various perceptions of households about the performance of NHM in the
study districts of Rajasthan. About 96 per cent of all sample farmers said that NHM helped
them by providing seedling/nursery for increasing the area under horticultural crops. So far as
capacity building provisions of NHM is concerned, on an average 74 per cent of all farmers
expressed that NHM helped them by providing training to the farmers.
On the other hand only 33 per cent of marginal farmers expressed that NHM helped them by
providing training to the farmers. About 92.5 per cent of farmers were of opinion that
financial assistance through NHM was a good point. About 63 per cent of farmers also opined
that building infrastructure and capacity building measures such as awareness camps, training
etc., were beneficial provisions of NHM. Around 94.0 per cent of farmers expressed that
NHM helped in increasing the employment opportunities for the farmers through expansion of
area under horticultural crops. Only 1.5 per cent of all farmers opined that NHM did not
increase employment in any way.
Regarding the effects of NHM on the income levels of the farmers, about 34.5 per cent
farmers revealed that their income increased up to 20 per cent after adopting horticultural
crops. About 11.5 per cent farmers said that their income increased by 20 to 40 per cent after
adopting horticultural crops while only 7.14 per cent of marginal farmers said that their
income has increased by 20 to 40 per cent after adopting horticultural crops. About 51.5 per
cent of all farmers revealed that their income has not increased yet though they have adopted
horticultural crops through NHM. On an average, about 98 per cent of all farmers expressed

172
that the farmers in their villages were aware about the NHM since they were benefited
through the subsidies provided through NHM.
Table 5.6.4: Perception of households about the NHM (% of households saying yes) in
Rajasthan
Details of training Farmer category
Marginal Small Medium Large Total
(A) How NHM has helped you to increase your area under horticultural crops?
By providing seedling/nursery 86.36 97.78 98.25 100.00 96.00
By providing material inputs 39.00 88.89 96.49 98.15 93.50
By capacity building (providing training) 33.00 62.22 71.93 85.19 74.00
(B) What are the good points in the policy towards NHM?
Financial assistance 72.73 95.56 98.25 100.00 92.50
Building infrastructure 40.91 68.89 64.91 74.07 63.00
Capacity Building (awareness camps / training etc) 56.82 55.56 59.65 77.78 63.00
Subsidy provision 81.82 55.56 54.39 64.81 63.50
(C) Do you think NHM has increased employment opportunities for the farmers and agricultural labourers? how?
By increasing area under horticultural crops that are
manually operated
97.73 93.33 89.47 96.30 94.00
By establishing horticultural processing units in the local
areas
0.00 0.00 0.00 0.00 0.00
By providing subsidy to those who have diversified their
crops from field to horticultural crops
36.36 46.67 63.16 62.96 53.50
No NHM has not increased employment in any way 4.55 0.00 1.75 0.00 1.50
(D) Do you think your income has grown up after adopting horticultural crops with the help of NHM? If yes, how much?
less than 20 % 21.43 31.11 44.07 37.04 34.50
20 to 40 % 7.14 8.89 6.78 22.22 11.50
40 to 60 % 2.38 2.22 1.69 1.85 2.00
60 to 100 % 0.00 0.00 1.69 0.00 0.50
No increase at all 69.05 57.78 45.76 38.89 51.50
(E) Are farmers in your village aware about the National Horticulture Mission? How?
They have actively benefited from the subsidies provided by
the NHM
93.18 100.00 98.25 100.00 98.00
They actively participate in the training programmes
provided by the NHM
54.55 57.78 77.19 88.89 71.00
They have benefited from the infrastructural building up
being done by the NHM
27.27 57.78 52.63 62.96 51.00
They have been able to raise their area under horticultural
crops with the help of NHM
31.82 40.00 52.63 62.96 48.00
No they stand aloof and completely unaware about the
activities of NHM
0.00 0.00 0.00 0.00 0.00
(F) What changes do you suggest to make NHM more effective? Mention.
Subsidy provision for fencing 47.73 26.67 29.82 31.48 33.50
More subsidy amount 34.09 44.44 43.86 46.30 42.50
Provision for planting material 15.91 15.56 15.79 27.78 19.00
Processing facilities 45.45 55.56 50.88 46.30 49.50
Cold wind and frost resistant variety availability 18.18 13.33 14.04 14.81 15.00
Increase powar supply 40.91 42.22 38.60 37.04 39.50
Assured marketing 45.45 48.89 52.63 59.26 52.00
Good market condition for Anola 0.00 4.44 10.53 9.26 6.50
Rivision of cost estimate required 22.73 33.33 29.82 29.63 29.00
Single phase connection for NHM 72.73 77.78 78.95 77.78 77.00
Source: Field survey data
Regarding the changes required so as to make NHM more effective, about 33.5 per cent
farmers suggested that subsidy provision for fencing should be incorporated in NHM
173
programme. About 42.5 per cent farmers suggested that more subsidy amount should be given
to the beneficiary farmers through the Mission keeping in view the inflationary price rise.
Around 19 per cent farmers suggested that planting material should be made available to the
farmers in time. On an average, 49.5 per cent farmers suggested that processing facilities
should be provided and necessary infrastructures should be developed in their villages or
nearby villages. Nearly 15 per cent farmers suggested that cold wind and frost resistant
varieties of seedlings should be made available through the Mission, especially in the case of
fruits and spices. About 39.5 per cent of all farmers suggested that increasing the power
supply by the electricity board was necessary for promoting horticultural crops in their region.
About 52 per cent of farmers suggested that assured marketing for horticultural crop was very
essential generating reasonable returns from the sale of output of horticultural crops.
5.6.5 Perceptions of households about NHM in Tamil Nadu
Table 5.6.5 presents the perception of households about NHM in Tamil Nadu. The sample
respondents expressed their views on to what extent the NHM scheme helped them to increase
their horticultural area, enhance productivity, ensure protection etc. A vast majority of over 89
per cent of the sample respondents reported that the scheme helped them by providing
seedlings/nursery and over 47 per cent were of the opinion that the scheme helped them by
providing material inputs. According to 70 per cent of the sample respondent’s subsidy
provision was the good point in the policy towards NHM. Financial assistance provided under
NHM was the good point in the policy towards NHM was expressed by 68 per cent whereas
62 per cent of the sample respondents considered building infrastructure as the good point.
On an average 83 per cent of the sample respondents were of the opinion that NHM increased
employment opportunities for the farmers and agricultural labourers by increasing area under
horticultural crops that were manually operated, whereas 56 per cent of them opined that
NHM increased employment opportunities by providing subsidy to those who diversified their
crops from field crop to horticultural crops. Surprisingly, 13 per cent of the total sample
respondents reported that NHM did not increase employment opportunities in any way.
With regard to increase in income as a result of adoption of horticultural crops under NHM,
40 per cent of the total sample respondents expressed that their income increased by less than
20 per cent. Another 25 per cent respondents opined that their income enhanced by 40 to 60
per cent after adopting horticultural crops with the help of NHM while 14 per cent opined that
their income rose by 20 to 40 per cent. It is interesting to note that 5 per cent of the total
sample respondents reported that their income increased by a record 60 to 100 per cent.
However, 2.1 per cent of the total sample respondents disputed with the views of others by
saying that there was no increase in income at all after adopting horticultural crops with the
help of NHM.
With regard to awareness of the farmers about NHM, a vast majority of 92 per cent of the
sample respondents reported that they were aware of the scheme. Awareness of the
programme was reported by 73 per cent of the sample households that they actively
participated in the training progammes organized by NHM. The statement of 59 per cent of
the total sample respondents was that they were benefited from the infrastructural building up
being done by NHM, whereas 54 per cent reported that they were able to raise their area under
horticulture crops with the help of NHM. Various suggestions were put forth by the sample
respondents to make the NHM more effective.

174
Table 5.6.5: Perception of households about the NHM in Tamil Nadu
(% of households saying yes)
As high as 68 per cent of the sample respondents suggested that providing single phase
electricity connection to them would help them much to improve their horticultural
Details of the Items Marginal Small Medium Large Total
A) How NHM has helped you to increase your area under horticultural crops
By providing seedling/nursery 88.8 91.9 89.5 80 89.36
By providing martial inputs 68 22 11 3 47.27
By capacity building material inputs 36 17 7 3 26.54
By providing processing facilities 0 0 0 0 0
By providing market for our end product 0 0 0 0 0
By providing procurement facility 0 0 0 0 0
B) What are the good points in the policy towards NHM
Financial assistance 62 74 68 66 68
Building infrastructure 43 69 72 63 62
Capacity building (awareness camps) 48 54 52 47 50
Subsidy provision 62 68 76 72 70
Any other 0 0 0 0 0
C) Do you think NHM has increased employment opportunities for the farmers and agricultural laborers
By increasing area under horticultural crops
that are manually operated 78 83 88 82 83
By establishing horticultural processing units in
the local areas 0 0 0 0 0
By providing subsidy to those who have
diversified their crops from field to horticultural
crops
42 48 66 69 56
No NHM has not increased employment in the
any way 6 8 17 19 13
D) Do you think your income has grown up after adopting horticultural crops with the help of NHM
Less than 20 % 25 36 48 49 40
20 to 40 % 9 13 18 16 14
40 to 60 % 12 18 22 26 20
60 to 100 % 0 6 5 9 5
No increase at all 54 27 7 0 78
E) Are farmers in your village aware about the NHM
They have actively benefited from the subsidies
provided by the NHM 92 89 95 97 92
They actively participate in the training
programme provided by the NHM 59 65 79 90 73
They have benefited from the infrastructural
building up being done by the NHM 32 62 68 73 59
They have been able to raise their area under
horticultural crops with the help of NHM 39 48 62 66 54
No they stand aloof and completely unaware
about the activities of NHM 0 0 0 0 0
F) What changes do you suggest to make NHM more effective?
Subsidy provision for fencing 56 42 69 63 58
More subsidy amount 26 42 46 45 40
Provision for planting material 26 32 38 39 34
Processing facilities 24 28 38 12 26
Cold wind and frost resistant variety availability 0 0 0 0 0
Increase power supply 32 36 39 48 39
Assured marketing 48 56 64 58 57
Good market condition 12 18 22 29 20
Revision of cost estimate required 36 38 45 48 42
Single phase connection for NHM 64 69 68 72 68

175
operations. Another significant suggestion put forth by 58 per cent of the total sample
respondents was provision of subsidy for fencing their horticultural field. A considerable per
centage (57%) of sample respondents wanted to have assured marketing for their horticultural
crops as this is considered to be the key infrastructure for the farmers to make remunerative
prices for their produce. Enhanced subsidy amount, provision for planting material, increased
power supply etc were other suggestions voiced by 34 to 40 per cent of the total respondents.
5.6.6 Perceptions of households about NHM in West Bengal
Needless to mention, besides better extension facilities and improved marketing and
processing infrastructure, provisions of many other crucial aspects is supposed to have
significant positive impact in upholding horticultural production and enhancement of
horticultural cultivation. However, the study finds that only a few beneficiary farmer
households benefitted from such extension, development and crop promotion activities (Table
5.6.6). In fact, while about 24 per cent of the sample beneficiary households benefitted
rejuvenation with improved varieties, only 28 per cent benefitted by training and capacity
building activities. About 21 per cent of the farmers benefited from increased availability of
good quality planting materials like nursery.
In the case of perception of sample beneficiary households about the scheme NHM, there was
a mixed response from the households regarding the functioning of NHM in the study area.
The NHM did well by providing financial assistance to the farmers. The financial assistance
as provision of subsidy had, to some extent, boosted up the farmers for horticultural
cultivation. However, it is interesting to observe that as while 74 per cent of the sample
beneficiary households responded that NHM did not in any way increase employment in
farming activities, as much as 65 per cent of the households also alleged that NHM played an
insignificant role in increasing income from cultivation. Further, 68 per cent of the
respondents considered that the subsidies provided under NHM actively benefitted the farmers
to some extent. In should also be noted here that more than one-thirds of all sample
households (36 per cent) suggested that the government should increase the amount of subsidy
provided under NHM to make the policy a success, especially as the total value of subsidy
stands less than 5 per cent of total investment requirement.
It should be noted that due to improper market infrastructure and unorganized nature of
cultivation practices, the farmers were more or less dependent on traditional cultivation
methods. It appears that the public sector failed to provide off-farm infrastructure for
attracting the farmers for more inclination towards horticultural cultivation. It is here that the
suggestions from the beneficiary side remained crucial for chalking out specific requirements
to make the policy a success.
5.6.7 Perceptions of households about NHM in Haryana
Since, there is a provision for financial assistance, infrastructure, capacity building and
subsidy under the Mission, opinion of the farmers was sought on these aspects. Subsidy
provision was listed as the most important positive factor by 94.67 per cent farmers at the
overall level. In each farm category, at least 90 per cent farmers gave positive response.
Financial assistance was another positive factor which helped 49.33 per cent farmers in
adopting the Mission. Further, response of the farmers’ regarding infrastructure and capacity
building was found poor. Only 3.33 and 1.33 per cent farmers expressed these factors as
positive points in policy initiatives framed for the Mission (Table 5.6.7). It could be observed

176
from the table that response of farmers regarding planting material was positive and all of
them received assistance. Pump-sets for irrigation, storage tanks, soil sterilization and
precision farming implements received poor response and around 1 per cent farmers indicated
an affirmative role of these factors. Training and capacity building helped 24.57 per cent farm
households in adoption of horticultural crops.
Table 5.6.6: Perception of households about the NHM (% of Households) in West Bengal
Details of training Marginal Small Medium Large Total
How NHM has helped you to increase your area under horticultural crops
By providing seedling/nursery 44.00 0.00 0.00 0.00 44.00
By providing material inputs 0.00 0.00 0.00 0.00 0.00
By capacity building (providing training) 17.00 1.00 0.00 0.00 18.00
By providing processing facilities 0.00 0.00 0.00 0.00 0.00
By providing market for our end product 0.00 0.00 0.00 0.00 0.00
By providing procurement facility 0.00 0.00 0.00 0.00 0.00
What are the good points in the policy towards NHM
Financial assistance 53.00 11.00 1.00 0.00 65.00
Building infrastructure 0.00 0.00 0.00 0.00 0.00
Capacity Building (awareness camps / training etc) 0.00 0.00 0.00 0.00 0.00
Subsidy provision 71.00 12.00 2.00 0.00 85.00
Any other 6.00 3.00 1.00 0.00 10.00
Do you think NHM has increased employment opportunities for the farmers and agricultural labourers, How?
By increasing area under horticultural crops that are
manually operated 9.00 6.00 1.00 0.00 16.00
By establishing horticultural processing units in the
local areas 0.00 0.00 0.00 0.00 0.00
By providing subsidy to those who have diversified
their crops from field to horticultural crops 12.00 2.00 1.00 0.00 15.00
No NHM has not increased employment in any way 65.00 8.00 1.00 0.00 74.00
Do you think your income has grown up after adopting horticultural crops with the help of NHM. If yes how much?
less than 20 % 15.00 6.00 1.00 0.00 22.00
20 to 40 % 7.00 1.00 1.00 0.00 9.00
40 to 60 % 4.00 0.00 0.00 0.00 4.00
60 to 100 % 0.00 0.00 0.00 0.00 0.00
No increase at all 57.00 7.00 1.00 0.00 65.00
Are farmers in your village aware about the National Horticulture Mission, How?
They have actively benefited from the subsidies
provided by the NHM 58.00 8.00 2.00 0.00 68.00
They actively participate in the training
programmes provided by the NHM 36.00 9.00 2.00 0.00 47.00
They have benefited from the infrastructural
building up being done by the NHM 0.00 0.00 0.00 0.00 0.00
They have been able to raise their area under
horticultural crops with the help of NHM 28.00 7.00 2.00 0.00 37.00
No they stand aloof and completely unaware about
the activities of NHM 27.00 2.00 0.00 0.00 29.00
What changes do you suggest to make NHM more effective – mention
Make formal/institutional credit available 17.00 3.00 1.00 0.00 21.00
Develop effective marketing facilities 22.00 2.00 1.00 0.00 25.00
Improve extension, capacity building &
infrastructure 14.00 3.00 1.00 0.00 18.00
Increase amount of subsidy 30.00 6.00 0.00 0.00 36.00
Source: Primary Survey
On our questions about proportionate increase in household income of the beneficiary
farmers, they reported that their income has increased after adoption of the National
Horticulture Mission but per centage of farmers across the categories reporting levels of
income improvement were found widely different. For instance, only 12.5 and 25 per cent
marginal farmers reported income increase in first and second levels against 42 and 45 per

177
cent, respectively by the large farmers. Around 50 per cent marginal farmers reported nil
increase in income. Overall, majority of the farmers reported increase in household income
after implementation of the NHM, but major beneficiary of the Mission were large farmers.
This analysis highlights the need for strong government intervention to help marginal farmers
in raising household income through cultivation of horticultural crops.
Table 5.6.7: Perceptions of farmers about the NHM in Haryana – (per cent of households)
Source: Primary Survey
Item Marginal Small Medium Large Total
How NHM has helped you to increase area under horticultural crops
Provision of seedling/nursery 100.00 100.00 100.00 100.00 100.00
Provision of material inputs 87.50 92.31 79.31 88.00 86.67
Capacity building (through training) 12.50 0.00 13.79 4.00 6.00
Provision of processing facilities 0.00 0.00 0.00 0.00 0.00
Provision of market for our end product 0.00 0.00 0.00 0.00 0.00
Provision of procurement facility 0.00 0.00 0.00 0.00 0.00
What are the good points in the policy towards NHM
Financial assistance 62.50 38.46 44.83 51.00 49.33
Building infrastructure 0.00 0.00 6.90 3.00 3.33
Capacity Building (awareness camps / training, etc) 0.00 0.00 0.00 2.00 1.33
Subsidy provision 100.00 92.31 93.10 95.00 94.67
Any other 0.00 0.00 0.00 0.00 0.00
Do you think NHM has increased employment opportunities for the farmers and agricultural labourers
By increasing area under horticultural crops that are manually
operated 75.00 61.54 55.17 62.00 61.33
By establishing horticultural processing units in the local areas 0.00 7.69 0.00 0.00 0.67
By providing subsidy to those who have diversified their crops from
field to horticultural crops 37.50 46.15 55.17 44.00 46.00
No, NHM has not increased employment in any way 0.00 0.00 0.00 5.00 3.33
Do you think your income has grown after adopting horticultural crops with assistance of NHM.
If yes, how much
less than 20 % 12.50 53.85 41.38 42.00 41.33
20 to 40 % 25.00 38.46 34.48 45.00 41.33
40 to 60 % 12.50 0.00 6.90 7.00 6.67
60 to 100 % 0.00 0.00 0.00 0.00 0.00
No increase at all 50.00 7.69 17.24 6.00 10.67
Are farmers in your village aware about the NHM
They have benefited from the subsidies provided by the NHM 75.00 76.92 79.31 94.00 88.67
They participated in the training programmes by NHM 12.50 7.69 0.00 1.00 2.00
They have benefited from the infrastructur building through the
NHM 12.50 7.69 10.34 0.00 3.33
They have been able to increase their area under horticultural crops
with assistance of NHM 12.50 7.69 0.00 5.00 4.67
No, they stand aloof and completely unaware about the activities of
NHM 0.00 7.69 6.90 2.00 3.33
What changes do you suggest to make NHM more effective
Government market 12.50 0.00 17.24 19.00 16.67
More subsidy 0.00 15.38 31.03 18.00 19.33
Training, extension and horticulture news from time to time 50.00 38.46 13.79 5.00 12.00
Establishment of processing plant at village level by the Govt. 0.00 7.69 0.00 10.00 7.33
Plant protection and scientific knowledge 0.00 7.69 0.00 2.00 2.00
Irrigation facilities 12.50 23.08 13.79 5.00 8.67
Timely availability of input material 25.00 15.38 0.00 0.00 2.67
crop insurance 0.00 0.00 0.00 2.00 1.33

178
It would be useful to understand whether sampled farmers were fully aware about the NHM.
Perusal of Table 5.5.7 indicates that 88.67 per cent growers of horticultural crops were
benefited from the subsidies provided under the Mission. Among various categories of
farmers, large farmers were the greatest beneficiaries (94 per cent) and received these
benefits. In other categories too, at least 75 per cent received these benefits under the Mission.
Findings on the next component that is participation in the training were poor. Only 2 per cent
sampled farmers participated in training and marginal farmers were found greater
beneficiaries in comparison to other categories. Once again, benefits of infrastructure created
under the NHM were found disappointing. Merely, 3 per cent farmers received these benefits.
It is discouraging to note that only 4.67 per cent of sampled farmers could increase area under
cultivation of horticultural crops. It is essential to mention that share of farmers expanding
area under these crops was observed higher in marginal and small size categories. Results
regarding awareness about the activities of the NHM were positive. Only 3.33 per cent of
selected farmers were aloof about the activities of the Mission. Moreover, their per centage
was lower than 10 per cent in each category.
5.7 Summary of the chapter
The objective of NHM was to ensure an end-to-end holistic approach covering production,
post harvest management, processing and marketing to assure appropriate returns to growers.
In Karnataka, out of 1.03 acres per household sown area of grapes during 2008, around 0.37
acres obtained input quantity through NHM. In pomegranate, out of 0.60 acres per household,
0.16 acres were provided input support. Similarly, in flowers, out of 0.3 acre per household
cultivated, less than 0.1 acres obtained input support. In the case of aromatic and medicinal
plants, out of 0.3 acres per household planted, around 0.2 acres per household were provided
input support. All the resources procured were provided by Department of Horticulture
(DOH), Karnataka Government, advanced contract with the buyers and private nursery. Total
area rejuvenated among all the selected households was 21 acres of grapes, 17.5 acres of
pomegranate and only 1.5 acres of flowers. The few households who rejuvenated their plants
indicated significant increase in productivity after rejuvenation. The sample farmers indicated
that the best help provided by the NHM was in terms of providing them planting material like
nursery or seedling. Among all activities, the highest numbers of households received subsidy
for nursery and planting material followed by drip irrigation, plant protection and maintenance
activities. Although majority of the farmers were happy about the subsidy provision under the
NHM but the amount of subsidy was a cause of concern for many of them. The infrastructure
building especially that of post harvest management as well as capacity building under NHM
was found lacking although some attempts were made in that direction.
All the area under selected crops in Andhra Pradesh was in the gestation period and thereby
no rejuvenation activity was observed among the selected farmers in the state. Regarding
resource procurement, majority of respondents received planting material. Under the subsidy
programme, 98 per cent sample farmers were benefitted under area expansion followed by 75
per cent IPM/INM, 66 per cent under mechanization and 4 per cent under organic farming
units. Under the capacity building, training sessions were organized at village and nearby
villages and highest number of training programmes were organized by non-governmental
organizations. As large farmers received more assistance from NHM scheme, thereby a need
was felt for strong government intervention to help marginal and small farmers opting
horticultural crops.

179
In Bihar also no case of rejuvenation was found in the sample crops. As regards the NHM
reaching to the households with resource provision, it was found that the majority of sample
farmers were benefitted through various promotional activities undertaken under NHM. About
27 per cent farmers obtained good quality planting material like nursery through NHM.
Nearly 26 per cent farmers indicated having obtained help in INM/IMP and around 25 per
cent benefited through capacity building via training programme under NHM. There was
complete lack of facilities like tissue culture, mother stock block maintenance, fogging and
sprinkler irrigation and post harvest management. The subsidy was also provided to the
sample farmers. The aggregate amount of subsidy was 24345 per household. The percentage
of subsidy to total investment was around 61 per cent.
No cases of rejuvenation was found in aonla, papaya and coriander in Rajasthan. Four farmers
were found in the case of mango who were involved in rejuvenation activities through NHM.
Only about 8 per cent sample farmers cultivating mango were supported for
rejuvenation/protection. The average increase in productivity as a result of rejuvenation was
22 quintals per acre of mango. On resource procurement it was found that around 98 percent
farmers obtained good quality planting material like nursery through NHM. About 50 per cent
farmers were found to use poly-house with ventilation, insect proof netting, fogging and
sprinkler irrigation. Not a single farmer was found to use the modernized post harvest
management system like pack house, storage unit, mobile processing unit etc. The planting
material, fertilizer, pesticides and other inputs and drip/sprinkler were the major items for
which subsidy was provided to the beneficiary farmers. On capacity building, it was found
that the training was provided to the sample farmers through various sources on an average of
1.62 times per HH per year. Around half of the selected farmers suggested that processing
facilities should be provided and necessary infrastructures should be developed in their
villages or nearby villages to accelerate the adoption of horticultural crops.
The resource provision under NHM and rejuvenation activities in Tamil Nadu were observed
among the selected crops. Majority of the sample respondents availed the promotional
activities such as availability of good quality planting materials like nursery, rejuvenation with
improved cultivators, integrated nutrient management or integrated pest management and so
on. As regards subsidy, it was provided for planting materials, fertilizers, pesticides, other
inputs drip/sprinkler irrigation, vermi compost and modern nursery. Training was imparted to
the farmers under NHM. In West Bengal, positive impact of the National Horticulture
Mission could be noticed in the case of area expansion through rejuvenation and protection
resulting into increase in production and productivity of the selected crops. Nonetheless, for
procurement of resources for pineapple and mandarin orange cultivation, informal sources
like private nurseries and fellow farmers continued to play an important role. However, the
survey revealed that the subsidy provision only formed a negligible amount of the total
investment carried out by the sample farmers. Furthermore, very little was done in
dissemination of technology through training and capacity building activities. At the same
time, there was a complete absence of post-harvest management facilities like pack house,
storage units, and mobile processing units in the study regions in West Bengal.
In Haryana farmers did not opt for rejuvenation due to low level of subsidy. Further,
perceptions of farmers about employment generation and increase in household income
through cultivation of kinnow, guava, aonla and garlic were positive. Subsidy provision was
listed as the most important positive factor by 95 per cent farmers. However, response of the
farmers’ regarding infrastructure and capacity building was found poor.

180
Chapter 6
Concluding Remarks and Policy Suggestions
Diversification in consumption pattern is observed in India. The economy is moving from being
a supply-driven economy to a demand-driven economy. With the change in consumption pattern
of the population the production diversification is also evident. Total area and production of fruits
and vegetables in India have gained considerable momentum in the last two decades. The area under
fruits increased from 2.8 million hectares in 1991-92 to 4 million hectares in 2001-02 that further
increased to more than 6 million hectares by the end of the 2009-10. Area under vegetables
increased from 6.2 million hectares in 2001-02 to 8 million hectares in 2009-10. Area under
floriculture and aromatic plants has also experienced some increase although area under such crops
before the beginning of the current decade was almost negligible. Area under floriculture increased
from 1 lakh hectares in 2001-02 to 1.8 lakh hectares in 2009-10. Similarly, area under aromatic and
medicinal plants increased from 1.3 lakh hectares in 2004-05 to 5 lakh hectares in 2009-10. At the
aggregate, area under horticultural crops increased from 12.8 million hectares in 1991-92 to 16.6
million hectares in 2001-02 and further to 20.9 million hectares in 2009-10. Production of
horticultural crops increased from 96.6 million tonnes in 1991-92 to 146 million tonnes in 2001-02
and further to 223 million tonnes in 2009-10.
In the mid 1980s, the horticulture sector was identified by the Government of India as a
promising emerging sector for agricultural diversification to enhance profitability through
efficient land use, optimum utilization of natural resources and creating employment for rural
masses. In the period 1948 to 1980, the main focus of the country was on cereals. During 1980 to
1992 there was consolidation of institutional support and a planned process for the development
of horticulture. In the post 1993 period a focused attention was given to horticulture development
through an enhancement of plan allocation and knowledge-based technology. This decade had
been called a “golden revolution” in horticultural production. The productivity of horticultural
crops increased marginally from 7.6 tonnes per hectare in 1991-92 to 8.8 tonnes per hectare in
2001-02 while area under horticultural crops increased from 12.8 million hectares in 1991-92 to
16.6 million hectares in 2001-02.
The Indian horticulture sector is facing severe constraints like low crop productivity, limited
irrigation facilities and underdeveloped infrastructure support like cold storages, markets, roads,
transportation facilities, etc. There are heavy post-harvest and handling losses, resulting in low
productivity per unit area and high cost of production. However, on the other hand, India’s long
growing-season, diverse soil and climatic conditions provide sufficient opportunity to grow a
variety of horticulture crops. Thus, efforts are needed in the direction to capitalize on our
strengths and remove constraints to meet the goal of moving towards rapid horticultural growth
in India. The foreign trade policy in 2004-09 emphasized the need to boost agricultural exports,
growth and promotion of exports of horticultural products. Horticulture contributes nearly 28
percent of GDP in agriculture and 54 percent of export share in agriculture.

181
During the 10th
Five Year Plan, several schemes were launched to promote the horticulture sector
in the country. The National Horticulture Mission (NHM) was initiated in 2005-06 by the
Government of India, covering 340 districts and the Technology Mission for Integrated
Development of Horticulture in North Eastern states including Sikkim, Jammu & Kashmir,
Himachal Pradesh and Uttarakhand. The main objective of this mission is to promote integrated
development in horticulture, to help in coordinating, stimulating and sustaining the production
and processing of fruits and vegetables and to establish a sound infrastructure in the field of
production, processing and marketing with a focus on post-harvest management to reduce losses.
National Horticulture Mission is a Centrally sponsored scheme in which Government of India
provided 100 percent assistance to the State Mission during the Tenth Plan. During XI Plan, the
assistance from Government of India was 85 percent with 15 percent contribution by the state
governments. The main objective of the Scheme was to develop horticulture to the maximum
potential available in the states and to augment production of all horticultural products including
fruits, vegetables, flowers, plantation crops, spices and medicinal and aromatic plants. The
Scheme has been approved ‘in principle’ for implementation up to the end of XI Five Year Plan.
For implementation of the NHM programme in 18 states, an amount of 630 crore was provided
during 2005-06, an amount of 1000 crore during 2006-07, 1150 crore during 2007-08, while
the outlay for the scheme during 2008-09 was 1100 crore. Presently, the Scheme is being
implemented in 18 States and 2 UTs covering 344 districts of the country for the development of
potential crops. The pattern of assistance was 100 percent to the state governments during X
Plan. With effect from the XI Plan (2007-08), the state governments are contributing 15 percent
of the share.
The activities that can be covered by co-operatives are post harvest management; cold storages;
pack houses; refrigerator vans and mobile processing units. The Mission provides support for
processing activities and marketing activities, like wholesale market; rural markets/Apni-
mandis/Direct markets; functional infrastructure for collection, grading etc; extension, quality
awareness and market led extension activities for fresh and processed products. The Scheme has
been in operation effectively for about four years up to 2009. It was felt necessary to analyze the
impact of the programme vis-à-vis objectives of the NHM scheme especially for the major
focused crops in terms of area expansion, increase in production and productivity. Therefore, this
study has been carried out for impact evaluation in different NHM states through the Agro
Economic Research Centres (AERCs) under the overall leadership of the Agricultural
Development and Rural Transformation Centre (ADRTC) Bangalore and the consolidation of the
report has been done by the ADRTC. The study focuses on the following objectives:
Assess the impact in terms of increase in area, production and productivity of identified
horticultural crops covered under NHM, keeping 2004-05 as the base year in the state in
general and for the identified crops/districts in particular.
Extent to which the scheme has helped in creating employment opportunities and
enhancement of income of the farmers.
Suggest measures in improving the implementation strategy.

182
The study is based on both primary as well as secondary data. The secondary information has
been collected from the National Horticulture Board (NHB) and the Horticultural Department in
the states as well as Directorate of Economics and Statistics, Government of India. The primary
data was collected through intensive sample survey of the selected farmers through structured
questionnaire by visits and personal interviews. Main reliance of the study has been on primary
data. Four districts as instructed by the Ministry of Agriculture, Government of India, were
selected for the detailed primary survey. From each districts, two villages were selected, keeping
into account the cropping pattern in each of these districts taking one village near the periphery
of district headquarters or accessible mandi/market and one village from a distant place to realize
the effect of distance factor in the findings. From each selected village, 25 beneficiary farmers
were selected using random sampling method for detailed household survey. In this way, a total
number of 200 beneficiary farmers were surveyed in details in each selected state. While
selecting the sample care was taken to represent all the section of the society such as small and
marginal farmers, SC/ST farmers and women folk, so that outreach of the programme to these
sections is also reflected in the study/report. Members of Growers Associations, Gram Pradhan,
Block and District level concerned functionaries were also contacted or interviewed. The
reference period for the selected sample was 2008-09 while survey was carried out during the
year 2009-10. The study covers the implementation of the NHM programme from 2005-06 to
2008-09.
6.1 Summary of the findings
6.1.1 Growth in area, production and productivity of horticultural crops in the selected
states
Glancing through area and production of horticultural crops in Karnataka during the last 30
years, on account of expansion in area under fruits, vegetables and commercial flowers, overall
area under horticultural crops in Karnataka increased persistently during the last 30 years.
Horticultural area increased from 9 lakh hectares in TE 1980-81 to 18 lakh hectares in TE 2008-
09. The production increased from 56 lakh tonnes in TE 1980-81 to 134 lakh tonnes in TE 2008-
09. Looking at the long term growth trends, area under almost all horticultural crops expanded in
the decade of 1980s as well as 1990s. Overall, horticultural crops area expanded by significant
rate of around 3 percent per annum during the 1980s and slightly less than 3 percent per annum
in the 1990s. However, against the impressive growth in area under horticultural crops in
Karnataka in the decades of 1980s and 1990s, the yield growth rate of the same was either
insignificant or it was even negative in most of the crops. Overall, yield of horticultural crops
increased by less than one percent in the 1980s but no increase in the 1990s. In the decade of
2000s, there was some reversal in area and yield growth rates. Area under horticultural crops in
Karnataka grew at an annual growth rate of 1.6 percent in the 2000s while yield increased at 1.9
percent whereby yield growth was not significant.
We bifurcated 2000s into 2000-01 to 2004-05 (before NHM) and 2004-05 to 2008-09 (after
NHM), to see the effect of National Horticultural Mission (NHM) on area and yield, although it
is difficult to attribute any expansion in area or yield exclusively to the programme of NHM.
Comparing post NHM with pre NHM, the growth accelerated in both area and yield in the case

183
of fruits but area growth declined for vegetables while their yield growth rate accelerated. In the
case of commercial flowers and medicinal crops, while area growth increased but yield growth
rate declined. The growth in area and yield both declined in the case of aromatic crops which
observed massive increase in area in the early 2000s but stagnated in the later period. At the
aggregate, NHM seems to have overall positive effect on the horticultural crops as area growth
increased from 0.8 percent per annum during the before NHM period to 2.7 percent per annum
during the post NHM period. Similarly, yield growth rate that was negative during the before
NHM period (-4.1 percent per annum), observed a very high growth rate of 6.5 percent per
annum during the post NHM period.
Among the selected crops, National Horticultural Mission helped in increasing area under grapes
in Karnataka, it helped in reversing the decline in yield rate that was happening at a very rapid
pace before the implementation of this programme. In pomegranates, area growth was -1.5
percent per annum before beginning of NHM but turned positive (3.5 percent per annum) after
the implementation of NHM. On the opposite, yield growth was positive (0.5 percent per annum)
before NHM but it turned negative (-1.2 percent per annum) after the implementation of NHM.
Thus, effect of NHM on the pomegranate crop remains indeterminate. On the overall, although
effect of National Horticultural Mission is visible on the area expansion of selected horticultural
crops, however, its effect on the yield rate is yet to be seen.
The area under various horticultural crops in Andhra Pradesh increased from 4.33 lakh hectares
in TE 1980-81 to 19.43 lakh hectares in TE 2009-10. On the other hand, the production increased
from 4.60 lakh tones in 1980-81 to 198.38 lakh tonnes in 2009-10. The increase in area and
production of horticultural crops was largely contributed by increasing trends reported by fruits
and vegetable crops. The analysis of growth trends in area in Andhra Pradesh showed that area
under horticultural crops underwent a significant negative rate (-2.5), while the yield recorded a
positive growth (14.6) during the decade of 1980s. During the decade of 1990s, significant
positive growth was reported in area and yield of fruits, vegetable crops and the total
horticultural crops. In the decade of 2000s, fruits, vegetables and commercial flowers reported a
positive and significant growth in area and yield.
Dividing the period of 2000s into pre (2000 to 2004) and post (2004-2008) NHM, it was seen
from the growth rate statistics that the growth in area of fruits was very high in the before NHM
period while yield rate was negative and insignificant during this period. In the post NHM,
growth in area declined to zero while yield rate increased by more than 8 percent in the case of
fruits. In the case of vegetables, growth and yield was almost negligible in the pre NHM but area
growth increased to 5 percent per annum whereas yield rate fell by 2.7 percent per annum in the
post NHM period. The growth rate in area as well as yield rate of flowers decreased in the post
NHM period compared to pre NHM period while area and yield growth rate increased in the case
of plantation and aromatic and medicinal crops. At the overall, area under all horticultural crops
increased at a rate of 3.7 percent per annum in the pre NHM period that increased to 4.3 percent
per annum in the post NHM period while yield growth rate increased from 1.7 per annum in the
pre NHM to 7.4 percent per annum in post NHM period. Thus, clearly, the implementation of
National Horticulture Mission Scheme helped increasing area as well as yield rate of
horticultural crops in Andhra Pradesh.
184
Among the selected crops in Andhra Pradesh, area growth rate for mango and sweet orange was
found statistically significant and the magnitude was around 3.7 and 4.4 percent per annum,
respectively in the 1980s. During the 1990s, the growth rate in area and yield for mango crop
was found to be statistically significant, while the sweet-orange crop reported a positive and
significant growth only in the case of area whereby data for yield was not available. During the
decade of 2000s, both mango and sweet-orange crops reported a positive and significant growth
in the case of area while mango crop had positive growth, sweet orange crop reported negative
growth in the case of yield. Looking at the before and after NHM period, both mango and sweet
orange observed rapid growth in area during both the periods, while area growth was slightly less
in the post NHM period compared to pre NHM period. On the other hand, the yield growth rate
was negative in the pre NHM period for both the crops that turned positive for mango while
remained negative for the sweet orange in the post NHM period. Nonetheless, the NHM did not
appear to have helped the selected crops in expanding its area or increasing the yield level of
these two selected crops in Andhra Pradesh.
A detailed analysis of percentage growth in area and yield of different horticultural crops in
Bihar revealed that during the decade of 1990s fruits area increased by less than 2 percent per
annum while vegetables area decelerated significantly. The growth in yield was negligible in
fruits and negative in vegetables in Bihar. However, there was complete reversal in the growth of
area as well as yield level of both fruits and vegetables during the 2000s. The expansion in area
as well as yield level of horticultural crops in the decade of 2000s indicate the positive
contribution of NHM in Bihar. Breaking the period of 2000s into pre and post NHM periods, one
can observe that the fruits area declined in the post NHM period but its yield rate increased at a
rapid rate. In all other crops, namely, vegetables, spices and flowers, not only area expanded in
the post NHM but also their yield increased indicating the positive effect of NHM programme in
Bihar.
In the case of selected crops of mango and litchi in Bihar, the area and yield of mango rose by
0.35 per cent and 0.6 per cent, respectively during the period of 2000-01 to 2008-09. Litchi area
increased by around 9 percent per annum while yield rate declined by the same rate of around 9
percent. During the pre NHM period there was almost no growth in the area as well as yield of
mango crop while its yield rate increased by almost 13.5 percent per annum during the post
NHM period. In the case of litchi, there was 7 percent per annum growth in area in the pre NHM
period while yield growth rate was negative during the same period. In the post NHM period, its
area as well as yield grew by around 1.5 to 2 percent per annum. Thus, it is difficult to conclude
that NHM really helped in expansion of area of the selected crops while there is some conclusive
evidence of rise in the yield rate of the selected crops during the post NHM period.
With the concerted efforts of State Horticulture Department, the area under various horticultural
crops in Rajasthan increased from 3.23 lakh hectares during TE 1980-81 to 8.71 lakh hectares
during TE 2008-09. Total horticultural production increased from 1.85 lakh metric tonnes (MT)
during TE 1980-81 to 18.48 lakh MT during TE 2008-09 in the state. The growth in area and
production of horticultural crops was not steady as both the area and production observed
fluctuations during the period under study. The decadal analysis of the physical performance of
horticultural crops revealed that the first two decades, i.e., 1980-81 to 1990-91 and 1990-91 to
185
2000-01 had remarkable growth in area and production of horticultural crops. The area under
horticultural crops grew at an annual rate of 4.5 percent per annum while yield rate increased by
11 percent per annum during the decade of 1980s. Growth in area further increased to 4.63
percent per annum during the 1990s while yield growth decelerated to almost zero during the
same time period. The trends in growth of area and yield reversed during the next decade of
2000s. The growth rate of area decreased to 0.64 per cent per annum whereas yield rate increased
by 7.5 per cent per annum during 2000s.
Further breaking down the period of 2000s into two halves as pre and post NHM periods showed
that whereas the area under horticultural crops was almost stagnant in the pre NHM period
whereby it grew by only 0.5 percent per annum, the area increased at a rapid pace of above 5
percent per annum in the post NHM period exceeding all previous long term growth rate of area
expansion in horticultural crops in the state. However, in the case of yield growth rate, there was
completely an opposite trend. The yield rate of horticultural crops increased by around 5 percent
per annum before NHM period (2000 to 2004) while it decelerated to 1 percent per annum in the
post NHM period. The growth in both area and yield of selected horticultural crops was not
found to be steady. There were ups and downs in both area and yield of selected crops. The
growth in area under mango was noteworthy during the decade of 1980s while the growth in
yield of mango was remarkable during 1990s. The growth of area and yield production of papaya
and aonla was much better during last two decades, i.e., 1990s and 2000s. Particularly, the
growth of area and production of aonla was outstanding during the second decade of our study,
i.e., 1990-91 to 2000-01.
During the decade of 2000s, area under aonla expanded at rapid rate of 28 percent per annum
while growth in area under papaya and coriander area was less than 4 percent and mango area
decelerated during this period. Similarly, yield of papaya increased at a rate of 14 percent per
annum while aonla yield grew at a rate of 6 percent per annum. Yield of other two crops namely,
coriander and mango stagnated or decelerated. Dividing the period between pre and post, area
under aonla decelerated from 23 percent growth rate in the pre to 15 percent in the post harvest
period. Area under papaya accelerated from negative growth of -2 percent per annum to positive
growth of 4 percent per annum. Area under coriander increased from almost zero percent to more
than 10 percent per annum. Area growth under mango remained negative during both the
periods. Yield rate improved for two crops namely aonla and mango while papaya yield
decelerated and coriander yield growth remained negative during both the period. In conclusion,
impact of NHM on selected crops in Rajasthan was inconclusive both in area as well as yield
level.
Total area under all horticultural crops in Tamil Nadu remarkably increased from 4.6 lakh
hectares during triennium ending 1980-81 to 7.99 lakh hectares during TE 2010-11. In tune with
the increase in area, the production of horticultural crops also tremendously increased from 44.78
lakh tonnes to 176.78 lakh tonnes over a period of 3 decades (TE 1980-81 to TE 2010-11). The
growth rate of area and yield of all horticultural crops in Tamil Nadu during the period of 1980s
worked out to 2.5 per cent and 3.0 per cent, respectively, whereas there was a fall in the growth
rate of area (1.9 percent) and yield (1.8 percent) during the period of 1990s. Again a significant
growth rate of 2.5 per cent in area and 4.8 per cent in yield was observed during the decade of

186
2000s. Dividing the period of 2000s into pre and post NHM period, the statistics shows that the
growth rate of area and yield of all horticultural crops during the post NHM period of 2004-05 to
2008-09 worked out to 3.47 per cent and 1.52 per cent, respectively. The growth rate, in area
however, was negative in the pre NHM period while growth in yield was positive 4 percent
during that period. So the in the latter period there was substantial increase in area growth but
there was decline in yield growth in the aggregate horticultural crops implying that the effect of
NHM at the overall was inconclusive.
In Tamil Nadu, the selected crops for this study were mango, banana and flowers. Growth
statistics of selected crops indicates that banana area declined during the decade of 1980s,
increased by around 4 percent per annum during the 1990s and by 3.4 percent per annum in the
2000s. Its yield on the other hand increased at a growth rate of 3 percent per annum in 1980s and
3.4 percent per annum in the 1990s and 2000s. In the case of mango, area growth rate accelerated
from 3.5 percent per annum in the 1980s to 13.7 percent per annum in the 1990s but decelerated
to 2.6 percent per annum in the 2000s. Yield growth of mango was negative in the 1980s and
1990s but became positive in 2000s although its magnitude remained very small. Flowers area
grew at a rate of 3.8 percent per annum in the 1990s but came down to 1.7 percent in the 2000s
while yield growth declined from 16 percent per annum in the 1990s to -4 percent per annum in
the 2000s. Looking at before and after NHM period, area growth rate accelerated from 1.3
percent per annum in the period before NHM to 7 percent per annum in the post NHM period.
However, yield growth decelerated from 1.5 percent per annum to less than 1 percent per annum
during the above mentioned period. Mango observed slight deceleration in the area as well as
yield growth rate during the above two periods. In a similar way flowers, also observed
acceleration in the area as well as yield growth rate. Thus, in the selected crops in Tamil Nadu,
visibly there was some positive impact of NHM on both area as well yield rate.
In West Bengal, the production of fruits grew from 377.23 thousand tonnes in 1991-92 to
2798.71 thousand tonnes in 2009-10 (an increase of more than 6 times), the production of
vegetables grew from 1560 thousand tonnes in 1991-92 to 22355.86 thousand tonne in 2009-10
registering an increase of more than 13 times. In fact in the last decade alone, viz., 2000-01 to
2009-10, total area under horticulture grew from 1043.47 thousand hectares in 2000-01 to
1678.70 thousand hectares (an increase of more than 60 percent), while total horticultural
production grew from 11772.83 thousand tonnes in 2000-01 to 25857.56 thousand tonnes in
2009-10 (an increase of about 120 percent). The area and yield of all horticultural crops grew at
an impressive growth rate of above 12 percent per annum during the decade of 1980s. During the
next decade of 1990s, while yield growth rate was sustained on the same rate of 12 percent per
annum, area growth came down to less than 5 percent per annum. In the next decade, while the
trend rate of growth of area stood at 6.6 percent per annum (2000-01 to 2009-10), the yield
growth was once again sustained at 11.1 percent per annum. The higher trend rate of growth can
be attributed especially to an impressive growth in area and yield of vegetables and spices crops.
At the aggregate, area under horticultural crops grew at a rate of 3 percent per annum in the pre
NHM period that accelerated to 10 percent per annum in the post NHM period. Similarly, yield
growth of all horticultural crops jumped from 3 percent per annum in the pre NHM period to 20
percent per annum in the post NHM period. It comes out that horticulture in West Bengal has
exhibited an impressive growth in both area as well as yield.

187
A detailed analysis of growth rate in area and yield rate of pineapple and mandarin oranges in the
state showed that there was a decline in the area under pineapple cultivation in West Bengal
during the decade of 2000s although insignificant. Yield growth rate of pineapple as well as area
and yield growth in mandarin orange was positive but their volume was not more than 1 to 2
percent for the decade of 2000s. Looking at the pre and post NHM period, area under pineapple
grew at around at 5 percent per annum before NHM period that declined to -6 percent per annum
in the post NHM period. Its yield increased from almost zero growth rate in the pre NHM to 2
percent per annum in the post NHM period. Similarly, yield and area under mandarin orange also
increased from zero percent in the pre NHM period to around 2 percent per annum in the post
NHM period. This confirms that the growth in area and production of pineapple and mandarin
orange lagged far behind the growth of horticulture, especially of fruits in West Bengal.
In Haryana, horticultural crops occupied only minor importance as the share of fruits and
vegetables in the state in all India area under fruits and vegetables clubbed together was only
1.28 per cent during 1996-97 which reached to 1.98 per cent during 2004-05. The area expansion
appeared to be commendable by indicating a growth rate of 9.5 per cent per year during the
above-mentioned period. The further details of area of horticultural crops in Haryana was not
available.
6.1.2 Household characteristics, cropping pattern and production structure of selected
households
Among our selected sample in all the seven states, the household size varied between 4.2
members to 7.5 members while number of earners varied between 1.6 to 3.2. Generally, 1/3rd
members in the household were in the earning status and the number of earning members in the
family had a direct relationship with the holding size. On average, 2/3rd
members of the family
were in the working age and rest, were children below 16 and senior citizens (above 60 years).
More than 1/3rd
to one-half of the households were illiterate or literate up to the primary level,
while around 1/3rd
were educated up to secondary level. Very few members were educated up to
graduate level or above. More than 80 percent occupation of the selected households belonged to
farming alone. The size of operational holdings averaged at around 7 acres among the selected
farmers and it was highest 16.9 acres in Haryana and lowest 2 acres in West Bengal. Average
cropping intensity was 152 and it was highest 189 in Haryana and lowest 112 in West Bengal.
Among the sources of irrigation of selected households, electric tube well was the main source of
irrigation, followed by canal and tanks while selected farmers from West Bengal, Karnataka and
Andhra Pradesh reported to be mainly dependent on rainfall for cultivation of their field.
There were some instances of leasing-in and leasing-out land among the selected farmers. The
terms of tenancy were mostly fixed rent in cash in Rajasthan, Tamil Nadu, West Bengal and
Haryana and rent in cash and kind both were found in Karnataka and Bihar. On average, per
household credit among selected farmers was measured at 1 lakh that varied from only 4
thousand in Bihar, 28 thousand in Tamil Nadu, 52 thousand in Andhra Pradesh, around 2
lakh in Karnataka and Haryana and above 2 lakh in Tamil Nadu. Looking at the credit per acre,
it varied from 810 in Bihar and 23 thouand in Karnataka. Among different sources of credit,

188
institutional credit constituted the major amount around 75 percent and non-institutional had a
share of around 25 percent. The percentage of institutional credit was 55 percent in Bihar and 61
percent in Rajasthan while rest of the five states had more than 80 percent share of institutional
credit in the aggregate credit borrowed by the selected households. The purpose of credit was
generally for agriculture and animal husbandry uses but 1/5th
to 1/6th
share of the credit was used
for consumption and other social ceremony purposes. Overall, per household assets were
measured at 2 lakh and their value ranged from 0.37 lakh in Bihar, to 3.69 lakh in
Rajasthan. Per acre assts value varied from 5 thousand in Bihar and West Bengal, 10
thousand in Andhra Pradesh, 22 thousand in Haryana, 37 thousand in Karnataka and slightly
above 40 thousand in Rajasthan and Tamil Nadu.
The selected farmers were growing, paddy, wheat, coarse cereals, pulses, oilseeds sugarcane,
cotton and horticultural crops. The horticultural crops included fruits, vegetables, plantation,
flowers, medicinal and aromatic crops. Looking at the proportion of horticultural crops grown by
the selected farmers, the highest percentage share of horticultural crops in the gross cropped are
was in West Bengal (60 percent), followed by Andhra Pradesh (42 percent), Tamil Nadu (41
percent), Karnataka (38 percent), Haryana (30 percent), Bihar (24 percent) and Rajasthan only
(13 percent). Among other crops grown, cereals constituted 65 percent of the gross cropped area
in Bihar, 49 percent in Rajasthan, 35 to 40 percent in Haryana, West Bengal, Karnataka and
Tamil Nadu and 23 percent in Andhra Pradesh. Pulses constituted 17 percent of area cropped
among selected farmers in Andhra Pradesh, 8 percent in Karnataka and less than 5 percent in
other states. Similarly, oilseeds occupied around 25 percent area in Rajasthan, 17 percent in
Andhra Pradesh, 14 percent in Karnataka, 12 percent in Haryana and less than 10 percent in the
other selected states. Share of large farmers in horticultural crops like fruits, vegetables,
floriculture, medicinal and aromatic crops, which were mainly more labour intensive crops, was
less than that of small and marginal farmers who had comparatively higher share among these
crops in comparison to traditional crops.
Net house hold income from farm activities after subtracting the cost of production was
measured at 159 thousand in Tamil Nadu, followed by 109 thousand in Haryana, 93
thousand in Karnataka, 87 thousand in Rajasthan, 53 thousand in Andhra Pradesh, 26
thousand in West Bengal and 20 thousand in Bihar. In addition to farm business income, farmers
also had earnings from the non-farm activities. The average non-farm earnings were measured at
109 thousand in Rajasthan, 73 thousand in Haryana, 30 thousand in Tamil Nadu, 27
thousand in Karnataka, 20 thousand in West Bengal, 11 thousand in Andhra Pradesh and
only 6 thousand in Bihar. Adding farm and non-farm income, the aggregate household income
was measured at between 1.8 to 2 lakh in Rajasthan, Tamil Nadu and Haryana, 1.2 lakh in
Karnataka, above 50 thousand in Andhra Pradesh and less than 50 thousand in West Bengal
and Bihar.
6.1.3 The production structure and resource use under horticulture crops
The output produced per acre of grapes in Karnataka by the selected households averaged at 55
quintals per acre and the average revenue earned per acre was 92 thousand. Overall cost of
cultivation of grapes was measured at 66 thousand per acre. Per acre net profits (over total
189
cost) of grapes was measured at 26 thousand. On average, productivity of pomegranate in
Karnataka was found 16 quintals per acre for the selected farmers during the reference year.
Total cost per acre, on an average, was observed at 30 thousand. The net profit was measured
at 13.5 thousand per acre from pomegranate. The realized yield of floriculture crops in
Karnataka averaged at 18 quintals per acre and fluctuated widely among various farm size
holdings. The net profitability covering the fixed and variable cost together averaged at 15.7
thousand whereby only large and marginal farmers had positive profit amounting to 27
thousand and 17.7 thousand, respectively while small and medium farmers incurred losses
amounting to 5 thousand and 3 thousand, respectively. The net profit over variable cost of
medicinal and aromatic crops averaged at 11 thousand and net profit over total cost averaged at
4.6 thousand
In Andhra Pradesh both the crops namely mango and sweet orange were in the gestation period
and therefore there was no revenue or income earned in the cultivation of the these two crops.
However, as usual, the fixed cost was incurred by the farmers during the gestation period. Per
acre fixed cost consisting of material and labour for mango was measured as 28 thousand.
Similar to mango sweet orange orchards of the selected households were also in non-bearing
stage at the time of field survey. The average fixed cost for sweet orange was measured at 31
thousand of which a major proportion was spent on material cost. Comparison of profitability of
horticultural crops with the field crops revealed that .....
In the case of mango in Bihar, total revenue accrued stood at 49289 per acre on an average.
The cost of production of mango was estimated 26041 per acre and net returns (after
subtracting fixed and variable cost) were measured at 23247 per acre. In contrast to mango
cultivation, the cost of production of litchi cultivation was much lower because of lower fixed
and variable cost although revenue earning from litchi crop was also comparatively lower. Total
revenue per acre from litchi cultivation accrued at 24925 on an average. Total costs of
production on the other hand, stood at 14925 per acre. The net return per acre from litchi
cultivation thus turned out to 9999, that was much lower compared to mango crop. A
comparison of net returns from horticultural crops and non-horticultural crops reveals that the net
returns from horticultural crops especially mango remained considerably higher than the
traditional non-horticultural crops measured in terms of net monetary returns per acre of land. In
fact, net returns from mango stood more than double the net returns from traditional crops like
paddy, wheat, maize, lentil and gram. The returns from litchi were also comparatively higher
than all other field crops except the case of lentil whose returns at the aggregate were slightly
higher compared to returns from litchi crops. Marginal and small farmers were found having
edge in growing horticultural crops over the other categories not only in terms of returns but also
in terms of lower cost because of availability of family labour.
Total cost of cultivating of aonla crop in Rajasthan was 20899 per acre. As total revenue was
less than total cost at the aggregate, the per-acre net return was found negative for the aonla crop
in Rajasthan. On average, about 5277 was the net loss per acre of aonla mainly due to crop
being in gestation period as majority of our sample farmers had undertaken new plantation
during the last three to four years. The cost of cultivating papaya crop among selected farmers in
Rajasthan was 28560 per acre while revenue generated was 18232, thus yielding positive net
190
returns to the farmers. Coriander was a short duration crop that takes about three to four months
to get maturity. Similar to the case of papaya, farmers of coriander also earned positive returns
from cultivation of coriander. The per-acre net return from coriander was, on an average, 5434.
Like the case of aonla, mango also did not reach fruit bearing stage, and therefore, the output and
net returns were negligible. It may be noted that the net returns from kharif crops at the aggregate
among the selected households in Rajasthan was 9661 per acre. The average net returns from
foodgrains (bajra, maize, rice, jowar, wheat, and barley), pulses (tur, urad and gram) and oilseeds
(groundnut, soyabean, sesamum and mustard) were 10178, 13833 and 8195, per acre
respectively.
In Tamil Nadu, our analysis was restricted to three crops namely banana, mango and flowers.
Total cost of cultivation per acre of banana worked out to 55994 at the aggregate. Against the
above amount of cost incurred, the average revenue earned by a farmer from the cultivation of an
acre of banana was to the tune of 155833. Total cost of cultivation of mango was measured at
11091 per acre. The net returns earned by a sample farmer by cultivating mango were to the
tune of 2740 per acre. Net returns obtained from mango cultivation were found to be much less
compared to banana and flowers as mango crop was mostly in gestation period. Net returns
obtained by a sample household from the cultivation of flower crop in Tamil Nadu was 81218
per acre. Making a comparison of net returns from horticultural crops with the field crops, the
average returns realized by a sample household from kharif crop was 5947 per acre. When
compared to food grains, the net returns obtained from sugarcane was found to be high. The net
returns obtained from kharif paddy crop were 7301 per acre while the same from sugarcane
were as high as 13636 per acre. The average returns secured by a sample household from the
rabi crops was to the tune of 4956 per acre. Turning to horticultural crops, the average net
returns realized by a sample household was calculated at 35851 per acre. On the overall, except
mango, the returns were much better from the horticultural crops compared to all field crops
including the cash crop of sugarcane that was much better yielding compared to foodgrain crops.
In the case of economics of pineapple production in West Bengal, total revenue per acre stood at
81227. However, the cost of production of pineapple was also quite high 55820 per acre and
net returns turned out to 25406. In sharp contrast to pineapple cultivation, the cost of
production and resource use in mandarin orange cultivation was much lower 10255 per acre
and net return per acre from mandarin orange cultivation turned out to 8189. A comparison of
net returns from horticultural crops and non-horticultural crops in West Bengal revealed that net
return from horticultural crops like mandarin oranges and pineapple remained considerably
higher than the traditional non-horticultural crops measured in terms of net monetary returns per
acre of land. Rabi crops like ginger, potato, turmeric and chilly also yielded a higher return,
though their cultivation was confined to tiny tracts of land, mostly as a backyard garden activity.
The net returns from kinnow cultivation in Haryana were 14327 per acre at the aggregate. The
gross revenue per acre from cultivation of guava on sampled farms was 27840. Gross revenue
per acre from guava was observed 36523 and after subtracting variable and fixed costs, farmers
reaped 28339 per acre during 2008-09. In the case of garlic, net return per acre was computed
as 40612 at the aggregate level. Comparison of net returns from selected horticultural crops
vis-à-vis other crops indicated that net returns from cultivation of flowers followed by garlic

191
cultivation were higher in comparison to traditional crops grown in Haryana such as paddy,
cotton and bajra in kharif season and wheat, mustard, vegetables and summer moong in rabi
season. Among the selected horticultural crops, kinnow exhibited lowest net returns from its
cultivation because the crop was mostly in the initial years of fruit bearing and therefore, yield
rate was found lower in comparison to full bearing stage. At the aggregate net returns from
traditional crops like sugarcane, cotton, paddy, wheat and mustard were noticed lower than the
selected horticultural crops except kinnow which showed lower profitability due to the above
cited reason.
One of the objectives of NHM was to create opportunities for employment generation for skilled
and unskilled persons, especially unemployed youth in the villages. In Karnataka, at the
aggregate, the labour absorption per acre in grapes was 248 man days per annum. Labour use in
pomegranate was much less compared to grapes as per acre man days employed in pomegranate
averaged at 106 days. Mandays employment in flowers was closer to pomegranate while
medicinal and aromatic crops had much less numbers of days generated. Overall, 103 days per
acre man days were absorbed in the flower crop and around 76 days per acre were employed in
the medicinal and aromatic crops. Comparing horticulture with traditional crops, the total
numbers of days of employment per acre generated in Karnataka on the traditional foodgrain
crops varied from 21 days for paddy, 9 days for wheat, 12 days for coarse cereals and 8 days and
pulses and oilseeds, respectively. In the case of commercial crops, employment generated varied
from 24 days per acre on sugarcane to only 12 days in cotton. Thus, horticultural crops had
advantage over traditional food crops not only in terms of higher productivity, value addition and
net profitability but they also provided better employment to the households in comparison to all
other crops grown on the field. There was possibility of further value addition and more
employment generation in case farmers preferred to undertake some processing of the
horticultural crops at the field level.
In Andhra Pradesh, among horticultural crops vegetable crop namely chilies employed more
labour than tomato and onion crop. In the case of selected crops in the state, mango and sweet
orange reported the same amount of labour employed for cultivation. In Bihar, the requirement
of human labour in mango and litchi crops were 64 and 59, that were comparatively two to three
times more than that in maize, wheat, lentil and gram crops. It was one-and-a-half times that of
paddy. In Rajasthan about 30.5 human-days was required for an acre of kharif crops on an
average. In the case of rabi crops, on an average, 34.1 man-days were required for an acre of
land. The horticultural crops were more labour intensive compared to non-horticultural crops as
average man-days required for an acre of horticultural crops was higher than that of non-
horticultural crops. On an average, 54.6 man-days was required for an acre of aonla, 42 man-
days for mango and 93.2 man-days for papaya.
In Tamil Nadu, the man days used for all the kharif crops by the sample households on an
average worked out to 20.76 per acre. For horticultural crops, the sample farmers used 27.57
man days on average per acre. In West Bengal, analysis of the human labour application revealed
that total man days employed varied between 74 in paddy to 80 in millet and maize, 65 in chilies,
54 in ginger, 48 in potato and 89 in turmeric. Among the fruit crops, pineapple employed much
higher man-days averaging at 139 man days while orange and tea plantation employed around 55
192
man days and broom stick employed only 33 man days. In Haryana among traditional crops,
cotton, flowers and moong generated around 20 days of employment. Vegetables generated 16
days per acre employment while average use of labour in horticultural crops was around 29 man
days per acre. Thus, in the horticultural crops, labour requirement is higher compared to field
crops as in the plantation crops labour is required for initial plantation, during the gestation
period and during the period when plant is bearing fruit.
After harvesting and packing where do farmers market their produce is of interest. In the case of
grapes in Karnataka, whole sale market, local market in the nearby town and intermediaries at
the farm gate level were used by the selected farmers to dispose of their produce. Similar to
grapes, marketed surplus of pomegranates was sold through government agency and through
some sort of cooperative marketing. and pre arranged contract with the merchants. Half of the
produce of flowers was sold though wholesale market and rest of the half was sold in local
market, through government agency and through merchants and pre arranged contracts.
Aromatic and medicinal crops were sold through merchants, intermediaries at the farm gate level
and through wholesale markets.
There was absence of regulated markets for fruits and vegetables in the selected districts in
Andhra Pradesh. The sample farmers marketed vegetable crops namely onion, tomato and chilies
through local municipal marketing authorities and Rythu Bazars and whole sale markets. In
Bihar, mango output was marketed through intermediaries at the farm gate, merchant/traders
through pre-arranged contracts and directly to the consumers at village and wholesale markets.
Litchi was also mostly sold to merchant/traders on pre-arranged contracts. In Rajasthan, aonla,
papaya, coriander and mango were sold through wholesale market, pre arranged contracts and
through intermediaries. The selected horticultural crops namely mango, banana and flowers in
Tamol Nadu were marketed through wholesale markets, local market and intermediaries at farm
gate. The pineapple and orange produced by the sample farmers in West Bengal were marketed
through intermediaries at the farm gate, wholesale market and local market. In Haryana, the
horticultural commodities were yet in the gestation period. Horticultural crops were mostly sold
without indulging into any processing except the case of grapes in Bangalore where few farmers
were found undertaking some processing at the field level.
6.1.4 Impact of NHM on the expansion of horticultural crops
In our secondary analysis we observed that at the macro level, implementation of NHM helped
accelerating growth rate in area under horticultural crops while growth in yield was not across
the board. We further tried to validate the above trends observed at the state level with the
ground level information collected through our field survey. We collected area under selected
crops since the beginning of NHM (2004-05 onwards), though the data for the past was memory
based only. The growth rate analysis of primary survey data showed that there was continuous
increase in area under selected horticultural crops in all the seven states and hardly any decline
was visible. Compared to constant increase in area, there were wide fluctuations in the yield rate
for all the selected crops. Concluding the above analysis, National Horticulture Mission appeared
to have succeeded in raising area under horticultural crops in selected states but difficult to say
with firmness whether it had the same effect with respect to yield level.

193
The objective of NHM was to ensure an end-to-end holistic approach covering production, post
harvest management, processing and marketing to assure appropriate returns to growers. In
Karnataka, out of 1.03 acres per household sown area of grapes during 2008, around 0.37 acres
obtained input quantity through NHM. In pomegranate, out of 0.60 acres per household, 0.16
acres were provided input support. Similarly, in flowers, out of 0.3 acre per household cultivated,
less than 0.1 acres obtained input support. In the case of aromatic and medicinal plants, out of
0.3 acres per household planted, around 0.2 acres per household were provided input support. All
the resources procured were provided by Department of Horticulture (DOH), Karnataka
Government, advanced contract with the buyers and private nursery. Total area rejuvenated
among all the selected households was 21 acres of grapes, 17.5 acres of pomegranate and only
1.5 acres of flowers. The few households who rejuvenated their plants indicated significant
increase in productivity after rejuvenation. The sample farmers indicated that the best help
provided by the NHM was in terms of providing them planting material like nursery or seedling.
Selected households also indicated that they were provided with the help in putting up poly
house ventilation, insect proof net and putting up infrastructure for sprinkler irrigation. The
aggregate amount of investment per acre of net sown area was around 7 thousand in Karnataka.
Among all activities, the highest numbers of households received subsidy for nursery and
planting material followed by drip irrigation, plant protection and maintenance activities. At the
aggregate, subsidy proportion of total investment was 33 percent. On the capacity building,
training was provided to the sample farmers by various departments albeit numbers of household
reported having obtained training was really very small. Inquiring about how NHM helped
farmers to increase their area under horticultural crops, a majority of the beneficiaries indicated
that NHM helped them by various ways like providing seedling/nursery, fertilizer and plant
protection etc. However, NHM failed completely in making provision of processing facility,
market for the end product and building capacity by proper training. Although majority of the
farmers were happy about the subsidy provision under the NHM but the amount of subsidy was a
cause of concern for many of them. The infrastructure building especially that of post harvest
management as well as capacity building under NHM was found lacking although some attempts
were made in that direction.
Response of farmers about area expansion under horticultural crops after adoption of the NHM
was positive in Andhra Pradesh. The average household sample area under mango and sweet
orange crops increased from 0.32 acres and 0.57 acres to 3.60 and 2.61 acres, respectively during
the period 2005-06 to 2008-09. All the area under selected crops was in the gestation period and
thereby no rejuvenation activity was observed among the selected farmers in the state. Regarding
resource procurement, majority of respondents received planting material. Under the subsidy
programme, 98 per cent sample farmers were benefitted under area expansion followed by 75 per
cent IPM/INM, 66 per cent under mechanization and 4 per cent under organic farming units.
Under the capacity building, training sessions were organized at village and nearby villages and
highest number of training programmes were organized by non-governmental organizations. The
selected farmers informed that need more training and awareness programmes more technical
staff for frequent field visits and mechanization. As large farmers received more assistance from
NHM scheme, thereby a need was felt for strong government intervention to help marginal and
small farmers opting horticultural crops.

194
In Bihar impact of NHM on area of mango and litchi was found quite impressive but its impact
on yield was indeterminate because of the crops being in gestation period. No case of
rejuvenation was found in the sample crops. As regards the NHM reaching to the households
with resource provision, it was found that the majority of sample farmers were benefitted
through various promotional activities undertaken under NHM. About 27 per cent farmers
obtained good quality planting material like nursery through NHM. Nearly 26 per cent farmers
indicated having obtained help in INM/IMP and around 25 per cent benefited through capacity
building via training programme under NHM. There was complete lack of facilities like tissue
culture, mother stock block maintenance, fogging and sprinkler irrigation and post harvest
management. The subsidy was also provided to the sample farmers. The aggregate amount of
subsidy was 24345 per household. The percentage of subsidy to total investment was around
61 per cent.
While analyzing the impact of NHM on area and yield of selected horticultural crops in
Rajasthan, namely aonla, papaya, coriander and mango during a period from 2004-05 to 2009-
10, it was found that the extent of expansion of area under these crops was impressive but the
overall increase in yield was not satisfactory. No cases of rejuvenation was found in aonla,
papaya and coriander. Four farmers were found in the case of mango who were involved in
rejuvenation activities through NHM. Only about 8 per cent sample farmers cultivating mango
were supported for rejuvenation/protection. The average increase in productivity as a result of
rejuvenation was 22 quintals per acre of mango. On resource procurement it was found that
around 98 percent farmers obtained good quality planting material like nursery through NHM.
About 50 per cent farmers were found to use poly-house with ventilation, insect proof netting,
fogging and sprinkler irrigation. As high as 91 per cent farmers said that they used and promoted
integrated nutrient management (INM) or integrated pest management (IPM). Around 40 per
cent farmers indicated that they established new garden or seed production unit with the use of
NHM assistance. However, none of the farmers were associated with upgrading the existing
tissue culture unit, soil sterilization and steam sterilization system with boilers, precision farming
implements. Not a single farmer was found to use the modernized post harvest management
system like pack house, storage unit, mobile processing unit etc. The planting material, fertilizer,
pesticides and other inputs and drip/sprinkler were the major items for which subsidy was
provided to the beneficiary farmers. On capacity building, it was found that the training was
provided to the sample farmers through various sources on an average of 1.62 times per HH per
year. Around half of the selected farmers suggested that processing facilities should be provided
and necessary infrastructures should be developed in their villages or nearby villages to
accelerate the adoption of horticultural crops.
In Tamil Nadu there was no change in the area under mango and banana crops cultivated by the
sample respondents and the area remained almost same during the period from 2004-2005 to
2009-10. The area under flower crop, however, increased to some extent as it was 0.27 acre per
household in 2004-05 that increased to 0.34 acre per household during 2008-09. Average yield of
selected crops increased in general although intra year fluctuations were observed. The resource
provision under NHM and rejuvenation activities were observed among the selected crops.
Majority of the sample respondents availed the promotional activities such as availability of

195
good quality planting materials like nursery, rejuvenation with improved cultivators, integrated
nutrient management or integrated pest management and so on. As regards subsidy, it was
provided for planting materials, fertilizers, pesticides, other inputs drip/sprinkler irrigation, vermi
compost and modern nursery. All 50 respondents growing banana crop received subsidy for
fertilizer, pesticides, other inputs and vermi compost, while all the 50 sample households
growing mango availed subsidy for planting material, fertilize, pesticides, other inputs and vermi
compost and the same was case for flower crop. Training was imparted to the farmers under
NHM. As regard frequency of training, it was 1.87 times per household per year through all
sources. The average number of days training provided through all sources was 2.75 per
household per year.
In West Bengal, area and yield rate of mandarin oranges increased significantly during the period
2004-05 to 2009-10 whereas only marginal increase was observed in area and yield rate of
pineapple among the selected farmers. At the same time, there was a gradual increase in the
coverage under certified inputs, which indicates a gradual shift of production technology with
certified inputs in place of traditional inputs. The positive impact of the National Horticulture
Mission could also be noticed in the case of area expansion through rejuvenation and protection
resulting into increase in production and productivity of the above mentioned crops. Nonetheless,
for procurement of resources for pineapple and mandarin orange cultivation, informal sources
like private nurseries and fellow farmers continued to play an important role. However, the
survey revealed that the subsidy provision only formed a negligible amount of the total
investment carried out by the sample farmers. Furthermore, very little was done in dissemination
of technology through training and capacity building activities. At the same time, there was a
complete absence of post-harvest management facilities like pack house, storage units, and
mobile processing units in the study regions in West Bengal.
In Haryana response of farmers about area expansion under horticultural crops after adoption of
the NHM was positive. But, they did not opt for rejuvenation due to low level of subsidy.
Further, perceptions of farmers about employment generation and increase in household income
through cultivation of kinnow, guava, aonla and garlic were positive. Overall, majority of the
farmers reported increase in household income after implementation of the NHM, but the major
beneficiaries of the Mission were large farmers. Hence, there is an urgent need for strong
government intervention to help marginal farmers in raising household income through
cultivation of horticultural crops. Subsidy provision was listed as the most important positive
factor by 95 per cent farmers. However, response of the farmers’ regarding infrastructure and
capacity building was found poor. Frequency of the training provided by the State Horticulture
Department to beneficiaries of the NHM was 1.75 trainings during the year 2008-09.
Respondents informed during the discussion that they were not satisfied with the training
programmes organized by various institutions to impart knowledge about activities and package
of practices for cultivation of horticultural crops under the Mission. Moreover, training was of
very short duration and it was not sufficient to provide full details. Growers of selected
horticultural crops received subsidy from the government for seedling, fertilizer, pesticides, drip
irrigation and water tank. The highest percentage of farmers receiving subsidy was noticed for
kinnow followed by guava. None of the sampled farmers opted for processing despite
196
understanding the benefits of processing and increase in profits after value addition. This brings
out the importance of micro economic policies relating to public investment in processing.
6.3 Policy suggestions
For growth of horticultural crops in general and selected crops in particular, the following policy
suggestions may help strengthening the implementation of NHM in the selected states.
The main objective of NHM is to increase area and yield rate of horticultural crops. In
our analysis of historical data before and after implementation of NHM as well household
survey data, a large degree of spatial and temporal variations was observed especially in
the yield rate of different horticultural crops. One of the foremost reasons for yield
fluctuations was erratic rainfall and periodic occurrence of droughts. Although, among
our selected households, horticultural crops were grown more on the irrigated area,
however, quality of irrigation was a big question as the latter was subject to fluctuating
power supply in the villages. Thus, there is a clear need to increase irrigation facilities
and erratic power supply for agriculture need to be corrected. Many of the farmers
expressed need for more subsidy provision for putting up infrastructure for drip
irrigation. Additional financial assistance is needed from the Central government to raise
subsidy on drip irrigation that can prove much helpful not only increasing area under
horticultural crops but also increasing productivity and reducing fluctuations in the yield
rate of horticultural crops.
A majority of our respondents indicated that NHM has helped increasing the employment
opportunities for farmers through expansion of area under horticultural crops. There was
however, no special subsidy for farmers having shifted their area from the field crops to
horticultural crops. Introducing specified subsidy for the area shifted from field to
horticultural crops may lead to not only expansion in area under horticultural crops but
also enhancement in employment opportunities as man-days employment is higher on
horticultural crops compared to foodgrains and other commercial crops.
In our study area more than 90 percent of the household beneficiaries of horticultural
crops were not happy with infrastructure and capacity building activities under the NHM
programme. Farmers need training for proper use of various inputs and performing best
farm practices such as planting and pruning, INM, IPM, organic farming, use and
maintenance of drip/sprinkler irrigation system etc. Imparting training is needed for plant
protection, rejuvenation and so on. Lack of proper capacity building at the farm level
reflected in poor participation of the farmers in some of the activities underlined in NHM
like upgrading existing tissue culture units, raising root stock seedling under net house
conditions, soil sterilization etc. The awareness camps for various components of NHM
and procedures and norms for availing such subsidies by the farmers under NHM need to
be arranged frequently and at the door steps of the farmers. Extensive publicity of NHM
programme is required at the Gram Panchayat level.
There were large numbers of farmers who expressed their dissatisfaction regarding
marketing facilities. For marketing their produce farmers depended in many cases on
merchants and intermediaries who were exploitative in nature. Suitable wholesale and
terminal markets with in-built cold chain and where-house facility for the sale of

197
horticultural crops in general and flowers and aromatic crops in particular shall be opened
in big cities and towns in the horticulture production belt. There is also need for creation
of chain of collection centres of farmers’ produce in rural areas to feed the
terminal/wholesale markets mentioned above.
Post harvest management was found completely lacking in the selected areas.
Requirement of pack house and cold storage was expressed by most of the farmers given
the perishable nature of horticultural crops. The selected horticultural crops were mostly
sold by the farmers without indulging into any processing except the case of grapes
where few farmers were found undertaking some processing at the field level. Lack of
post harvest handling and storage also lead to post harvest losses. Management of post
harvest losses, processing, transportation, storage and marketing needs considerable
attention. There is need for advancement of good post harvest management practices like
usage of cold chain, ripening chambers and processing activities for more value addition
in the horticultural produce. Creation of additional post harvest management
infrastructure under NHM is required. Value addition in floriculture, e.g., cut flower and
aromatic crops at the farm level need to be popularized to provide more employment to
unemployed youth in the rural areas.
In addition to the above, other measures required for the expansion of horticultural area
includes the following steps: more area needs to be brought under drip irrigation, rain
water harvesting and expansion of other micro irrigation systems need to be emphasized;
establishment of community seed banks with identification of genotypes for specific agro
climatic regions; INM and IPM practices and rejuvenation and replacement of senile
plants need to be popularized whereby appropriate subsidy and capacity building should
be provided to the farmers; vermi compost/bio digester units need to be established for
the promotion of organic farming; contact farming in horticultural crops need promotion
as there is a lot of scope for the agri-business and corporate sector to enter in horticulture
on a big way and therefore the relevant Act needs amendment favouring written and legal
contract between the corporate and small farmers.

198
References
Baruah. S: “Horticulture Development in Assam” New star, July 7, 1984.
Basu, Kaushik (1983), The Emergence of Isolation and Inter linkage in Rural Markets, Oxford
Economic Papers, Vol. 35, Pp-262-80.
Chadha, K.L. (2011), “Handbook of Horticulture” Directorate of Knowledge Management in
Agriculture, Indian Council of Agricultural Research, Krishi Anusandhan Bhawan, Pusa,
Nes Delhi.
Chand Ramesh, S.S.Raju and L.M. Pandey (2008), “Progress and Potential of Horticulture in
India”, Indian Journal of Agricultural Economics, Vol. 63 (3), July-September.
Gandhi, Vasant P. and Namboodri: Fruits and Vegetables Marketing in India; Glimpses of
Indian Agriculture, Vol.1 2008.
Gondalia, V. K. and G. N. Patel (2007), An Economic Evaluation of Investment on Aonla
(Emblica officinalis G.) in Gujarat, Agricultural Economics Research Review, Vol 20,
July-December, pp-385-394.
Government of India (2007), Report of Working Group on Horticulture, Plantation Crops, and
Organic Farming for the XI Five Year Plan (2007-12), Planning Commission, Government
of India, New Delhi.
Government of India (2010), NHM Operational Guidelines 2010, Ministry of Agriculture,
Department of Agriculture and Cooperation, Krishi Bhawan, New Delhi, www.nhm.nic.in
Government of Rajasthan (2009b), NHM Annual Action Plan 2009-10, Rajasthan Horticulture
Development Society, Directorate of Horticulture, Pant Krishi Bhawan, Jaipur.
Gupta, A.K. and Manu Shorf (1987), ‘Rural Credit: How Does the Poor See It?’, Vikalpa,
Vol.12, No.4
Gupta, G.S., and George, P.S. (1974), “Profitability of Nagpur Santra (Oranges) Cultivation”,
Indian Journal of Agricultural Economics, Vol. 29(3), July-September.
Jabir Ali and Sanjeev Kapoor (2008), “Farmers’ Perception on Risks in Fruits and Vegetables
Production: An Empirical Study of Uttar Pradesh, Agricultural Economics Research
Review, Vol.21 (Conference Number)
Jodhka, S.S. (1995), Debt, Dependence and Agrarian Change, Rawat Publications, Jaipur
Kumar, Parmod and Anil Sharma (2006), “Perennial Crop Supply Response Functions: The case
of Indian Rubber, Tea and Coffee”, Indian Journal of Agricultural Economics, Vol. 61 (4),
October-December.
Madakadze, R., M. Masarirambi and E. Nyakudya (2004), “Processing of Horticultural Crops in
the Tropics”, in Ramdane Dris and S. Mohan Jain (Eds), Production Practices and Quality
Assessment of Food Crops, Springer, 2004, pp. 371-399.
Mahendra Singh, and V.C. Mathur (2008), “Structural Changes in Horticulture in India:
Retrospect and Prospect for XIth
Five Year Plan,” Indian Journal of Agricultural
Economics, Vol. 63 (3), July-September.
Mittal, Surabhi (2007); Can Horticulture be a Success Story for India, Working Paper No. 197,
Indian Council for Research on International Economic Relations (ICRIER).
Mittal, Surabhi (2009), “Feasibility Check for Diversification towards Horticultural Production,”
Agricultural Economics Research Review, Vol. 22 (1), January-June.

199
Murthy Srinivasa, D. Gajanana, T.M. Sudha, M. and Dakshinamorthy V. (2009), “Marketing and
Post-harvest Losses in Fruits. Its implications on availability and Economy”, Indian
Journal of Agricultural Economics, Vol. 64 (2), April-June.
Misra, Sib Ranjan (1992), “Resource Use Efficiency in Tea Plantations” Agricultural Situation in
India, February.
National Horticulture Board (2010), ‘Indian Horticulture Database 2010’, NHB, Department of
Agriculture and Cooperation, Government of India, New Delhi.
Planning Commission, GOI, ‘Report of the ‘Steering Committee on Agriculture and Allied Sectors
for Formulation of the 11th Five Year Plan’, Planning Commission, Government of India,
New Delhi.
Pratap Birthal, S., P. K. Joshi, Sonia Chauhan and Harvinder Singh(2008), “Can Horticulture
Revitalize Agricultural Growth,” Indian Journal of Agricultural Economics, Vol. 63 (3),
July-September.
Rao, J.M. (1980), Interest Rates in Backward Agriculture, Cambridge Journal of Economics,
Vol.4.
Sarma, Aswini Kumar (1996),”An Economic Appraisal of Small Tea Cultivation in Golaghat
District of Assam” Agricultural Situation in India, June, pp. 161-167.
Sarap, Kailash (1991), Interlinked Agrarian Markets in Rural India, Sage, New Delhi,
Satish Y. Deodhar; Indian apple market, prospects and policies for trade; Centre for
Management in Agriculture, IIM, Ahmedabad, 2005.
Sharma Anil, Parmod Kumar, S.C. Aggarwal and S.K. Singh (2001), “‘Price Stabilisation of
Selected Commodities: An Analysis of Alternative Policy Options’ NCAER Mimeo,
September.
Shikhamany, S.D. (2001), “Grape Production in India” In Minas K. Papademetriou and Frank J.
Dent (edited), Grape Production in the Asia-Pacific Region; Food and Agriculture
Organization of the United Nations Regional Office for Asia and the Pacific, Bangkok,
Thailand, July 2001.
Shroff Sangeeta and Jayanti Kajale (2008), “Government Intervention in Horticulture
Development-The Case of Maharashtra,” Indian Journal of Agricultural Economics,
Vol.63, (3), July-September.
Singh, Gorakh (2010), Horticulture: Keeping Health and Happiness, Agriculture Year Book
2010, Agriculture Toady, New Delhi, pp-32-36.
Singh, H.P. (2009), Conference keynote paper on, “Triggering Agricultural Development
Through Horticultural Crops”, Indian Journal of Agricultural Economics, Vol.64 (1),
January-March.
Singh R.K. and D.S. Singh: “Diversification of Indian Challenge”, Indian Journal of
Agricultural Economics.
Singh R.,V.P. Patel and S.K. Singh (2006), “Current Status and Future Thrust of Temperate
Fruits in India in,”Temperate Horticulture: Current Scenario”, (edited) Kishore D.K.,
Sharma Satish K., and Pramanick K.K, New India Publishing Agency, New Delhi.
Subrahmanyam, K.V. and Mohandoss, V. (1982), “Economic Evaluation of Coorg Mandarin
(Orange) in Karnataka” Indian Journal of Agricultural Economics, Vol. 37(1), Jan-March.
Swain, M (1986), Usurious Interest Rates in Backward Agriculture: Interlinkage, Competition
and Monopoly, M.Phil Dissertation, Delhi School of Economics, University of Delhi.
200
Swain, M (2001), Rural Indebtedness and Usurious Interest Rates in Eastern India: Some Micro
Evidence, Journal of Social and Economic Development, Vol.3, No.1, pp-122-43.
Swain, M. and M. Swain (2007), Rural Credit Market Imperfections in Drought Prone Bolangir
District of Orissa: Some Critical Issues and Policy Options’, Artha Vijnana, Vol. 49, No. 3
& 4, Sept.- Dec., 2007, pp.223-254.
Subrahmanyam K.V. and Mohandoss V. (1982), “Economic Evaluation of Coorg Mandarin
(Orange) in Karnataka”, Indian Journal of Agricultural Economics, Vol. 37 (1), January-
March.
Uma Devi S. (1977), “Perennial Crop Supply Response: The Case of Indian Natural Rubber”,
Indian Journal Agricultural Economics, Vol. 32 (4), October-December.
Varangis, Panos and Donald Larson (1996), “Dealing with Commodity Price Uncertainty “,
Policy Research Working Paper No. 1667, The World Bank, Washington, DC.
Varangis, Panos, Takamasa Akiyama and Donald Larsen (1995), “Managing Commodity Booms
and Busts”, The World Bank, Washington, DC.
Viju, I.C. and Prabhakaran, T. (1983), “Price Response of a Perennial Crop: A Case of Indian
Natural Rubber”, Indian Journal of Agricultural Economics, Vol. 43 (4), October-
December.
Website
National Horticulture Mission Karnataka, website:
http://www.horticulture.kar.nic.in/NHM%20Action%20plan_05-06.htm

201
Annexure Table 1.1A: The details of the crops and number of households selected in each
state
Name of
the State Districts Selected Crops Selected
No of HH
survyed
Name of the
AERC/Unit
Haryana Sirsa, Rohtak,
Hissar
Citrus, Guava,
Garlic, Aonla
150 AERC Delhi
Tamil
Nadu
Krishinagiri,
Dharmapuri, Salem
Mango, Banana,
Flower
150 AERC Chennai
West
Bengal
Murshidabad,
Nadia, Hoogly
Pineapple,
Orange
100 AERC Visva-Bharati,
Santiniketan
Rajasthan
Jaipur, Alwar Papaya, Aonala 200 AERC Vallabh Vidya
Nagar Banswara,
Chittorgarh Garlic, Ginger
A.P.
Rangareddy,
Nalgonda,
Prakasham,
Kurnool
Sweet Orange,
mango
200
AERC Waltair
Bihar Muzaffarpur,
Vaishali Mango, Litchi
100 AERC Bhagalpur
Karna
taka
Bijapur, Bagalkot Grape,
Pomegranate
212 Institute for Social
and Economic
Change, Bangalore Bangalore (R),
Tumkur
Flower, M & A
plants

202
Annexure Table 2.1A: Area and production of horticultural crops in the state Karnataka
(Area in lakh hectares, production in lakh tones)
Year Fruits Vegetables Spices, gardn
& plantation
Commercial
Flowers
Medicinal Aromatic Total
Area Prodn. Area Prodn. Area Prodn. Area Prodn. Area Prodn. Area Prodn. Area Prodn.
TE 80-81 1.53 23.92 1.22 19.27 6.03 12.79 0.04 0.23 - - - - 9.04 56.21
TE 81-82 1.56 24.31 1.20 18.82 6.54 13.44 0.05 0.25 - - - - 9.35 56.82
TE 82-83 1.63 24.50 1.17 17.24 7.00 14.13 0.05 0.28 - - - - 9.86 56.15
TE 83-84 1.68 25.10 1.23 18.17 7.20 14.50 0.06 0.31 - - - - 10.17 58.08
TE 84-85 1.72 27.07 1.33 19.78 7.39 15.59 0.07 0.36 - - - - 10.50 62.79
TE 85-86 1.74 27.73 1.41 22.32 7.65 16.02 0.07 0.39 - - - - 10.88 66.46
TE 86-87 1.78 28.74 1.52 24.19 7.72 16.04 0.08 0.43 - - - - 11.11 69.40
TE 87-88 1.84 28.32 1.60 25.31 7.79 16.21 0.09 0.46 - - - - 11.31 70.29
TE 88-89 1.91 29.32 1.74 27.04 7.88 16.89 0.09 0.49 - - - - 11.62 73.74
TE 89-90 2.00 30.50 1.81 27.75 8.00 17.33 0.10 0.52 - - - - 11.90 76.10
TE 90-91 2.08 31.72 1.86 28.62 8.12 17.15 0.11 0.56 - - - - 12.17 78.05
TE 91-92 2.13 33.87 1.88 32.65 8.18 17.08 0.12 0.63 - - - - 12.31 84.22
TE 92-93 2.21 36.67 1.95 37.24 8.30 16.50 0.13 0.71 - - - - 12.60 91.11
TE 93-94 2.34 40.27 2.09 42.94 8.41 15.82 0.14 0.79 - - - - 12.97 99.83
TE 94-95 2.50 43.21 2.21 45.01 8.59 15.34 0.15 0.90 - - - - 13.45 104.46
TE 95-96 2.67 45.93 2.28 46.64 8.88 16.82 0.17 0.99 - - - - 14.00 110.37
TE 96-97 2.83 48.47 2.33 47.53 9.43 19.17 0.19 1.09 - - - - 14.78 116.26
TE 97-98 2.96 47.57 2.58 45.96 9.41 17.30 0.19 1.07 - - - - 15.14 111.90
TE 98-99 3.02 47.62 2.89 46.34 9.16 15.53 0.20 1.14 - - - - 15.27 110.63
TE 99-00 3.06 45.50 3.23 45.14 8.76 12.41 0.20 1.19 - - - - 15.25 104.24
TE 00-01 3.07 46.79 3.33 46.73 8.77 13.34 0.21 1.30 - - - - 15.36 108.16
TE 01-02 3.12 44.96 2.27 32.12 9.12 10.43 0.20 1.37 - - - - 15.79 101.81
TE 02-03 2.55 40.39 2.38 31.71 9.33 8.49 0.18 1.45 - - - - 15.83 97.29
TE 03-04 2.49 39.34 2.80 34.98 9.27 8.32 0.18 1.45 0.005 0.029 0.01 0.19 15.69 94.62
TE 04-05 2.51 39.83 3.67 43.49 9.46 9.28 0.19 1.47 0.006 0.019 0.01 0.18 15.84 94.13
TE 05-06 2.52 40.85 3.79 50.85 9.54 9.70 0.20 1.04 0.007 0.015 0.01 0.08 16.07 103.02
TE 06-07 2.64 43.87 3.95 60.39 9.86 10.61 0.21 1.20 0.008 0.019 0.01 0.09 16.69 116.68
TE 07-08 2.79 46.94 4.14 70.26 9.95 10.61 0.23 1.35 0.011 0.024 0.01 0.11 17.13 129.79
TE 08-09 2.99 50.90 4.20 70.45 10.16 10.97 0.25 1.95 0.015 0.028 0.01 0.13 17.63 134.43
Source: Department of Horticulture, Government of Karnataka; http://www.horticulture.kar.nic.in/
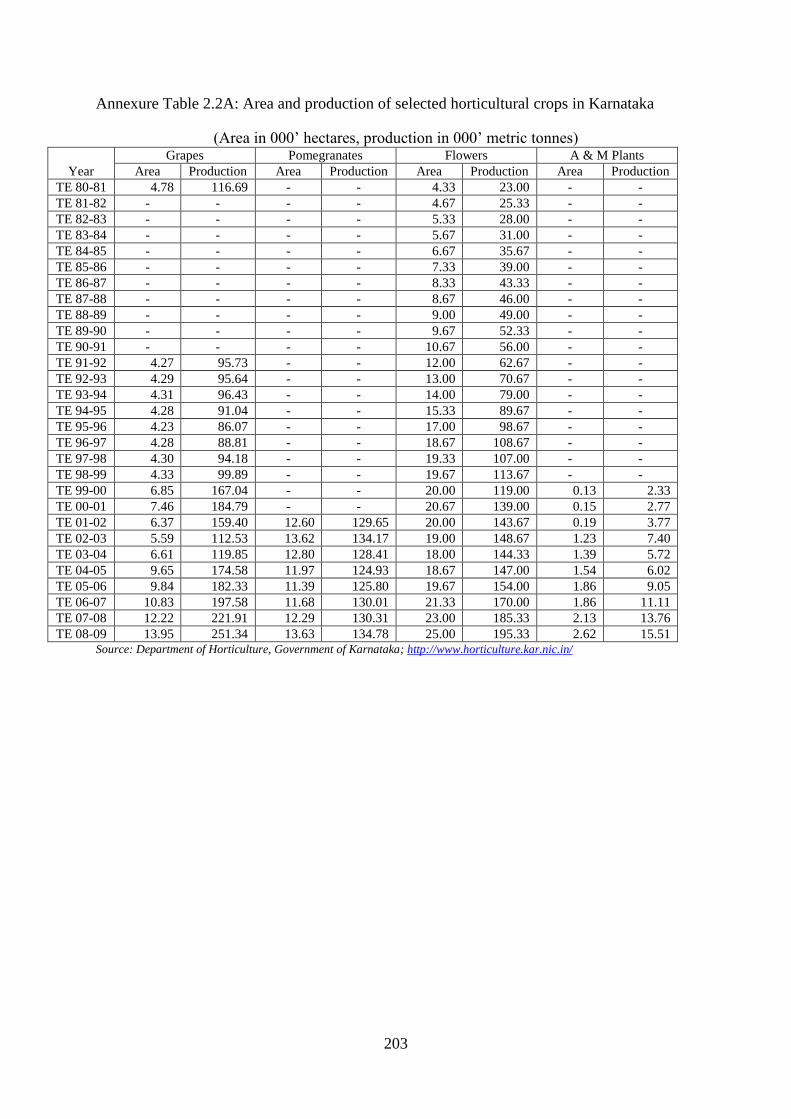
203
Annexure Table 2.2A: Area and production of selected horticultural crops in Karnataka
(Area in 000’ hectares, production in 000’ metric tonnes)
Year
Grapes Pomegranates Flowers A & M Plants
Area Production Area Production Area Production Area Production
TE 80-81 4.78 116.69 - - 4.33 23.00 - -
TE 81-82 - - - - 4.67 25.33 - -
TE 82-83 - - - - 5.33 28.00 - -
TE 83-84 - - - - 5.67 31.00 - -
TE 84-85 - - - - 6.67 35.67 - -
TE 85-86 - - - - 7.33 39.00 - -
TE 86-87 - - - - 8.33 43.33 - -
TE 87-88 - - - - 8.67 46.00 - -
TE 88-89 - - - - 9.00 49.00 - -
TE 89-90 - - - - 9.67 52.33 - -
TE 90-91 - - - - 10.67 56.00 - -
TE 91-92 4.27 95.73 - - 12.00 62.67 - -
TE 92-93 4.29 95.64 - - 13.00 70.67 - -
TE 93-94 4.31 96.43 - - 14.00 79.00 - -
TE 94-95 4.28 91.04 - - 15.33 89.67 - -
TE 95-96 4.23 86.07 - - 17.00 98.67 - -
TE 96-97 4.28 88.81 - - 18.67 108.67 - -
TE 97-98 4.30 94.18 - - 19.33 107.00 - -
TE 98-99 4.33 99.89 - - 19.67 113.67 - -
TE 99-00 6.85 167.04 - - 20.00 119.00 0.13 2.33
TE 00-01 7.46 184.79 - - 20.67 139.00 0.15 2.77
TE 01-02 6.37 159.40 12.60 129.65 20.00 143.67 0.19 3.77
TE 02-03 5.59 112.53 13.62 134.17 19.00 148.67 1.23 7.40
TE 03-04 6.61 119.85 12.80 128.41 18.00 144.33 1.39 5.72
TE 04-05 9.65 174.58 11.97 124.93 18.67 147.00 1.54 6.02
TE 05-06 9.84 182.33 11.39 125.80 19.67 154.00 1.86 9.05
TE 06-07 10.83 197.58 11.68 130.01 21.33 170.00 1.86 11.11
TE 07-08 12.22 221.91 12.29 130.31 23.00 185.33 2.13 13.76
TE 08-09 13.95 251.34 13.63 134.78 25.00 195.33 2.62 15.51 Source: Department of Horticulture, Government of Karnataka; http://www.horticulture.kar.nic.in/
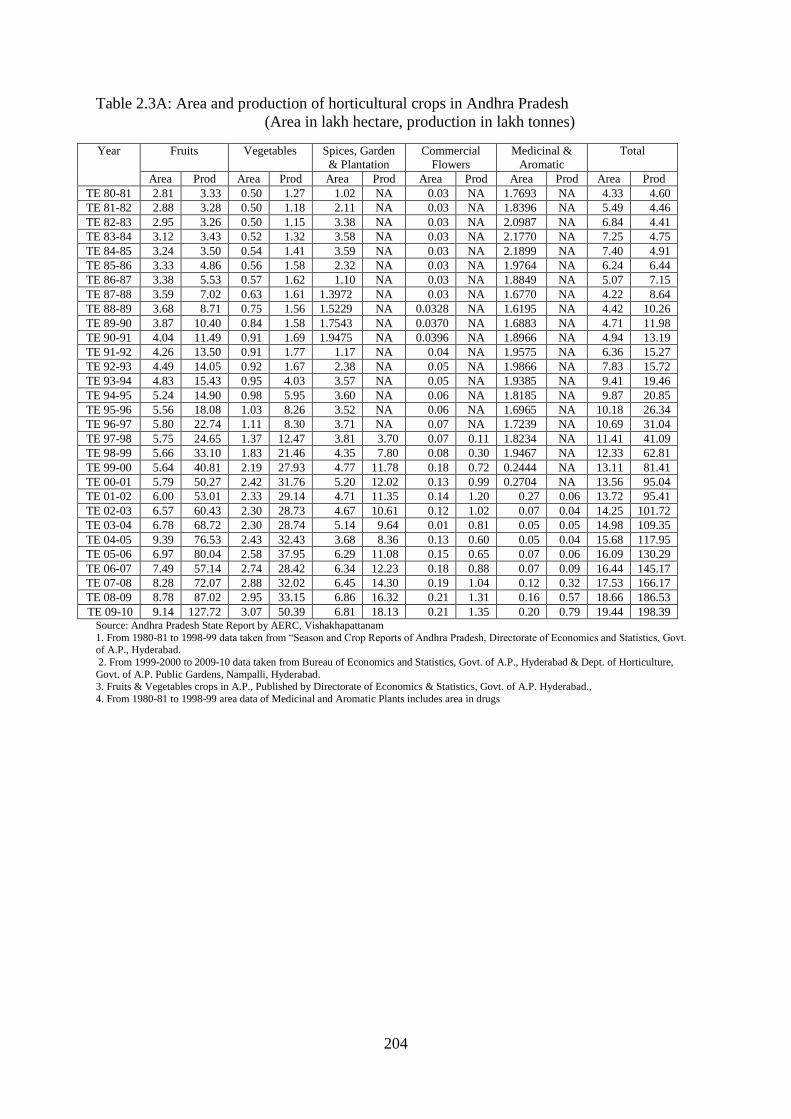
204
Table 2.3A: Area and production of horticultural crops in Andhra Pradesh
(Area in lakh hectare, production in lakh tonnes)
Year Fruits Vegetables Spices, Garden
& Plantation
Commercial
Flowers
Medicinal &
Aromatic
Total
Area Prod Area Prod Area Prod Area Prod Area Prod Area Prod
TE 80-81 2.81 3.33 0.50 1.27 1.02 NA 0.03 NA 1.7693 NA 4.33 4.60
TE 81-82 2.88 3.28 0.50 1.18 2.11 NA 0.03 NA 1.8396 NA 5.49 4.46
TE 82-83 2.95 3.26 0.50 1.15 3.38 NA 0.03 NA 2.0987 NA 6.84 4.41
TE 83-84 3.12 3.43 0.52 1.32 3.58 NA 0.03 NA 2.1770 NA 7.25 4.75
TE 84-85 3.24 3.50 0.54 1.41 3.59 NA 0.03 NA 2.1899 NA 7.40 4.91
TE 85-86 3.33 4.86 0.56 1.58 2.32 NA 0.03 NA 1.9764 NA 6.24 6.44
TE 86-87 3.38 5.53 0.57 1.62 1.10 NA 0.03 NA 1.8849 NA 5.07 7.15
TE 87-88 3.59 7.02 0.63 1.61 1.3972 NA 0.03 NA 1.6770 NA 4.22 8.64
TE 88-89 3.68 8.71 0.75 1.56 1.5229 NA 0.0328 NA 1.6195 NA 4.42 10.26
TE 89-90 3.87 10.40 0.84 1.58 1.7543 NA 0.0370 NA 1.6883 NA 4.71 11.98
TE 90-91 4.04 11.49 0.91 1.69 1.9475 NA 0.0396 NA 1.8966 NA 4.94 13.19
TE 91-92 4.26 13.50 0.91 1.77 1.17 NA 0.04 NA 1.9575 NA 6.36 15.27
TE 92-93 4.49 14.05 0.92 1.67 2.38 NA 0.05 NA 1.9866 NA 7.83 15.72
TE 93-94 4.83 15.43 0.95 4.03 3.57 NA 0.05 NA 1.9385 NA 9.41 19.46
TE 94-95 5.24 14.90 0.98 5.95 3.60 NA 0.06 NA 1.8185 NA 9.87 20.85
TE 95-96 5.56 18.08 1.03 8.26 3.52 NA 0.06 NA 1.6965 NA 10.18 26.34
TE 96-97 5.80 22.74 1.11 8.30 3.71 NA 0.07 NA 1.7239 NA 10.69 31.04
TE 97-98 5.75 24.65 1.37 12.47 3.81 3.70 0.07 0.11 1.8234 NA 11.41 41.09
TE 98-99 5.66 33.10 1.83 21.46 4.35 7.80 0.08 0.30 1.9467 NA 12.33 62.81
TE 99-00 5.64 40.81 2.19 27.93 4.77 11.78 0.18 0.72 0.2444 NA 13.11 81.41
TE 00-01 5.79 50.27 2.42 31.76 5.20 12.02 0.13 0.99 0.2704 NA 13.56 95.04
TE 01-02 6.00 53.01 2.33 29.14 4.71 11.35 0.14 1.20 0.27 0.06 13.72 95.41
TE 02-03 6.57 60.43 2.30 28.73 4.67 10.61 0.12 1.02 0.07 0.04 14.25 101.72
TE 03-04 6.78 68.72 2.30 28.74 5.14 9.64 0.01 0.81 0.05 0.05 14.98 109.35
TE 04-05 9.39 76.53 2.43 32.43 3.68 8.36 0.13 0.60 0.05 0.04 15.68 117.95
TE 05-06 6.97 80.04 2.58 37.95 6.29 11.08 0.15 0.65 0.07 0.06 16.09 130.29
TE 06-07 7.49 57.14 2.74 28.42 6.34 12.23 0.18 0.88 0.07 0.09 16.44 145.17
TE 07-08 8.28 72.07 2.88 32.02 6.45 14.30 0.19 1.04 0.12 0.32 17.53 166.17
TE 08-09 8.78 87.02 2.95 33.15 6.86 16.32 0.21 1.31 0.16 0.57 18.66 186.53
TE 09-10 9.14 127.72 3.07 50.39 6.81 18.13 0.21 1.35 0.20 0.79 19.44 198.39 Source: Andhra Pradesh State Report by AERC, Vishakhapattanam
1. From 1980-81 to 1998-99 data taken from “Season and Crop Reports of Andhra Pradesh, Directorate of Economics and Statistics, Govt. of A.P., Hyderabad.
2. From 1999-2000 to 2009-10 data taken from Bureau of Economics and Statistics, Govt. of A.P., Hyderabad & Dept. of Horticulture,
Govt. of A.P. Public Gardens, Nampalli, Hyderabad. 3. Fruits & Vegetables crops in A.P., Published by Directorate of Economics & Statistics, Govt. of A.P. Hyderabad.,
4. From 1980-81 to 1998-99 area data of Medicinal and Aromatic Plants includes area in drugs

205
Table 2.4A: Area and production of selected horticultural crops in Andhra Pradesh (Area in lakh hectares, production in lakh tonnes)
Year Mango Sweet Orange
Area Production Area Production
TE 1980-81 1.2913 NA 0.1787 NA
TE 1981-82 1.3097 NA 0.1858 NA
TE 1982-83 1.3530 NA 0.1930 NA
TE 1983-84 1.4123 NA 0.2033 NA
TE 1984-85 1.4620 NA 0.2128 NA
TE 1985-86 1.5099 1.2323 0.2120 NA
TE 1986-87 1.5366 2.4899 0.2053 NA
TE 1987-88 1.5848 3.9357 0.2083 NA
TE 1988-89 1.6699 5.0488 0.2415 NA
TE 1989-90 1.7891 5.7754 0.2737 NA
TE 1990-91 1.9068 6.5819 0.3030 NA
TE 1991-92 2.0023 8.5937 0.3060 NA
TE 1992-93 2.1091 8.9068 0.3113 NA
TE 1993-94 2.2487 9.3492 0.3143 NA
TE 1994-95 2.4099 7.8113 0.3249 NA
TE 1995-96 2.5384 8.3801 0.3366 NA
TE 1996-97 2.6366 10.6329 0.3444 1.5487
TE 1997-98 2.7041 8.8982 0.3495 2.9741
TE 1998-99 2.7649 13.5974 0.3554 5.0927
TE 1999-00 2.8519 16.5819 0.3696 5.4873
TE 2000-01 2.9519 23.6623 0.3902 6.1463
TE 2001-02 3.0312 24.2498 0.4124 6.1863
TE 2002-03 3.2740 26.1917 0.6318 9.4764
TE 2003-04 3.5938 28.7506 0.8617 12.1877
TE 2004-05 3.8811 31.0482 1.0822 14.7662
TE 2005-06 4.1792 32.1945 1.1805 14.4592
TE 2006-07 4.4099 34.3545 1.3718 17.0588
TE 2007-08 4.7152 37.7639 1.6554 21.0695
TE 2008-09 4.8244 40.8612 1.9117 25.6402
TE 2009-10 4.8545 41.5050 2.0975 28.3160
Source: 1) Fruit & vegetable crops in Andhra Pradesh, Directorate of economics & statistics,
Government of Andhra Pradesh, Hyderabad.
2) Department of Horticulture, Government of Andhra Pradesh, Public Gardens, Nampalli,
Hyderabad.
Note: Production data is not available for Mango upto 2004-05 and Sweet Orange upto
1996 in the records of Department of Horticulture, A.P

206
Annexure Table 2.5A: Area and production of horticultural crops in Bihar
(Area in Lakh hectare, production in Lakh tones/Production of flowers in Lakh Cut)
Source: Bihar State Report by AERC Bhagalpur
Annexure Table 2.6A: Area and production of selected horticultural crops in Bihar
(Area in Lakh hectares, Production in Lakh tones)
Year Crop – I (Mango) Crop - 2 (Litchi)
Area Production Area Production
TE 1990-91 1.521 14.305 0.184 1.802
TE 1991-92 1.540 14.503 0.185 1.854
TE 1992-93 1.520 14.200 0.198 1.950
TE 1993-94 1.520 14.200 0.198 1.970
TE 1994-95 1.470 13.870 0.200 2.100
TE 1995-96 1.460 13.652 0.213 2.120
TE 1996-97 1.460 13.559 0.220 2.170
TE 1997-98 1.430 12.700 0.215 2.177
TE 1998-99 1.433 12.300 0.219 2.168
TE 1999-00 1.445 12.450 0.207 2.142
TE 2000-01 1.421 12.800 0.219 2.373
TE 2001-02 1.408 12.550 0.242 2.635
TE 2002-03 1.400 12.500 0.263 2.970
TE 2003-04 1.400 15.401 0.283 3.390
TE 2004-05 1.401 8.656 0.284 2.049
TE 2005-06 1.402 12.228 0.284 2.001
TE 2006-07 1.408 13.070 0.287 2.119
TE 2007-08 1.422 8.703 0.298 2.232
TE 2008-09 1.441 13.299 0.305 2.169
TE 2009-10 1.460 9.959 0.306 2.151
Source: Bihar State Report by AERC Bhagalpur
Year Fruits Vegetables Spices, Garden
& Plantation
Commercial
Flowers
Medicinal &
Aromatic
Area Prodn Area Prodn Area Prodn Area Prodn Area Prodn
TE 1990-91 2.67 27.99 8.43 86.43 0.000 0.000 0.000 0.000 0.000 0.000
TE 2000-01 2.72 28.77 5.78 80.23 0.000 0.000 0.000 0.000 0.000 0.000
TE 2004-05 2.91 29.20 4.94 76.28 0.091 0.094 0.00141 0.011 0.000 0.000
TE 2005-06 2.91 31.92 4.98 76.54 0.103 0.109 0.00189 0.023 0.000 0.000
TE 2006-07 2.79 34.26 8.24 136.08 0.111 0.123 0.0297 0.033 0.021 NA
TE 2007-08 0.73 7.31 8.24 140.68 0.122 0.141 0.4706 0.047 0.245 NA
TE 2008-09 2.90 37.23 8.27 133.86 0.127 0.149 0.0059 0.061 0.026 NA
TE 2009-10 2.96 39.12 8.45 146.30 0.131 0.154 0.0069 0.065 NA NA

207
Annexure Table 2.7A: Area and production of horticulture crops in Rajasthan (TE 1980-81 to TE 2008-09)
Area in hectares, production in Metric Tonnes Year Fruits Vegetables Spices Flowers Medicinal &
aromatic Total
Area Prod Area Prod Area Prod Area Prod Area Prod Area Prod
TE 80-81 11777 0 38660 64038 251911 118075 0 0 21000 2681 323347 184794
TE 81-82 12011 0 40441 87782 220038 86122 0 0 19240 2549 291730 176453
TE 82-83 12216 0 39291 110460 229129 73599 0 0 21696 2389 302331 186447
TE 83-84 10188 11629 41541 118514 245181 85531 0 0 30799 2398 327709 218073
TE 84-85 7764 22176 44078 122812 255507 82071 0 0 43723 2615 351071 229675
TE 85-86 5305 32911 47128 132072 252616 88658 0 0 50526 2807 355575 256448
TE 86-87 6183 33483 50661 147381 243946 122120 0 0 45806 2813 346595 305797
TE 87-88 6986 31406 51022 177552 286731 188622 0 0 41618 2552 386356 400132
TE 88-89 7319 27730 52136 209870 321751 236295 0 0 42863 2753 424069 476648
TE 89-90 11236 46339 50874 234326 333646 246820 0 0 53443 1896 449199 529381
TE 90-91 15713 72729 54091 261599 303857 253470 0 0 59826 1133 433486 588930
TE 91-92 20589 121097 58020 288356 281321 234402 0 0 62340 0 422270 643855
TE 92-93 21055 128994 60681 306293 320090 261686 331 1844 63642 0 465798 698817
TE 93-94 20968 177651 63445 327335 407143 275412 733 2203 68274 0 560563 782601
TE 94-95 20528 198758 64842 316330 433956 290995 733 2203 71689 0 591749 808286
TE 95-96 20156 239543 70317 334473 423132 284907 1066 1020 77914 17933 592586 877875
TE 96-97 20181 245092 75407 346155 403650 300965 1252 1407 98705 46163 599194 939783
TE 97-98 20345 267914 80230 359684 453042 356910 1925 2137 118827 74617 674370 1061263
TE 98-99 20613 267866 87995 372759 477302 382173 2029 2853 130732 83906 718671 1109557
TE 99-00 20421 259087 91919 387832 441526 361972 1814 2573 120648 76579 676329 1088044
TE 00-01 20536 239076 94667 401366 417511 342218 1847 2665 124775 75530 659335 1060855
TE 01-02 20985 226541 94877 413937 524486 428004 1701 2098 131410 78158 773458 1148739
TE 02-03 21647 209339 93733 377524 578956 439468 1829 1961 150807 83531 846972 1111823
TE 03-04 22525 203624 100375 422916 628379 537966 1772 1860 157289 92051 910340 1258418
TE 04-05 23154 222375 108047 483031 512767 473819 2255 1917 159257 88500 805480 1269642
TE 05-06 24191 298796 118037 618579 451476 460077 2756 2340 153633 85672 750093 1465464
TE 06-07 25629 359222 122237 714450 382127 360978 3016 2706 171823 77687 704833 1515044
TE 07-08 27349 461153 128986 794162 432692 395792 3026 3373 188246 82741 780299 1737222
TE 08-09 29069 483200 130539 792788 495405 473541 3142 4241 213385 94697 871539 1848466
Note: TE 1980-81 denotes the triennium average for the period 1978-79 to 1980-81.
Sources: (1) Vital horticulture Statistics,1998-99, Directorate of Horticulture, Rajasthan, Jaipur
(2) Rajasthan Horticulture Statistics 2002-03,Directorate of Horticulture, Rajasthan , Jaipur
(3) Unpublished data CD, Directorate of Horticulture, Rajasthan, Jaipur (for data from 2002-03 to 2008-09).
(4) 50 Years of Agricultural Development in Rajasthan, Directorate of Agriculture, Jaipur [(from 1980-81 to
1982-83,for fruits), (from 1980-81 to 1994-95, for medicinal)].

208
Annexure Table 2.8A : Area and production of selected horticulture crops in Rajasthan
(Area in hectare and production in metric tonnes)
Year Aonla Papaya Coriander Mango
Area Prodn. Area Prodn. Area Prodn. Area Prodn.
TE 80-81 NA NA NA NA 62278 35567 NA NA
TE 81-82 NA NA NA NA 70802 38700 NA NA
TE 82-83 NA NA NA NA 92210 54710 NA NA
TE 83-84 15 15 268 609 108393 61372 529 6842
TE 84-85 8 8 251 585 106933 52374 413 4489
TE 85-86 8 8 227 469 110154 40462 442 4026
TE 86-87 6 6 206 416 114964 56260 427 2308
TE 87-88 10 9 159 281 157161 51947 444 1971
TE 88-89 15 13 123 242 162105 73634 371 1240
TE 89-90 23 21 168 289 155850 63751 2355 10986
TE 90-91 30 69 265 874 123629 104986 4662 22729
TE 91-92 22 67 358 2703 115500 94955 6957 40425
TE 92-93 18 99 361 3313 128262 106107 7209 43303
TE 93-94 7 47 341 5314 136410 94366 7178 50634
TE 94-95 7 42 343 6688 140680 101086 7117 49459
TE 95-96 17 139 358 9700 138540 104479 7072 53477
TE 96-97 26 236 376 10816 138843 121008 7015 49314
TE 97-98 33 293 389 12735 175783 162019 6997 51922
TE 98-99 38 516 408 16032 195944 183100 6925 56465
TE 99-00 87 876 429 14401 184974 174100 6728 76692
TE 00-01 168 1344 427 10548 155855 157931 6586 96069
TE 01-02 278 1722 402 4563 158022 176054 6470 107152
TE 02-03 374 1878 381 3765 154077 174371 6452 93511
TE 03-04 458 2864 380 3549 186129 218931 6442 83529
TE 04-05 601 3770 375 4586 167353 197520 6413 73995
TE 05-06 802 5528 382 5974 175494 204075 6437 92251
TE 06-07 1095 7737 389 6813 138742 155745 6433 90772
TE 07-08 1397 10517 419 10358 160284 154532 6379 97747
TE 2008-
09
1611 12845 435 10108 196396 198267 6231 88586
Sources: (1) Vital Horticulture Statistics,1998-99, Directorate of Horticulture, Rajasthan, Jaipur;
(2) Rajasthan Horticulture Statistics 2002-03,Directorate of Horticulture, Rajasthan, Jaipur.
(3) Unpublished data CD, Directorate of Horticulture, Rajasthan,Jaipur (for data from 2002-03 to
2008-09).
(4) 50 Years of Agricultural Development in Rajasthan, Directorate of Agriculture, Jaipur [(from
1980-81 to 1982-83,for fruits), (from 1980-81 to 1994-95, for medicinals)].
(5) Indian Horticultural Database-2010, National Horticulture Board, Department of Agriculturwe and
Cooperation, Govt. of India.

209
Annexure Table 2.9A: Area and production of horticulture crops in Tamil Nadu.
(Area: lakh hectare; Production: lakh tones)
Year Fruits Vegetables Spices Flowers Medicinals Total
Area Prod. Area Prod Area Prod Area Prod Area Prod Area Prod
TE 80-81 - - - - - - - - - - 4.6 44.78
TE 81-82 - - - - - - - - - - 5.48 40.84
TE 82-83 - - - - - - - - - - 5.68 43.22
TE 83-84 - - - - - - - - - - 5.63 46.31
TE 84-85 - - - - - - - - - - 5.95 54.70
TE 85-86 - - - - - - - - - - 5.97 53.11
TE 86-87 - - - - - - - - - - 5.84 53.84
TE 87-88 - - - - - - - - - - 9.15 58.59
TE 88-89 - - - - - - - - - - 5.99 63.03
TE 89-90 - - - - - - - - - - 6.15 73.00
TE 90-91 - - - - - - - - - - 6.04 70.87
TE 91-92 1.45 30.59 1.61 40.97 1.36 1.57 0.11 0.54 0.00 0.00 4.53 73.67
TE 92-93 1.63 29.67 1.51 35.93 1.75 2.08 0.12 0.58 0.00 0.00 5.01 68.26
TE 93-94 1.80 36.21 1.71 45.16 1.78 2.72 0.12 0.62 0.00 0.00 5.41 84.71
TE 94-95 1.86 48.19 1.75 43.98 1.65 2.73 0.14 0.71 0.00 0.00 5.4 95.61
TE 95-96 1.95 49.13 1.58 39.57 1.43 1.91 0.15 0.82 0.00 0.00 5.11 91.43
TE 96-97 1.95 38.56 1.69 40.02 1.60 2.24 0.16 0.95 0.00 0.00 5.4 81.77
TE 97-98 2.11 50.33 1.93 50.76 1.57 2.49 0.17 0.17 0.00 0.00 5.78 103.75
TE 98-99 2.21 45.09 1.86 42.58 1.71 2.65 0.17 1.3 0.00 0.00 5.95 91.62
TE 99-00 2.2 37.58 2.05 49.88 1.78 3.19 0.18 1.37 0.00 0.00 6.21 92.02
TE 00-01 2.23 40.06 2.20 59.39 1.68 6.62 0.19 1.45 0.00 0.00 6.3 107.52
TE 01-02 2.29 43.74 2.18 57.53 1.61 6.37 0.19 1.47 0.00 0.00 6.27 109.11
TE 02-03 2.23 40.14 1.62 35.98 1.46 6.24 0.18 1.35 0.001 0.02 5.491 83.73
TE 03-04 2.21 36.09 1.91 46.73 1.54 6.93 0.20 1.62 0.04 0.07 5.9 91.44
TE 04-05 2.36 44.98 2.15 63.08 1.43 8.05 0.23 1.87 0.05 0.09 6.22 118.07
TE 05-06 2.58 57.97 2.34 65.47 1.30 7.84 0.25 2.02 0.05 0.09 6.52 133.39
TE 06-07 2.69 69.4 2.42 73.51 1.42 8.02 0.25 1.97 0.07 0.10 6.85 153
TE 07-08 2.80 67.78 2.44 76.61 1.40 7.39 0.25 2.09 0.08 0.18 6.97 154.05
TE 08-09 2.95 68.03 2.52 71.86 1.54 8.63 0.29 2.56 0.10 0.48 7.4 151.56
TE 09-10 3.07 73.05 2.63 77.62 1.6 9.32 0.30 2.77 0.1 0.51 7.7 163.27
TE 10-11 3.19 79.35 2.73 83.82 1.66 10.07 0.31 2.99 0.10 0.55 7.99 176.78
Source: Tamil Nadu State Report by AERC Bhagalpur

210
Annexure Table: 2.10A: Area and production of selected horticulture crops in Tamil Nadu
(area in ha; production in metric tonnes)
Years Banana Mango Flowers
Area Production Area Production Area Production
TE 1980-81 60423 1486625 36432 567860 0 0
TE 1981-82 58341 1402775 36673 584160 0 0
TE 1982-83 54933 1225155 36542 554327 0 0
TE 1983-84 54112 1119009 37320 473133 0 0
TE 1984-85 53457 1358519 37269 416301 0 0
TE 1985-86 56839 1568822 38320 290724 0 0
TE 1986-87 56574 1742970 38765 264824 0 0
TE 1987-88 56346 1663323 41375 173200 0 0
TE 1988-89 56353 1586443 44783 215963 0 0
TE 1989-90 56200 1606520 49051 260127 0 0
TE 1990-91 58435 1772960 52377 324653 0 0
TE 1991-92 60785 1999127 54341 339020 1167 58000
TE 1992-93 66925 2160267 57534 337043 1267 63667
TE 1993-94 74589 2380450 61899 366723 1367 71667
TE 1994-95 80214 2848543 67547 453820 1500 64444
TE 1995-96 82565 3357177 73998 521000 1667 71667
TE 1996-97 81234 3523423 79728 519367 1600 98000
TE 1997-98 82526 3693840 86494 496660 1667 114000
TE 1998-99 85434 3640127 92709 509147 1733 114000
TE 1999-00 87370 3644947 99140 475843 1680 137333
TE 2000-01 85915 3266940 104213 493922 1604 792778
TE 2001-02 84144 3248525 107662 436312 1585 143000
TE 2002-03 81360 3150084 110214 583813 1604 142333
TE 2003-04 77467 2965147 112573 603508 1585 148000
TE 2004-05 76452 2937811 115109 637090 1652 183756
TE 2005-06 82411 3541384 119491 564185 1716 199612
TE 2006-07 93784 4420272 123135 590579 1795 226286
TE 2007-08 104216 5061285 126394 644865 1738 244316
TE 2008-09 111268 5228118 128030 680480 1798 266794
Source: Department of Horticulture, Government of Tamil Nadu, Chennai-05
Note: TE 1908-81 denotes Triennium Average for the period 1978-79 to 1980-81

211
Annexure Table 2.11A: Area and production of horticultural crops in West Bengal (TE Averages)
(Area in ‘000 Ha & Production in ‘000 Tonne)
Source: West Bengal State Report by AERC Shantiniketan
Year Fruits Vegetables Flowers Spices Plantation Crops Total
Area Prod Area Prod Area Prod
(loose) Area Prod Area Prod Area Prod
1980-81 0.00 0.00 0.00 0.00 0.00 0.00 0.00 0.00 0.00 0.00 0.00 0.00
1981-82 0.00 0.00 0.00 0.00 0.00 0.00 0.00 0.00 0.00 0.00 0.00 0.00
1982-83 0.00 0.00 0.00 0.00 0.00 0.00 30.60 23.73 0.00 0.00 30.60 23.73
1983-84 21.17 0.00 115.23 0.00 0.00 0.00 35.27 30.43 0.00 0.00 171.67 30.43
1984-85 0.00 0.00 164.17 0.00 0.00 0.00 41.57 39.20 0.00 0.00 226.90 39.20
1985-86 0.00 0.00 359.97 0.00 0.00 0.00 49.40 47.87 0.00 0.00 468.53 47.87
1986-87 0.00 0.00 465.43 0.00 0.00 0.00 52.87 50.17 0.00 0.00 594.40 50.17
1987-88 114.23 0.00 594.07 0.00 0.00 0.00 56.80 52.10 0.00 0.00 765.10 52.10
1988-89 114.47 0.00 642.30 0.00 0.00 0.00 60.07 55.57 0.00 0.00 816.83 55.57
1989-90 114.37 0.00 672.80 0.00 0.00 0.00 64.07 61.60 0.00 0.00 851.23 61.60
1990-91 117.53 0.00 744.30 0.00 0.00 0.00 67.17 67.17 0.00 0.00 929.00 67.17
1991-92 116.40 377.23 652.27 1560.00 0.00 0.00 69.93 73.07 0.00 0.00 838.60 2010.30
1992-93 123.03 760.30 585.07 3485.63 0.00 0.00 73.93 79.30 0.00 0.00 782.03 4325.23
1993-94 126.60 1246.33 492.77 5105.13 0.00 0.00 76.93 83.70 0.00 0.00 696.30 6435.17
1994-95 126.90 1275.57 504.10 5325.13 0.00 0.00 79.43 88.37 0.00 0.00 710.43 6689.07
1995-96 120.80 1320.00 490.10 5196.50 0.00 0.00 81.83 92.50 0.00 0.00 692.73 6609.00
1996-97 114.73 1179.00 610.57 8133.93 0.00 0.00 84.80 97.43 0.00 0.00 810.10 9410.37
1997-98 116.42 1230.41 703.90 9433.93 4.57 5.90 89.30 103.37 0.00 0.00 914.19 10791.32
1998-99 120.55 1314.91 800.57 10903.60 8.07 5.90 92.10 105.53 0.00 0.00 1021.29 12366.98
1999-00 125.16 1575.26 792.13 9657.18 12.48 10.78 93.93 106.70 0.00 0.00 1023.71 11405.88
2000-01 130.65 1669.74 811.38 9953.92 7.91 4.88 93.53 106.03 0.00 0.00 1043.47 11772.83
2001-02 137.17 1819.57 836.34 10104.90 4.41 4.88 92.73 107.33 0.00 0.00 1070.65 12055.61
2002-03 144.49 1809.39 843.46 10339.71 0.00 0.00 89.23 107.17 0.00 0.00 1077.18 12256.27
2003-04 153.56 1929.07 854.16 10602.61 4.62 11.30 58.40 71.00 0.00 0.00 1070.74 12637.37
2004-05 159.80 1976.66 852.01 10871.49 10.27 25.87 27.60 34.60 0.00 0.00 1049.68 12961.22
2005-06 166.63 2148.69 990.85 13665.91 16.23 39.97 0.00 0.00 14.77 87.29 1188.47 16025.61
2006-07 175.36 2356.89 1141.46 15739.61 17.81 43.24 26.33 38.10 29.80 182.99 1390.76 18464.40
2007-08 184.73 2569.67 1289.69 19538.67 21.30 44.80 52.67 76.23 45.67 275.44 1594.05 22644.78
2008-09 194.92 2727.63 1316.14 20767.02 22.36 48.04 84.62 139.03 47.90 280.65 1665.93 24141.97
2009-10 202.00 2798.71 1313.13 22355.86 23.47 51.86 90.25 163.73 49.86 277.12 1678.70 25857.56

212
Annexure Table 2.12A: Area and production of Pineapple and Mandarin Orange in West Bengal
Year Pineapple Orange (Mandarin)
Area
(‘000 ha)
Production
(‘000 tonnes)
Area
(‘000 ha)
Production
(‘000 tonnes)
TE 1980-81 0.00 0.00 0.00 0.00
TE 1981-82 0.00 0.00 0.00 0.00
TE 1982-83 0.00 0.00 0.00 0.00
TE 1983-84 0.00 0.00 0.00 0.00
TE 1984-85 0.00 0.00 0.00 0.00
TE 1985-86 0.00 0.00 0.00 0.00
TE 1986-87 0.00 0.00 0.00 0.00
TE 1987-88 0.00 0.00 0.00 0.00
TE 1988-89 0.00 0.00 0.00 0.00
TE 1989-90 0.00 0.00 0.00 0.00
TE 1990-91 0.00 0.00 0.00 0.00
TE 1991-92 0.00 0.00 0.00 0.00
TE 1992-93 0.00 0.00 0.00 0.00
TE 1993-94 8.87 219.60 0.00 0.00
TE 1994-95 8.93 224.93 0.00 0.00
TE 1995-96 9.00 228.30 0.00 0.00
TE 1996-97 9.07 232.00 0.00 0.00
TE 1997-98 9.11 238.66 0.00 0.00
TE 1998-99 9.30 255.77 0.00 0.00
TE 1999-00 9.70 270.29 3.53 34.17
TE 2000-01 10.10 281.18 3.54 34.10
TE 2001-02 10.72 293.87 3.57 34.07
TE 2002-03 11.22 314.05 3.63 34.47
TE 2003-04 11.70 335.10 3.63 34.44
TE 2004-05 12.15 344.38 3.57 33.56
TE 2005-06 12.68 357.20 3.52 32.63
TE 2006-07 13.21 367.03 3.60 33.74
TE 2007-08 12.10 344.81 3.68 35.13
TE 2008-09 10.84 313.06 3.74 36.45
1.Statistical Abstract, Directorate of Agriculture, Government of West Bengal (Various Issues)for 1997-98 to
2007-08
2. Indian Horticulture Database, 2009 for 2008-09
3. Statistical Intelligence Service, 2007; CMIE for Data from 1980-81 to 1996-97

213
Appendix Table 3.1A: Demographic profile of the selected farmers (% of households)
Characteristics Andhra Pradesh Bihar Haryana Karnataka
Marginal Small Medium Large Marginal Small Medium Large Marginal Small Medium Large Marginal Small Medium Large
No of HH 31.0 80.0 59.0 30.0 17.0 22.0 43.0 18.0 8 13 29 100 59.0 63.0 35.0 55.0
Household size (nos.) 4.2 3.7 4.2 5.3 5.4 6.1 5.9 7.2 45 71 181 589 5.4 5.6 8.3 9.2
Average numbers of earners 1.8 1.6 1.8 2.0 2.4 2.1 1.8 2.4 1.75 1.54 2.14 1.88 2.7 2.9 3.3 4.2
Gender
(% of members)
Male 55.8 54.4 55.7 57.0 55.4 40.0 54.6 46.2 51.11 49.3 58.57 53.99 52.0 56.3 51.9 55.0
Female 44.2 45.6 44.3 43.0 44.6 60.0 45.5 53.9 48.89 50.7 41.43 46.01 48.0 43.7 48.1 45.0
Age group
of
the
members
(%)
<16 13.2 14.9 15.5 17.1 46.7 43.0 45.1 26.2 28.89 30.99 24.31 22.24 23.7 19.8 23.6 26.0
16-60 84.5 79.7 82.1 77.9 40.2 29.6 36.4 43.1 71.11 61.97 66.3 70.29 67.1 70.3 66.5 65.9
>60 2.3 5.4 2.4 5.1 13.1 27.4 18.6 30.8 0 7.04 9.39 7.47 9.3 9.9 9.9 8.2
Identity of respondent
(%)
Head 96.8 88.8 88.1 90.0 82.4 90.9 86.1 72.2 100 76.92 68.97 77 61.0 74.6 74.3 81.8
Others 3.2 11.3 11.9 10.0 17.7 9.1 14.0 27.8 0 23.08 31.03 23 39.0 25.4 25.7 18.2
Education status
of the
members (%)
Illiterate 32.6 31.4 37.0 31.0 17.4 9.6 10.7 9.2 20 12.67 19.34 11.21 25.9 21.7 20.1 19.2
Up to primary 20.9 24.7 22.4 26.6 23.9 27.4 32.0 24.6 17.78 19.72 19.34 16.3 22.7 23.0 22.5 17.2
Up to secondary 26.4 24.0 24.4 24.7 56.5 58.5 47.0 43.9 57.78 45.07 35.35 38.03 48.2 52.5 50.2 53.2
Up to graduate 18.6 17.9 13.8 15.8 2.2 4.5 7.5 13.9 2.22 7.04 8.84 8.15 1.8 2.8 6.4 8.5
Above graduate 1.6 2.0 2.0 1.3 0.0 0.0 2.8 8.5 2.22 15.5 17.13 26.32 1.4 0.0 0.8 1.8
Caste
(% of households)
SC 22.6 22.5 11.9 16.7 17.7 9.1 0.0 0.0 0 7.69 0 1 6.8 4.8 8.6 7.3
ST 0.0 2.5 11.9 0.0 0.0 0.0 0.0 0.0 0 0 0 0 0.0 4.8 0.0 0.0
OBC 38.7 33.8 47.5 26.7 41.2 22.7 27.9 27.8 37.5 38.46 13.79 9 72.9 68.3 62.9 65.5
General 38.7 41.3 28.8 56.7 41.2 68.2 72.1 72.2 62.5 53.85 86.21 90 20.3 22.2 28.6 27.3
Decision
maker
(% of hh)
Male 83.9 81.3 89.8 93.3 100.0 90.9 93.0 77.8 100 100 96.55 92 93.2 95.2 100.0 98.2
Female 16.1 18.8 10.2 6.7 0.0 9.1 7.0 22.2 0 0 3.45 8 6.8 4.8 0.0 1.8
Main
occupation
(% of working
members)
Farming 71.4 81.5 80.4 73.3 81.1 70.0 89.1 78.6 57.14 65 79.03 75.53 79.1 86.6 86.8 83.3
Self business 7.1 2.3 3.7 1.7 10.8 25.0 7.6 3.6 21.43 15 12.9 15.96 4.6 1.2 3.5 6.8
Salaried/pensioners 7.1 1.5 1.9 8.3 0.0 5.0 3.3 17.9 7.14 20 8.06 5.85 3.3 4.7 5.3 7.2
Wage earners 14.3 14.6 14.0 16.7 8.1 0.0 0.0 0.0 14.29 0 0 2.66 13.1 7.6 4.4 2.7
Involved in migration during year
2009 (% of members) 18.9 12.5 3.3 0.0 2.22 1.41 7.73 2.55 0.4 0.3 0.0 2.7
Source: Primary Survey
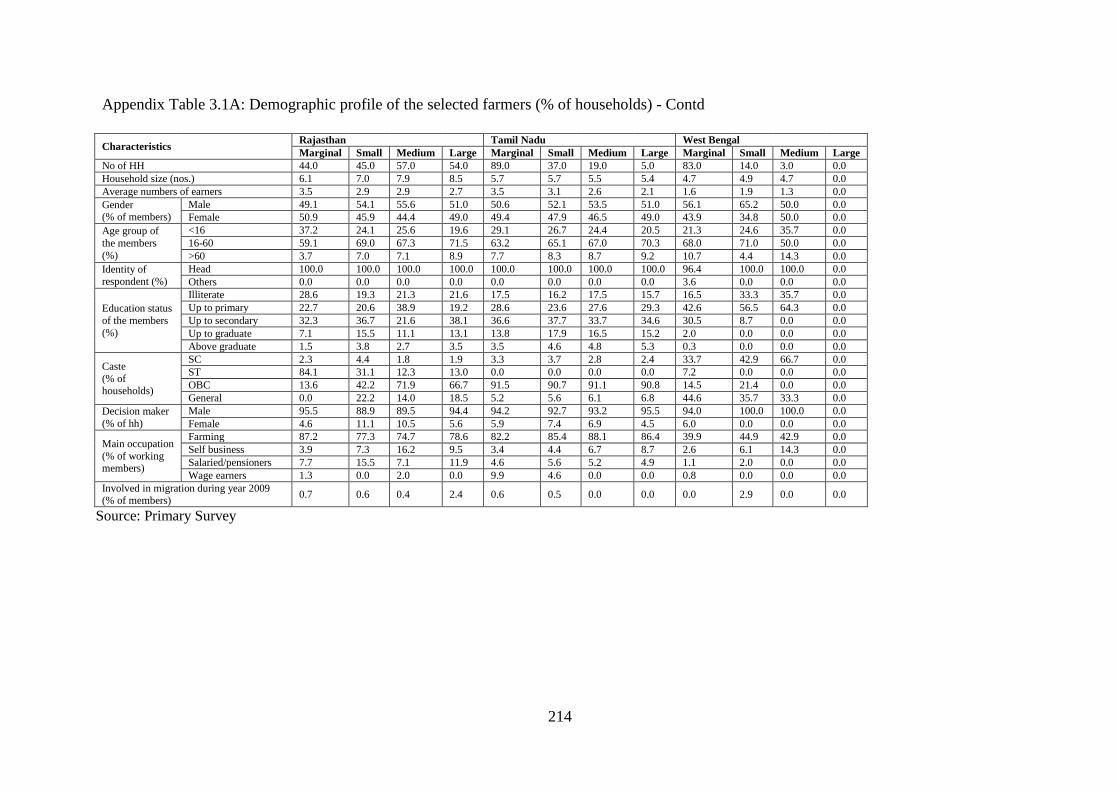
214
Appendix Table 3.1A: Demographic profile of the selected farmers (% of households) - Contd
Characteristics Rajasthan Tamil Nadu West Bengal
Marginal Small Medium Large Marginal Small Medium Large Marginal Small Medium Large
No of HH 44.0 45.0 57.0 54.0 89.0 37.0 19.0 5.0 83.0 14.0 3.0 0.0
Household size (nos.) 6.1 7.0 7.9 8.5 5.7 5.7 5.5 5.4 4.7 4.9 4.7 0.0
Average numbers of earners 3.5 2.9 2.9 2.7 3.5 3.1 2.6 2.1 1.6 1.9 1.3 0.0
Gender (% of members)
Male 49.1 54.1 55.6 51.0 50.6 52.1 53.5 51.0 56.1 65.2 50.0 0.0
Female 50.9 45.9 44.4 49.0 49.4 47.9 46.5 49.0 43.9 34.8 50.0 0.0
Age group of
the members
(%)
<16 37.2 24.1 25.6 19.6 29.1 26.7 24.4 20.5 21.3 24.6 35.7 0.0
16-60 59.1 69.0 67.3 71.5 63.2 65.1 67.0 70.3 68.0 71.0 50.0 0.0
>60 3.7 7.0 7.1 8.9 7.7 8.3 8.7 9.2 10.7 4.4 14.3 0.0
Identity of respondent (%)
Head 100.0 100.0 100.0 100.0 100.0 100.0 100.0 100.0 96.4 100.0 100.0 0.0
Others 0.0 0.0 0.0 0.0 0.0 0.0 0.0 0.0 3.6 0.0 0.0 0.0
Education status
of the members
(%)
Illiterate 28.6 19.3 21.3 21.6 17.5 16.2 17.5 15.7 16.5 33.3 35.7 0.0
Up to primary 22.7 20.6 38.9 19.2 28.6 23.6 27.6 29.3 42.6 56.5 64.3 0.0
Up to secondary 32.3 36.7 21.6 38.1 36.6 37.7 33.7 34.6 30.5 8.7 0.0 0.0
Up to graduate 7.1 15.5 11.1 13.1 13.8 17.9 16.5 15.2 2.0 0.0 0.0 0.0
Above graduate 1.5 3.8 2.7 3.5 3.5 4.6 4.8 5.3 0.3 0.0 0.0 0.0
Caste
(% of households)
SC 2.3 4.4 1.8 1.9 3.3 3.7 2.8 2.4 33.7 42.9 66.7 0.0
ST 84.1 31.1 12.3 13.0 0.0 0.0 0.0 0.0 7.2 0.0 0.0 0.0
OBC 13.6 42.2 71.9 66.7 91.5 90.7 91.1 90.8 14.5 21.4 0.0 0.0
General 0.0 22.2 14.0 18.5 5.2 5.6 6.1 6.8 44.6 35.7 33.3 0.0
Decision maker
(% of hh)
Male 95.5 88.9 89.5 94.4 94.2 92.7 93.2 95.5 94.0 100.0 100.0 0.0
Female 4.6 11.1 10.5 5.6 5.9 7.4 6.9 4.5 6.0 0.0 0.0 0.0
Main occupation
(% of working members)
Farming 87.2 77.3 74.7 78.6 82.2 85.4 88.1 86.4 39.9 44.9 42.9 0.0
Self business 3.9 7.3 16.2 9.5 3.4 4.4 6.7 8.7 2.6 6.1 14.3 0.0
Salaried/pensioners 7.7 15.5 7.1 11.9 4.6 5.6 5.2 4.9 1.1 2.0 0.0 0.0
Wage earners 1.3 0.0 2.0 0.0 9.9 4.6 0.0 0.0 0.8 0.0 0.0 0.0
Involved in migration during year 2009 (% of members)
0.7 0.6 0.4 2.4 0.6 0.5 0.0 0.0 0.0 2.9 0.0 0.0
Source: Primary Survey

215
Appendix Table 3.2A: Ownership of productive assets among selected
households
Assets Marginal Small Medium Large Marginal Small Medium Large
Per Household Per Acre
Andhra Pradesh Tractor 5625 22034 62333 1210 2786 3808
Trolley 750 1356 1667 161 171 101
Tiller 542 68
Pump set diesel 4129 2550 1695 1367 1690 548 214 83
Pump set electric 9575 13118 14697 2060 1658 897
Bullock cart 3323 4606 4414 4533 1360 991 558 276
Spray pump 1726 1768 2066 2687 706 380 261 164
Storage bin 44 9.42
Animals 31177 41760 35135 44649 12761 8988 4443 2726
Total 40355 64284 80360 131932 16519 13837 10163 8060
Bihar Tractor 22604 39672 3135 2759
Trolley 1422 1871 197 130
Harrow 1692 118
Tiller 1887 131
Plank 1902 132
Threshing machine 7512 2385 2927 1801 331 204
Pump set diesel 911 1076 1255 1286 359 258 174 89
Pump set electric 603 758 1357 1875 237 182 188 130
Bullock cart 2117 1902 1809 1942 833 456 251 135
Spray pump 372 412 52 29
Storage bin 710 344 890 792 280 82 123 55
Poultry shed 472 389 65 27
Dairy shed 415 619 778 1135 163 148 108 79
Animals 2647 5635 5780 3469 1042 1351 801 241
Other reaper 4569 318
Fodder chaffer:
(I) Manual 447 309 735 455 176 74 102 32
(ii) Power driven
Others 612 942 1011 987 241 226 140 69
Total 8462 19097 40870 67262 3331 4578 5667 4678
Source: Primary Survey

216
Appendix Table 3.2A: Ownership of productive assets - Contd
Assets Marginal Small Medium Large Marginal Small Medium Large
Per Household Per Acre
Haryana Tractor 0 26923 56897 197030 0 8235 9649 8845
Trolley 0 3846 15862 33520 0 1176 2690 1505
Harrow 0 1154 4103 15340 0 353 696 689
Tiller 0 0 2800 4660 0 0 475 209
Plank 0 0 1897 5113 0 0 322 230
Threshing machine 0 0 4310 16710 0 0 731 750
Pump set diesel 2500 8769 7586 13490 1762 2682 1287 606
Pump set electric 0 8308 19490 41630 0 958 3306 1868
Bullock cart 3500 923 4103 2890 2467 282 696 130
Spray pump 213 635 1791 6168 150 194 304 277
Storage bin 0 0 69 720 0 0 12 32
Poultry shed 0 0 0 15000 0 0 0 673
Dairy shed 0 0 4483 0 0 0 760 0
Animals 47688 15846 109069 86235 33613 4847 18498 3871
Combine harvester 0 0 0 11000 0 0 0 494
Other reaper 0 1538 1034 800 0 471 175 36
Fodder chaffer:
(I) Manual 188 192 455 365 132 59 77 16
(ii) Power driven 2000 3462 3966 5084 1410 1059 673 228
Total 56088 71596 237916 455755 39533 21900 40348 20460
Karnataka Tractor 11017 41349 72857 218127 7120 10820 9788 9789
Trolley 2119 2857 8000 27309 1369 748 1075 1226
Harrow 983 0 0 1876 635 0 0 84
Tiller 0 1121 6714 13491 0 293 902 605
Plank 2288 0 0 3255 1479 0 0 146
Threshing machine 0 0 0 909 0 0 0 41
Pump set diesel 0 556 7500 4200 0 145 1008 188
Pump set electric 102780 128470 156743 137076 66422 33617 21058 6152
Bullock cart 763 4825 6114 10282 493 1263 821 461
Spray pump 2324 4986 8869 15834 1502 1305 1191 711
Storage bin 0 9 9586 7945 0 2 1288 357
Poultry shed 20 16044 191 178 13 4198 26 8
Dairy shed 6747 12270 26457 21455 4361 3211 3554 963
Animals 16454 27444 40980 60200 10634 7181 5506 2702
Others 2920 12986 6914 15209 1887 3398 929 683
Total 148415 252918 350926 537347 95914 66181 47147 24116
Source: Primary Survey

217
Appendix Table 3.2A: Ownership of productive assets - Contd Assets Marginal Small Medium Large Marginal Small Medium Large
Per Household Per Acre
Rajasthan Tractor 15909 67778 144825 253241 8369 16338 17700 12990
Trolley 2727 10222 25579 43352 1435 2464 3126 2224
Harrow 455 2522 4965 10213 239 608 607 524
Tiller 0 3478 6544 12389 0 838 800 635
Plank 0 2544 5246 4185 0 613 641 215
Threshing machine 0 5556 17193 33611 0 1339 2101 1724
Pump set diesel 2250 4756 4772 4444 1184 1146 583 228
Pump set electric 12091 23400 34456 52407 6361 5641 4211 2688
Bullock cart 2477 4222 4228 3519 1303 1018 517 180
Spray pump 530 1418 3674 4074 279 342 449 209
Storage bin 625 1502 2653 3880 329 362 324 199
Poultry shed 0 0 5263 2981 0 0 643 153
Dairy shed 886 6444 23965 19593 466 1553 2929 1005
Animals 35179 77226 149773 174056 18506 18615 18304 8928
Total 73129 211068 433136 621945 38471 50877 52935 31902
Tamil Nadu Tractor 17079 50676 140000 216000 8895 11236 16223 16339
Trolley 2472 7432 21368 36000 1287 1648 2476 2723
Harrow 607 2432 7368 15200 316 539 854 1149
Tiller 0 9730 18947 24000 0 2157 2195 1815
Pump set diesel 0 3784 10737 14400 0 839 1244 1089
Pump set electric 28315 38649 60000 65000 14747 8569 6952 4917
Bullock cart 0 0 11579 11600 0 0 1342 878
Spray pump 1573 1962 2200 2300 819 435 255 174
Dairy shed 3775 5676 9474 15000 1966 1258 1098 1135
Animals 28608 47967 83406 125200 14900 10636 9665 9470
Others 0 0 24500 605645 0 0 2839 45813
Total 82429 168308 389579 1130345 42932 37319 45142 85503
West Bengal Harrow 310 633 390 0 168 182 57 0
Threshing machine 394 1652 1267 0 215 476 186 0
Pump set diesel 389 0 0 0 212
Pump set electric 110 553 0 0 60 159 0 0
Bullock cart 382 557 0 0 208 160 0 0
Spray pump 139 507 363 0 76 146 53 0
Storage bin 0 2114 2790 0 0 609 409 0
Poultry shed 673 231 817 0 366 67 120 0
Dairy shed 771 2196 1000 0 420 632 147 0
Others 271 123 400 0 148 35 59 0
Total 10239 21636 14293 0 5573 6229 2096 0
Source: Primary Survey
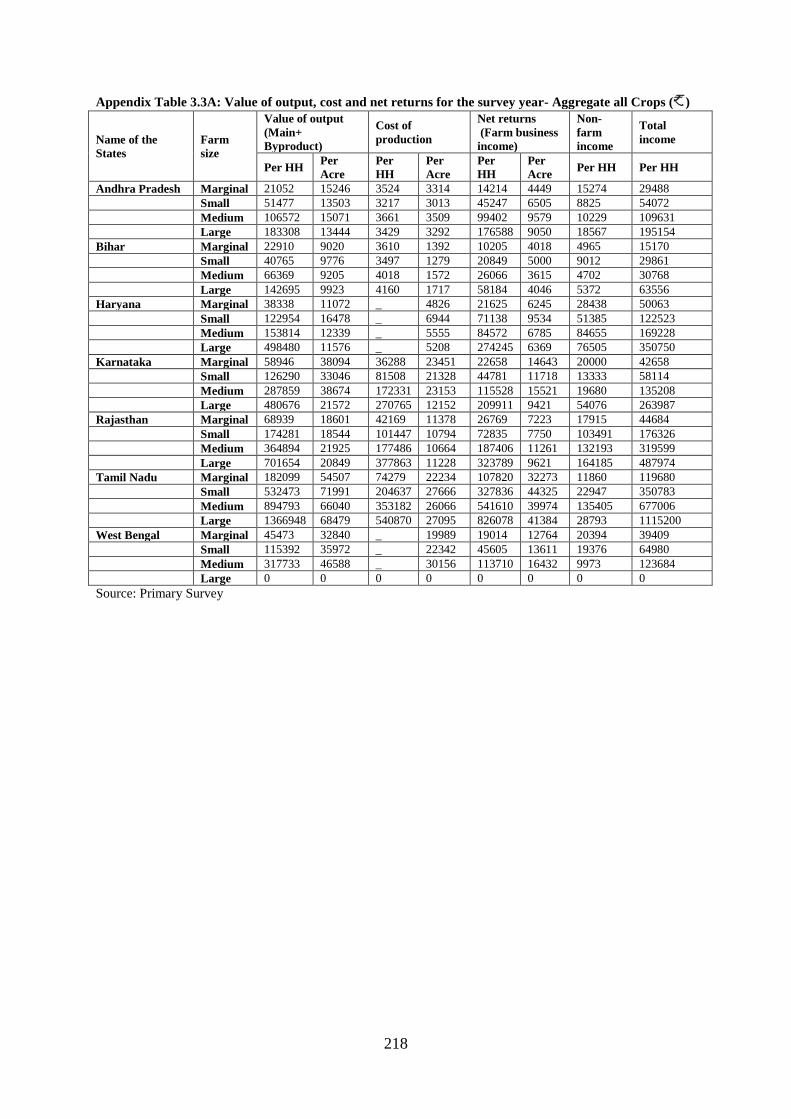
218
Appendix Table 3.3A: Value of output, cost and net returns for the survey year- Aggregate all Crops ( )
Name of the
States
Farm
size
Value of output
(Main+
Byproduct)
Cost of
production
Net returns
(Farm business
income)
Non-
farm
income
Total
income
Per HH Per
Acre
Per
HH
Per
Acre
Per
HH
Per
Acre Per HH Per HH
Andhra Pradesh Marginal 21052 15246 3524 3314 14214 4449 15274 29488
Small 51477 13503 3217 3013 45247 6505 8825 54072
Medium 106572 15071 3661 3509 99402 9579 10229 109631
Large 183308 13444 3429 3292 176588 9050 18567 195154
Bihar Marginal 22910 9020 3610 1392 10205 4018 4965 15170
Small 40765 9776 3497 1279 20849 5000 9012 29861
Medium 66369 9205 4018 1572 26066 3615 4702 30768
Large 142695 9923 4160 1717 58184 4046 5372 63556
Haryana Marginal 38338 11072 _ 4826 21625 6245 28438 50063
Small 122954 16478 _ 6944 71138 9534 51385 122523
Medium 153814 12339 _ 5555 84572 6785 84655 169228
Large 498480 11576 _ 5208 274245 6369 76505 350750
Karnataka Marginal 58946 38094 36288 23451 22658 14643 20000 42658
Small 126290 33046 81508 21328 44781 11718 13333 58114
Medium 287859 38674 172331 23153 115528 15521 19680 135208
Large 480676 21572 270765 12152 209911 9421 54076 263987
Rajasthan Marginal 68939 18601 42169 11378 26769 7223 17915 44684
Small 174281 18544 101447 10794 72835 7750 103491 176326
Medium 364894 21925 177486 10664 187406 11261 132193 319599
Large 701654 20849 377863 11228 323789 9621 164185 487974
Tamil Nadu Marginal 182099 54507 74279 22234 107820 32273 11860 119680
Small 532473 71991 204637 27666 327836 44325 22947 350783
Medium 894793 66040 353182 26066 541610 39974 135405 677006
Large 1366948 68479 540870 27095 826078 41384 28793 1115200
West Bengal Marginal 45473 32840 _ 19989 19014 12764 20394 39409
Small 115392 35972 _ 22342 45605 13611 19376 64980
Medium 317733 46588 _ 30156 113710 16432 9973 123684
Large 0 0 0 0 0 0 0 0
Source: Primary Survey

219
Review Report
1. Title of the Draft Study Report Examined: Impact study of the NHM scheme: A
consolidated report.
2. Date of Receipt of the Draft Report: September 5, 2013
3. Date of Dispatch of Comments: November 12, 2013
4. Comments on the Objectives of the study: The objectives are attended by the
report.
5. Comments on the Methodology: The report has examined the issue with coverage of
major crops across 7 states. It compiles the farmer survey based results from various
states on similar parameters besides putting together a picture (state wise) of the area
and production growth of horticultural crops over the years.
6. Comments on the Presentation, Get up etc.:
The following corrections need to be incorporated:
1. Many of the tables do not mention the source of data.
2. At the end of chapters two and four, a comparative summary needs to be given.
3. In table 3.3, AP is missing, in table 3.4 (a), 3 states are missing and in table 3.4 (b),
Haryana is missing.
4. In table 4.3.2, the crops are entirely different from those mentioned for coverage in
AP on page 67-68 which is surprising.
5. Some tables like 5.2.2 and 5.3.4a where there is little information only in some
columns can be shortened with only columns with info being retained. In fact, table
5.2.4a has info for one half row only and this table can be deleted completely with
info put in text. Similar is the case of table 5.2.5 where half the table is blank.
6. In References, most have page numbers missing.
7. Overall View on Acceptability of the Report:
After it is revised based on some of these comments, the report can be accepted.

220
Action Taken by the Author - ADRTC Bangalore
Based on the comments on the draft report, Impact Study of the National Horticulture
Mission Scheme: A Consolidated Report received from the Centre for Management in
Agriculture, Indian Institute of Management (IIM) Ahmedabad, the report has been revised.
Source of data is provided below all the tables. A chapter summary has been provided at the
end of all the chapters. Appropriate changes have been made in all the tables suggested by the
reviewer. The draft has been rechecked and all the corrections are made in the final report.