impacts and benefits of implementing bim on...
TRANSCRIPT

THESIS
IMPACTS AND BENEFITS OF IMPLEMENTING BIM ON BRIDGE AND
INFRASTRUCTURE PROJECTS
Submitted by
Blaine Fanning
Department of Construction Management
In partial fulfillment of the requirements
For the Degree of Master of Science
Colorado State University
Fort Collins, Colorado
Spring 2014
Master’s Committee:
Advisor: Caroline Clevenger CO-Advisor: Mehmet Ozbek
Hussam Mahmoud

Copyright by Blaine Fanning 2014
All Rights Reserved

ii
ABSTRACT
IMPACTS AND BENEFITS OF IMPLEMENTING BIM ON BRIDGE AND
INFRASTRUCTURE PROJECTS
To date, BIM (Building Information Modeling) is not widely utilized in infrastructure
asset management. Benefits achieved through implementation in vertical construction, however,
suggests that BIM represents significant opportunity for gains in process, material and economic
efficiency throughout infrastructure project lifecycles. This research documents the current state
of BIM implementation across four (4) regional transportation authorities in the United States.
Next it provides a detailed case study analyzing and comparing two current (2013) bridge
construction projects, one that uses BIM and one that does not. The results are confirmed by the
observed reduction in RFIs and CMOs relative to construction area (SF), cost ($), and average
daily traffic, compared to typical construction. Finally, it outlines potential benefits and
implications of using BIM for infrastructure asset management by regional transportation
authorities and the transportation industry in general. Numerous stakeholders involved with
horizontal construction and operation currently seek information regarding the potentially
significant benefits of integrating BIM into infrastructure asset management. This research is
important because its serves to assess and inform such an imminent transition. The specific
contribution of this research is to document and assess the role of BIM implementation on one
bridge case study in order to highlight the potential of BIM as a dynamic method to assist
throughout the lifecycle of infrastructure assets.

TABLE OF CONTENTS
ABSTRACT.………………………………………………………………………..……….….. ii
INTRODUCTION………………………………………………………..………...…..……........1
RESEARCH PURPOSE.……………………………………………………………...…………..3
LITERATURE REVIEW.………………………………………………………………...………4
METHODOLOGY……………………………………………………………………...……….12
REVIEW OF PEER ORGANIZATIONS ……………………………………………...……….13
CASE STUDY…………………….………………………………………………...…………...18
FUTURE RESEARCH.……………………………………………………………...…………..44
REFERENCE.……………………….……………………………………….…………..……...45

1
INTRODUCTION
Research suggests BIM (Building Information Modeling) is a vital asset for building
construction throughout the lifecycle of the projects, from preconstruction through operation to
end of life. Only recently, however, have the benefits of BIM for infrastructure construction
begun to be recognized and realized. In addition, benefits of using BIM for infrastructure
management provides the potential that every maintenance action can be recorded with details
associated to the maintained component: this can provide a record for each component regarding
cost and history of maintenance (Marzouk & Abdel Aty, 2012). Using this form of integrated
design, construction and management for infrastructure provides the framework for an accurate
and proactive attitude of maintaining these structures throughout their lifecycle. The basic
premise of proactive infrastructure asset management includes the assumption that during the
normal life cycle of an asset or system of assets, there is the need to intervene at strategic points,
by doing this is will prolong the assets service life (Cagle, 2003). Implementing BIM can be
beneficial due to the cost and time savings that can result from taking the decisions out of the
field and exploring them in the office first. Urban transit systems and state departments of
transportation (DOTs) are, potentially, well positioned to benefit from such advancements.
These transportation authorities typically hold millions if not billions of dollars in assets that
could benefit from efficiencies gained through BIM implementation. Transportation
organizations responsible for bridge construction are the target audience for the lessons learned
from the case study. However, the infrastructure industry in general can benefit from research
findings.
BIM for infrastructure provides the opportunity for construction managers, owners, and
facility managers to have a dynamic, reliable, organized way of maintaining their assets.

2
Research has demonstrated the extent to which the use of BIM in has been beneficial to vertical
construction (i.e., buildings) (McGraw Hill, 2012). Horizontal construction (i.e., infrastructure),
however, currently remains years behind in realizing the true value of incorporating this tool in
the construction and management of their projects. Productivity is a major project benefit,
which is expected to increase in importance over the next few years (Bernstein & Stephen,
2012). A potential obstacle opposing the adoption of BIM in horizontal construction is that
infrastructure projects are typically built to last multiple decades. As a result, and in contrast to
the perspective of many decision makers in vertical construction, the lifecycle proposition for
horizontal construction is weighted heavily towards operation and maintenance rather than first
costs. Significant need exists for additional research addressing the impact of BIM
implementation across all phases of infrastructure asset management.

3
RESEARCH PURPOSE
BIM for infrastructure is a potentially under-utilized tool in horizontal construction. This
research seeks to document potential impact of the intervention of using BIM on horizontal
construction by comparing its implementation on one of two similar bridge projects.
Specifically, the research seeks to assess the impact of BIM implementation on bridge
construction using the metrics of cost, schedule, request for information (RFIs), change orders,
normalized across design approach, construction type and transfer method.
Importance of Research
Identifying the impacts and potential benefits of utilizing BIM on transportation
infrastructure construction will begin to inform DOT’s and urban transportation districts about
potential opportunities related to BIM adoption during construction. Additional and possibly
significantly greater benefits may be available throughout operation and maintenance of such
infrastructure. This study provides a valuable first step in motivating the implementation of BIM
within and throughout infrastructure asset management.
4
LITERATURE REVIEW
Building information Modeling was first introduced to the Architecture, Engineering, and
Construction (AEC) world nearly half a century ago in 1957, by Dr. Patrick J Hanratty the
developer of Computer Aided Manufacturing (CAM). There are numerous definitions of BIM
used throughout literature, but for the purpose of this study we will use the definition Building
Information Modeling, (to incorporate 3-dimensional (3D) graphics along with data sets (spread
sheets) to specify specific aspects of the built environment). BIM’s incorporation into
construction processes has been emerging into the mainstream primarily for the past 10 years.
Technical benefits of BIM include, “making reliable digital representation of the building or
infrastructure available for design and decision making, high-quality construction document
production, planning, predictions, and cost estimates. Having the ability to keep information up-
to-date and accessible in an integrated digital environment gives architects, engineers, builders,
and owners a clear overall vision of all their projects, this allows all interested parties the ability
to make informed decisions” (http://www.solibri.com/). BIM has become an invaluable tool to
many in the AEC industry by providing living 3-dimensional (3D) models, Data sets, and 2-
dimensional (2D) graphics incorporated in one source. Incorporating integrated design tools like
BIM has allowed organizations to employ experienced project managers and project architects at
the beginning of an infrastructure development process (Mihindu & Aryici, 2009). By allowing
these experienced professionals access at the beginning of these projects it allows for more
design development and less time drafting.
Infrastructure use of BIM has not seen the same growth that vertical construction has
experienced (McGraw Hill, 2012). Water infrastructure has begun to recognize potential
benefits of BIM processes. For example, these assets could be managed in a manner where
5
investment can be optimized to produce a reduction in capital budgets and operating
expenditures. Currently, operation and maintenance needs are frequently overlooked. BIM
provides the potential for a multidisciplinary approach to water infrastructure management at a
corporate level to guide investments and resource allocation (waterfinancerf.org, 2012).
Highway infrastructure has also begun to see the benefits of BIM. Because design and
construction documentation are dynamically linked, the time needed to evaluate more
alternatives, execute design changes, and produce construction documentation is reduced
significantly (Strafaci, 2008). A major benefit is that BIM facilitates roadway optimization by
including visualization, simulation, and analysis as part of the design process (Strafaci, 2008).
Opportunities also exist to save on construction costs while producing a superior final product
with less waste and potentially improving the built environment. For example, a $100,000,000
new highway construction project with interchanges and bridges typically includes 7-8 percent
cost in design development. With BIM, it is possible to reduce the design time by 15% which
reduces costs roughly by $14,000,000 (Strafaci, 2008). Furthermore, BIM models can continue
to result in cost savings over the lifecycle of a project.
BIM for Transportation Infrastructure
BIM for transportation infrastructure asset management processes can benefit from
integrating scope, schedule, and budget along with 2D CAD plans, maintenance records, project
specifications, warranty information, purchase requests, existing service documents, HVAC
plans into a 3D model. By incorporating all the projects information into one or multiple 3D
model(s), with multiple data sets benefits can result for multiple stakeholders. For example,
owners can use the model for operation and maintenance and the engineers and contractors can
use the information in design and building considerations. Various alternatives can be easily
6
compared in order to achieve optimum lifecycle cost. A key benefit is the accurate geometrical
representation of the parts of building infrastructure in an integrated data environment (Marzouk
& Abdel Aty, 2012). Project stakeholders can acquire a greater level of detail at early stages of
the project to better inform decisions before they are implemented in the field. In addition,
operation and maintenance histories can be well documented. Transportation infrastructure
typically has a lifecycle of decades and generally the maintenance is driven by financial
considerations (Davis & Goldberg, 2013). It is typical to have multiple construction crews and
engineers producing documents regarding the same infrastructure asset over extended amounts
of time. BIM provides value in managing relevant data about current conditions and facilitates
the analysis of alternatives, by being able to embed data on life expectancy and replacement
costs in BIM models. Such documentation can help the owner understand the benefits of
investing in material and systems that may cost more initially but have better payback over the
lifecycle of the asset (Schley, 6/17/13). The basic premise of proactive asset management is:
during the normal life cycle of an asset or system of assets, there is the need to intervene at
strategic points to extend the expected service life (Cagle, 2003). BIM enables this to be done
more cost effectively by providing the potential for up-to-date, accurate and geometric
representations of the assets and their sub assets. Overall, the initial cost of constructing and
maintaining a BIM model can be minimal in comparison to the benefits gained over the lifecycle
of the infrastructure asset.
BIM Integration
Using BIM efficiently requires planning and effective execution. Implementing BIM
technology necessitates re-engineering the design, construction and maintenance processes
(Mihindu & Arayici, 2009). The change process is a journey through adapting principles of
7
integrated processes, interoperability for BIM information management, collaborative working
practices, and finally development of BIM based services organizations operating in the field of
the built environment (Makelainen, Hyvarinen & Peura, 2012). One of the biggest challenges
associated with BIM is effectively using and fully leveraging the process during construction. It
can take multiple implementations and countless hours for BIM usage to become a normal
integral part of project construction culture. Furthermore, using BIM includes a process of
unlearning the previous systems that were once in place to help in the decision making process
(Makelainen, Hyvarinen & Peura, 2012). Initially companies need to invest time and money into
training individuals on chosen software. Training individuals to operate BIM software can
require a sizable investment in money and time along with investment into hardware capable of
handling the memory intensive needs of BIM software. BIM Software is memory intensive and
requires hardware that is capable of processing the data retrieval that the software will need to
access in order to perform the functions that are asked of it. In general, there are many options in
the development of constructing a BIM model, and when implementing this software in to a
company’s culture some of these options are chosen by chance due to inexperience (Makelainen,
Hyvarinen & Peura, 2012). These issues are all challenges that can take place when
incorporating new technology into an otherwise tried and trusted system. As individuals learn
new, effective process, however, there is the potential to increase productivity and significantly
reduce project cost by use of the BIM software.
Value of BIM
Cost is a factor regarding all aspects of construction. Fundamentally, an owner wants the
highest quality product for the least amount of money. BIM potentially allows the needs of
multiple project stakeholders to be realized more effectively and efficiently, thereby adding
8
value. For example, life-cycle project costs can be impacted by factors such as the state of
disrepair of the asset, what has previously been repaired, and how the repairs were performed or
how the asset was originally constructed (Stratford, Stevens, Hamilton, and Dray 111-122). BIM
potentially allows for such considerations to be assessed and addressed through collaboration
using a 3D model. Stakeholders can provide design alternatives in a digital format to address
problem areas and apply degradation models to determine the most cost effective and appropriate
means of addressing design and construction issues. The use of BIM can help stakeholders move
important decisions from the field to the computer where changes are easier and more cost
effective. Additionally, stakeholders can develop a shared understanding of the project through
cross disciplinary collaboration that helps reduce design errors and miscommunication, which in
turn reduces the risk and liability (Bennett, 2012). Finally, addition value may result through the
use of BIM by avoiding data dispersion, avoided duplication of efforts, increased efficiency and
safety, shortened time for routine data collection and recording, all of which could translate in to
cost savings to the owner and increased structural safety of the assets (Lwin, 2006).
BIM can help decision-makers schedule regular maintenance on infrastructure assets.
Research suggests BIM implementation can have noticeable cost savings, overall cost diminishes
as unplanned maintenance is replaced by planned maintenance. Excessive levels of planned
maintenance can also drive the overall cost back up (Cagle, 2003). Infrastructure owners and
engineering firms seek integrated and cost-effective solutions that span the entire project
lifecycle (Jones, 2012). In a recent study by McGraw hill it was determined that 67% of the
users of BIM associated with infrastructure were seeing a positive Return on Investment (ROI),
and those users that identified themselves as experts with BIM were seeing as much as a 50%
ROI.

9
Information management is a key feature when implementing BIM for infrastructure
asset management. Keeping the data current throughout the lifecycle of the infrastructure,
however, requires proper information flow. Incorporating and integrating large amounts of data
using BIM can potentially save significant time and cost for facility managers. For example,
facility managers might spend some time searching for manufacturer’s contacts in order to
replace or maintain a part however, with BIM a single click on any part could show all
information (Marzouk & Abdel Aty, 2012). Using BIM software it is possible to define different
attributes and components of a building and categorize them into major categories: structural,
architectural, mechanical and electrical (Marzouk & Abdel Aty, 2012). Cost can also be
incorporated in the model to allow for model-based estimating. By clicking on various aspects
of the 3D model, it can produce cost information along with data regarding repair, replacement,
manufacturer, fabricator, where it was built, and if it has recently been serviced. Having such
information in one place potentially reduces time and costs associated with typical repairs. With
BIM it is possible to leverage knowledge of location, characteristics, maintenance history and
condition of the asset, combined with systematic approach to inspections and maintenance to
allow responsible authorities to effectively manage the condition and capacity of the asset and
therefore, indirectly, the capacity / capability of the assets network (Hosseen & Stanilewicz,
1990).
On an organizational level, companies and organizations are also beginning to realize the
benefits of incorporating BIM into their transportation infrastructure asset management. By
doing this it allows the owners or facility operators the ability to answer key questions such as,
what do we own? By being able to query such questions, they can pursue answering more
specific questions such as, when was the last service performed on this component? The

10
incentive of being able to ask and answer questions on an organizational level with the click of
the mouse proves invaluable for managing a collection of assets small or large. In addition, BIM
may be used to view and organize monitored data across a collection of assets. For example, air
quality sensors and moisture sensors can be place within infrastructure and input data into BIM
to provide the ability to monitor and analyze current conditions. The benefit in the case of one
study relating to management of a subway system was that they could control the HVAC system
through BIM integrated software if the indoor air quality (IAQ) was poor or moisture levels too
high. Off-site access to such information can help management teams monitor safety issues
before they happen. Such new technologies and opportunities provide the opportunity for radical
improvement from preconstruction through operation and maintenance in the management of
transportation infrastructure assets.
Potential Challenges in BIM Adoption
With all of the potential benefits of BIM implementation, several challenges remain
particularly for large transportation organizations. One major issue involves developing
standards that will allow smooth information transfer among software systems, providing access
to data for multiple stakeholders over long periods of time. The development of a universal BIM
standard is being coordinated by the International Alliance for Interoperability (IAI) through
their development of the exchange specification, Industry Foundation Classes (IFC). This
general standard is being used as a platform for developing Domain specific views by
government agencies and consortia in the AEC industry, such as the National Institute for
Building Standards (NIBS) national Building Information Model Standard (NBIMS), the United
States General Services Administration (GSA) BIM Guide, and INSPIRE in Europe and
Byggsok in Norway. Today, most developers of tools for modeling building are supporting IFC

11
as an option for open exchange of building information (Lapierre & Cote). Providing a common
format for data transfer among BIM software and the incorporation of software such as
Geographical Information Systems (GIS) into BIM is an important part of managing
infrastructure assets. Transportation organizations generally need a way to reliably weigh long-
term benefits versus implementation costs for BIM.

12
METHODOLOGY
This research implemented a case study methodology. Key tasks were to 1) review the
“current state of the infrastructure industry” through interviews / surveys of peer mass transit
organizations; 2) develop and synthesize metrics to assess impact of BIM implementation on
bridge construction 3) collect data from two similar, current bridge construction projects: one
implementing BIM, one not; 4) compare and analyze data to assess the impact of BIM
implementation on bridge construction; and 5) validate findings through interview of project
representatives. The case study involved two (2) roadway bridges constructed for the owner,
Colorado Department of Transportation (CDOT) utilizing the CM/GC delivery method and
Accelerated Bridge Construction (ABC). Metrics used to analyze the data included
superstructure cost, project schedule, and utilization of BIM. Due to the limited availability of
projects being constructed using these delivery methods, data was normalized to make project
comparisons.
13
REVIEW OF PEER ORGANIZATIONS
The following findings regarding the current “state of practice” of BIM implementation
by transportation organizations were generated by interviewing peer organizations to the owner
of the case study projects, CDOT. These organizations were peers in that they were all of
comparable size and utilized Light Rail Train (LRT) infrastructure.
Denver Regional Transportation District
Currently, the Denver Regional Transportation District (RTD) manages its’ transportation
infrastructure assets from construction through operations and maintenance (O & M) by using
the Microsoft folder structure. When projects are turned over there is no defined organizational
structure that is required other than providing all the documents necessary for future
rehabilitation or construction. Many of the projects construction and O & M documents are
placed on a hard drive or via a hard copy and turned over in this fashion. A portion of this
research involved documenting how other peer organizations were managing their information
that was created for their infrastructure projects.
New York Transit Authority
New York Transit Authority (NYMTA) adopted BIM across the board with use of
Bentley Products. They are currently using BIM for preconstruction, through construction, it is
their goal to use their BIM information for O & M once the projects are completed. Projectwise
(Bentley, n.d.) has been implemented as the main source of BIM information. By request of The
Senior Vice President, NYMTA have purchased and are testing Autodesk Suite for a
comparative analysis as to which design platform is better suited to meet their needs. To date,

14
BIM has been used on 18 projects with two of these projects currently (2013) in construction.
NYMTA state that there have been benefits to using BIM process, but that they have no official
data to quantify these benefits.
Edmonton Transit System
Edmonton has implemented a variety of BIM platforms in order to utilize a variety of
aspects of the BIM process. Autodesk and Bentley platforms are currently being utilized for
preconstruction through construction. Currently there are no completed projects that have
utilized the BIM process. Edmonton Transit System feels there are benefits to using BIM, such
as preconstruction / design development and Clash Detection but without having real numbers
they are only able to assume that positive benefits are being gained by implementing BIM.
However the organizations Integration Manager feels that using BIM has greatly enhanced
public engagement by being able to provide animations and realistic representations of how
projects might look. This alone they feel is a great benefit and well worth the investment in BIM
processes.
Southeastern Pennsylvania Transportation Authority
SEPTA has not implemented BIM on any projects to date. The organization’s Chief
Engineer stated that there was no budget or funding for projects like that within SEPTA and
there has been no talk of utilizing any technology similar to BIM.
15
Sound Transit
According to Sound Transits own Justin Lopez, Sr. CAD Drafter, East Link CAD Lead
Design, Engineering & Construction Management, Sound Transit has implemented the Autodesk
platform across the board on their LRT project. This project covers 14 miles of track, ten (10)
stations, three (3) underground tunnels, five (5) parking garages, and a mix of elevated guide
ways totaling 2.8 billion dollars. They report that they have seen RFI’s decrease since this
implementation but have no quantifiable data. They also report some drawbacks to having
implemented BIM. One of the most noticeable is reworking models to accommodate major
design changes when they get past the 60% completion point due to the LOD involved. They
feel it has been beneficial through public involvement, due to the ability to provide a realistic
representation of the projects outcome. From this benefit alone they feel that it is a great
investment and moving forward they will use BIM on all new projects.
16
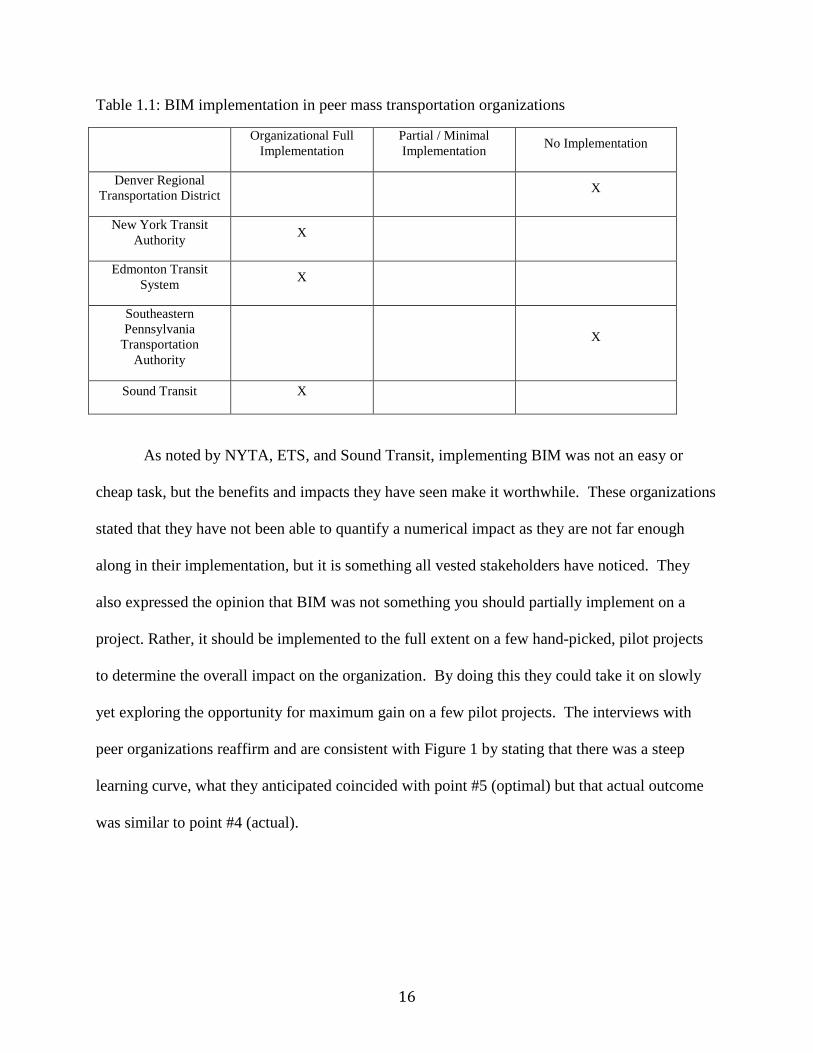
Table 1.1: BIM implementation in peer mass transportation organizations
Organizational Full
Implementation Partial / Minimal
Implementation No Implementation
Denver Regional
Transportation District X
New York Transit
Authority X
Edmonton Transit
System X
Southeastern
Pennsylvania
Transportation
Authority
X
Sound Transit X
As noted by NYTA, ETS, and Sound Transit, implementing BIM was not an easy or
cheap task, but the benefits and impacts they have seen make it worthwhile. These organizations
stated that they have not been able to quantify a numerical impact as they are not far enough
along in their implementation, but it is something all vested stakeholders have noticed. They
also expressed the opinion that BIM was not something you should partially implement on a
project. Rather, it should be implemented to the full extent on a few hand-picked, pilot projects
to determine the overall impact on the organization. By doing this they could take it on slowly
yet exploring the opportunity for maximum gain on a few pilot projects. The interviews with
peer organizations reaffirm and are consistent with Figure 1 by stating that there was a steep
learning curve, what they anticipated coincided with point #5 (optimal) but that actual outcome
was similar to point #4 (actual).

17
Figure 1.1: BIM Implementation Learning Curve
Review of peer organization “state of BIM implementation” suggests and confirms that
significant research need exists to investigate initial implementations of BIM on transportation
infrastructure projects. The following Case Study documents the potential benefits and
challenges of implementing BIM during bridge construction.
http://www.aecbytes.com/viewpoint/2012/issue_65.html

18
CASE STUDY
Research Question
What are the impacts and potential benefits and challenges of implementing BIM on bridge
construction?
Characteristics and Metrics
Each transportation infrastructure project, as constructed, is unique, making accurate
comparison a challenge. The following two transportation projects were intentionally selected
due to their relatively high number of similar characteristics including, owner, delivery method,
construction type and structural design, as well as the method of transfer (into final location).
Characteristics compared to establish similarity include:
Design/Delivery Approach
Construction Type
Method of Transfer (for putting bridge in place using Accelerated Bridge Construction)
BIM Implementation
Average Daily Traffic
Design life-span
Construction era (were the projects constructed in similar timeframes)
While no commonly accepted metrics exist either according to industry or research we propose
the following metrics as meaningful in assessing the impact of BIM implementation during
construction:

19
Cost ($)
Duration (mo.)
Requests for Information ( / $)
Requests for Information ( / 100 SQ Ft)
Requests for Information ( / Day)
Change Modification Orders ( / $)
Change Modification Orders ( / 100 SQ Ft)
Change Modification Orders ( / Day)
Potential additional metrics include ones that focus on differences in structural complexity.
The two projects selected in our Case Study are intentional of similar structural complexity. It is
important to note that the following structural characteristics may be important when comparing
or assessing future research. Examples include:
Continuous span – Distance between expansion joints
Type of superstructure – i.e. pre-stressed concrete girders
Number of expansion joints – used to absorb heat induced expansion, vibration, or
settlement of the earth
Next we present the present day Case Study: two projects which share many project
characteristics and apply the proposed metrics on the two relatively similar projects to assess the
impact of BIM implementation on bridge construction.
20
Project Characteristics
Comparison of Pecos Street Bridge Replacement & Rocky Ford Sliding Bridge Projects
The following Case Study provides a comparative analysis of the impacts, benefits and
challenges associated with utilizing Building Information Modeling (BIM) on recent bridge
construction in the Denver Metro area, utilizing a CM/GC delivery method for the Colorado
Department of Transportation (CDOT). The two bridge structures analyzed are the Pecos St over
I-70 Bridge Replacement (delivered using BIM) and the Fort Lyon Canal Bridge (delivered not
using BIM). As previously noted, the two projects share many similarities. They are both
constructed using the CM/GC delivery method and were constructed utilizing the Accelerated
Bridge Method. The construction of the two bridges was performed off-site with the structures
rolled into place after they were constructed. Both projects were completed in 2013. In addition
to the use of BIM, the projects differed, somewhat, in terms of size and complexity of design and
construction. The Pecos over I-70 Bridge complexity was due to being in a highly urban area
with the need to address 48th
Ave. and 4 on / off ramps in a limited amount of space, and it was
the first time that the owner (CDOT) utilized BIM during project delivery. The Fort Lyon Canal
Bridge was significantly less complicated, and was located in a rural area. Initial findings
suggest that the implementation of BIM on the complex Pecos St over I-70 Bridge Replacement
project was beneficial and saved the project time and money.
Both projects implemented Accelerated Bridge Construction in order to provide the
opportunity to improve site constructability, total project delivery time, and work zone safety
while reducing traffic impacts, onsite construction time and weather related time delays

21
("Bridges and structures," 14). In addition, they shared the same characteristics across the
following variables:
Design/Delivery Approach: Construction Manager / General Contractor (CM/GC)
Construction type: Single span-post tensioned concrete
Method of transfer: Rolled
Pecos Street over I-70 Bridge Project
Pecos Street over I-70 Bridge Project is located in the Denver metro, CDOT Region 1.
The original structure was built in 1965, but was recently identified as being in poor condition
and was selected to be replaced. The replacement project included replacing the old Pecos
structure; installing roundabout type intersections, and building a pedestrian bridge. Kiewit
Infrastructure constructed the project utilizing the Construction Manager/General Contractor
(GM/GC) delivery process. Construction started in November 2012 and was completed in
October 2013 (13 months), weather was not a defining factor in project duration.
22
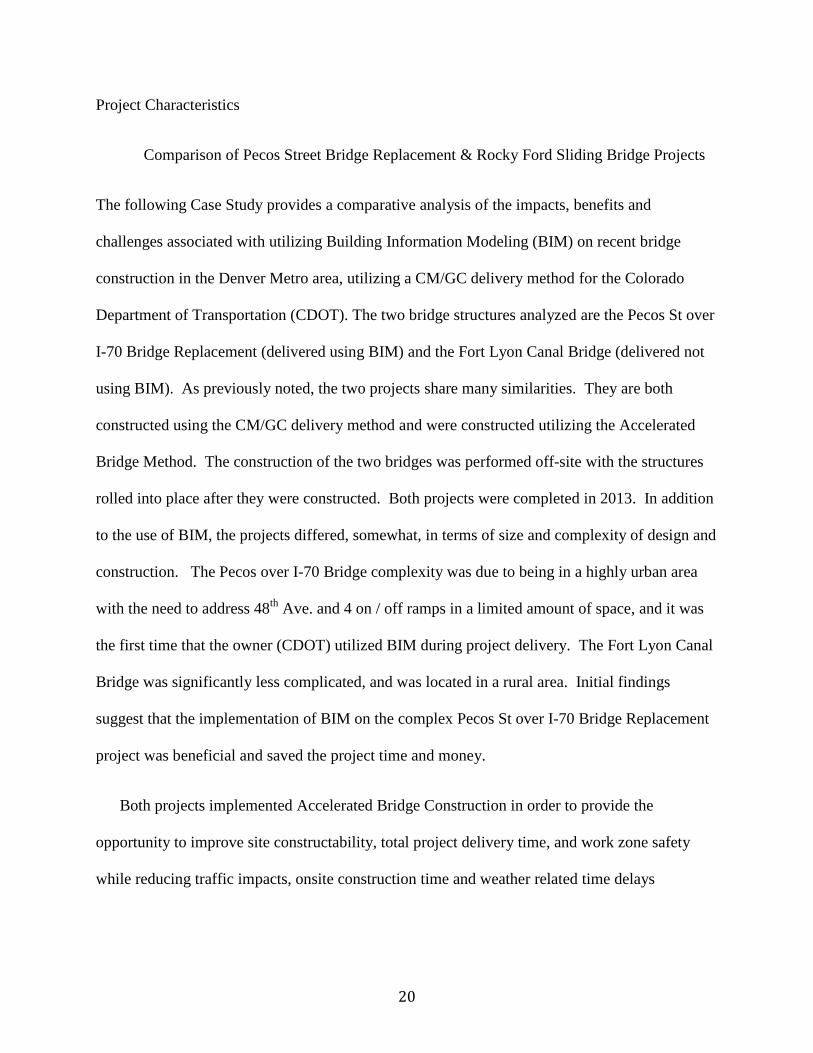
Figure 1.2: BIM Model of Pecos Street over I-70 Bridge and Pedestrian Overpass
The new super structure was built utilizing BIM and Accelerated Bridge Construction
(ABC) techniques. One goal of the ABC technique is to reduce the impact on the traveling
public. Benefits of using ABC include the abilities to improve safety, quality, durability, social
costs, and environmental impacts. In general, ABC techniques provide the opportunity to
improve site constructability, total project delivery time, and work zone safety while reducing
traffic impacts, onsite construction time and weather related time delays ("Bridges and
structures," 14).

23
Figure 1.3: BIM Model showing all converging streets and the need for the round-abouts
BIM was utilized on the project from conceptual design through construction.
Specifically the bridge design consultant Wilson, and Kiewit the contractor, utilized the BIM
processes through the software Midas Civil ("Midas civil integrated," 2013). The project’s cost
was affected directly due to the purchase and learning curve of this software. Kiewit used this
software to model the bridge and associated lifting diaphragms. This was to determine how the
specific lifting points might be affected due to the associated stress and pressure. They looked at
overall longitudinal design, shear, torsion, and maximum twist and the impact it would have on
the differential or deflection. The super structure required four (4) types of post tensioning
including longitudinal internal tendons, longitudinal external tendons, vertical tendons in the
diaphragms, and transverse deck tendons ("Pecos street bridge,"). By modeling this they were
able to determine that if they went greater then a .25 inch there was an extreme chance of
damage. Modeling also provided a means for them to determine how they would put them on
the Self Propelled Modular Transport Vehicles (SPMTV) from the jacks that they had to utilize
in order to lift the structure strait up in order to not damage these points on the bridge. The Pecos

24
Street over I-70 Bridge superstructure was cast on a rat slab (concrete pad) with underground
jack vaults put in place to lift it when moving it into place. Another aspect the model was able
to provide was how to deal with the elevation change of I-70. They had to determine the most
effective way to flatten out the grade for ease of moving the superstructure, this was to minimize
bridge deflection and make sure when they were rolling the bridge on to the freeway they didn’t
exceed the maximum grade. Other factors that contributed to its high level of complexity were
the incorporation of partial round-abouts as part of the bridge deck. To add to the project
complexity, the bridge location is a highly urban area with a minimal amount of workspace and,
when completed, spans a heavily used freeway. This structure was built using a bridge farm
technique in close proximity to the original structure. This structure has a total area of 12050 SQ
FT and currently carries 19,000 trips per day (TPD). The Pecos Street Bridge over I-70 has a
projected life span of 75 years and a total project award amount of $18,600,000 of this cost
$3,850,272 was to build the superstructure.
Rocky Ford Bridge Project: Fort Lyon Canal Bridge
The following bridge is part of the Rocky Ford Bridge Project, located in CDOT’s southeastern
Region 2.
25
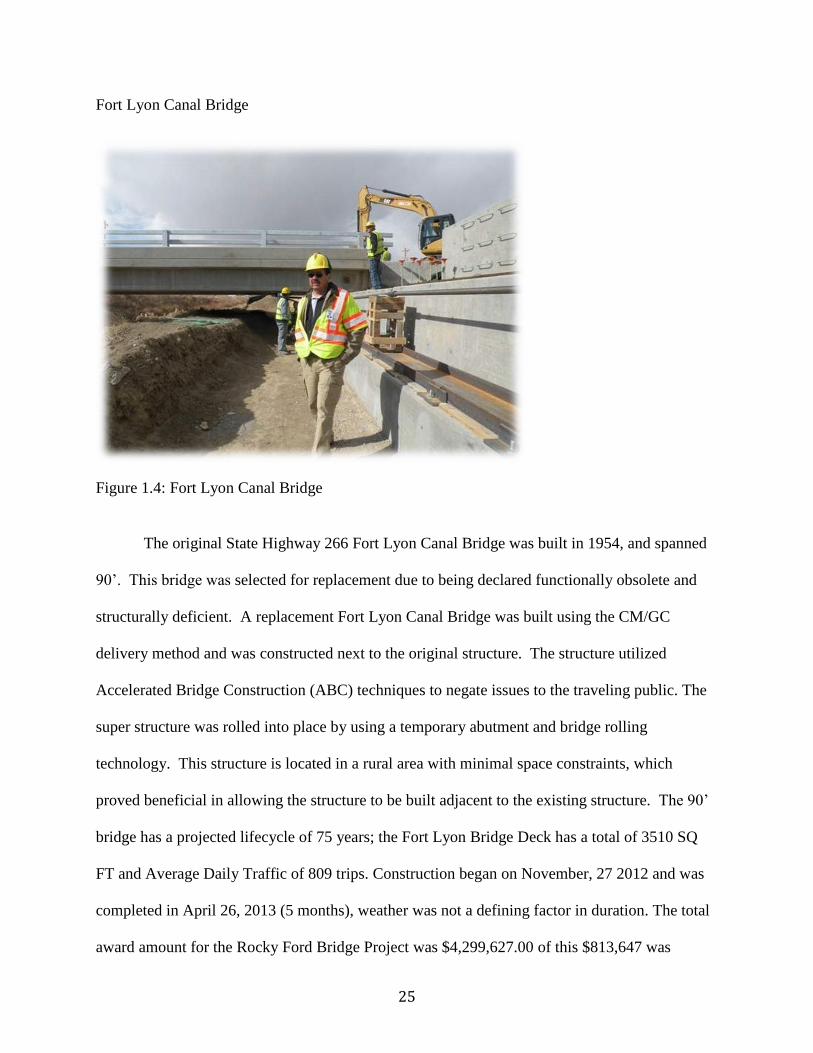
Fort Lyon Canal Bridge
Figure 1.4: Fort Lyon Canal Bridge
The original State Highway 266 Fort Lyon Canal Bridge was built in 1954, and spanned
90’. This bridge was selected for replacement due to being declared functionally obsolete and
structurally deficient. A replacement Fort Lyon Canal Bridge was built using the CM/GC
delivery method and was constructed next to the original structure. The structure utilized
Accelerated Bridge Construction (ABC) techniques to negate issues to the traveling public. The
super structure was rolled into place by using a temporary abutment and bridge rolling
technology. This structure is located in a rural area with minimal space constraints, which
proved beneficial in allowing the structure to be built adjacent to the existing structure. The 90’
bridge has a projected lifecycle of 75 years; the Fort Lyon Bridge Deck has a total of 3510 SQ
FT and Average Daily Traffic of 809 trips. Construction began on November, 27 2012 and was
completed in April 26, 2013 (5 months), weather was not a defining factor in duration. The total
award amount for the Rocky Ford Bridge Project was $4,299,627.00 of this $813,647 was
26
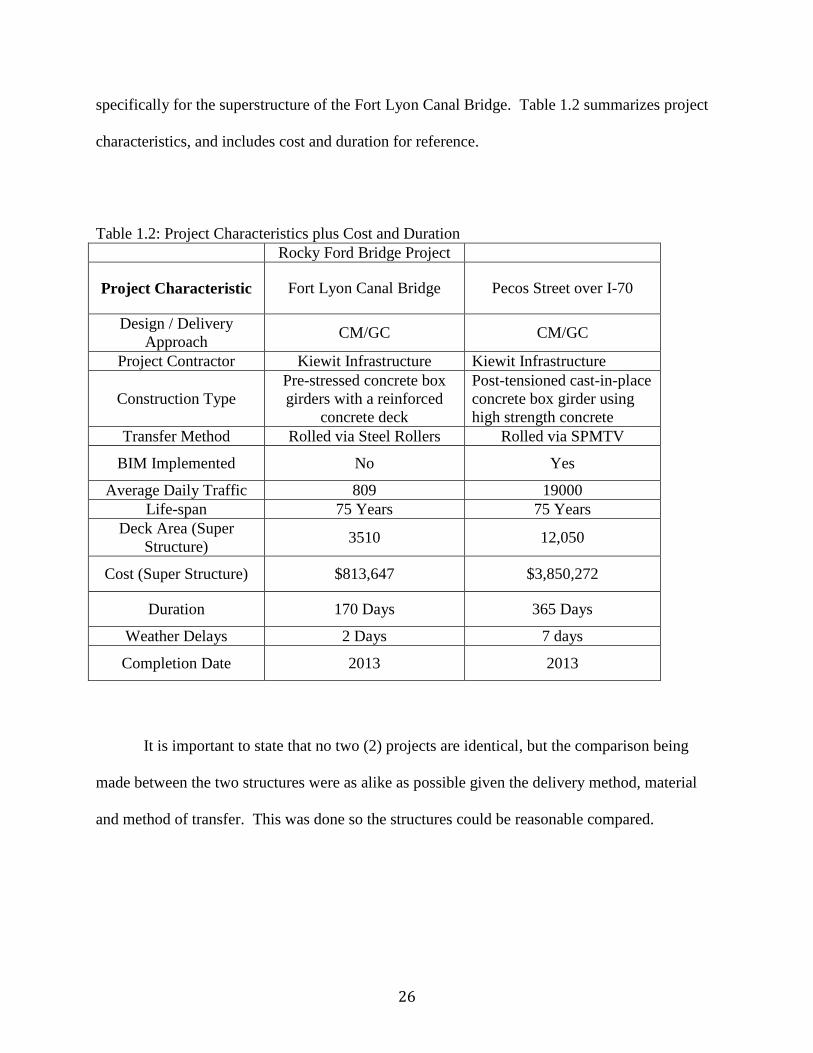
specifically for the superstructure of the Fort Lyon Canal Bridge. Table 1.2 summarizes project
characteristics, and includes cost and duration for reference.
Table 1.2: Project Characteristics plus Cost and Duration
Rocky Ford Bridge Project
Project Characteristic Fort Lyon Canal Bridge Pecos Street over I-70
Design / Delivery
Approach CM/GC CM/GC
Project Contractor Kiewit Infrastructure Kiewit Infrastructure
Construction Type
Pre-stressed concrete box
girders with a reinforced
concrete deck
Post-tensioned cast-in-place
concrete box girder using
high strength concrete
Transfer Method Rolled via Steel Rollers Rolled via SPMTV
BIM Implemented No Yes
Average Daily Traffic 809 19000
Life-span 75 Years 75 Years
Deck Area (Super
Structure) 3510 12,050
Cost (Super Structure) $813,647 $3,850,272
Duration 170 Days 365 Days
Weather Delays 2 Days 7 days
Completion Date 2013 2013
It is important to state that no two (2) projects are identical, but the comparison being
made between the two structures were as alike as possible given the delivery method, material
and method of transfer. This was done so the structures could be reasonable compared.

27
CM/GC Delivery vs. Typical Project Delivery Methods
All bridges constructed within Colorado use the American Association of State Highway
and Transportation Officials (AASHTO) specifications and the CDOT Bridge Design Manual.
Colorado Department of Transportation has typically used Design-Bid-Build, Design Build, and
Modified-Design-Build for project delivery on a large portion of its previous projects (Vessley,
2009). The purpose of utilizing the CM/GC contracting methods is that it incorporates an
integrated team approach applying project management techniques to planning, design, and
construction (Vessley, 2009). The CM/GC delivery method is conducive to using BIM in that it
helps with the collaboration and communication processes. The reasoning for using a delivery
approach on the bridge projects analyzed in the case study is that it involves the contractor in
both the design and construction of the project, which allows for collaboration with the engineer
and architect. The delivery method has the ability to help reduce cost by the inclusion of the
contractor in providing alternative means and methods to address the complicated design and
constructability issues. The CM/GC delivery method provides for a shared risk approach that
can help with schedule optimization and keeping the project on budget. CM/GC gives the
contractor the ability to start construction before the entire design is complete which allows for
an earlier turnover and can benefit a project by improving safety and improving quality
(Colorado Department of Transportation). The use of CM/GC is relatively new to CDOT. To
date CDOT has used CM/GC on 8 projects starting in 2009, these projects include the Eagle
Interchange, Grand Avenue Bridge, Eisenhower Johnson Memorial Tunnel, Dotsero Bridge,
Pecos over I-70 Bridge, Rocky Ford Sliding Bridge project, I-70 East Bound Twin Tunnels, and
the I-70 West Bound Twin Tunnels (Vessley, 2009).

28
Project Metrics
The following section documents the data used for comparison of the three project case
studies including Contract Modification Orders, Requests for Information, Schedule, and Costs.
Cost and construction duration data was previously provided in Table 1.2.
Table 1.3: Number of Contract Modification Orders and Requests for Information, and Amount
of Rework by Project
Rocky Ford Bridge Project
Fort Lyon Canal Bridge Pecos Street over I-70
Contract Modification
Orders 3 8
Requests for
Information 2 6
Rework 2 0
29
.
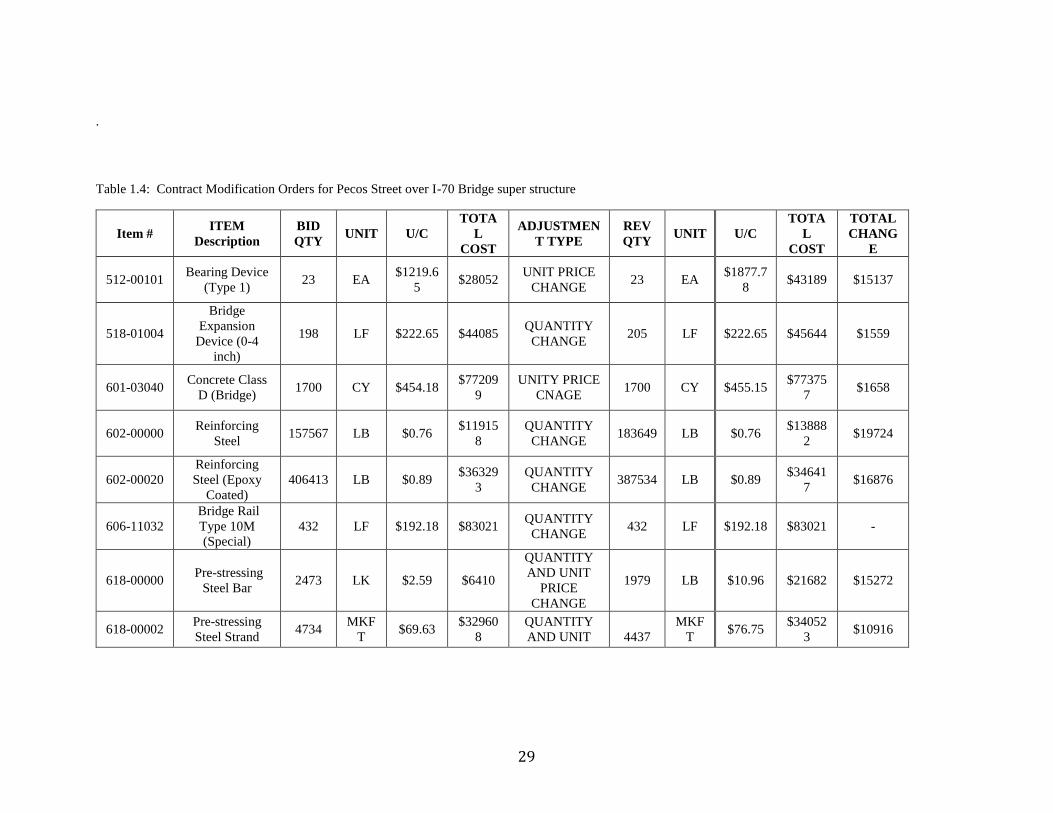
Table 1.4: Contract Modification Orders for Pecos Street over I-70 Bridge super structure
Item # ITEM
Description
BID
QTY UNIT U/C
TOTA
L
COST
ADJUSTMEN
T TYPE
REV
QTY UNIT U/C
TOTA
L
COST
TOTAL
CHANG
E
512-00101 Bearing Device
(Type 1) 23 EA
$1219.6
5 $28052
UNIT PRICE
CHANGE 23 EA
$1877.7
8 $43189 $15137
518-01004
Bridge
Expansion
Device (0-4
inch)
198 LF $222.65 $44085 QUANTITY
CHANGE 205 LF $222.65 $45644 $1559
601-03040 Concrete Class
D (Bridge) 1700 CY $454.18
$77209
9
UNITY PRICE
CNAGE 1700 CY $455.15
$77375
7 $1658
602-00000 Reinforcing
Steel 157567 LB $0.76
$11915
8
QUANTITY
CHANGE 183649 LB $0.76
$13888
2 $19724
602-00020
Reinforcing
Steel (Epoxy
Coated)
406413 LB $0.89 $36329
3
QUANTITY
CHANGE 387534 LB $0.89
$34641
7 $16876
606-11032
Bridge Rail
Type 10M
(Special)
432 LF $192.18 $83021 QUANTITY
CHANGE 432 LF $192.18 $83021 -
618-00000 Pre-stressing
Steel Bar 2473 LK $2.59 $6410
QUANTITY
AND UNIT
PRICE
CHANGE
1979 LB $10.96 $21682 $15272
618-00002 Pre-stressing
Steel Strand 4734
MKF
T $69.63
$32960
8
QUANTITY
AND UNIT
4437
MKF
T $76.75
$34052
3 $10916

30
Table 1.5: Contract Modification Orders for Fort Lyon Canal Bridge super structure
CHANGE
ORDER # /
ITEM #
ITEM
DESCRIPTION
BID
QTY UNIT U/C
TOTAL
COST
ADJUSTMENT
TYPE / ITEM #
REV
QTY UNIT U/C
TOTAL
COST
TOTAL
CHANGE
6 / 700-
70034
Relocation of
utilities
2000
0 F.A. $1.00 $20000 ADD
$20000 /
$0
7 / 403-
34741
Hot Mix Asphalt
(HMA) 325 TON $115 $37375
SUBSTITUTION
/ 403 - 34751 325 TON $130 $42250 $4875 / $0
7 / 403-
34751
Hot Mix Asphalt
(HMA) 252 TON $115 $29980
SUBSTITUTION
/ 403 -34751 252 TON $130 $32760 $2780 / $0
8 / 506-
01020
Stabilize Existing
Sub grade 600 SY $8 $4800 ADD $4800 / $0

31
Table 1.6: RFI’s for Pecos Street over I-70 Bridge super structure
RFI’s for the Fort Lyon Canal Bridge project.
Table 1.7: RFI’s for the Fort Lyon Canal Bridge super structure
RFI # Discipline Location Subject
R0038 Superstructure Bottom Slab
Additional Bottom
Slab Thickness
adjusted for Concrete
R0042 Superstructure Bridge Move
Superstructure deck
cure time prior to
lifting
R0043 Superstructure
Bifurcation section
of web walls 1A
and 4A
Rebar conflict with
Post Tension (PT)
tendons 2 and 3 at the
bifurcation section
R0045 Superstructure Web Wall 1 Damage to PT duct#1
R0061 Superstructure End diaphragm on
Abutment 2
Rock Pockets on the
Abutment 2 End
diaphragm wall
R0063 Superstructure
Abutment 1 End
Diaphragm
NCR-Voids on
abutment 1 end
diaphragm
RFI # Discipline Location Subject
0007 Bridge Rolling
Details SH 266 Fort Lyon
Bearing stiffener
spacing
0009A Bridge Roll SH 266 Fort Lyon 1” nominal grout bed

32
Metric Analysis
The following section provides a comparative analysis of the two projects. Data is
normalized in an effort to highlight the role of utilizing BIM in the Pecos Street over I-70 Bridge
Project, compared to the Fort Lyon Canal Bridge project where it was not used. As described in
Table 8, the rolling of the super structures and the difference in cost in the specialty concrete
required by the Pecos Street over I-70 Bridge was removed to provide an accurate analysis of the
impacts and benefits of BIM.
Table 1.8: Cost of construction methods / materials on the 2 projects that were normalized
* If Class D Con. ($900/SY) was used instead of required, high strength SY S-40 Con.
($944.99/SY) ($44.99/SY * 1062 SY)
Discipline / Material Fort Lyon Canal Project Pecos over I-70 Bridge
Project
Bridge Roll $230,000 $1,077,144
Concrete Mix $0.00 $47,783*
Total $ subtracted
from Construction
Cost for
normalization of
projects
$230,000 $1,124,927
Total Normalized
Value $583,647 $2,725,345

33
Contract Modification Orders (CMO)
Table 1.9: Comparison of Contract Modification Orders normalized by project
Rocky Ford
Bridge Project
Impact of BIM
Implementation
Fort Lyon Canal
Bridge
Pecos Street over
I-70
% Change
CMO / 100 SF (3/3510)/100
=.0000085
(8/12050)/100
=.0000066
22% Decrease
CMO / dollar (3 / $583,647)
=.0000051
(8 / $2,725,345)
=.0000029
43% Decrease
CMO/day (3/170)
=.017
(8/365)
=.021
24% Increase
CMO / Average
daily traffic (ADT)
(3/809)
=.00371
(8/19000)
=.00042
88% Decrease
Pecos Street over I-70 required a total of 16 change orders during the construction of the project.
Of these 16 CMO’s, eight specifically dealt with the super structure of the bridge. This average
comes out to .0000066 Contract Modification Orders / 100 SQ FT. The CMO’s were specific to
concrete, steel reinforcement, pre-stressing, and expansion devices. The Fort Lyon Canal Bridge
required three Contract Modification Orders for the super structure of the bridge. This is an
average of .0000085 Contract Modification Orders / 100 SQ FT, the remaining addressed adding
Tensar Triaxial Geogrid to stabilize the existing sub grade.
Comparing these averages suggests that BIM played a role in reducing Contract Modification
Orders for the Pecos Street over I-70 project. The number of CMO’s suggests that even though
the Fort Lyon Canal Bridge was less complex than the Pecos Street over I-70 Bridge, it was still
difficult to determine possible conflicts that could arise on the project. It is possible that using
BIM technology could have helped the project team prepare for these unexpected issues, and
may possibly avoided them.
34
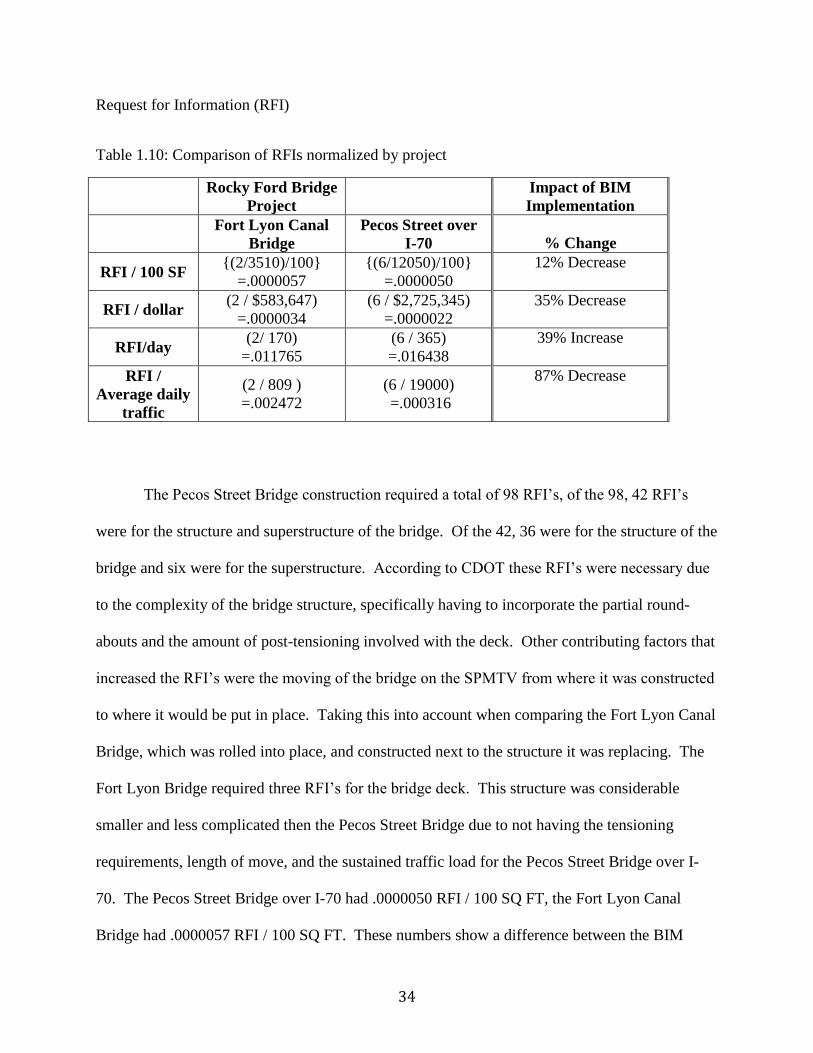
Request for Information (RFI)
Table 1.10: Comparison of RFIs normalized by project
Rocky Ford Bridge
Project
Impact of BIM
Implementation
Fort Lyon Canal
Bridge
Pecos Street over
I-70
% Change
RFI / 100 SF {(2/3510)/100}
=.0000057
{(6/12050)/100}
=.0000050
12% Decrease
RFI / dollar (2 / $583,647)
=.0000034
(6 / $2,725,345)
=.0000022
35% Decrease
RFI/day (2/ 170)
=.011765
(6 / 365)
=.016438
39% Increase
RFI /
Average daily
traffic
(2 / 809 )
=.002472
(6 / 19000)
=.000316
87% Decrease
The Pecos Street Bridge construction required a total of 98 RFI’s, of the 98, 42 RFI’s
were for the structure and superstructure of the bridge. Of the 42, 36 were for the structure of the
bridge and six were for the superstructure. According to CDOT these RFI’s were necessary due
to the complexity of the bridge structure, specifically having to incorporate the partial round-
abouts and the amount of post-tensioning involved with the deck. Other contributing factors that
increased the RFI’s were the moving of the bridge on the SPMTV from where it was constructed
to where it would be put in place. Taking this into account when comparing the Fort Lyon Canal
Bridge, which was rolled into place, and constructed next to the structure it was replacing. The
Fort Lyon Bridge required three RFI’s for the bridge deck. This structure was considerable
smaller and less complicated then the Pecos Street Bridge due to not having the tensioning
requirements, length of move, and the sustained traffic load for the Pecos Street Bridge over I-
70. The Pecos Street Bridge over I-70 had .0000050 RFI / 100 SQ FT, the Fort Lyon Canal
Bridge had .0000057 RFI / 100 SQ FT. These numbers show a difference between the BIM

35
Project (Pecos Street Bridge) and the non-BIM project (Fort Lyon Canal Bridge). The Pecos
Street Bridge over I-70 was an extremely complicated project and dealt with more complex
factors. This suggests that BIM may have helped the project team reduce the RFI’s greatly in
comparison of not utilizing BIM.
Schedule and Cost
Table 1.11: Comparison of Average costs of construction for the (2) projects
Fort Lyon Canal Bridge Pecos Street over I-70
Total Cost $559,987 $2,725,345
SQ FT Cost $160 $226
Average Daily Spending $3,294 $7,467
Pecos Street Bridge over I-70 super structure was finished in 365 days at a normalized
cost of $2,725,345, with a total SQ FT cost of $226. The average per day spending on this
project was $7,467. The Fort Lyon Canal Bridge was finished in 170 days at a cost of $583,647
with a Total SQ FT cost of $166. The average per day cost was $3433.
36
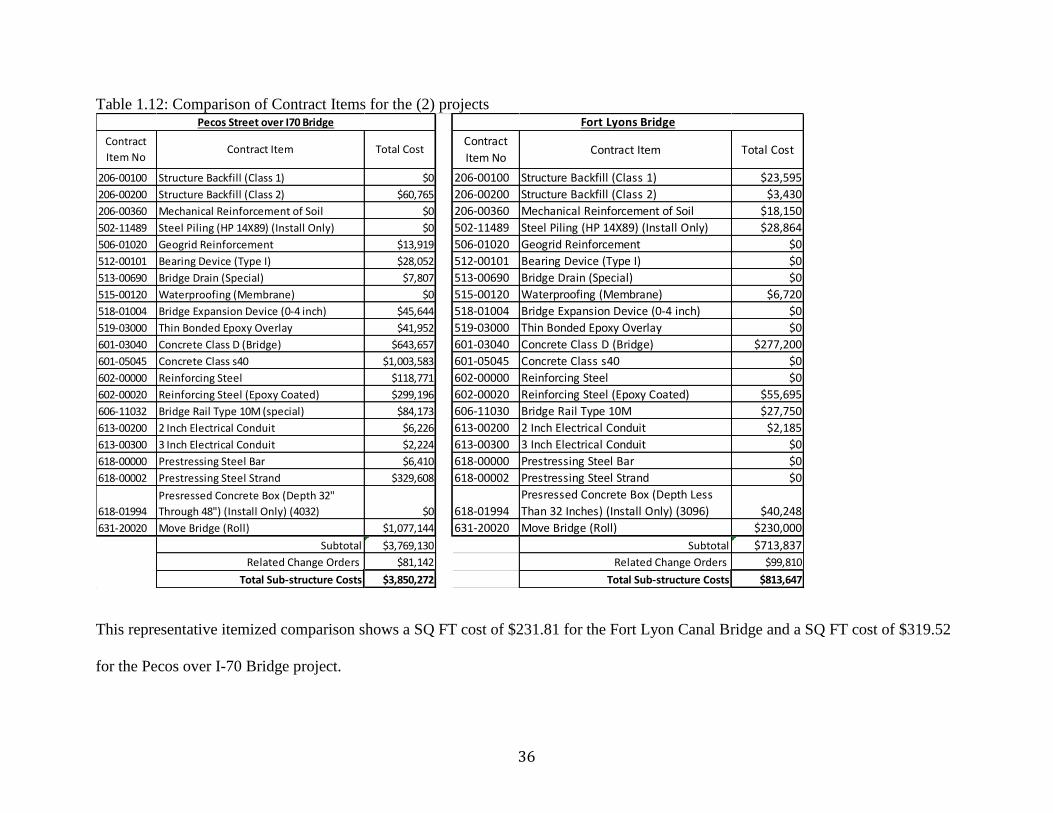
Table 1.12: Comparison of Contract Items for the (2) projects
This representative itemized comparison shows a SQ FT cost of $231.81 for the Fort Lyon Canal Bridge and a SQ FT cost of $319.52
for the Pecos over I-70 Bridge project.
206-00100 Structure Backfill (Class 1) $0 206-00100 Structure Backfill (Class 1) $23,595
206-00200 Structure Backfill (Class 2) $60,765 206-00200 Structure Backfill (Class 2) $3,430
206-00360 Mechanical Reinforcement of Soil $0 206-00360 Mechanical Reinforcement of Soil $18,150
502-11489 Steel Piling (HP 14X89) (Install Only) $0 502-11489 Steel Piling (HP 14X89) (Install Only) $28,864
506-01020 Geogrid Reinforcement $13,919 506-01020 Geogrid Reinforcement $0
512-00101 Bearing Device (Type I) $28,052 512-00101 Bearing Device (Type I) $0
513-00690 Bridge Drain (Special) $7,807 513-00690 Bridge Drain (Special) $0
515-00120 Waterproofing (Membrane) $0 515-00120 Waterproofing (Membrane) $6,720
518-01004 Bridge Expansion Device (0-4 inch) $45,644 518-01004 Bridge Expansion Device (0-4 inch) $0
519-03000 Thin Bonded Epoxy Overlay $41,952 519-03000 Thin Bonded Epoxy Overlay $0
601-03040 Concrete Class D (Bridge) $643,657 601-03040 Concrete Class D (Bridge) $277,200
601-05045 Concrete Class s40 $1,003,583 601-05045 Concrete Class s40 $0
602-00000 Reinforcing Steel $118,771 602-00000 Reinforcing Steel $0
602-00020 Reinforcing Steel (Epoxy Coated) $299,196 602-00020 Reinforcing Steel (Epoxy Coated) $55,695
606-11032 Bridge Rail Type 10M (special) $84,173 606-11030 Bridge Rail Type 10M $27,750
613-00200 2 Inch Electrical Conduit $6,226 613-00200 2 Inch Electrical Conduit $2,185
613-00300 3 Inch Electrical Conduit $2,224 613-00300 3 Inch Electrical Conduit $0
618-00000 Prestressing Steel Bar $6,410 618-00000 Prestressing Steel Bar $0
618-00002 Prestressing Steel Strand $329,608 618-00002 Prestressing Steel Strand $0
618-01994
Presressed Concrete Box (Depth 32"
Through 48") (Install Only) (4032) $0 618-01994
Presressed Concrete Box (Depth Less
Than 32 Inches) (Install Only) (3096) $40,248
631-20020 Move Bridge (Roll) $1,077,144 631-20020 Move Bridge (Roll) $230,000
Subtotal $3,769,130 Subtotal $713,837
Related Change Orders $81,142 Related Change Orders $99,810
Total Sub-structure Costs $3,850,272 Total Sub-structure Costs $813,647
Fort Lyons Bridge
Total CostContract
Item NoContract Item
Pecos Street over I70 Bridge
Contract
Item NoContract Item Total Cost

37
Qualitative Feedback
After the analysis was performed, interviews were conducted with the Colorado
Department of Transportation to clarify and validate any cost disparities seen between the Pecos
Street over I-70 Bridge and the Fort Lyon Canal Bridge. According to both project contacts these
projects were CM/GC delivered, so by definition they would be lump-sum projects. Taking this
into account, there was scope growth reported on both projects specifically through change
orders which added additional unforeseen costs during construction. On the Pecos Street over I-
70 Bridge project scope growth represented a 9% increase in total cost, scope growth on the Fort
Lyon canal bridge represented a 14% change in cost. Tamara Hunter Maurer P.E. CDOT Pecos
over I-70 Bridge Project, and Dean L. Sandoval, Fort Lyon Canal CDOT Project Manager were
asked what might have caused the differences in costs between the two projects including
materials, methods of construction, and BIM implementation.
Pecos Street over I-70
The project Engineer from the Pecos Street over I-70 Bridge project stated that the
concrete required for the bridge was extremely expensive and cost roughly $944 / SQ YD with a
total cost of $1,003,582.99. To add to this, she stated that there were multiple loads that had to
be turned away due to not meeting the project specifications and to compound this, it was
incredible difficult to work with. The reasoning behind using this specific concrete is that it
reduced cracking and therefore was necessary due to the bridges required move, and they were
able to justify it as a necessary cost. BIM’s portion in the cost was due to this being the first time
it had been implemented on a project of this nature. Associated costs came from the actual
software purchase (which runs $8,000 - $23,000 depending on if your using the basic or full
38
version), the initial learning curve associated with billed hours, which turned out to not be
extremely challenging, and the software (Midas Civil) outputs were not exactly straightforward.
It was noted that over the course of the project the understanding of the specific software got
better. It was also noted that there was not an exact number in regard to BIM for the cost, but it
had a significant impact on the total project cost. Other factors that could be associated to the
projects cost is the use of Accelerated Bridge Construction, specifically the actual rolling of the
superstructure ($1,077,144), which she stated a bridge like this could have not been built without
it.
Fort Lyon Canal Bridge
The project manager of the Rocky Ford Sliding Bridge project stated that costs were
accrued on the Fort Lyon Canal Bridge Project due to implementing Accelerated Bridge
construction. These costs were expected and they were specific to the use of special rollers,
tracks, and the hydraulic system used to roll the bridge superstructure ($230,000.00). It is known
that specialty items might be needed when using the ABC method but overall costs tend to be
lower.
CDOTS Feedback on Cost Differences
According to Nabile Haddad P.E., Innovative Contracting Manager with CDOT some of
the cost difference observed between the two projects were directly attributed to project location:
due to the urban aspect of the Pecos Street Bridge and the rural aspect of the Fort Lyon Canal
39
Bridge. Costs are associated with the level of traffic each site has to deal with. Construction
Phasing, cost of sliding and the actual labor all need to be accounted for these location
differences. He stated that there is software CDOT specifically uses to determine feasibility of
using ABC, and associated processes in deciding what delivery method will be most effective,
weather that be cost, time or other factors that is slowly becoming part of their SOP.
Discussion
Determining the impacts and benefits of BIM Implementation requires comparing
numerous quantity metrics. To analyze early adoption (first implementation) of the technology it
is also important to speak with the individuals involved in the process to understand the
qualitative impacts of BIM implementation. The results of this Case Study suggest that using
BIM was beneficial for the Pecos Street Bridge over I-70 and resulted in reducing the number of
RFI’s and CMO’s compared to traditional construction methods, as demonstrated in the / SQ FT
and the / day comparisons. However, the complexity and size of the Pecos Street Bridge over I-
70 resulted in a higher award amount and a greater daily cost. This is evident in the $18,600,000
total award amount and the Super structures normalized cost of $2,725,345. However, using
BIM on the Pecos over I-70 Bridge allowed CDOT to deliver a bridge that otherwise could not
have been built in the space and time constraints required. The ability to provide accurate and
realistic views of the finished project provided the owner with a significant benefit. Prior to
construction, CDOT showed images of the design to the public using the BIM model. This
helped the public to better understand and support the expected outcome. By showing BIM-
40
enabled 3D images of the project, CDOT was able to educate all of the individuals on how the
construction might benefit them in terms of future movement through the area.
In the end, the overall cost impact of BIM implementation on the Pecos over I-70 Bridge
was determined to be cost neutral. Moving forward CDOT believes that the next project could
see a potential Return on Investment (ROI) versus being cost neutral. Such a result would align
with the McGraw Hill study “The Business Value of BIM for Infrastructure” which states “ROI
has a powerful correlation with BIM expertise” (Bernstein & Stephen, 2012).
In sum, the impact of BIM was shown to be significant by the Case Study primarily
because CDOT was able to provide a project that otherwise could not have been delivered.
Specifically, the use of BIM facilitated modeling of the actual structure and the transfer of the
structure. Analyzing variables related to the transfer allowed for the minimization of possible
damage to the superstructure. This result is confirmed by the observed reduction in RFIs and
CMOs relative to construction area (SF), cost ($), and average daily traffic, compared to typical
construction. CMO’s on the Pecos Street over I-70 Bridge accounted for 2% of the total cost of
the super structure. CMO’s on the Fort Lyon Canal Bridge accounted for 12% of the
superstructures cost. BIM theoretically saved the Pecos Street over I-70 Bridge project 10%
over the total projects cost. BIM’s full benefit, however, is not limited to the construction, but
will continue once a bridge is in place, since it can then be managed more effectively by the
incorporation of the information gained through the construction process. Utilizing BIM for
operation and management of transportation infrastructure is still in infancy, but it is the goal of
the peer organizations that have implemented it into their construction processes. The
opportunities presented allow for an asset that can be maintained efficiently and effectively by
incorporating all maintenance and material aspects, accessible in one 3D smart model.

41
Although the cost to construct the Pecos over I-70 Bridge was higher, this Case Study
suggests that BIM’s influence on the project provided added value by helping minimize
complexities with the unique super structure and its’ required move. The Pecos over I-70 Bridge
represented the first time BIM was implemented and utilized within the entire CDOT
organization, and may have incurred avoidable “learning or first adoption” costs. Even on first
implementation, however, using BIM technology allowed for the project team to evaluate
potential risks before encountering them in the field. By utilizing a 3D model the construction
crew was able to analyze both permanent and temporary loads that would result from the moving
of the super structure (Colorado Department of Transportation, 2013). This was critical to avoid
loads that might otherwise cause unwanted fractures to the super structure, which in turn, would
reduce lifespan. Another benefit was that BIM allowed the project team to obtain a general idea
of cost, although in the end the plans were utilized for estimating purposes. The Pecos Bridge
avoided rework altogether through the incorporation of BIM technology. This suggests that there
were undocumented (under represented) cost savings due to avoiding the potential effects of
rework. If a BIM model had been used on the Fort Lyon project the Contract Modification
Order’s and RFI’s could possibly have been reduced, therefore decreasing overall project costs
by as much, if not more than $92,155 (total cost of Change Modification Orders). This
comparison Case Study suggests that BIM may be beneficial for many transportation
infrastructure projects, complex or simple by affecting associated costs of design development
through construction, and O & M. The findings presented here outline why similar organizations
would implement BIM due to alleviating possible issues that can be encountered by utilizing a 3
dimensional smart model. The research suggests that not only will you see possible positive ROI
after initial implementation, but also the ability to deliver complex projects in limited time

42
allotments is now feasible. For organizations to really benefit from BIM implementation it is
important to take on a select few handpicked projects and implement BIM to the full extent. By
approaching implementation in this fashion the organizations are able to take it slow and get it
right the first time by realizing any possible mistakes. This allows for the organization to
understand the correct processes involved and move forward with implementation throughout the
organization with a lessons learned approach.
Conclusions
The research documented two similar ABC bridge constructions with relatively similar
project characteristics including project delivery, construction type and transfer type. The
similarity of projects allowed analysis of the impact of BIM implementation (a first
implementation) using the metrics identified. This research found that although costs increased,
CMO’s and RFI’s decreased on the project that utilized BIM compared to the project that did not
utilize BIM. Specifically, Table 10 suggests that using BIM has decreased the number of RFIs
and CMOs relative to construction area (SF), cost ($), and average daily traffic, compared to
typical construction.
It is important to distinguish between the impact of BIM during its first implementation
and overtime. While this research analyzed a project that did not utilize BIM and compared it
one where BIM was implemented for the first time, it is possible to make some projections based
on research findings. Specifically, costs related to CMO’s decrease by 10% when BIM was used
(2% CMO related costs for super-structure documented) relative to the non-BIM project (12%
CMO related costs for super-structure documented). As a result, it is possible to provide data

43
which adds a level of precision to the BIM Implementation Learning Curve (see Figure 1.1) in
terms of costs related to capabilities. Figure 3.1 graphically represents data related to the impact
of BIM adoption for transportation projects as documented in this research.
Figure 1.5: BIM Implementation Learning curve (Current to Future Implementation)
The points in Figure 3.1 are derived from the costs presented in Table 4.5: Point (1)
represents cost per SQ FT for Fort Lyon Canal Bridge; Point(2) represents the negative impact of
a 38% cost increase per SQ FT for Pecos Street over I-70 Bridge and Point (3) is an estimated
future impact improvement based on the cost savings from reduced CMOs observed in the two
case study projects.
The primary benefit of the research is to suggest that through implementation organizations can
move along the BIM implementation learning curve recognizing incremental benefits from
implementation (see Figure 3.1). Finally, the underlying contribution of this research is that it
increases understanding for transportation organizations about the impacts of implementing BIM
during the construction phase of transportation asset management.
44
FUTURE RESEARCH
In the future there is a need to populate information about the difference through more case
studies. Specifically ones that
1) Address more of the metrics in cases where the projects are not as similar across
delivery, construction type and transfer. For example, state that difference in structural
complexity (# of expansion joints, length of continuous span etc.) may be of particular
interest because we theorize that BIM will add more value on the more complex projects.
2) Include projects that are not “first implementations” but 2nd
, 3rd
, etc. so that you can
further plot the curve of BIM implementation over time.
45
REFERENCE
Bennett, T. (2012, 03 1). BIM and the rise of infrastructure pops. RAI roads, Bridges, Railways,
Retrieved from http://www.rebuildingamericasinfrastructure.com/magazine-article-rai-march-
2012-
(Bennett, 2012)
Bentley (n.d.). aeco information management and project collaboration software. Retrieved
from http://www.bentley.com/en-US/Products/projectwise project team collaboration/
Bernstein, M. B., & Stephen, A. J. (2012). Addressing America. In H. M. Bernstein & E. Fitch
(Eds.), The Business Value of BIM for Infrastructure. Bedford, MA: McGraw-Hill Construction
Research & Analytics.
(Bernstein & Stephen, 2012)
Bridges and structures: Accelerated bridge construction. (14, August 13). Retrieved from
http://www.fhwa.dot.gov/bridge/abc/
Colorado Department of Transportation. (n.d.). Cmgc 101 construction manager/general
contractor delivery method. Retrieved from
http://www.google.com/url?sa=t&rct=j&q=&esrc=s&frm=1&source=web&cd=1&ved=0CCkQF
jAA&url=http://www.coloradodot.info/business/designsupport/innovative-contracting-and-
design-build/documents/cmgc-101-presentation-10242012&ei=mU11Us-
WF6KyyAHDwIGYDQ&usg=AFQjCNGE7MogWTQqlYwKpTpojJkr-y22zA
(Colorado Department of Transportation)

46
Colorado Department of Transportation. (2013, July 16). Pre bridge move technical workshop 7-
16-13 . Retrieved from http://www.coloradodot.info/projects/pecosoveri70/technical-
workshops/pre-bridge-move-technical-workshop-0716.pdf/view
(Colorado Department of Transportation, 2013)
Colorado Department of Transportation, (n.d.). Pecos street bridge over i-70 bridge replacement
project
Cagle, R. (2003). Infrastructure asset management: An emerging direction. AACE International
Transactions, 02(01), 1-6.
(Cagle, 2003)
DiBernardo, S. (2012). Integrated modeling systems for bridge asset management -. Structures
Congress 2012 ASCE 2012, 483-493. Retrieved from ascelibrary.org
(DiBernardo, 2012)
Hale, D., Gibson, E., Woolridge, R., & Stogner, C. (2008, May). Sustaining the nation's aging
infrastructure systems lessons learned applying an asset management framework. Alfred p. sloan
foundation industry studies 2008, Boston, Ma. Retrieved from http://web.mit.edu/is08/program
(Hale, Gibson, Woolridge & Stogner, 2008)
Hosseen, C., & Stanilewicz, M. (1990, 08). Act government's bridge information and
management system -bims. Proceedings 15th arrb conference, part 3, Crowthorne RG11 6AU,
Berkshire England.
(Hosseen & Stanilewicz, 1990)
47
http://www.solibri.com/ Accessed 12-4-12
Jones, S. (2012, 04 23). Rapid increase in use of building information modeling (BIM) for
infrastructure projects expected and leading to increased efficiency and lower costs-says new
McGraw-Hill construction
(Jones, 2012)
Lippy, J. (2013), CDOT Bridge Construction, In B. Fanning (Ed.) (Email questions and phone
Calls regarding CDOT Bridge Construction ed., pp. 1). Denver: Colorado State University.
Lapierre, A., & Cote, P. (n.d.). Using open web services for urban data management; a tested
resulting from ogc initiative for offering standard cad/gis/bim services. Unpublished manuscript,
Harvard University Graduate School of Design, Harvard University, Cambridge, Massachusetts.
(Lapierre & Cote)
Lwin, M. (2006). The important roles of bridge maintenance and management on transportation
safety and efficiency. Proceedings of the 3rd International Conference on Bridge Maintenance,
Safety and Management -Bridge Maintenance, Safety, Management, Life-Cycle Performance and
Cost, 47-51.
(Lwin, 2006)
Makelainen, T., Hyvarinen, J., & Peura, J. (2012). Bim practices and challenges framed - an
approach to systemic change management. Ework and ebusiness in architecture, engineering
and construction proceedings of the European Conference on Product and Process Modeling,
497-504.

48
(Makelainen, Hyvarinen & Peura, 2012)
Maurer, T. H. (2013). Pecos I-70 Bridge Project. In B. Fanning (Ed.) (Email questions and phone
Calls regarding Pecos I-70 Bridge project ed., pp. 5). Denver: Colorado State University.
Marzouk, M., & Abdel Aty, A. (2012). Maintaining subways infrastructures using bim.
Construction research congress 2012, West Lafayette, Indiana.
(Marzouk & Abdel Aty, 2012)
McGraw Hill. (2012). The business value of bim for infrastructure. In H. M. Bernstein, S. Jones,
M. Russo & D. Laquidara-Carr (Eds.), The Business Value of BIM for Infrastructure Addressing
Americas Infrastructure Challenges with Collaboration and Technology. Bedford, MA:
McGraw-Hill Construction Research & Analytics.
(McGraw Hill, 2012)
Meyer, M. (2010). Transportation asset management systems and climate change: Adaptive
systems management approach. Transportation research record, (2160), 12-20
(Meyer, 2010)
Midas civil integrated solution system for bridge and civil engineering . (2013, November 13).
Retrieved from http://en.midasuser.com/products/products.asp?nCat=352&idx=29133
("Midas civil integrated," 2013)
Mihindu, S., & Arayici, Y. (2009). Digital construction through bim systems will drive the re-
engineering of construction business practices. Manuscript submitted for publication, School of
Built Environment, University of Salford, Salford, United Kingdom.

49
(Mihindu & Arayici, 2009)
NAHB Research Center, Inc. , & Columbia Enterprises, Inc., U.S. Department of Housing and
Urban Development , Office of Policy Development and Research. (2005). construction cost
indices hud section 202 and 811 supportive housing programs . Retrieved from NAHB Research
Center, Inc. and Columbia Enterprises, Inc. website:
http://www.huduser.org/portal/publications/costindices.pdf
( NAHB Research Center, Inc. & Columbia Enterprises, Inc., 2005)
Rong, Y. H., Chao, H. L., Tsung, Y. T., & Hung, Y. C. (n.d.). The study of bim-based
infrastructure management system for Taiwan industrial parks. Unpublished manuscript,
Northwestern University, Northwestern University, Chicago,
(Rong, Chao, Tsung & Hung)
Sandoval, D. (2013). Rocky Ford Bridge Project. In B. Fanning (Ed.) (Email questions and
phone Calls regarding Rocky Ford Bridge project ed., pp. 5). Denver: Colorado State University.
Stratford, David, Tom Stevens, Mary Hamilton, and Alan Dray. "Strategic asset management
modeling of infrastructure assets." Engineering and Computational Mechanics. 163.EM2 (2009):
111-122. Print.
(Stratford, Stevens, Hamilton, and Dray 111-122).
50
Vessley, M. Colorado Department of Transportation, US Department of Transportation Federal
Highway Administration. (2009). Colorado department of transportation work plan for sep 14
(special experimental project) 14 construction manager at risk contract. Retrieved from website:
http://www.fhwa.dot.gov/programadmin/contracts/sep14co2009plan.cfm
(Vessley, 2009)
Ziess, G. (2012, 07 16). [Web log message]. Retrieved from
http://geospatial.blogs.com/geospatial/2012/07/using-bim-for-infrastructure-to-improve-urban-
aerial-and-underground-facility-records.html
(Ziess, 2012)