impacts of covid-19 on u.s. aquaculture, aquaponics, and
TRANSCRIPT

Impacts of COVID-19 on U.S. aquaculture, aquaponics, and allied businesses:
Quarter 2 Results
April 10, 2020 to June 29, 2020 survey
Authored by Jonathan van Senten, Assistant Professor and Extension Specialist Virginia Seafood AREC, Department of
Agricultural and Applied Economics, Center for Coastal Studies Affiliate Faculty, Virginia Tech; Matthew A. Smith,
Extension Specialist, The Ohio State University; Carole R. Engle, Engle-Stone Aquatic$, LLC, Adjunct Faculty, Virginia
Seafood AREC, Virginia Tech; Charles Clark, Virginia Seafood AREC, Virginia Tech; Shannon Fluharty, Department of
Agricultural and Applied Economics, Virginia Tech; and Michael H. Schwarz, Virginia Seafood AREC
Introduction In response to the coronavirus (COVID-19) disease
pandemic, a collaborative initiative was launched by
The Ohio State University, Virginia Tech, and
Engle-Stone Aquatic$, LLC to assess the impacts of
the pandemic on U.S. aquaculture, aquaponics, and
allied industry. Results from the first quarter survey
(AAEC-218NP) demonstrated that the U.S.
aquaculture industry has been impacted by the
coronavirus (COVID-19) disease pandemic; with
90% of respondents reporting that their farm or
business had been affected by the pandemic in some
way. The Q1 impacts reported by respondents can be
broadly summarized as the disruption of traditional
marketing channels, challenges with labor, and
challenges with production. Over the course of the
first quarter of 2020, the U.S. government developed
and implemented several emergency relief measures,
in an effort to assist small businesses and
individuals. The Q2 survey asked specifically about
these relief and assistance programs, as well as
questions on adaptations and changes being
implemented by farms and businesses in response to
the ongoing challenges. This fact sheet summarizes
the Q2 results of this study, covering the period from
April 10th to June 29th, 2020
Methods Detailed methods for this study and an explanation
of the survey activities can be viewed in the Q1
report (AAEC-218NP). The data for this study was
collected through an online survey, administered
through Qualtrics. Using an online platform ensured
that the survey instrument could be rapidly and
widely distributed, to include as much of the U.S.
aquaculture industry as possible. It should be noted
that there was no sampling methodology employed,
which means that respondents self-selected for
participation in the study. As a result, it is possible
that responses are skewed towards those farms and
businesses that have been more affected by the
coronavirus (COVID-19) disease pandemic. The Q2
survey instrument underwent several adjustments,
based on information obtained from the Q1 survey
responses. In addition, the Q2 survey also included
new questions on the government developed relief
programs implemented in response to the pandemic
and how helpful these have been to aquaculture,
aquaponics, and allied businesses. Questions were
also added to assess the effects of the pandemic on
prices for aquaculture products, in an effort to gather
data required for the USDA CFAP (Coronavirus
Food Assistance Program). Last but not least, the Q2
survey also incorporated new questions on
adaptations and changes in marketing channels
attempted by respondents. The second quarter
survey was launched on June 29th, 2020 and closed
on July 17h, 2020. Responses to the survey were
exported from Qualtrics and processed using
Microsoft Excel.
Virginia Cooperative Extension 2
Results
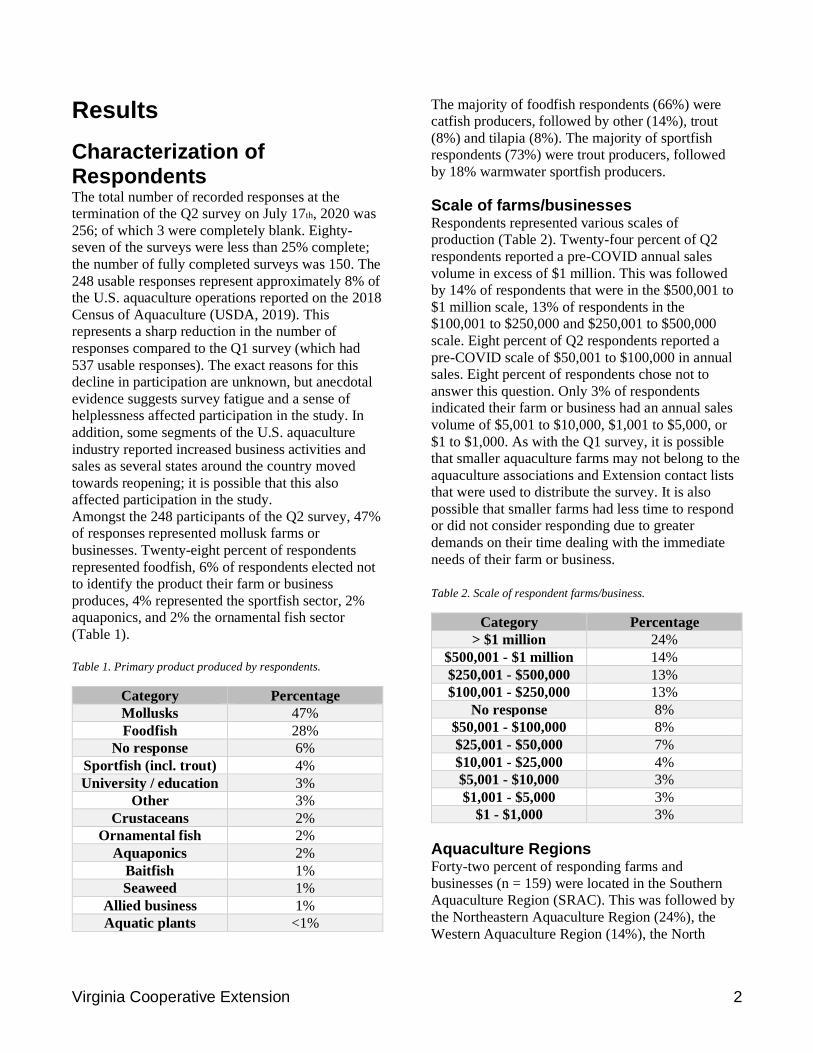
Characterization of Respondents The total number of recorded responses at the
termination of the Q2 survey on July 17th, 2020 was
256; of which 3 were completely blank. Eighty-
seven of the surveys were less than 25% complete;
the number of fully completed surveys was 150. The
248 usable responses represent approximately 8% of
the U.S. aquaculture operations reported on the 2018
Census of Aquaculture (USDA, 2019). This
represents a sharp reduction in the number of
responses compared to the Q1 survey (which had
537 usable responses). The exact reasons for this
decline in participation are unknown, but anecdotal
evidence suggests survey fatigue and a sense of
helplessness affected participation in the study. In
addition, some segments of the U.S. aquaculture
industry reported increased business activities and
sales as several states around the country moved
towards reopening; it is possible that this also
affected participation in the study.
Amongst the 248 participants of the Q2 survey, 47%
of responses represented mollusk farms or
businesses. Twenty-eight percent of respondents
represented foodfish, 6% of respondents elected not
to identify the product their farm or business
produces, 4% represented the sportfish sector, 2%
aquaponics, and 2% the ornamental fish sector
(Table 1).
Table 1. Primary product produced by respondents.
Category Percentage
Mollusks 47%
Foodfish 28%
No response 6%
Sportfish (incl. trout) 4%
University / education 3%
Other 3%
Crustaceans 2%
Ornamental fish 2%
Aquaponics 2%
Baitfish 1%
Seaweed 1%
Allied business 1%
Aquatic plants <1%
The majority of foodfish respondents (66%) were
catfish producers, followed by other (14%), trout
(8%) and tilapia (8%). The majority of sportfish
respondents (73%) were trout producers, followed
by 18% warmwater sportfish producers.
Scale of farms/businesses Respondents represented various scales of
production (Table 2). Twenty-four percent of Q2
respondents reported a pre-COVID annual sales
volume in excess of $1 million. This was followed
by 14% of respondents that were in the $500,001 to
$1 million scale, 13% of respondents in the
$100,001 to $250,000 and $250,001 to $500,000
scale. Eight percent of Q2 respondents reported a
pre-COVID scale of $50,001 to $100,000 in annual
sales. Eight percent of respondents chose not to
answer this question. Only 3% of respondents
indicated their farm or business had an annual sales
volume of $5,001 to $10,000, $1,001 to $5,000, or
$1 to $1,000. As with the Q1 survey, it is possible
that smaller aquaculture farms may not belong to the
aquaculture associations and Extension contact lists
that were used to distribute the survey. It is also
possible that smaller farms had less time to respond
or did not consider responding due to greater
demands on their time dealing with the immediate
needs of their farm or business.
Table 2. Scale of respondent farms/business.
Category Percentage
> $1 million 24%
$500,001 - $1 million 14%
$250,001 - $500,000 13%
$100,001 - $250,000 13%
No response 8%
$50,001 - $100,000 8%
$25,001 - $50,000 7%
$10,001 - $25,000 4%
$5,001 - $10,000 3%
$1,001 - $5,000 3%
$1 - $1,000 3%
Aquaculture Regions Forty-two percent of responding farms and
businesses (n = 159) were located in the Southern
Aquaculture Region (SRAC). This was followed by
the Northeastern Aquaculture Region (24%), the
Western Aquaculture Region (14%), the North
Virginia Cooperative Extension 3
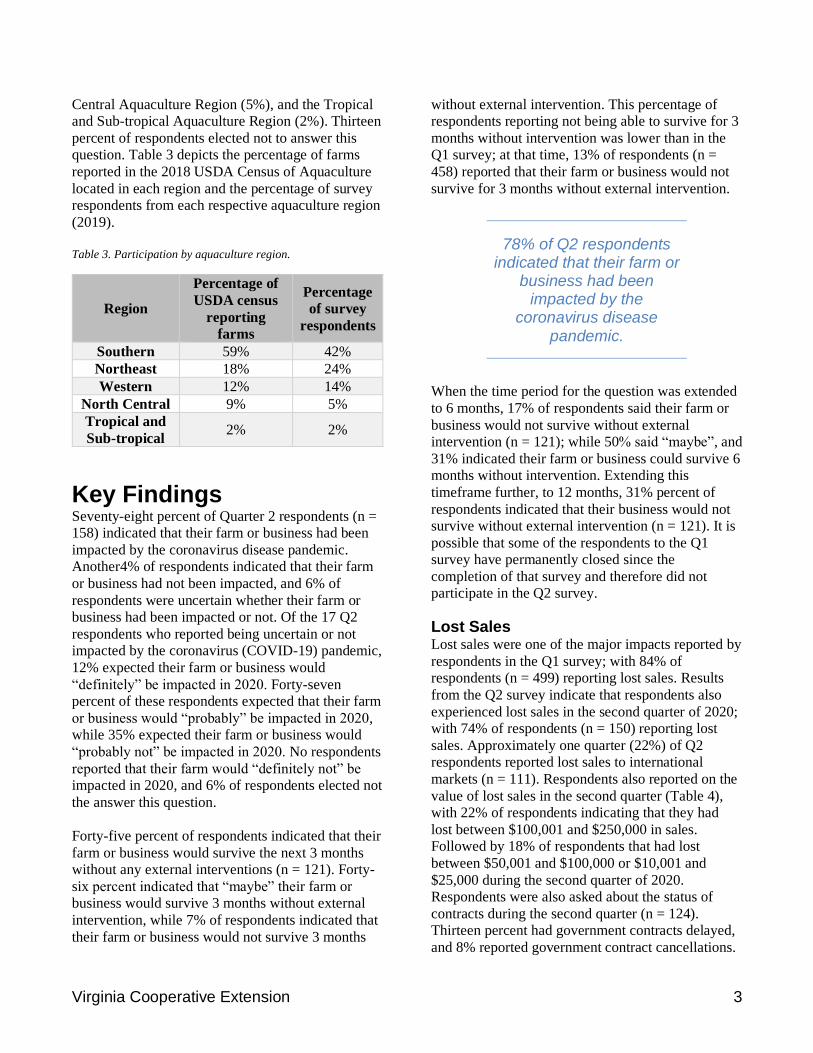
Central Aquaculture Region (5%), and the Tropical
and Sub-tropical Aquaculture Region (2%). Thirteen
percent of respondents elected not to answer this
question. Table 3 depicts the percentage of farms
reported in the 2018 USDA Census of Aquaculture
located in each region and the percentage of survey
respondents from each respective aquaculture region
(2019).
Table 3. Participation by aquaculture region.
Region
Percentage of
USDA census
reporting
farms
Percentage
of survey
respondents
Southern 59% 42%
Northeast 18% 24%
Western 12% 14%
North Central 9% 5%
Tropical and
Sub-tropical 2% 2%
Key Findings Seventy-eight percent of Quarter 2 respondents (n =
158) indicated that their farm or business had been
impacted by the coronavirus disease pandemic.
Another4% of respondents indicated that their farm
or business had not been impacted, and 6% of
respondents were uncertain whether their farm or
business had been impacted or not. Of the 17 Q2
respondents who reported being uncertain or not
impacted by the coronavirus (COVID-19) pandemic,
12% expected their farm or business would
“definitely” be impacted in 2020. Forty-seven
percent of these respondents expected that their farm
or business would “probably” be impacted in 2020,
while 35% expected their farm or business would
“probably not” be impacted in 2020. No respondents
reported that their farm would “definitely not” be
impacted in 2020, and 6% of respondents elected not
the answer this question.
Forty-five percent of respondents indicated that their
farm or business would survive the next 3 months
without any external interventions (n = 121). Forty-
six percent indicated that “maybe” their farm or
business would survive 3 months without external
intervention, while 7% of respondents indicated that
their farm or business would not survive 3 months
without external intervention. This percentage of
respondents reporting not being able to survive for 3
months without intervention was lower than in the
Q1 survey; at that time, 13% of respondents (n =
458) reported that their farm or business would not
survive for 3 months without external intervention.
78% of Q2 respondents indicated that their farm or
business had been impacted by the
coronavirus disease pandemic.
When the time period for the question was extended
to 6 months, 17% of respondents said their farm or
business would not survive without external
intervention (n = 121); while 50% said “maybe”, and
31% indicated their farm or business could survive 6
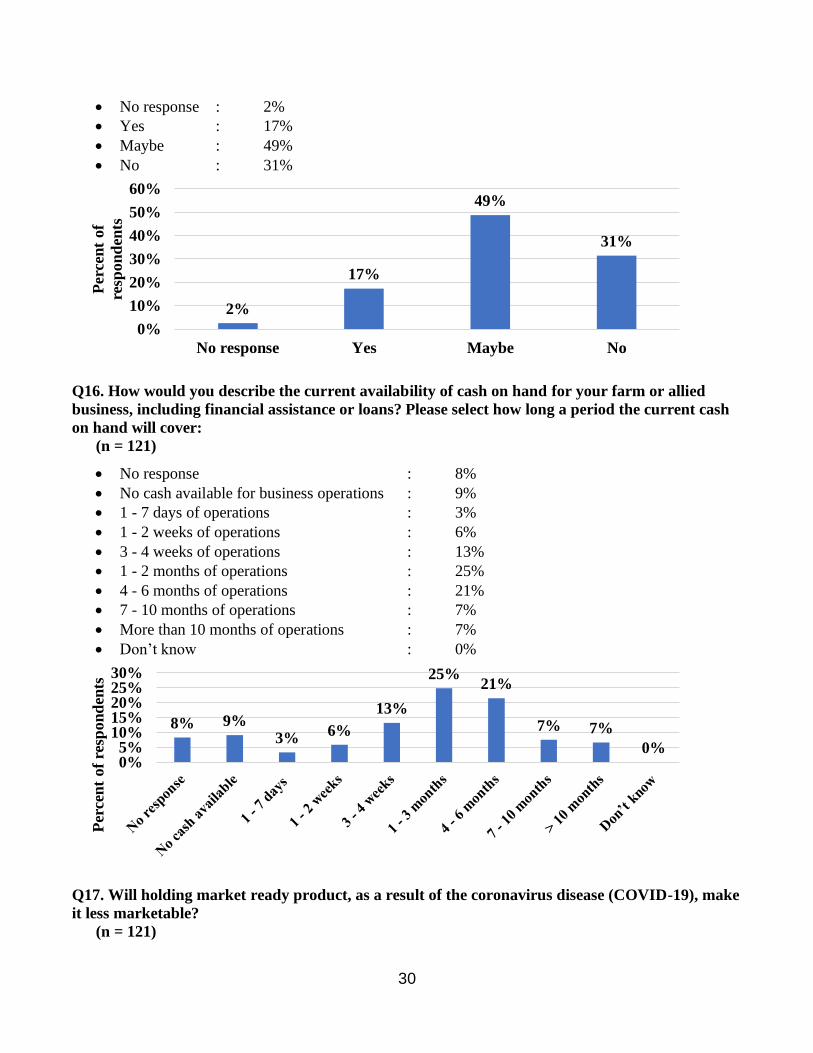
months without intervention. Extending this
timeframe further, to 12 months, 31% percent of
respondents indicated that their business would not
survive without external intervention (n = 121). It is
possible that some of the respondents to the Q1
survey have permanently closed since the
completion of that survey and therefore did not
participate in the Q2 survey.
Lost Sales Lost sales were one of the major impacts reported by
respondents in the Q1 survey; with 84% of
respondents (n = 499) reporting lost sales. Results
from the Q2 survey indicate that respondents also
experienced lost sales in the second quarter of 2020;
with 74% of respondents (n = 150) reporting lost
sales. Approximately one quarter (22%) of Q2
respondents reported lost sales to international
markets (n = 111). Respondents also reported on the
value of lost sales in the second quarter (Table 4),
with 22% of respondents indicating that they had
lost between $100,001 and $250,000 in sales.
Followed by 18% of respondents that had lost
between $50,001 and $100,000 or $10,001 and
$25,000 during the second quarter of 2020.
Respondents were also asked about the status of
contracts during the second quarter (n = 124).
Thirteen percent had government contracts delayed,
and 8% reported government contract cancellations.

Virginia Cooperative Extension 4
Ten percent of Q2 respondents indicated that their
farm or business had made new government (state or
federal) contracts during the second quarter; with
2% reporting government contracts re-instated. As
for private contracts, 43% of respondents indicated
that their farm or business had private contracts
cancelled during Q2. This was followed by 33% that
had contracts delayed, and only 2% that reported
new private contracts or private contracts re-instated.
Table 4. Value of lost sales during Q2
Category Percentage
$100,001 - $250,000 22%
$10,001 - $25,000 18%
$50,001 - $100,000 18%
$25,001 - $50,000 11%
$500,001 - $ 1 million 8%
$1,001 - $5,000 7%
$250,001 - $500,000 6%
$5,001 - $10,000 3%
Greater than $1 million 3%
Cannot estimate at this time 3%
No response 1%
$1 - $1,000 0%
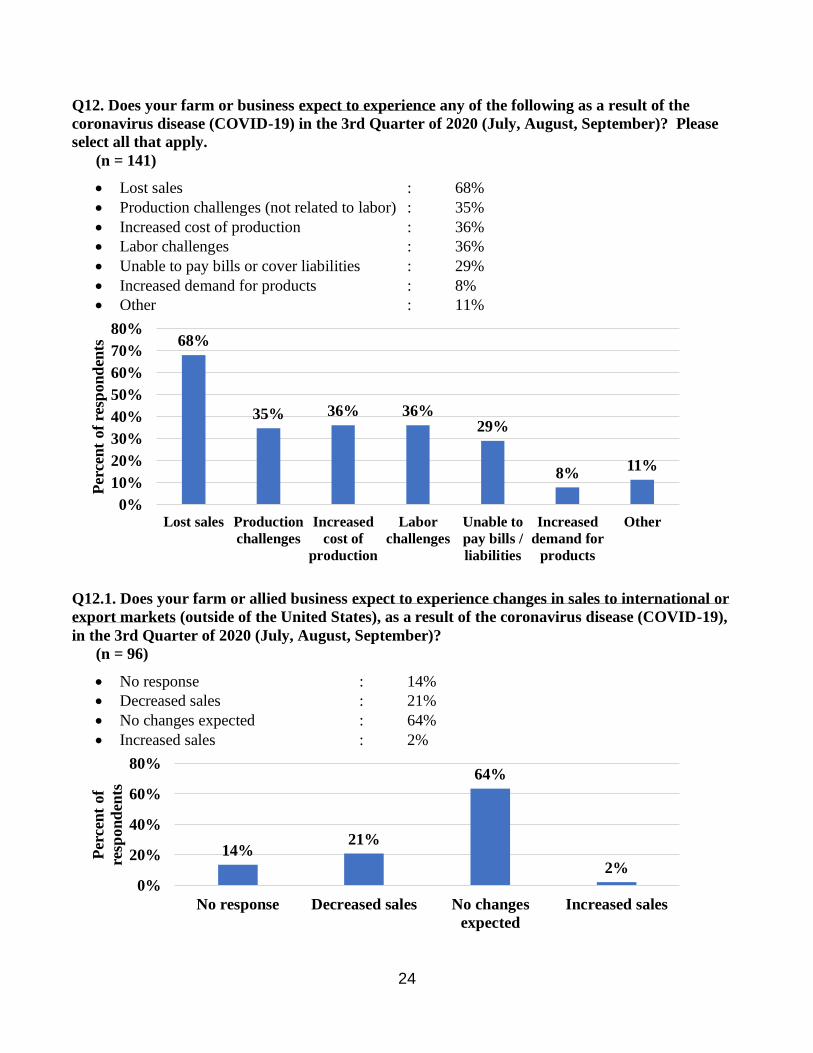
Sixty-eight percent of Q2 respondents indicated that
they expected to experience additional lost sales in
Q3 of 2020 (n = 141), with 21% of respondents
expecting to experience decreased sales to
international markets (n = 96).
74% of Q2 respondents reported that their farm or business had experienced
lost sales due to the coronavirus disease
pandemic.
A new question for the Q2 survey asked respondents
about the availability of cash on hand to cover
operating expenses. A quarter of respondents (25%),
indicated that they have sufficient cash on hand to
cover 1 to 3 months of operations (n = 121). This
was followed by 21% of respondents who indicated
having enough cash on hand for 4 to 6 months of
operations. Nine percent of respondents to the Q2
survey said they had no cash on hand for business
operations. While 22% of respondents reported less
than 1 month of cash on hand. It is worth noting that
the Q2 survey was open for a period of 3 weeks for
data collection, meaning that respondents who
completed the survey shortly after it was distributed
may have already exhausted their cash on hand by
the time this fact sheet was prepared.
Labor Fifty percent of Q2 survey respondents reported that
their farm or business had experienced no change in
employment during the second quarter (n = 123).
Twenty-seven percent of respondents had terminated
employees during the second quarter; while 15% of
respondents reported that their farm or business
would “have to soon”. Five percent of respondents
had hired additional employees. Respondents were
asked about the number of employees that had been
terminated during Q2, with the majority (64%)
indicating that between 1 and 3 employees had been
let go (n = 33). Twenty-four percent of respondents
indicated the number of employees terminated
during the second quarter to be between 4 and 6.
Although only 6% of respondents indicated that
greater than 20 employees were terminated, the
maximum number of employees terminated by a
single respondent was 400.
Respondents were also asked how long before their
farm or business had to make a decision about
whether to terminate employees or not, the majority
of respondents (61%) indicated a period between 4
and 6 weeks (n = 18). Furthermore, 6% of Q2
respondents indicated that they had less than a week
to make a decision about terminating employees.
Another 6% of respondents reported having more
than 10 weeks to make a decision about laying off
employees. Respondents were then asked how many
employees the farm or business would have to lay
off (n = 18), the majority of respondents (83%) indicated between 1 and 3 employees. Of those
respondents that hired additional employees during
the second quarter (n = 6), 83% hired between 1 and
3 employees, with the remaining 17% hiring
between 4 and 6 employees.
Survey respondents were also asked about
employees missing work due to the coronavirus (COVID-19) disease pandemic. Sixty-one percent of
respondents indicated that their farm or business did
not have any employees miss work (n = 123), while
Virginia Cooperative Extension 5
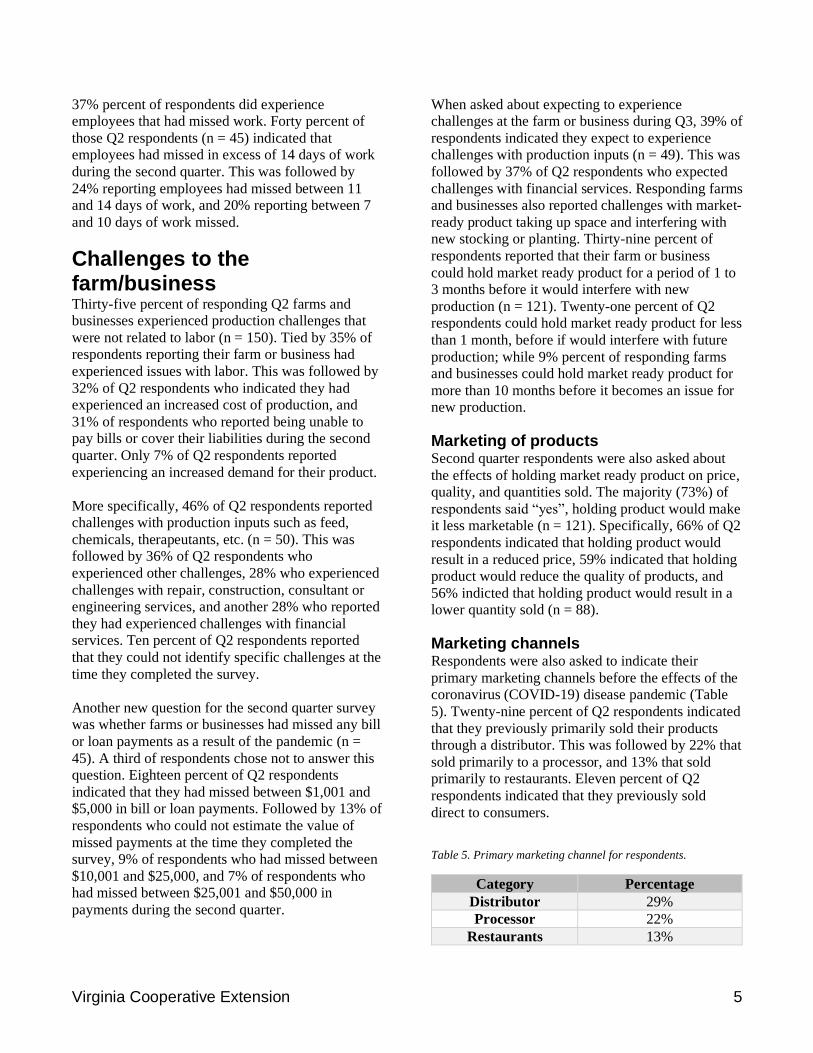
37% percent of respondents did experience
employees that had missed work. Forty percent of
those Q2 respondents (n = 45) indicated that
employees had missed in excess of 14 days of work
during the second quarter. This was followed by
24% reporting employees had missed between 11
and 14 days of work, and 20% reporting between 7
and 10 days of work missed.
Challenges to the farm/business Thirty-five percent of responding Q2 farms and
businesses experienced production challenges that
were not related to labor (n = 150). Tied by 35% of
respondents reporting their farm or business had
experienced issues with labor. This was followed by
32% of Q2 respondents who indicated they had
experienced an increased cost of production, and
31% of respondents who reported being unable to
pay bills or cover their liabilities during the second
quarter. Only 7% of Q2 respondents reported
experiencing an increased demand for their product.
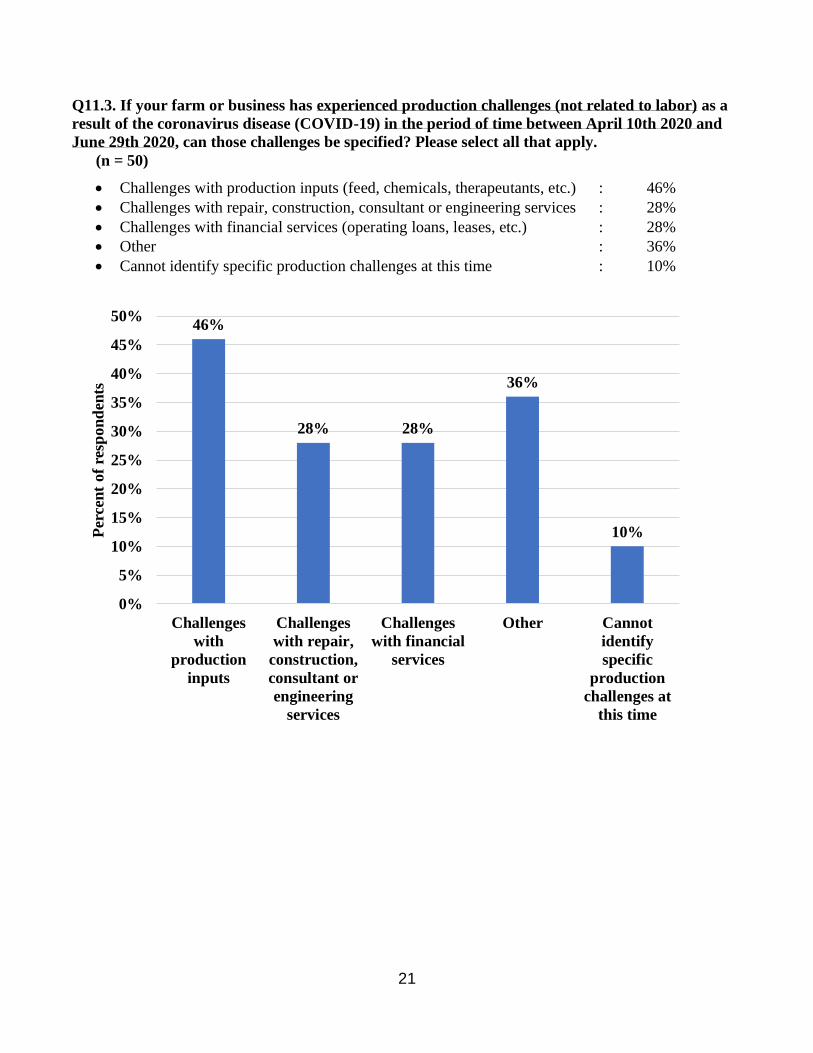
More specifically, 46% of Q2 respondents reported
challenges with production inputs such as feed,
chemicals, therapeutants, etc. (n = 50). This was
followed by 36% of Q2 respondents who
experienced other challenges, 28% who experienced
challenges with repair, construction, consultant or
engineering services, and another 28% who reported
they had experienced challenges with financial
services. Ten percent of Q2 respondents reported
that they could not identify specific challenges at the
time they completed the survey.
Another new question for the second quarter survey
was whether farms or businesses had missed any bill
or loan payments as a result of the pandemic (n =
45). A third of respondents chose not to answer this
question. Eighteen percent of Q2 respondents
indicated that they had missed between $1,001 and
$5,000 in bill or loan payments. Followed by 13% of
respondents who could not estimate the value of
missed payments at the time they completed the
survey, 9% of respondents who had missed between
$10,001 and $25,000, and 7% of respondents who
had missed between $25,001 and $50,000 in
payments during the second quarter.
When asked about expecting to experience
challenges at the farm or business during Q3, 39% of
respondents indicated they expect to experience
challenges with production inputs (n = 49). This was
followed by 37% of Q2 respondents who expected
challenges with financial services. Responding farms
and businesses also reported challenges with market-
ready product taking up space and interfering with
new stocking or planting. Thirty-nine percent of
respondents reported that their farm or business
could hold market ready product for a period of 1 to
3 months before it would interfere with new
production (n = 121). Twenty-one percent of Q2
respondents could hold market ready product for less
than 1 month, before if would interfere with future
production; while 9% percent of responding farms
and businesses could hold market ready product for
more than 10 months before it becomes an issue for
new production.
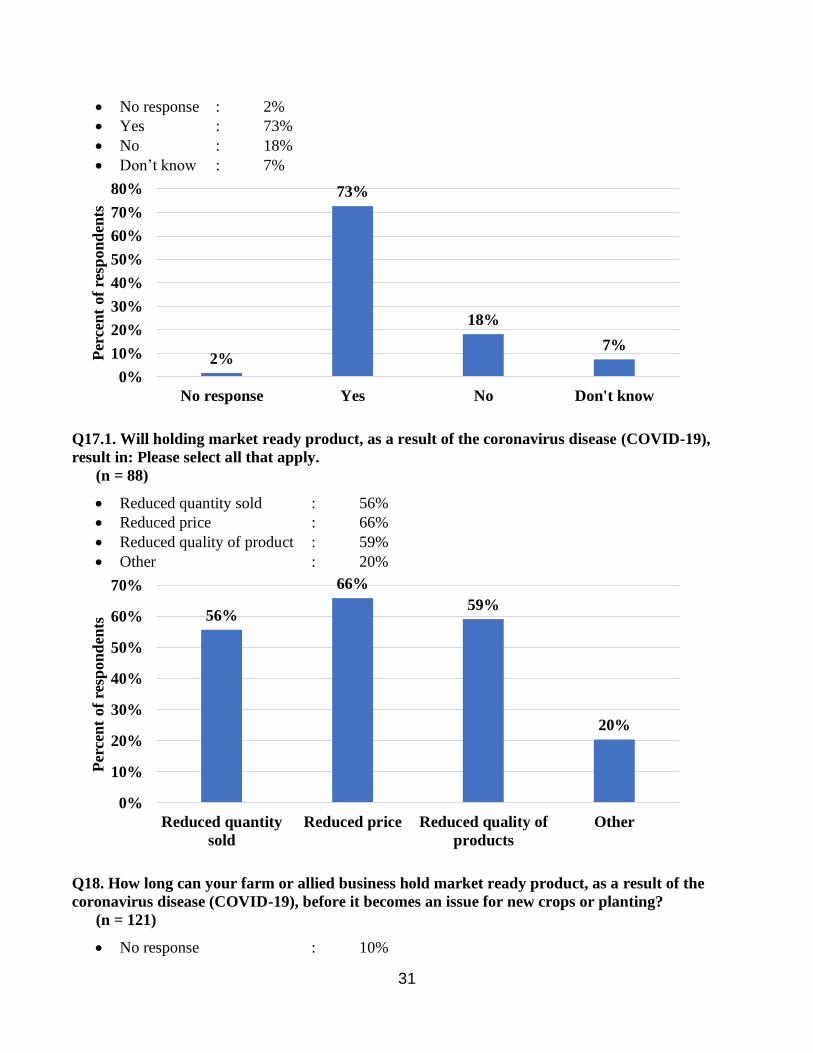
Marketing of products Second quarter respondents were also asked about
the effects of holding market ready product on price,
quality, and quantities sold. The majority (73%) of
respondents said “yes”, holding product would make
it less marketable (n = 121). Specifically, 66% of Q2
respondents indicated that holding product would
result in a reduced price, 59% indicated that holding
product would reduce the quality of products, and
56% indicted that holding product would result in a
lower quantity sold (n = 88).
Marketing channels Respondents were also asked to indicate their
primary marketing channels before the effects of the
coronavirus (COVID-19) disease pandemic (Table
5). Twenty-nine percent of Q2 respondents indicated
that they previously primarily sold their products
through a distributor. This was followed by 22% that
sold primarily to a processor, and 13% that sold
primarily to restaurants. Eleven percent of Q2
respondents indicated that they previously sold
direct to consumers.
Table 5. Primary marketing channel for respondents.
Category Percentage
Distributor 29%
Processor 22%
Restaurants 13%

Virginia Cooperative Extension 6
Direct to consumer 11%
No response 11%
Other 8%
Other aquaculture
/aquaponics 4%
Grocery store /
supermarket 1%
Respondents were also asked about adaptations or
changes in their marketing channel in response to the
pandemic, to which 34% of respondents said “yes”
they had implemented or attempted to implement a
new marketing channel (n = 137). Forty-five percent
of respondents said that they had not implemented or
attempted to implement a new marketing channel
during the second quarter of 2020. Of those
respondents who had implemented or attempted to
implement direct to consumer sales (n = 27), 70%
had used online sales. This was followed by 59%
who had implemented “curbside pickup”, and 44%
who had implemented home delivery services.
Relief and assistance programs As an important new addition to the Q2 survey,
respondents were asked about the various assistance
and relief programs that had been announced during
Q2 of 2020. Respondents were asked to identify to
which programs they had applied, whether they had
received the requested support, and whether that
support had been helpful to their farm or business.
Nearly half (48%) of Q2 respondents (n = 141) had
applied for the Paycheck Protection Program (PPP).
This was followed by 33% of respondents who had
applied for Economic Injury Disaster Loans (EIDL),
19% who had applied for a personal bank loan or
line of credit, 18% who had applied for a Small
Business Administration (SBA) loan, and 11% who
had applied for unemployment benefits. Thirteen
percent of Q2 respondents reported that their farm or
business had not applied for any assistance programs
during the second quarter.
As for having received the support that was
requested (n = 100), 9% of Q2 respondents indicated
that they had applied but not yet received assistance,
while 5% reported having been declined or denied
assistance. Ninety percent of Q2 respondents who
had applied for a PPP loan had received the
requested support. Table 6 breaks down the various
support programs and the percent of Q2 respondents
that reported receiving that support.
The majority of respondents (56%) indicated that
Federal assistance would increase the likelihood for
their farm or business to survive (n = 140). This was
followed by 33% of respondents who also selected
State assistance as a mechanism that would increase
their likelihood of survival.
Thirty-four percent of Q2 respondents indicated that
specialty crop insurance would be helpful to them (n
= 139). Twenty-six percent indicated that waiving or
delay of State fees would be helpful, and 19%
indicated that assistance with identifying new
markets would be helpful.
Table 6. Assistance received by Q2 respondents
Category (N = ) Percentage
Private bank loans / line of
credit 27 67%
Small Business
Administration loans (SBA) 26 62%
Paycheck Protection Program
loans (PPP) 68 90%
Economic Injury Disaster
Loans (EIDL) 46 67%
Unemployment benefits 15 87%
Other Federal program 5 60%
Other State program 4 50%
Other Local program 1 100%
Farm or business has applied
but not yet received 100 9%
Farm or business applications
have been denied / declined 100 5%
Discussion and Conclusion Results of the Q2 survey demonstrate that U.S.
aquaculture, aquaponics, and allied businesses are
still experiencing negative impacts from the
coronavirus (COVID-19) disease pandemic.
Although the total number of respondents for the Q2
survey was lower, many of the responses indicate a
similar trend as was observed in the Q1 results.
While many Q2 respondents have been able to
obtain external assistance and relief, there are still
several impacts that will have longer term
consequences for the industry. These include the

Virginia Cooperative Extension 7
continued disruption of traditional marketing
channels, increasing costs of production, challenges
obtaining services and inputs, challenges with cash
on hand to cover operating expenses, and missed or
delayed loan and bill payments. Comments provided
by respondents reveal that some producers have
ceased all harvest activity or preparations for future
production. Lost revenue continues to be a
significant challenge for respondents, with 74% of
Q2 respondents reporting lost sales. Challenges
reported with labor and production, also reinforce
Q1 results in suggesting negative impacts on future
supply of aquaculture and aquaponics products. The
key points from the Quarter 2 survey results are:
• 78% had been impacted by COVID-19 during Q2
• 43% had had private orders/contracts cancelled
• 27% had terminated employees
• 74% had experienced lost sales
• 9% had no cash available to cover operating expenses
• 22% had less than 1 month of cash available to cover operating expenses
• 45% would survive 3 months without external intervention
• 48% applied for the Paycheck Protection Program, 33% for an Economic Injury Disaster Loan, 19% for a personal bank loan or line of credit, and 11% for unemployment benefits.
• 56% indicated that Federal assistance would help their farm or business to survive, and 33% indicated that state assistance would help their farm or business to survive.
References
National Marine Fisheries Service. 2018. “Fisheries
of the United States, 2017”. U.S. Department of
Commerce, NOAA Current Fishery Statistics No.
2017 Available at:
https://www.fisheries.noaa.gov/resource/docume
nt/fisheries-united-states-2017-report. (last
accessed, April 12th, 2020)
United States Department of Agriculture. 2019.
2018 Census of Aquaculture. National
Agricultural Statistics Service, USDA,
Washington, District of Columbia, USA.
Accessed April 2020 at:
https://www.nass.usda.gov/Surveys/Guide_to_N
ASS_Surveys/Census_of_Aquaculture/index.php.
(last accessed, April 12th, 2020)
van Senten, J., Smith, M.A., and Engle, C.R. 2020.
Impacts of COVID-19 on U.S. aquaculture,
aquaponics, and allied businesses: Quarter 1
Results. AAEC-218NP. Available at:
https://www.pubs.ext.vt.edu/content/dam/pubs_e
xt_vt_edu/AAEC/aaec-218/AAEC-218.pdf
Additional Resources
van Senten, J., C.R. Engle, and M. Smith. 2020.
Impacts of COVID-19 on U.S. aquaculture,
aquaponics, and allied businesses. Journal of the
World Aquaculture Society 51(3):571-573.
A summary of all Quarter 2 survey results may be
found in the Appendix document to this fact sheet,
titled: “Summary of COVID-19 impacts on U.S.
aquaculture, aquaponics, and allied businesses:
Quarter 2 Results”.
All study results and disaggregated reports are/will
be published online and available at:
https://www.arec.vaes.vt.edu/arec/virginia-
seafood/research/Impacts_of_COVID19.html

Virginia Cooperative Extension 8
Indicia and Publication Number Visit Virginia Cooperative Extension: ext.vt.edu
Virginia Cooperative Extension programs and employment are open to all,
regardless of age, color, disability, gender, gender identity, gender expression,
national origin, political affiliation, race, religion, sexual orientation, genetic
information, veteran status, or any other basis protected by law. An equal opportunity/affirmative action employer. Issued in furtherance of Cooperative
Extension work, Virginia Polytechnic Institute and State University, Virginia
State University, and the U.S. Department of Agriculture cooperating. Edwin
J. Jones, Director, Virginia Cooperative Extension, Virginia Tech,
Blacksburg; M. Ray McKinnie, Administrator, 1890 Extension Program, Virginia State University, Petersburg.
2020 AAEC-228NP VSG-20-10

Appendix
Summary of COVID-19 impacts on U.S. aquaculture,
aquaponics, and allied businesses:
Quarter 2 Results
Jonathan van Senten, Virginia Tech
Matthew A. Smith, The Ohio State University
Carole R. Engle, Engle-Stone Aquatic$, LLC, Virginia Tech
Charles Clark, Virginia Tech
Shannon Fluharty, Virginia Tech
Michael H. Schwarz, Virginia Tech

2
Contents
Q1. What is the primary product that your farm or allied business produces? ............................................. 6
Q1.1. Please indicate which is the major species of foodfish raised by your farm or business: ................... 7
Q1.2 Please indicate which is the major species of sportfish raised by your farm or business: ................... 7
Q2. Please indicate the scale of your farm or business by annual sales volume before the effects of coronavirus
disease (COVID-19):..................................................................................................................................... 7
Q3. Please provide the average price and approximate inventory of the primary product (market-sized) on your
farm or business for the following periods of time: ...................................................................................... 9
Q3.1. Please provide the volume of the primary product (market-sized) sold by your farm at the market price and
the volume sold at a reduced price due to being out-of-size for the following periods of time:................... 9
Q4. In which USDA defined Aquaculture Region is your farm or business located? ................................ 10
Q5. Has your farm or allied business been impacted, either positively or negatively, by the coronavirus disease
(COVID-19) in the period of time between April 10th 2020 and June 29th 2020? .................................... 11
Q5.1. Does your farm or allied business expect to be affected, either positively or negatively, by the coronavirus
disease (COVID-19) in 2020? ..................................................................................................................... 11
Q6. Have there been changes in government (state or federal) contracts in the period of time between April 10th
2020 and June 29th 2020 because of the coronavirus disease (COVID-19)? ............................................. 12
Q7. Have there been changes in private contracts in the period of time between April 10th 2020 and June 29th
2020 because of the coronavirus disease (COVID-19)? ............................................................................. 12
Q8. Please indicate what types of changes in employment have occurred in the period of time between April 10th
2020 and June 29th 2020 due to the coronavirus disease (COVID-19)? .................................................... 13
Q8.1. Are any of the employees that your farm or business had to, or will have to, lay off due to the coronavirus
disease (COVID-19) designated as "Short-Time" or "Shared-Work" employees?..................................... 13
Q8.2. How many employees has your farm or business had to lay off in the period of time between April 10th
2020 and June 29th 2020 in response to the coronavirus disease (COVID-19)? ........................................ 14
Q8.3. How many weeks before your farm or business will have to make a decision to lay off employees, in
response to the coronavirus disease (COVID-19)? ..................................................................................... 14
Q8.4. How many employees do you estimate your farm or business will have to lay off in response to the
coronavirus disease (COVID-19)? .............................................................................................................. 15
Q8.5 How many additional employees has your farm or allied business hired in the period of time between April
10th 2020 and June 29th 2020 in response to the coronavirus disease (COVID-19)?................................ 15
Q9. Has your farm or business had any employees miss work due to the coronavirus disease (COVID-19) in the
period of time between April 10th 2020 and June 29th 2020? ................................................................... 16
Q9.1. In total, approximately how many days have any employees in your farm or business missed work due to
the coronavirus disease (COVID-19) in the period of time between April 10th 2020 and June 29th 2020?16
Q10. Does your farm or business make use of H2A or H2B workers? ...................................................... 17
Q10.1. Has your farm or business been able to secure H2A and H2B workers during the coronavirus disease
(COVID-19) pandemic in the period of time between April 10th 2020 and June 29th 2020? ................... 17
Q10.2. Is your farm or business currently at risk of losing H2A or H2B workers due to the coronavirus disease
(COVID-19) pandemic? .............................................................................................................................. 18

3
Q11. Has your farm or business experienced any of the following as a result of the coronavirus disease (COVID-
19) in in the period of time between April 10th 2020 and June 29th 2020? Please select all that apply. ... 18
Q11.1. Has your farm or business experienced lost sales to international or export markets (outside of the United
States), as a result of the coronavirus disease (COVID-19) in the period of time between April 10th 2020 and June
29th 2020? ................................................................................................................................................... 19
Q11.2. If your farm or business has experienced lost sales as a result of the coronavirus disease (COVID-19) in
the period of time between April 10th 2020 and June 29th 2020? Please estimate the value of lost sales: 20
Q11.3. If your farm or business has experienced production challenges (not related to labor) as a result of the
coronavirus disease (COVID-19) in the period of time between April 10th 2020 and June 29th 2020, can those
challenges be specified? Please select all that apply. .................................................................................. 21
Q11.6. If your farm or business has experienced increased demand for products as a result of the coronavirus
disease (COVID-19) in the period of time between April 10th 2020 and June 29th 2020? Please estimate the value
of those effects on sales:.............................................................................................................................. 22
Q11.8. If your farm or allied business has experienced missed bill or loan payments as a result of the coronavirus
disease (COVID-19) in the period of time between April 10th 2020 and June 29th 2020? Please estimate the value
of those missed payments:........................................................................................................................... 23
Q12. Does your farm or business expect to experience any of the following as a result of the coronavirus disease
(COVID-19) in the 3rd Quarter of 2020 (July, August, September)? Please select all that apply. ........... 24
Q12.1. Does your farm or allied business expect to experience changes in sales to international or export markets
(outside of the United States), as a result of the coronavirus disease (COVID-19), in the 3rd Quarter of 2020 (July,
August, September)? ................................................................................................................................... 24
Q12.2. Does your farm or business expect to experience lost sales as a result of the coronavirus disease (COVID-
19) in the 3rd Quarter of 2020 (July, August, September)? Please estimate the value of lost sales: .......... 25
Q12.3. Does your farm or business expect to experience production challenges (not related to labor) as a result of
the coronavirus disease (COVID-19) in the 3rd Quarter of 2020 (July, August, September), can those challenges
be specified? Please select all that apply. .................................................................................................... 26
Q12.6. Does your farm or business expect to experience increased demand for products as a result of the
coronavirus disease (COVID-19) in the 3rd Quarter of 2020 (July, August, September)? Please estimate the value
of those effects on sales:.............................................................................................................................. 27
Q12.8. If your farm or allied business expects to miss bill or loan payments as a result of the coronavirus disease
(COVID-19) in the 3rd Quarter of 2020 (July, August, September)? Please estimate the value of those missed
payments: .................................................................................................................................................... 28
Q13. Without external intervention (for example, governmental assistance), will your farm or business survive in
the next 3 (three) months? ........................................................................................................................... 29
Q14. Without external intervention (for example, governmental assistance), will your farm or business survive in
the next 6 (six) months? .............................................................................................................................. 29
Q15. Without external intervention (for example, governmental assistance), will your farm or business survive in
the next 12 (twelve) months? ...................................................................................................................... 29
Q16. How would you describe the current availability of cash on hand for your farm or allied business, including
financial assistance or loans? Please select how long a period the current cash on hand will cover: ......... 30
Q17. Will holding market ready product, as a result of the coronavirus disease (COVID-19), make it less
marketable? ................................................................................................................................................. 30
Q17.1. Will holding market ready product, as a result of the coronavirus disease (COVID-19), result in: Please
select all that apply. ..................................................................................................................................... 31

4
Q18. How long can your farm or allied business hold market ready product, as a result of the coronavirus disease
(COVID-19), before it becomes an issue for new crops or planting? ......................................................... 31
Q19. Please indicate if your farm or allied business has applied for loans or financial assistance from any of the
following programs in the period of time between April 10th 2020 and June 29th 2020: (please select all that
apply) ........................................................................................................................................................... 33
Q19.1. Please indicate if your farm or allied business has received loans or financial assistance from any of the
following programs that you applied for: (please select all that apply) ...................................................... 34
Q19.2. Please indicate if loans or financial assistance received by your farm or allied business has been helpful?
..................................................................................................................................................................... 35
Q20. Are there specific steps or types of assistance that would increase the likelihood for your farm or business to
survive? Please select all that apply. ........................................................................................................... 35
Q21. Would assistance with any of the following be helpful to your farm or business right now? Please select all
that apply. .................................................................................................................................................... 36
Q22. Are there any existing programs that your aquaculture, aquaponics, or allied business does not currently
qualify for, that would increase the likelihood of survival of your farm or business?................................ 36
Q23. How did your farm or allied business primarily market or sell aquaculture / aquaponics products before the
effects of the coronavirus disease pandemic (COVID-19)?........................................................................ 37
Q23.1. Did your farm or allied business implement or attempt to implement a new marketing or sales channel in
the period of time between April 10th 2020 and June 29th 2020 because of coronavirus disease (COVID-19)?
..................................................................................................................................................................... 38
Q23.2. What percent of sales from your farm or allied business in the period of time between April 10th 2020 and
June 29th 2020 went through a new marketing channel? ........................................................................... 38
Q23.3. If your farm or allied business implemented or attempted to implement a "Direct to consumer / end user"
marketing channel, please specify the method(s) from the options below: (please select all that apply)? . 39
5
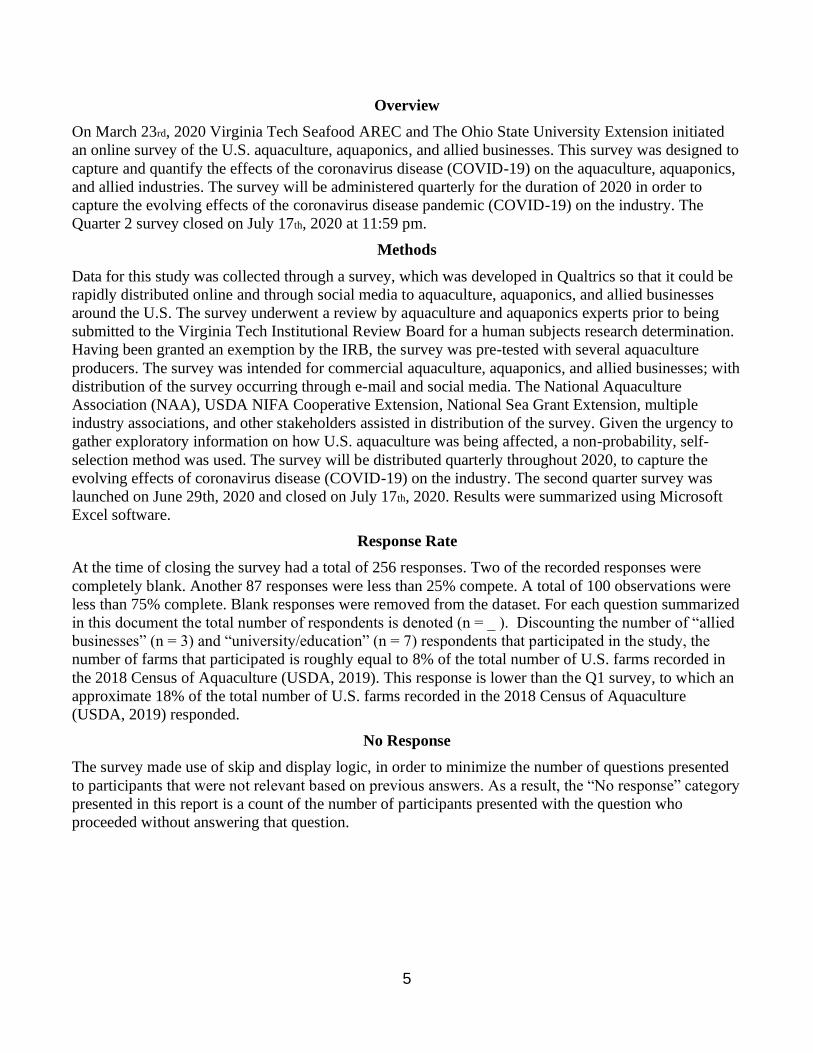
Overview
On March 23rd, 2020 Virginia Tech Seafood AREC and The Ohio State University Extension initiated
an online survey of the U.S. aquaculture, aquaponics, and allied businesses. This survey was designed to
capture and quantify the effects of the coronavirus disease (COVID-19) on the aquaculture, aquaponics,
and allied industries. The survey will be administered quarterly for the duration of 2020 in order to
capture the evolving effects of the coronavirus disease pandemic (COVID-19) on the industry. The
Quarter 2 survey closed on July 17th, 2020 at 11:59 pm.
Methods
Data for this study was collected through a survey, which was developed in Qualtrics so that it could be
rapidly distributed online and through social media to aquaculture, aquaponics, and allied businesses
around the U.S. The survey underwent a review by aquaculture and aquaponics experts prior to being
submitted to the Virginia Tech Institutional Review Board for a human subjects research determination.
Having been granted an exemption by the IRB, the survey was pre-tested with several aquaculture
producers. The survey was intended for commercial aquaculture, aquaponics, and allied businesses; with
distribution of the survey occurring through e-mail and social media. The National Aquaculture
Association (NAA), USDA NIFA Cooperative Extension, National Sea Grant Extension, multiple
industry associations, and other stakeholders assisted in distribution of the survey. Given the urgency to
gather exploratory information on how U.S. aquaculture was being affected, a non-probability, self-
selection method was used. The survey will be distributed quarterly throughout 2020, to capture the
evolving effects of coronavirus disease (COVID-19) on the industry. The second quarter survey was
launched on June 29th, 2020 and closed on July 17th, 2020. Results were summarized using Microsoft
Excel software.
Response Rate
At the time of closing the survey had a total of 256 responses. Two of the recorded responses were
completely blank. Another 87 responses were less than 25% compete. A total of 100 observations were
less than 75% complete. Blank responses were removed from the dataset. For each question summarized
in this document the total number of respondents is denoted (n = _ ). Discounting the number of “allied
businesses” (n = 3) and “university/education” (n = 7) respondents that participated in the study, the
number of farms that participated is roughly equal to 8% of the total number of U.S. farms recorded in
the 2018 Census of Aquaculture (USDA, 2019). This response is lower than the Q1 survey, to which an
approximate 18% of the total number of U.S. farms recorded in the 2018 Census of Aquaculture
(USDA, 2019) responded.
No Response
The survey made use of skip and display logic, in order to minimize the number of questions presented
to participants that were not relevant based on previous answers. As a result, the “No response” category
presented in this report is a count of the number of participants presented with the question who
proceeded without answering that question.

6
Survey results for each question
The number of respondents to each question presented in this summary is denoted as (n = ).
Q1. What is the primary product that your farm or allied business produces?
(n = 248)
• No response : 6%
• Foodfish : 28%
• Mollusks (oysters, clams, mussels, etc.) : 47%
• Baitfish : 1%
• Sportfish / recreational fish, including trout : 4%
• Crustaceans (crawfish, soft crab, shrimp, etc.) : 2%
• Ornamental fish (aquarium or water garden) : 2%
• Aquaponics : 2%
• Aquatic plants : < 1%
• Seaweed : 1%
• Allied business (equipment, chemicals, etc.) : 1%
• University or other research / education organization : 3%
• Other : 3%
6%
28%
47%
1%
4%2% 2% 2% <1% 1% 1%
3% 3%
0%
5%
10%
15%
20%
25%
30%
35%
40%
45%
50%
Per
cen
t of
resp
on
den
ts

7
Q1.1. Please indicate which is the major species of foodfish raised by your farm or business:
(n = 74)
• No response : 0%
• Catfish : 66%
• Trout : 8%
• Salmon : 1%
• Tilapia : 8%
• Hybrid Striped Bass : 3%
• Other : 14%
Q1.2 Please indicate which is the major species of sportfish raised by your farm or business:
(n =11)
• No response : 0%
• Trout : 73%
• Warmwater sportfish : 18%
• Other : 9%
Q2. Please indicate the scale of your farm or business by annual sales volume before the effects of
coronavirus disease (COVID-19):
(n = 237)
0%
66%
8%1%
8%3%
14%
0%
10%
20%
30%
40%
50%
60%
70%
No
response
Catfish Trout Salmon Tilapia Hybrid
Striped
Bass
Other
Per
cen
t of
resp
on
den
ts
0%
73%
18%
9%
0%
10%
20%
30%
40%
50%
60%
70%
80%
No response Trout Warmwater
sportfish
Other
Per
cen
t of
resp
on
den
ts

8
• No response : 8%
• $1 - $1,000 : 3%
• $1,001 - $5,000 : 3%
• $5,001 - $10,000 : 3%
• $10,001 - $25,000 : 4%
• $25,001 - $50,000 : 7%
• $50,001 - $100,000 : 8%
• $100,001 - $250,000 : 13%
• $250,001 - $500,000 : 13%
• $500,001 - $ 1million : 14%
• Greater than $1 million : 24%
• Cannot estimate at this time : 0%
8%
3% 3% 3% 4%
7%8%
13% 13%14%
24%
0%0%
5%
10%
15%
20%
25%
30%
Per
cen
t of
resp
on
den
ts

9
Q3. Please provide the average price and approximate inventory of the primary product (market-
sized) on your farm or business for the following periods of time:
(n = N/A)
Average price per
unit ($ USD)
Average inventory
(# of units)
Unit
(lbs, count, etc.)
No response N/A N/A N/A
As of January 1st 2020 N/A N/A N/A
As of April 1st 2020 N/A N/A N/A
As of July 1st 2020 N/A N/A N/A
Q3.1. Please provide the volume of the primary product (market-sized) sold by your farm at the
market price and the volume sold at a reduced price due to being out-of-size for the following
periods of time:
(n = N/A)
Unit
(lbs, count, etc.)
Average number of
units sold at market
price
Average number of
units sold at reduced
price
No response N/A N/A N/A
Q1: January - March
2020 N/A N/A N/A
Q2: April – June 2020 N/A N/A N/A

10
Q4. In which USDA defined Aquaculture Region is your farm or business located?
(n = 159)
• No response : 13%
• Northeastern Aquaculture Region : 24%
• North Central Aquaculture Region : 5%
• Southern Aquaculture Region : 42%
• Tropical and Sub-Tropical Aquaculture Region : 2%
• Western Aquaculture Region : 14%
13%
24%
5%
42%
2%
14%
0%
5%
10%
15%
20%
25%
30%
35%
40%
45%
Per
cen
t of
resp
on
den
ts

11
Q5. Has your farm or allied business been impacted, either positively or negatively, by the
coronavirus disease (COVID-19) in the period of time between April 10th 2020 and June 29th
2020?
(n = 158)
• No response : 11%
• Yes : 78%
• No : 4%
• Uncertain/not sure : 6%
Q5.1. Does your farm or allied business expect to be affected, either positively or negatively, by the
coronavirus disease (COVID-19) in 2020?
(n = 17)
• No response : 6%
• Definitely yes : 12%
• Probably yes : 47%
• Probably not : 35%
• Definitely not : 0%
11%
78%
4% 6%
0%
20%
40%
60%
80%
100%
No response Yes No Uncertain / not
sure
Per
cen
t of
resp
on
den
ts
6%
12%
47%
35%
0%0%
10%
20%
30%
40%
50%
No response Definitely yes Probably yes Probably not Definitely not
Per
cen
t of
resp
on
den
ts

12
Q6. Have there been changes in government (state or federal) contracts in the period of time
between April 10th 2020 and June 29th 2020 because of the coronavirus disease (COVID-19)?
(n = 124)
• No response : 68%
• Contracts delayed : 13%
• Contracts cancelled : 8%
• Contracts re-instated : 2%
• New contracts made : 10%
Q7. Have there been changes in private contracts in the period of time between April 10th 2020
and June 29th 2020 because of the coronavirus disease (COVID-19)?
(n = 124)
• No response : 20%
• Contracts delayed : 33%
• Contracts cancelled : 43%
• Contracts re-instated : 2%
• New contracts made : 2%
68%
13%8%
2%10%
0%
10%
20%
30%
40%
50%
60%
70%
80%
No response Contracts
delayed
Contracts
cancelled
Contracts re-
instated
New contracts
made
Per
cen
t of
resp
on
den
ts
20%
33%
43%
2% 2%
0%
5%
10%
15%
20%
25%
30%
35%
40%
45%
No response Contracts
delayed
Contracts
cancelled
Contracts re-
instated
New contracts
made
Per
cen
t of
resp
on
den
ts

13
Q8. Please indicate what types of changes in employment have occurred in the period of time
between April 10th 2020 and June 29th 2020 due to the coronavirus disease (COVID-19)?
(n = 123)
• No response : 4%
• Laid off additional employees : 27%
• No change : 50%
• Will soon have to lay off additional employees : 15%
• Have hired additional employees : 5%
Q8.1. Are any of the employees that your farm or business had to, or will have to, lay off due to
the coronavirus disease (COVID-19) designated as "Short-Time" or "Shared-Work" employees?
(n = 51)
• No response : 14%
• Yes : 35%
• No : 51%
• Don’t know : 0%
4%
27%
50%
15%
5%
0%
10%
20%
30%
40%
50%
60%
No response Laid off
additional
employees
No change Will soon have
to lay off
additional
employees
Have hired
additional
employees
Per
cen
t of
resp
on
den
ts
14%
35%
51%
0%0%
10%
20%
30%
40%
50%
60%
No response Yes No Don't know
Per
cen
t of
resp
on
den
ts

14
Q8.2. How many employees has your farm or business had to lay off in the period of time between
April 10th 2020 and June 29th 2020 in response to the coronavirus disease (COVID-19)?
(n = 33)
• No response : 0%
• 1 – 3 employees : 64%
• 4 – 6 employees : 24%
• 7 – 10 employees : 3%
• 11 – 15 employees : 3%
• 16 – 20 employees : 0%
• More than 20 employees : 6%
Q8.3. How many weeks before your farm or business will have to make a decision to lay off
employees, in response to the coronavirus disease (COVID-19)?
(n = 18)
• No response : 0%
• Less than 1 week : 6%
• 1 – 3 weeks : 17%
• 4 – 6 weeks : 61%
• 7 – 10 weeks : 11%
• More than 10 weeks : 6%
0%
64%
24%
3% 3% 0%6%
0%
10%
20%
30%
40%
50%
60%
70%
No
response
1 - 3
employees
4 - 6
employess
7 - 10
employees
11 - 15
employees
16 - 20
employees
> 20
employees
Per
cen
t of
resp
on
den
ts
0%6%
17%
61%
11%6%
0%
10%
20%
30%
40%
50%
60%
70%
No response < 1 week 1 - 3 weeks 4 - 6 weeks 7 - 10 weeks > 10 weeks
Per
cen
t of
resp
on
den
ts

15
Q8.4. How many employees do you estimate your farm or business will have to lay off in response
to the coronavirus disease (COVID-19)?
(n = 18)
• No response : 0%
• 1 – 3 employees : 83%
• 4 – 6 employees : 11%
• 7 – 10 employees : 0%
• 11 – 15 employees : 6%
• 16 – 20 employees : 0%
• More than 20 employees : 0%
Q8.5 How many additional employees has your farm or allied business hired in the period of time
between April 10th 2020 and June 29th 2020 in response to the coronavirus disease (COVID-19)?
(n = 6)
• No response : 0%
• 1 – 3 employees : 83%
• 4 – 6 employees : 17%
• 7 – 10 employees : 0%
• 11 – 15 employees : 0%
• 16 – 20 employees : 0%
• More than 20 employees : 0%
0%
83%
11%0% 6% 0% 0%
0%
20%
40%
60%
80%
100%
No
response
1 - 3
employees
4 - 6
employess
7 - 10
employees
11 - 15
employees
16 - 20
employees
> 20
employees
Per
cen
t of
resp
on
den
ts
0%
83%
17%
0% 0% 0% 0%0%
20%
40%
60%
80%
100%
No
response
1 - 3
employees
4 - 6
employess
7 - 10
employees
11 - 15
employees
16 - 20
employees
> 20
employees
Per
cen
t of
resp
on
den
ts

16
Q9. Has your farm or business had any employees miss work due to the coronavirus disease
(COVID-19) in the period of time between April 10th 2020 and June 29th 2020?
(n = 123)
• No response : 2%
• Yes : 37%
• No : 61%
Q9.1. In total, approximately how many days have any employees in your farm or business missed
work due to the coronavirus disease (COVID-19) in the period of time between April 10th 2020
and June 29th 2020?
(n = 45)
• No response : 0%
• Less than a day : 2%
• 1 -3 days : 7%
• 4 – 6 days : 7%
• 7 – 10 days : 20%
• 11 – 14 days : 24%
• More than 14 days : 40%
2%
37%
61%
0%
10%
20%
30%
40%
50%
60%
70%
No response Yes No
Per
cen
t of
resp
on
den
ts
0%2%
7% 7%
20%24%
40%
0%
5%
10%
15%
20%
25%
30%
35%
40%
45%
No
response
< 1 day 1 - 3 days 4 - 6 days 7 - 10 days 11 - 14
days
> 14 days
Per
cen
t of
resp
on
den
ts

17
Q10. Does your farm or business make use of H2A or H2B workers?
(n = 122)
• No response : 2%
• Yes : 2%
• No : 96%
Q10.1. Has your farm or business been able to secure H2A and H2B workers during the
coronavirus disease (COVID-19) pandemic in the period of time between April 10th 2020 and
June 29th 2020?
(n = 2)
• No response : 0%
• Yes : 50%
• No : 50 %
• Don’t know yet : 0%
• Have not tried : 0%
2% 2%
96%
0%
20%
40%
60%
80%
100%
No response Yes No
Per
cen
t of
resp
on
den
ts
0%
50% 50%
0% 0%0%
10%
20%
30%
40%
50%
60%
No response Yes No Don't know yet Have not tried
Per
cen
t of
resp
on
den
ts

18
Q10.2. Is your farm or business currently at risk of losing H2A or H2B workers due to the
coronavirus disease (COVID-19) pandemic?
(n = 2)
• No response : 0%
• Yes : 0%
• No : 0%
• Don’t know yet : 100%
Q11. Has your farm or business experienced any of the following as a result of the coronavirus
disease (COVID-19) in in the period of time between April 10th 2020 and June 29th 2020? Please
select all that apply.
(n = 150)
• Lost sales : 74%
• Production challenges (not related to labor) : 35%
• Increased cost of production : 32%
• Labor challenges : 35%
• Unable to pay bills or cover liabilities : 31%
• Increased demand for products : 7%
• Other : 19%
0% 0% 0%
100%
0%
50%
100%
No response Yes No Don't know yet
Per
cen
t of
resp
on
den
ts
74%
35%32%
35%31%
7%
19%
0%
10%
20%
30%
40%
50%
60%
70%
80%
Lost sales Production
challenges
Increased
cost of
production
Labor
challenges
Unable to
pay bills /
liabilities
Increased
demand
Other
Per
cen
t of
resp
on
den
ts

19
Q11.1. Has your farm or business experienced lost sales to international or export markets
(outside of the United States), as a result of the coronavirus disease (COVID-19) in the period of
time between April 10th 2020 and June 29th 2020?
(n = 111)
• No response : 4%
• Yes : 22%
• No : 75%
4%
22%
75%
0%
10%
20%
30%
40%
50%
60%
70%
80%
No response Yes No
Per
cen
t of
resp
on
den
ts

20
Q11.2. If your farm or business has experienced lost sales as a result of the coronavirus disease
(COVID-19) in the period of time between April 10th 2020 and June 29th 2020? Please estimate
the value of lost sales:
(n = 108)
• No response : 1%
• $1 - $1,000 : 0%
• $1,001 - $5,000 : 7%
• $5,001 - $10,000 : 3%
• $10,001 - $25,000 : 18%
• $25,001 - $50,000 : 11%
• $50,001 - $100,000 : 18%
• $100,001 - $250,000 : 22%
• $250,001 - $500,000 : 6%
• $500,001 - $ 1million : 8%
• Greater than $1 million : 3%
• Cannot estimate at this time : 3%
1%0%
7%
3%
18%
11%
18%
22%
6%
8%
3% 3%
0%
5%
10%
15%
20%
25%
Per
cen
t of
resp
on
den
ts
21
Q11.3. If your farm or business has experienced production challenges (not related to labor) as a
result of the coronavirus disease (COVID-19) in the period of time between April 10th 2020 and
June 29th 2020, can those challenges be specified? Please select all that apply.
(n = 50)
• Challenges with production inputs (feed, chemicals, therapeutants, etc.) : 46%
• Challenges with repair, construction, consultant or engineering services : 28%
• Challenges with financial services (operating loans, leases, etc.) : 28%
• Other : 36%
• Cannot identify specific production challenges at this time : 10%
46%
28% 28%
36%
10%
0%
5%
10%
15%
20%
25%
30%
35%
40%
45%
50%
Challenges
with
production
inputs
Challenges
with repair,
construction,
consultant or
engineering
services
Challenges
with financial
services
Other Cannot
identify
specific
production
challenges at
this time
Per
cen
t of
resp
on
den
ts

22
Q11.6. If your farm or business has experienced increased demand for products as a result of the
coronavirus disease (COVID-19) in the period of time between April 10th 2020 and June 29th
2020? Please estimate the value of those effects on sales:
(n = 10)
• No response : 0%
• $1 - $1,000 : 0%
• $1,001 - $5,000 : 10%
• $5,001 - $10,000 : 10%
• $10,001 - $25,000 : 0%
• $25,001 - $50,000 : 20%
• $50,001 - $100,000 : 10%
• $100,001 - $250,000 : 10%
• $250,001 - $500,000 : 10%
• $500,001 - $ 1million : 0%
• Greater than $1 million : 0%
• Cannot estimate at this time : 30%
0% 0%
10% 10%
0%
20%
10% 10% 10%
0% 0%
30%
0%
5%
10%
15%
20%
25%
30%
35%
Per
cen
t of
resp
on
den
ts

23
Q11.8. If your farm or allied business has experienced missed bill or loan payments as a result of
the coronavirus disease (COVID-19) in the period of time between April 10th 2020 and June 29th
2020? Please estimate the value of those missed payments:
(n = 45)
• No response : 33%
• $1 - $1,000 : 2%
• $1,001 - $5,000 : 18%
• $5,001 - $10,000 : 4%
• $10,001 - $25,000 : 9%
• $25,001 - $50,000 : 7%
• $50,001 - $100,000 : 4%
• $100,001 - $250,000 : 4%
• $250,001 - $500,000 : 2%
• $500,001 - $ 1million : 2%
• Greater than $1 million : 0%
• Cannot estimate at this time : 13%
33%
2%
18%
4%
9%
7%
4% 4%
2% 2%
0%
13%
0%
5%
10%
15%
20%
25%
30%
35%
Per
cen
t of
resp
on
den
ts
24
Q12. Does your farm or business expect to experience any of the following as a result of the
coronavirus disease (COVID-19) in the 3rd Quarter of 2020 (July, August, September)? Please
select all that apply.
(n = 141)
• Lost sales : 68%
• Production challenges (not related to labor) : 35%
• Increased cost of production : 36%
• Labor challenges : 36%
• Unable to pay bills or cover liabilities : 29%
• Increased demand for products : 8%
• Other : 11%
Q12.1. Does your farm or allied business expect to experience changes in sales to international or
export markets (outside of the United States), as a result of the coronavirus disease (COVID-19),
in the 3rd Quarter of 2020 (July, August, September)?
(n = 96)
• No response : 14%
• Decreased sales : 21%
• No changes expected : 64%
• Increased sales : 2%
68%
35% 36% 36%29%
8%11%
0%
10%
20%
30%
40%
50%
60%
70%
80%
Lost sales Production
challenges
Increased
cost of
production
Labor
challenges
Unable to
pay bills /
liabilities
Increased
demand for
products
Other
Per
cen
t of
resp
on
den
ts
14%21%
64%
2%0%
20%
40%
60%
80%
No response Decreased sales No changes
expected
Increased sales
Per
cen
t of
resp
on
den
ts

25
Q12.2. Does your farm or business expect to experience lost sales as a result of the coronavirus
disease (COVID-19) in the 3rd Quarter of 2020 (July, August, September)? Please estimate the
value of lost sales:
(n = 96)
• No response : 0%
• $1 - $1,000 : 0%
• $1,001 - $5,000 : 5%
• $5,001 - $10,000 : 5%
• $10,001 - $25,000 : 10%
• $25,001 - $50,000 : 14%
• $50,001 - $100,000 : 22%
• $100,001 - $250,000 : 20%
• $250,001 - $500,000 : 8%
• $500,001 - $ 1million : 6%
• Greater than $1 million : 2%
• Cannot estimate at this time : 7%
0% 0%
5% 5%
10%
14%
22%
20%
8%
6%
2%
7%
0%
5%
10%
15%
20%
25%
Per
cen
t of
resp
on
den
ts

26
Q12.3. Does your farm or business expect to experience production challenges (not related to
labor) as a result of the coronavirus disease (COVID-19) in the 3rd Quarter of 2020 (July, August,
September), can those challenges be specified? Please select all that apply.
(n = 49)
• Challenges with production inputs (feed, chemicals, therapeutants, etc.) : 39%
• Challenges with repair, construction, consultant or engineering services : 31%
• Challenges with financial services (operating loans, leases, etc.) : 37%
• Other : 22%
• Cannot identify specific production challenges at this time : 12%
39%
31%
37%
22%
12%
0%
5%
10%
15%
20%
25%
30%
35%
40%
45%
Challenges
with
production
inputs
Challenges
with repair,
construction,
consultant or
engineering
services
Challenges
with financial
services
Other Cannot
identify
specific
production
challenges at
this time
Per
cen
t of
resp
on
den
ts

27
Q12.6. Does your farm or business expect to experience increased demand for products as a result
of the coronavirus disease (COVID-19) in the 3rd Quarter of 2020 (July, August, September)?
Please estimate the value of those effects on sales:
(n = 11)
• No response : 9%
• $1 - $1,000 : 0%
• $1,001 - $5,000 : 0%
• $5,001 - $10,000 : 9%
• $10,001 - $25,000 : 27%
• $25,001 - $50,000 : 0%
• $50,001 - $100,000 : 0%
• $100,001 - $250,000 : 27%
• $250,001 - $500,000 : 0%
• $500,001 - $ 1million : 0%
• Greater than $1 million : 0%
• Cannot estimate at this time : 27%
9%
0% 0%
9%
27%
0% 0%
27%
0% 0% 0%
27%
0%
5%
10%
15%
20%
25%
30%
Per
cen
t of
resp
on
den
ts

28
Q12.8. If your farm or allied business expects to miss bill or loan payments as a result of the
coronavirus disease (COVID-19) in the 3rd Quarter of 2020 (July, August, September)? Please
estimate the value of those missed payments:
(n = 45)
• No response : 40%
• $1 - $1,000 : 7%
• $1,001 - $5,000 : 2%
• $5,001 - $10,000 : 2%
• $10,001 - $25,000 : 9%
• $25,001 - $50,000 : 7%
• $50,001 - $100,000 : 7%
• $100,001 - $250,000 : 7%
• $250,001 - $500,000 : 2%
• $500,001 - $ 1million : 2%
• Greater than $1 million : 0%
• Cannot estimate at this time : 16%
40%
7%
2% 2%
9%7% 7% 7%
2% 2%0%
16%
0%
5%
10%
15%
20%
25%
30%
35%
40%
45%
Per
cen
t of
resp
on
den
ts

29
Q13. Without external intervention (for example, governmental assistance), will your farm or
business survive in the next 3 (three) months?
(n = 121)
• No response : 2%
• Yes : 45%
• Maybe : 46%
• No : 7%
Q14. Without external intervention (for example, governmental assistance), will your farm or
business survive in the next 6 (six) months?
(n = 121)
• No response : 2%
• Yes : 31%
• Maybe : 50%
• No : 17%
Q15. Without external intervention (for example, governmental assistance), will your farm or
business survive in the next 12 (twelve) months?
(n = 121)
2%
45% 46%
7%
0%
10%
20%
30%
40%
50%
No response Yes Maybe No
Per
cen
t of
resp
on
den
ts
2%
31%
50%
17%
0%
10%
20%
30%
40%
50%
60%
No response Yes Maybe No
Per
cen
t of
resp
on
den
ts
30
• No response : 2%
• Yes : 17%
• Maybe : 49%
• No : 31%
Q16. How would you describe the current availability of cash on hand for your farm or allied
business, including financial assistance or loans? Please select how long a period the current cash
on hand will cover:
(n = 121)
• No response : 8%
• No cash available for business operations : 9%
• 1 - 7 days of operations : 3%
• 1 - 2 weeks of operations : 6%
• 3 - 4 weeks of operations : 13%
• 1 - 2 months of operations : 25%
• 4 - 6 months of operations : 21%
• 7 - 10 months of operations : 7%
• More than 10 months of operations : 7%
• Don’t know : 0%
Q17. Will holding market ready product, as a result of the coronavirus disease (COVID-19), make
it less marketable?
(n = 121)
2%
17%
49%
31%
0%
10%
20%
30%
40%
50%
60%
No response Yes Maybe No
Per
cen
t of
resp
on
den
ts
8% 9%3%
6%
13%
25%21%
7% 7%
0%0%5%
10%15%20%25%30%
Per
cen
t of
resp
on
den
ts
31
• No response : 2%
• Yes : 73%
• No : 18%
• Don’t know : 7%
Q17.1. Will holding market ready product, as a result of the coronavirus disease (COVID-19),
result in: Please select all that apply.
(n = 88)
• Reduced quantity sold : 56%
• Reduced price : 66%
• Reduced quality of product : 59%
• Other : 20%
Q18. How long can your farm or allied business hold market ready product, as a result of the
coronavirus disease (COVID-19), before it becomes an issue for new crops or planting?
(n = 121)
• No response : 10%
2%
73%
18%
7%
0%
10%
20%
30%
40%
50%
60%
70%
80%
No response Yes No Don't know
Per
cen
t of
resp
on
den
ts
56%
66%
59%
20%
0%
10%
20%
30%
40%
50%
60%
70%
Reduced quantity
sold
Reduced price Reduced quality of
products
Other
Per
cen
t o
f re
spon
den
ts

32
• 1 - 7 days : 3%
• 1 - 2 weeks : 7%
• 3 - 4 weeks : 11%
• 1 - 3 months : 39%
• 4 - 6 months : 16%
• 7 - 10 months : 6%
• More than 10 months : 9%
• Don’t know : 0%
10%
3%
7%
11%
39%
16%
6%
9%
0%0%
5%
10%
15%
20%
25%
30%
35%
40%
45%
Per
cen
t of
resp
on
den
ts
33
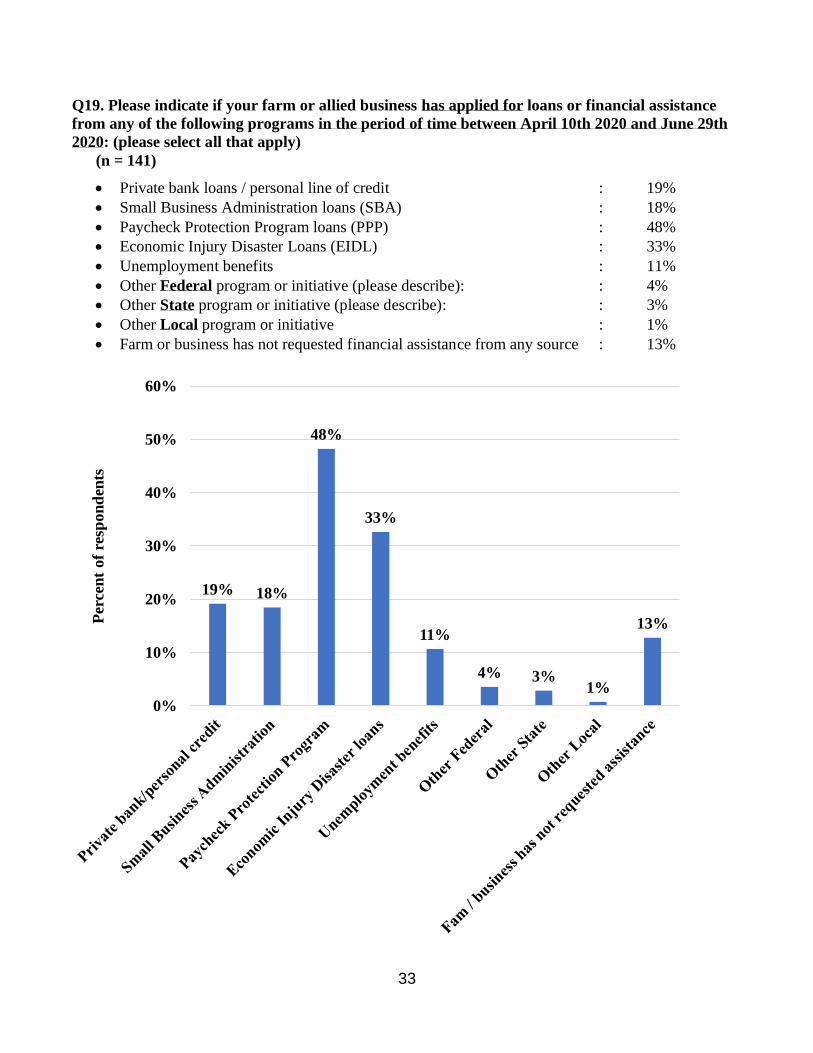
Q19. Please indicate if your farm or allied business has applied for loans or financial assistance
from any of the following programs in the period of time between April 10th 2020 and June 29th
2020: (please select all that apply)
(n = 141)
• Private bank loans / personal line of credit : 19%
• Small Business Administration loans (SBA) : 18%
• Paycheck Protection Program loans (PPP) : 48%
• Economic Injury Disaster Loans (EIDL) : 33%
• Unemployment benefits : 11%
• Other Federal program or initiative (please describe): : 4%
• Other State program or initiative (please describe): : 3%
• Other Local program or initiative : 1%
• Farm or business has not requested financial assistance from any source : 13%
19% 18%
48%
33%
11%
4% 3%1%
13%
0%
10%
20%
30%
40%
50%
60%
Per
cen
t of
resp
on
den
ts

34
Q19.1. Please indicate if your farm or allied business has received loans or financial assistance
from any of the following programs that you applied for: (please select all that apply)
• Private bank loans / personal line of credit (n = 27) : 67%
• Small Business Administration loans (SBA) (n = 26) : 62%
• Paycheck Protection Program loans (PPP) (n = 68) : 90%
• Economic Injury Disaster Loans (EIDL) (n = 46) : 67%
• Unemployment benefits (n = 15) : 87%
• Other Federal program or initiative (n = 5) : 60%
• Other State program or initiative (n = 4) : 50%
• Other Local program or initiative (n = 1) : 100%
• Farm or business has applied but not yet received loans or assistance (n = 100): 9%
• Farm or business applications have been denied / declined (n = 100) : 5%
67%62%
90%
67%
87%
60%
50%
100%
9%5%
0%
10%
20%
30%
40%
50%
60%
70%
80%
90%
100%
Per
cen
t of
resp
on
den
ts

35
Q19.2. Please indicate if loans or financial assistance received by your farm or allied business has
been helpful?
Financial Assistance Program No
response Yes No
Private bank loans / personal line of credit (n = 18) 0% 89% 11%
Small Business Administration loans (SBA) (n = 16) 0% 100% 0%
Paycheck Protection Program loans (PPP) (n = 61) 2% 97% 2%
Economic Injury Disaster Loans (EIDL) (n = 31) 0% 87% 13%
Unemployment benefits (n = 13) 0% 85% 15%
Other Federal program or initiative (n = 3) 33% 67% 0%
Other State program or initiative (n = 2) 0% 100% 0%
Other Local program or initiative (n = 1) 0% 100% 0%
Q20. Are there specific steps or types of assistance that would increase the likelihood for your
farm or business to survive? Please select all that apply.
(n = 140)
• Federal assistance : 56%
• State assistance : 33%
• Local assistance : 14%
• Assistance from associations : 8%
• Other : 13%
• None : 9%
56%
33%
14%8%
13%9%
0%
10%
20%
30%
40%
50%
60%
Federal
assistance
State
assistance
Local
assistance
Assistance
from
associations
Other None
Per
cen
t of
resp
on
den
ts

36
Q21. Would assistance with any of the following be helpful to your farm or business right now?
Please select all that apply.
(n = 139)
• Waiving or delay of State fees : 26%
• Tariff relief : 7%
• Assistance identifying new markets : 19%
• Loan guarantees : 16%
• Specialty Crop Insurance : 34%
• Other : 17%
Q22. Are there any existing programs that your aquaculture, aquaponics, or allied business does
not currently qualify for, that would increase the likelihood of survival of your farm or business?
(n = 138)
• No response : 61%
• Yes : 25%
• No : 14%
• Don’t know : 0%
26%
7%
19%16%
34%
17%
0%5%
10%15%20%25%30%35%40%
Waiving or
delay of
State fees
Tariff relief Assistance
identifying
new
markets
Loan
guarantees
Specialty
crop
insurance
OtherPer
cen
t of
resp
on
den
ts
61%
25%
14%
0%0%
10%
20%
30%
40%
50%
60%
70%
No response Yes No Don't know
Per
cen
t of
resp
on
den
ts

37
Q23. How did your farm or allied business primarily market or sell aquaculture / aquaponics
products before the effects of the coronavirus disease pandemic (COVID-19)?
(n = 137)
• No response : 11%
• Direct to consumers : 11%
• Processor : 22%
• Distributor : 29%
• Restaurants : 13%
• Grocery Stores / Supermarkets : 1%
• Other aquaculture/aquaponics farms or businesses : 4%
• Other : 8%
11% 11%
22%
29%
13%
1%
4%
8%
0%
5%
10%
15%
20%
25%
30%
35%
Per
cen
t of
resp
on
den
ts

38
Q23.1. Did your farm or allied business implement or attempt to implement a new marketing or
sales channel in the period of time between April 10th 2020 and June 29th 2020 because of
coronavirus disease (COVID-19)?
(n = 137)
• No response : 11%
• Yes : 34%
• No : 45%
• In the process of implementing : 10%
Q23.2. What percent of sales from your farm or allied business in the period of time between April
10th 2020 and June 29th 2020 went through a new marketing channel?
(n = 47)
Marketing Channel Average percent of sales
Direct to consumers / end users 44%
Processor 74%
Distributor 41%
Restaurants 24%
Grocery stores / supermarkets 36%
Other aquaculture / aquaponics farms or
business 43%
Other 45%
11%
34%
45%
10%
0%
10%
20%
30%
40%
50%
No response Yes No In process
Per
cen
t of
resp
on
den
ts

39
Q23.3. If your farm or allied business implemented or attempted to implement a "Direct to
consumer / end user" marketing channel, please specify the method(s) from the options below:
(please select all that apply)?
(n = 27)
• Home delivery : 44%
• Curbside pickup : 59%
• Opened a retail outlet : 15%
• Online sales : 70%
• Other : 22%
44%
59%
15%
70%
22%
0%
10%
20%
30%
40%
50%
60%
70%
80%
Home delivery Curbside
pickup
Opened retail
outlet
Online sales Other
Per
cen
t of
resp
on
den
ts

40
References
USDA (United States Department of Agriculture). 2019. 2018 Census of Aquaculture. National
Agricultural Statistics Service, USDA, Washington, District of Columbia, USA. Accessed April
2020 at:
https://www.nass.usda.gov/Surveys/Guide_to_NASS_Surveys/Census_of_Aquaculture/index.ph
p.
Acknowledgements
Thank you to all respondents who participated in this study. Also, thank you to all of the national,
regional, and state associations, agencies, Extension, and all others who helped us disseminate the
survey. There are simply too many names to list, thanks to all of you. Thank you to NOAA Sea Grant
and the National Marine Fisheries Service for supporting this work.