impacts of public prekindergarten on children’s early
TRANSCRIPT

1
Impacts of Public Prekindergarten on Children’s Early Numeracy, Language, Literacy, Executive
Functioning, and Emotional Development
Christina WeilandUniversity of [email protected]
Funded by the U.S. Department of Education, Institute of Education Sciences

U.S. Preschool: Who goes (and who doesn’t)?
32%
59%
39%
66%61%
83%
0%
10%
20%
30%
40%
50%
60%
70%
80%
90%
Age 3 Age 4
Enrollment in center-based preschool for 3 & 4 year olds by income level and age, 2013 (Chaudry, Morrissey, Weiland, & Yoshikawa, 2016)
<200% FPL
200%-400% FPL
>400% FPL

By race/ethnicity
Whitehurst & Klein, 2015

State pre-k and HS enrollment(Barnett et al., 2014)
42 states and DC have state pre-k programs; a few states are universal

Does “preschool” work? (Duncan & Magnuson, 2013)

Why it works: Developmental Perspective
• Children particularly developmentally malleable during prek period (Shonkoff & Phillips, 2000)
• Success begets success
– Higher levels of early vocabulary, reading, mathematics, and executive functioning consistently greater levels of academic success in elementary and middle school (Duncan et al., 2007; McClelland, Acock, &
Morrison, 2006; National Early Literacy Panel, 2008)
– Emotional development – evidence more mixed but suggests similar links(Entwisle, Alexander, & Olson, 2005; Pianta, & Stuhlman, 2004)
– Compensatory story also possible (Bloom & Weiland, 2015)
6

7
Effects of State- and Locally Funded Pre-K: What do we know?
• Programs succeeding in obtaining small to moderate impacts at scale (Gormley, Gayer, Phillips, & Dawson, 2005; Hustedt,
Barnett, Jung & Goetze, 2009; Hustedt, Barnett, Jung & Thomas, 2007; Wong et al., 2007)
– Numeracy effect size range from 0.16 to 0.50 std
– Receptive vocabulary effect size range from 0.17 to 0.36 std

8
Effects of State- and Locally Funded Pre-K: What does this study add?
• Effects on other developmentally important domains
• Details on treatment and control conditions
– Consistent curricula in place
– Information on what control children experienced
• Sensitivity of results to some methodological issues not addressed in prior prek RD studies
• Case study: Access and Quality tradeoff

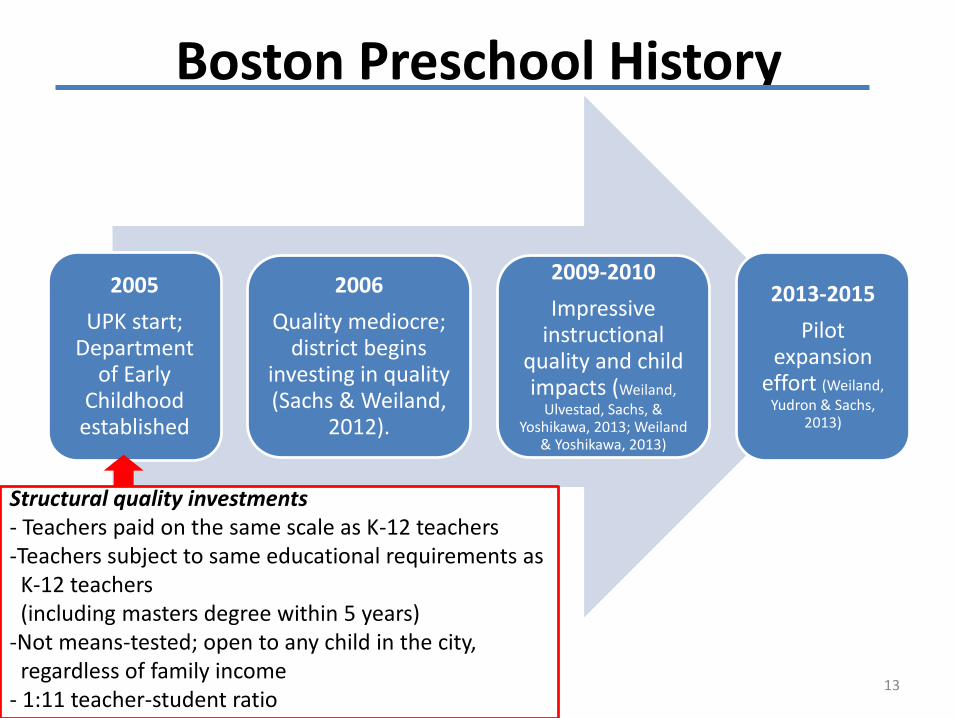
Boston Preschool History
2005
UPK start; Department
of Early Childhood
established
2006
Quality mediocre; district begins
investing in quality (Sachs & Weiland,
2012).
2009-2010
Impressive instructional
quality and child impacts (Weiland,
Ulvestad, Sachs, & Yoshikawa, 2013; Weiland
& Yoshikawa, 2013)
2013-2015
Pilot expansion
effort (Weiland, Yudron & Sachs,
2013)
9
L

Boston Preschool History
2005
UPK start; Department
of Early Childhood
established
2006
Quality mediocre; district begins
investing in quality (Sachs & Weiland,
2012).
2009-2010
Impressive instructional
quality and child impacts (Weiland,
Ulvestad, Sachs, & Yoshikawa, 2013; Weiland
& Yoshikawa, 2013)
2013-2015
Pilot expansion
effort (Weiland, Yudron & Sachs,
2013)
10
L“Boston preschools falling far short of goals…hobbled by mediocre instruction” –Boston Globe, 2007

Boston Preschool History
2005
UPK start; Department
of Early Childhood
established
2006
Quality mediocre; district begins
investing in quality (Sachs & Weiland,
2012).
2009-2010
Impressive instructional
quality and child impacts (Weiland,
Ulvestad, Sachs, & Yoshikawa, 2013; Weiland
& Yoshikawa, 2013)
2013-2015
Pilot expansion
effort (Weiland, Yudron & Sachs,
2013)
11

Boston Preschool History
2005
UPK start; Department
of Early Childhood
established
2006
Quality mediocre; district begins
investing in quality (Sachs & Weiland,
2012).
2009-2010
Impressive instructional
quality and child impacts (Weiland,
Ulvestad, Sachs, & Yoshikawa, 2013; Weiland
& Yoshikawa, 2013)
2013-2015
Pilot expansion
effort (Weiland, Yudron & Sachs,
2013)
12
L
Boston Preschool History
2005
UPK start; Department
of Early Childhood
established
2006
Quality mediocre; district begins
investing in quality (Sachs & Weiland,
2012).
2009-2010
Impressive instructional
quality and child impacts (Weiland,
Ulvestad, Sachs, & Yoshikawa, 2013; Weiland
& Yoshikawa, 2013)
2013-2015
Pilot expansion
effort (Weiland, Yudron & Sachs,
2013)
13
L
Structural quality investments- Teachers paid on the same scale as K-12 teachers-Teachers subject to same educational requirements as
K-12 teachers (including masters degree within 5 years)
-Not means-tested; open to any child in the city, regardless of family income
- 1:11 teacher-student ratio

Key: Process Quality Investments
2005
UPK start; Department
of Early Childhood
established
2006
Quality mediocre; district begins
investing in quality (Sachs & Weiland,
2012).
2009-2010
Impressive instructional
quality and child impacts (Weiland,
Ulvestad, Sachs, & Yoshikawa, 2013; Weiland
& Yoshikawa, 2013)
2013-2015
Pilot expansion
effort (Weiland, Yudron & Sachs,
2013)
14
L
Process quality investments- Proven language, literacy, and mathematics curricula- Paired with training on the curriculum (6 days math; 7 days language and literacy) and
weekly to bi-weekly in-classroom coaching by an expert coach- Classroom quality observed and evaluated by outside researchers bi-
annually. Data are non-punitive. Fed back to teachers to improve their practice and used for district-wide planning.

Boston in action
• https://www.youtube.com/watch?v=URZkGPwcsn0

Impact evaluation research questions
1) What is the causal impact of the Boston Public Schools prekindergarten program on child early mathematics, language, literacy, executive functioning, and emotional development outcomes?
2) Do some student subgroups benefit more from the program than others?
16

17
Sample
2,018 children
(in 67 schools)
Race/ethnicity11% Asian, 27% Black, 41% Hispanic, 3% Other,18% White
Home language50% English, 27% Spanish, 22% Other
Gender, Free/reduced lunch, and Special needs
51% male, 69% receive free/reduced lunch, 9% special needs
Final sample represents 85% of schools & 70% of eligible children in those schools
969 before cutoff
(prek 2008-2009)
1049after cutoff
(prek 2009-2010)

18
Study design for child-level impacts: Regression discontinuity
Sep Oct Nov Dec Jan Feb Mar Apr May Jun Jul Aug Sep Oct Nov Dec Jan Feb Mar Apr May Jun Jul Aug
2007 2008 2009
Treatment Group
(attend prek in 2008-2009)
Control Group
(attend prek in 2009-2010)
SEPTEMBER 1BIRTHDAY CUTOFF

Procedures: Test Timing
pre-k (T)First cohort(before cutoff)
Second cohort(after cutoff)
Year 1 (2008-2009)
no pre-k (C)

Procedures: Test Timing
pre-k (T) kindergartenFirst cohort(before cutoff)
Second cohort(after cutoff)
Year 1 (2008-2009) Year 2 (2009-2010)
no pre-k (C)
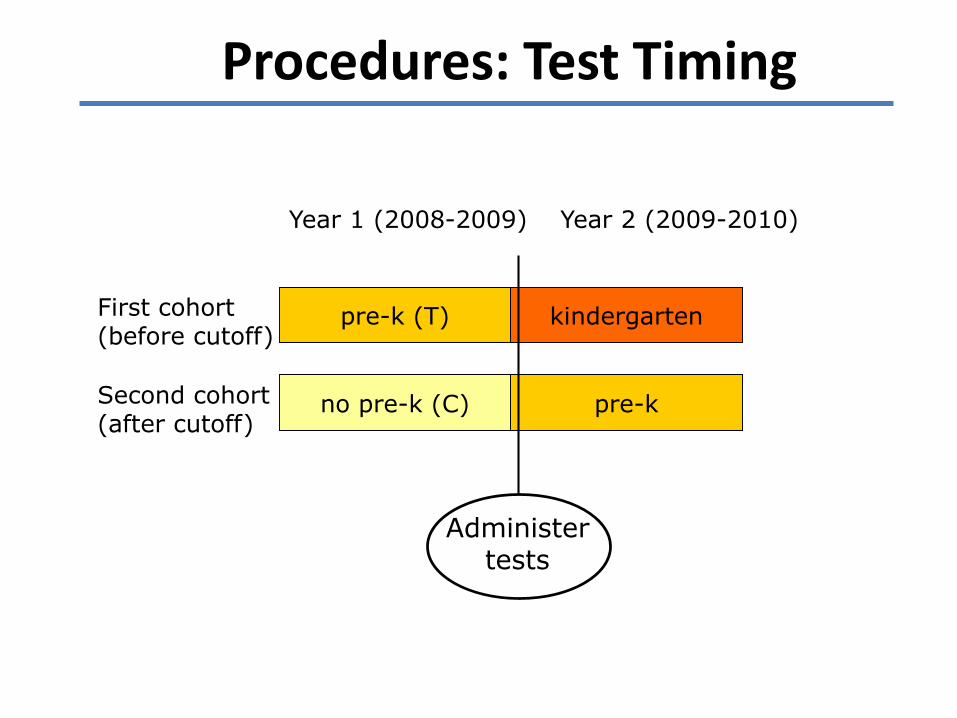
Procedures: Test Timing
pre-k (T) kindergarten
pre-k
First cohort(before cutoff)
Second cohort(after cutoff)
Year 1 (2008-2009) Year 2 (2009-2010)
Administertests
no pre-k (C)

22
RD illustrationoutc
om
e
Distance from age cutoff (days)
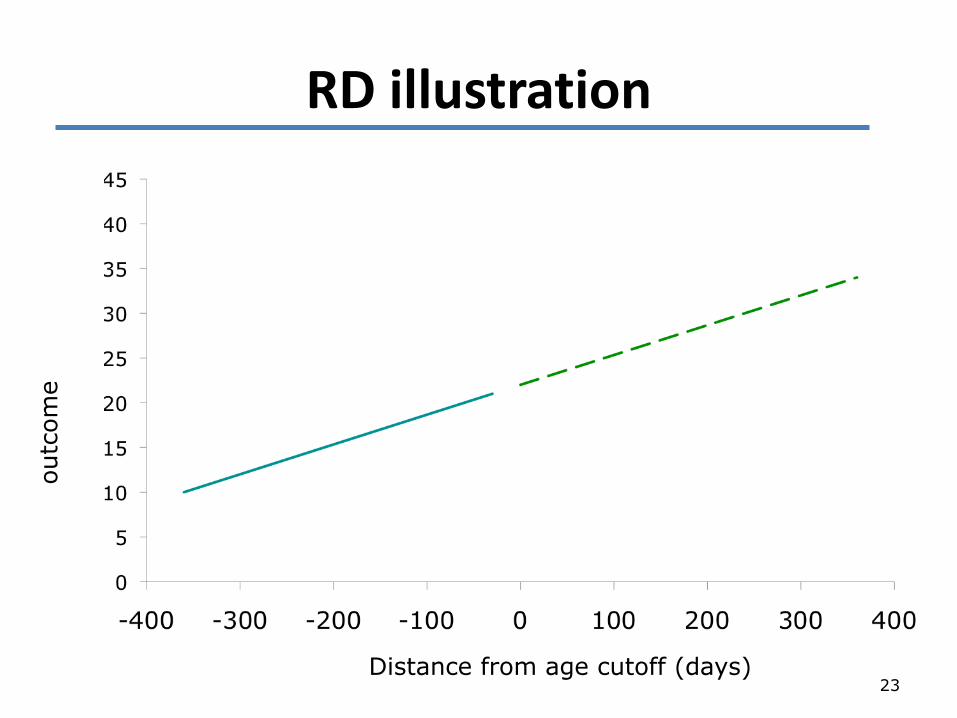
23
RD illustrationoutc
om
e
Distance from age cutoff (days)

24
RD illustrationoutc
om
e
Distance from age cutoff (days)
Vertical distance= impact of the program
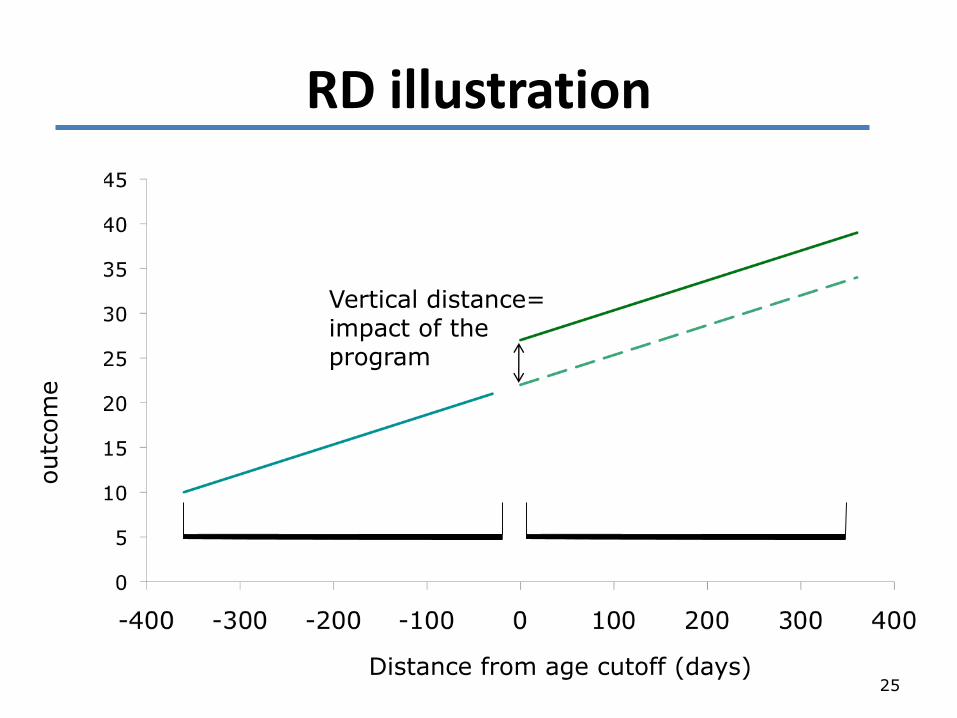
25
RD illustrationoutc
om
e
Distance from age cutoff (days)
Vertical distance= impact of the program

26
RD illustrationoutc
om
e
Distance from age cutoff (days)
Vertical distance= impact of the program

27
Was the identification strategy valid?
• Observed characteristics vary smoothly at the cutoff.
• No cross-overs; policy strictly enforced.
• No evidence of pile-up at the cutoff.

Measures: Math, Language and Literacy
• A trained assessor tested children one-on-one on a battery of tests, including:
– Early math: Woodcock-Johnson Applied Problems subscale (Woodcock, McGrew & Mather, 2001) and Research-based Early Math Assessment Short Form (Weiland et al., 2013)
– Language: Peabody Picture Vocabulary Test-III (Dunn & Dunn,
1997)
– Literacy: Woodcock-Johnson Letter-Word Identification subscale (Woodcock, McGrew & Mather, 2001)
28
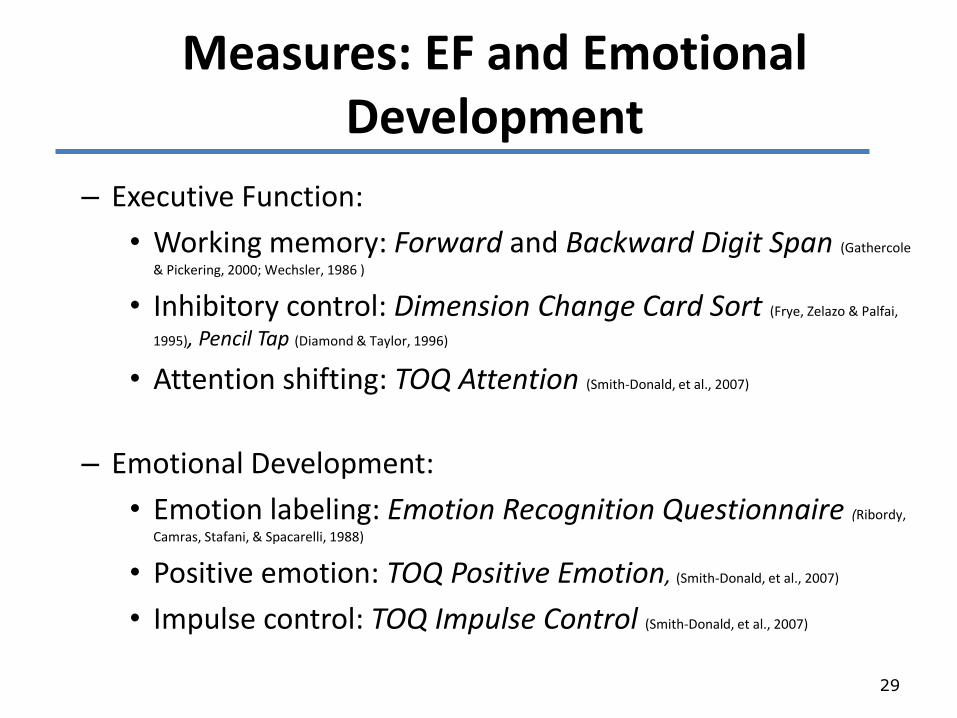
Measures: EF and Emotional Development
– Executive Function:
• Working memory: Forward and Backward Digit Span (Gathercole
& Pickering, 2000; Wechsler, 1986 )
• Inhibitory control: Dimension Change Card Sort (Frye, Zelazo & Palfai,
1995), Pencil Tap (Diamond & Taylor, 1996)
• Attention shifting: TOQ Attention (Smith-Donald, et al., 2007)
– Emotional Development:
• Emotion labeling: Emotion Recognition Questionnaire (Ribordy,
Camras, Stafani, & Spacarelli, 1988)
• Positive emotion: TOQ Positive Emotion, (Smith-Donald, et al., 2007)
• Impulse control: TOQ Impulse Control (Smith-Donald, et al., 2007)
29

Results: Fidelity of Implementation
• Observations conducted in 74 prekindergarten classrooms during treatment year
• Curricula were moderately to highly implemented
Average level of fidelity-to-curricula (range 1-5)
30
Mean Std
Building Blocks 3.87 0.63
OWL 3.60 1.03

Results: Largest effects on language and math of public preK studies to date in the US
(Weiland & Yoshikawa, 2013)
31
0.44***
0.62***0.59***
0.50***
0
0,1
0,2
0,3
0,4
0,5
0,6
0,7
PPVT-III(vocabulary)
W-J LW (earlyreading)
W-J AP (numeracy) REMA Short(numeracy,geometry)
eff
ect
siz
e

32
Plot of the fitted relationship between the forcing variable (CAGE), TREAT, and receptive vocabulary (PPVT)
TREAT=8.56***

Results: Positive “Spillover” Effects on All Three Dimensions of Executive Function Skills
(Weiland & Yoshikawa, 2013)
33
0.24*** 0.24*** 0.21***0.28***
0
0,1
0,2
0,3
0,4
0,5
0,6
0,7
Backward DS(working memory)
Forward DS(working memory)
Pencil Tap(inhibitory control)
DCCS (cognitiveflexibility)
effe
ct s
ize

Results: Free/reduced lunch subgroup effects
34
0.66
0.34
0.33
0.47
-0,01
0,03
-0,10
0,00
0,10
0,20
0,30
0,40
0,50
0,60
0,70
Applied Problems Pencil Tap Dimensional Change Card
Sort
effect
siz
e
Free/reduced lunch eligible
Not free/reduced lunch
eligible

Results: Race/ethnicity subgroup effects
35+ robust to bandwidth and functional form~ not robust to bandwidth and/or functional form

Results: Race/ethnicity subgroup effects
36+ robust to bandwidth and functional form~ not robust to bandwidth and/or functional form
0.50+
0.88+
1.04+
0.70+
0.51+ 0.50+
0.31+

Additional robustness checks• Discontinuities in the outcomes at points
other than the cutoff
• Functional form
• Bandwidth
• Multiple comparisons
• Testing familiarity differences between T/C group
• Use of different start rules on the PPVT-III
37

38
Summary: Comparison of effect sizes across RD prek studies
***p<0.001; **p<0.01; *p<0.05
+ results statistically significant but level of significance not reported.Citations: Tulsa (Gormley, Gayer, Phillips, & Dawson, 2005); MI, NJ, SC, WV, OK (Wong et al., 2007);
NM (Hustedt, Barnett, Jung & Goetze, 2009).
Note: All cited studies use the standard deviation of the control group as the denominator in calculating
effect sizes. Boston models all use a bandwidth of 365 days and linear functional form between
the outcome and age.
PPVT-III
Letter Word
Identification
Applied
Problems
REMA
Short
Boston 0.44*** 0.62*** 0.59*** 0.50***
Tulsa -- 0.80*** 0.38* --
Michigan -0.16 -- 0.47* --
New Jersey 0.36* -- 0.23* --
South Carolina 0.05 -- -- --
West Virginia 0.14 -- 0.11 --
Oklahoma 0.29* -- 0.35 --
New Mexico, Y1 0.35+ -- 0.38+ --
New Mexico, Y2 0.25+ -- 0.50+ --
New Mexico, Y3 0.17+ -- 0.43+ --

39
Results: Impacts achieved even though majority of control group children
attended other preschool programs
Non-relative
daycare
9%
Head Start
17%
Other
32%
Public center
12%
Private
center
30%

40
Limitations
• Results only generalize to students at the cutoff
• Results only generalize to children whose parents agreed to let them participate
• Cannot definitively identify the causal mechanisms behind detected effects

Implications
• High-quality preschool is achievable on a large-scale
• Targeting particular child developmental gains can lead to spillover effects
• Work does not end with pre-k
– Expansion “up” and “out” in Boston

Emotional Support Nationally is Good
0
1
2
3
4
5
6
7
CLASS Emotional Support CLASS InstructionalSupport
Boston pre-k
Tulsa pre-k
Tulsa CAP Head Start
Head Start
11-state Pre-k study
Chaudry, Morrissey, Weiland & Yoshikawa, 2016

0
1
2
3
4
5
6
7
CLASS Emotional Support CLASS InstructionalSupport
Boston pre-k
Tulsa pre-k
Tulsa CAP Head Start
Head Start
11-state Pre-k study
Instructional Support Nationally is Inadequate
Chaudry, Morrissey, Weiland & Yoshikawa, 2016
44
Thank you!
• BPS: Participating families, teachers, principals, early childhood coaches, Jason Sachs and the BPS Department of Early Childhood, the BPS Office of Research, Assessment and Evaluation.
• Carolyn Layzer and Abt Associates
• Co-PI’s: Nonie Lesaux, Richard Murnane, and John Willett
• Our research assistants: Kjersti Ulvestad, Carla Schultz, Michael Hurwitz, Julia Hayden, Hadas Eidelman, Kam Sripada, Ellen Fink, Julia Foodman, Deni Peri, Caitlin Over, and John Goodson.
• Our grant officer and funder: Caroline Ebanks at the Institute of Education Sciences

APPENDIX

Data analytic strategy: Test Timing
pre-k (T) kindergarten
pre-k
First cohort(before cutoff)
Second cohort(after cutoff)
Year 1 (2008-2009) Year 2 (2009-2010)
Administertests
no pre-k (C)
Problem groups:
-T/C Attriters

Data analytic strategy: Test Timing
pre-k (T) kindergarten
pre-k
First cohort(before cutoff)
Second cohort(after cutoff)
Year 1 (2008-2009) Year 2 (2009-2010)
Administertests
no pre-k (C)
Problem groups:
-T/C Attriters -C late enrollees

Data analytic strategy, step 1PS Sample: tested children; T children who attrited between year 1 and
year 2; C children who entered school after testing period or attritedbefore testing.
PS= Pr(child tested=1| ∑Xijk) =
where X is a vector of student-level covariates (race/ethnicity, gender, special needs, home zone, language, and siblings)
Calculate Inverse Probability Weights (IPW; Imbens & Woolridge, 2009; Murnane & Willet, 2010) and apply weights in a WLS RD regression model
48
1/(1 e( 0 1X ijk ))
49
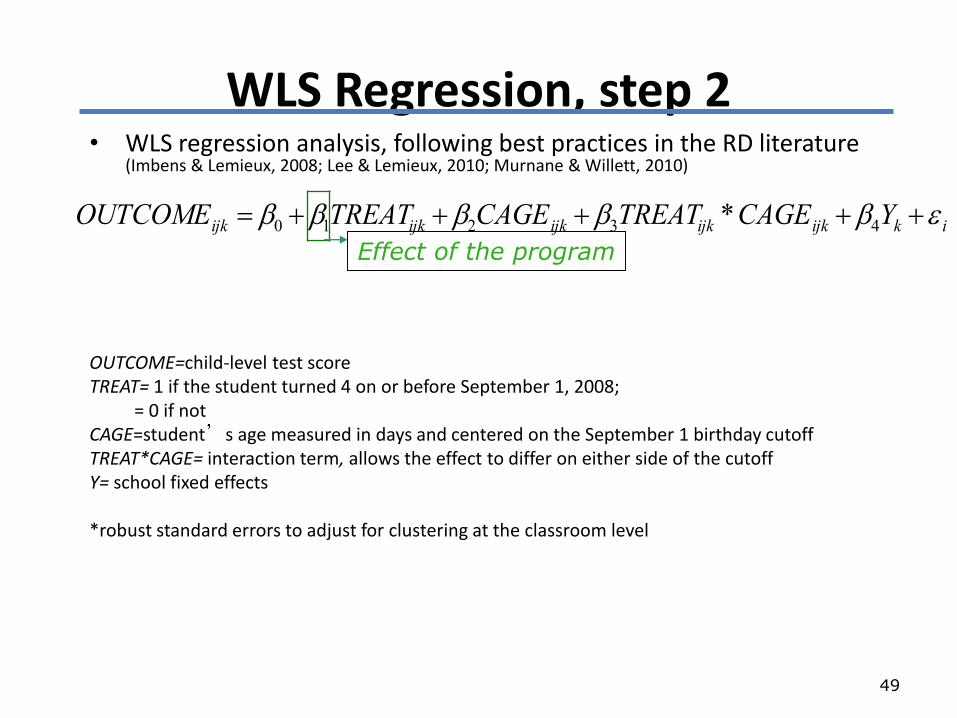
WLS Regression, step 2• WLS regression analysis, following best practices in the RD literature
(Imbens & Lemieux, 2008; Lee & Lemieux, 2010; Murnane & Willett, 2010)
OUTCOME=child-level test scoreTREAT= 1 if the student turned 4 on or before September 1, 2008;
= 0 if notCAGE=student s age measured in days and centered on the September 1 birthday cutoffTREAT*CAGE= interaction term, allows the effect to differ on either side of the cutoffY= school fixed effects
*robust standard errors to adjust for clustering at the classroom level
OUTCOMEijk 0 1TREATijk 2CAGEijk 3TREATijk *CAGEijk 4Yk iEffect of the program
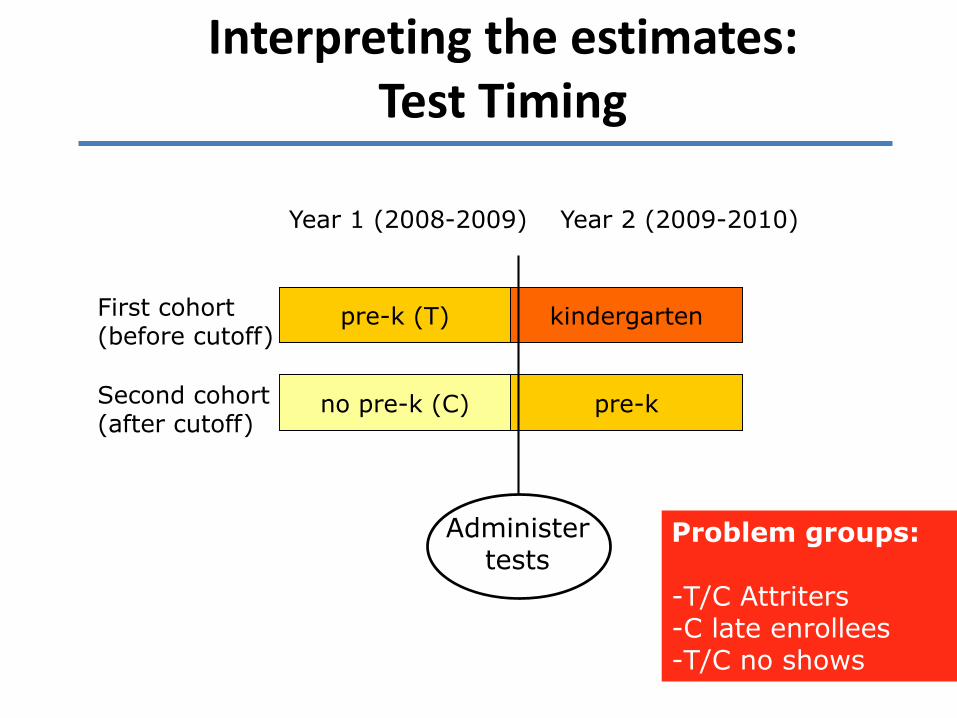
Interpreting the estimates: Test Timing
pre-k (T) kindergarten
pre-k
First cohort(before cutoff)
Second cohort(after cutoff)
Year 1 (2008-2009) Year 2 (2009-2010)
Administertests
no pre-k (C)
Problem groups:
-T/C Attriters -C late enrollees-T/C no shows
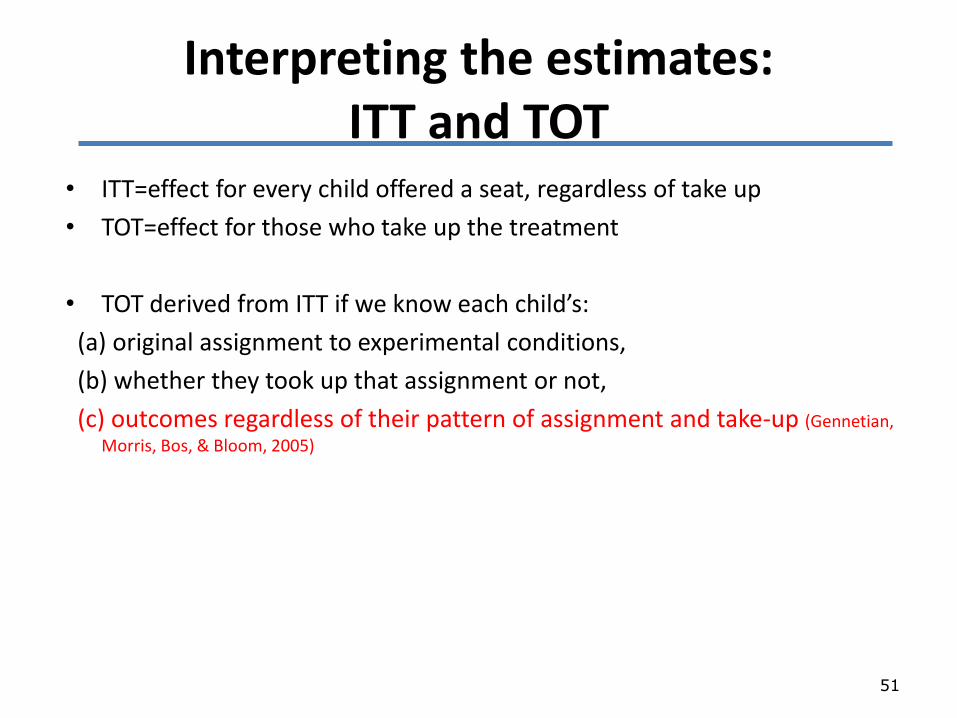
Interpreting the estimates: ITT and TOT
• ITT=effect for every child offered a seat, regardless of take up
• TOT=effect for those who take up the treatment
• TOT derived from ITT if we know each child’s:
(a) original assignment to experimental conditions,
(b) whether they took up that assignment or not,
(c) outcomes regardless of their pattern of assignment and take-up (Gennetian,
Morris, Bos, & Bloom, 2005)
51
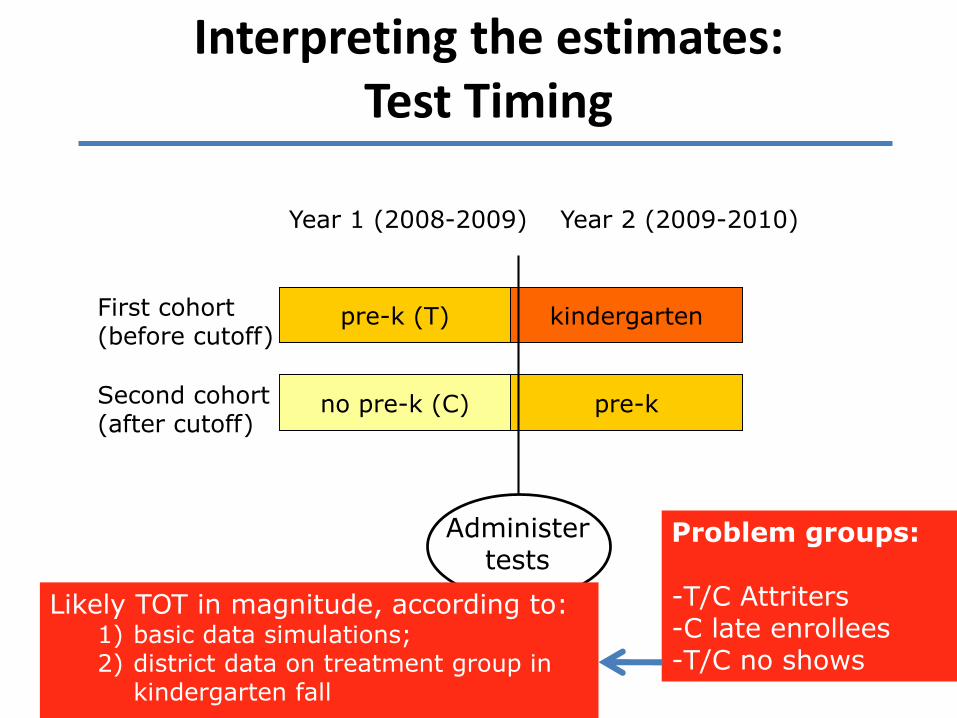
Interpreting the estimates: Test Timing
pre-k (T) kindergarten
pre-k
First cohort(before cutoff)
Second cohort(after cutoff)
Year 1 (2008-2009) Year 2 (2009-2010)
Administertests
no pre-k (C)
Problem groups:
-T/C Attriters -C late enrollees-T/C no shows
Likely TOT in magnitude, according to:1) basic data simulations; 2) district data on treatment group in
kindergarten fall

Defining “high quality”
• Structural features (class size, ratios, teacher ed and training)
• Process features (high quality interactions, rich learning opportunities)
• Structural quality sets the stage for process quality but alone isn’t sufficient (Yoshikawa et al., 2013)

Emotional Support Nationally is Good
0
1
2
3
4
5
6
7
CLASS Emotional Support CLASS InstructionalSupport
Boston pre-k
Tulsa pre-k
Tulsa CAP Head Start
Head Start
11-state Pre-k study
Chaudry, Morrissey, Weiland & Yoshikawa, 2016

0
1
2
3
4
5
6
7
CLASS Emotional Support CLASS InstructionalSupport
Boston pre-k
Tulsa pre-k
Tulsa CAP Head Start
Head Start
11-state Pre-k study
Instructional Support Nationally is Inadequate
Chaudry, Morrissey, Weiland & Yoshikawa, 2016

Appendix: Plot of the subgroup effect for free/reduced lunch: Mathematics
56

Appendix: Language and literacy sensitivity to bandwidth choice
57
PPVT WJ LW
BW 365+ 180 365+ 180
coeff. 9.00*** 7.85*** 3.45*** 2.61***
SE (1.81) (2.60) (0.55) (0.78)
E.S. 0.44 0.38 0.62 0.47
Spec. linear linear Linear + int.
linear
N 2018 969 2018 969
+ absolute min using C.V. procedure;

Appendix: Early math sensitivity to bandwidth choice
58
WJ AP REMA
BW 365+ 180 365 180 111+
coeff. 2.81*** 2.59*** 0.57*** 0.49*** 0.37*
SE (0.46) (0.62) (0.12) (0.15) (0.19)
E.S. 0.59 0.55 0.50 0.43 0.33
Spec. linear linear linear Linear, int.
Linear, int.
N 2018 969 2018 969 627
+ absolute min using C.V. procedure

Appendix: EF Working memory sensitivity to bandwidth choice
59
Backward Digit Span Forward Digit Span
BW 365 180 221+ 365 180+
coeff. 0.15* 0.16~ 0.19* 0.31** 0.46**
SE (0.07) (0.10) (0.098) (0.12) (0.18)
E.S. 0.24 0.26 0.31 0.24 0.35
Spec. linear linear linear linear linear
N 2018 969 1199 2018 969
+ absolute min using C.V. procedure

Appendix: EF Inhibitory control and attention sensitivity to bandwidth choice
60
Pencil Tap
(Inhibitory control)
Dimensional Change Card Sort
(Inhibitory control)
TOQ Attention
BW 365 180 287+ 365 180 300+ 365 180 147+
coeff. 1.39* 1.33~ 1.49* 1.25*** 1.34*** 1.21** 0.08 0.05 0.06
SE (0.54) (0.79) (0.57) (0.40) (0.54) (0.43) (0.07) (0.09) (0.10)
E.S. 0.21 0.21 0.23 0.28 0.30 0.27 0.11 0.07 0.08
Spec. Lin w int
Lin. Lin w int
Lin. Lin. Lin. Lin. Lin. Lin.
N 2018 969 1439 2018 969 1610 2018 969 799
+ absolute min using C.V. procedure

Appendix: Emotional development/regulation sensitivity to bandwidth choice
61
TOQ Positive Emotion
TOQ Impulse Control
Emotion Recognition Questionnaire
BW 365 180 332+ 365 180 129+ 365 180 293+
coeff 0.02 0.01 0.08 0.05 0.09 0.13 1.12* 1.22~ 0.84
SE (0.05) (0.07) (0.06) (0.11) (0.08) (0.09) (0.50) (0.70) (0.58)
E.S. 0.03 0.02 0.01 0.07 0.14 0.20 0.19 0.21 0.14
spec. Linear, int.
llinear, int
linear, int
cubic int
linear linear linear linear linear
N 2018 969 1795 2018 969 724 2018 969 1582

Appendix – Fidelity Procedures and outcomes: Teachers
• Fidelity data collected in 74 pre-k classrooms during the treatment year (2008-2009)
• Observations conducted by early childhood coaches
• Measures created in consultation with curriculum developers, other research teams, and early childhood coaches
• Separate measures for Opening the World of Learning (OWL), Building Blocks, and global quality.
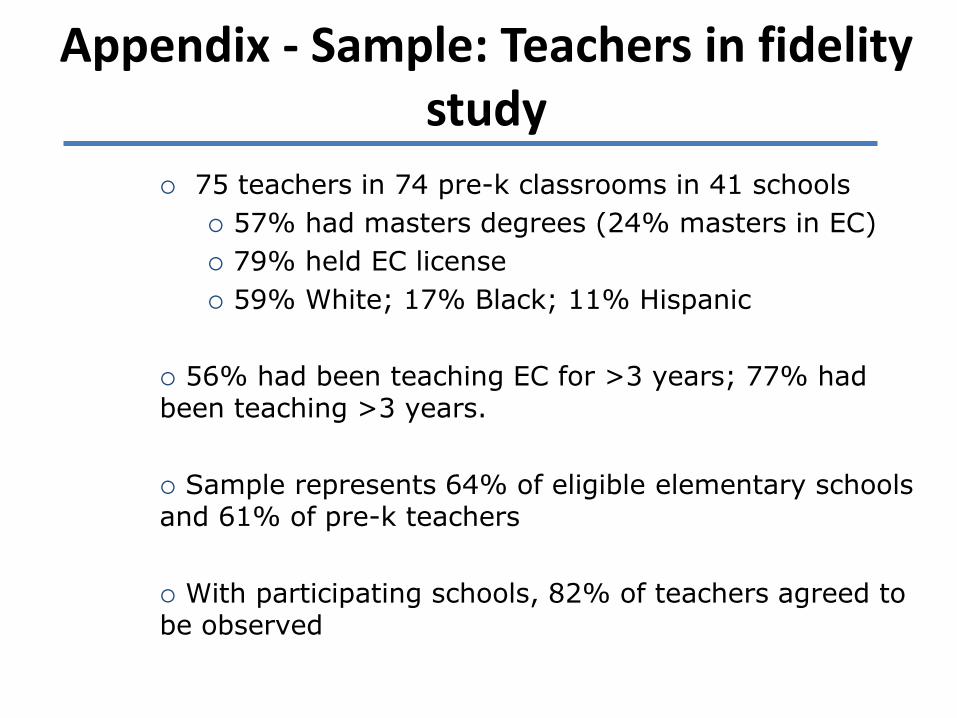
Appendix - Sample: Teachers in fidelity study
75 teachers in 74 pre-k classrooms in 41 schools
57% had masters degrees (24% masters in EC)
79% held EC license
59% White; 17% Black; 11% Hispanic
56% had been teaching EC for >3 years; 77% had been teaching >3 years.
Sample represents 64% of eligible elementary schools and 61% of pre-k teachers
With participating schools, 82% of teachers agreed to be observed
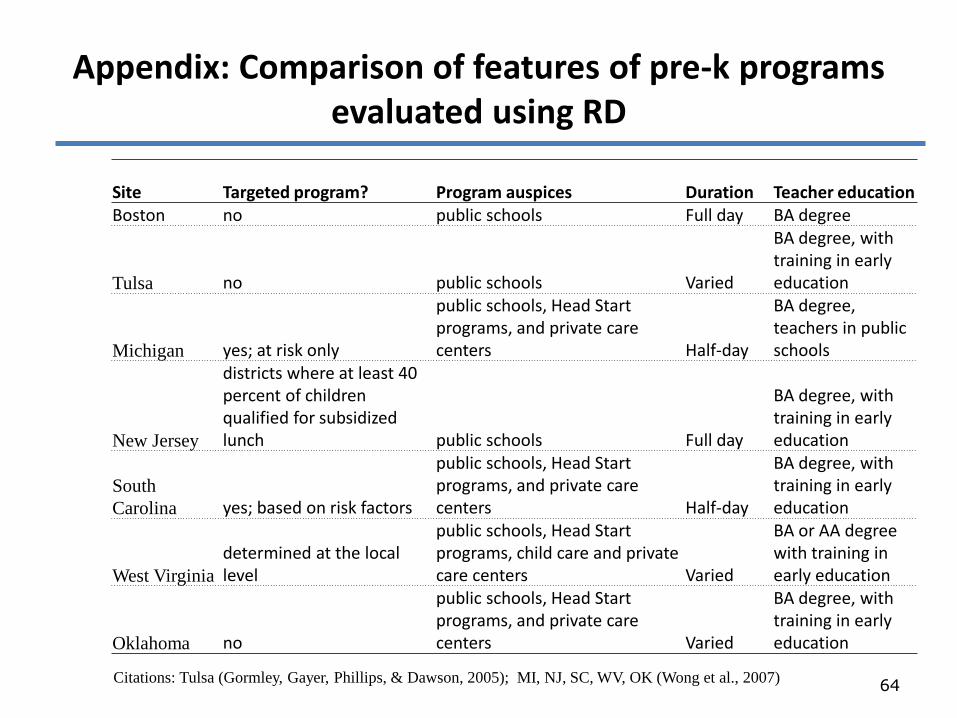
Appendix: Comparison of features of pre-k programs evaluated using RD
64
Site Targeted program? Program auspices Duration Teacher educationBoston no public schools Full day BA degree
Tulsa no public schools Varied
BA degree, with training in early education
Michigan yes; at risk only
public schools, Head Start programs, and private care centers Half-day
BA degree, teachers in public schools
New Jersey
districts where at least 40 percent of children qualified for subsidized lunch public schools Full day
BA degree, with training in early education
South
Carolina yes; based on risk factors
public schools, Head Start programs, and private care centers Half-day
BA degree, with training in early education
West Virginia
determined at the local level
public schools, Head Start programs, child care and private care centers Varied
BA or AA degree with training in early education
Oklahoma no
public schools, Head Start programs, and private care centers Varied
BA degree, with training in early education
Citations: Tulsa (Gormley, Gayer, Phillips, & Dawson, 2005); MI, NJ, SC, WV, OK (Wong et al., 2007)