impacts of - services transactions on cloud...
TRANSCRIPT
International Journal of Cloud Computing (ISSN 2326-7550) Vol. 2, No. 1, January-March 2014
15 http://www.hipore.com/ijcc/
IMPACTS OF MULTI-CLASS OVERSUBSCRIPTION ON REVENUES
AND PERFORMANCE IN THE CLOUD Rachel A. Householder and Robert C. Green
Bowling Green State University [email protected]
Abstract Rising trends in the number of customers turning to the cloud for their computing needs has made effective resource allocation imperative for cloud service providers. In order to maximize profits and reduce waste, providers have started to explore the role of oversubscribing cloud resources. However, the benefits of oversubscription in the cloud are not without inherent risks. This work attempts to unveil the different incentives, risks, and techniques behind oversubscription in a cloud infrastructure. The discrete event simulator CloudSim is used to compare the generated revenue and performance of oversubscribed and non-oversubscribed datacenters. The idea of multi-class service levels used in other overbooked industries is implemented in simulations modeling a priority class of VMs that pay a higher price for better performance. Three simulations are implemented. The first two compare the results of different VM allocation policies without VM migration. The third implements VM migration in an oversubscribed, power-aware datacenter. Results show that oversubscription using multi-class service levels has the potential to increase datacenter revenue, but the benefit comes with the risk of degraded QoS, especially for non-priority customers. Keywords: cloud computing; oversubscription; resource allocation; revenue; CloudSim
__________________________________________________________________________________________________________________
1. INTRODUCTION Utilizing cloud services to meet computing needs is a
concept that is rapidly gaining in popularity as ``in the
cloud'' has become a catchphrase in mainstream society.
According to NIST, ``Cloud computing is a model for
enabling convenient, on-demand access to a shared pool of
configurable computing resources (e.g. networks, servers,
storage applications, and services) that can be rapidly
provisioned and released with minimal management effort
or service provider interaction'' (I. S. Moreno & Xu, 2012).
The resources offered by cloud service providers (known
from here on out as CSPs) can be classified under one of
three service models: Software as a Service (SaaS), Platform
as a Service (PaaS), and Infrastructure as a Service (IaaS).
On the lowest level, IaaS provides access to resources
such as servers, storage, hardware, operating systems, and
networking. Unlike SaaS and PaaS, the customer has the
ability to configure these lower-level resources. IaaS has
become increasingly popular (Wo, Sun, Li, & Hu, 2012) as
it allows customers, especially companies and organizations,
to outsource their IT needs. These companies simply request
the computing resources they desire (Ghosh & Naik, 2012)
and CSPs provide those resources with a high level of
assurance of their reliability and availability. The
outsourcing of computing resources has several benefits for
customers. Services are offered on a pay-as-you-go basis,
allowing customers to pay only for the resources they use.
CSPs handle much of the IT infrastructure management
tasks that customers once had to support themselves.
Additionally, data and services in the cloud are widely
available through the Internet via a variety of devices.
With all of these benefits, the number of customers
looking to migrate to the cloud is on the rise and the ability
of CSPs to efficiently host as many clients as possible on a
fixed set of physical assets will be crucial to the future
success of their business (Williams et al., 2011). Cloud
services are supplied to clients through virtualization
creating the impression that each user has full access to a
seemingly unlimited supply of resources. In reality, a single
physical machine must divide its finite set of resources
amongst multiple virtual machines (VMs). Much research
has been dedicated to developing optimum resource
allocation strategies in a non-overbooked cloud. For
instance, Feng et al. (2012a) uses concepts of Queuing
Theory to maximize revenues and increase resource
utilization levels while adhering to Service Level
Agreement (SLA) constraints and He et al. (2012) employs
a multivariate probabilistic model to optimize resource
allocation. While these strategies have been shown to
improve utilization, a high percentage of resources still sit
idle at any given time (Toms & Tordsson, 2013). As a result,
oversubscription of cloud services has become an appealing
solution to further optimize cloud efficiency. Much work
has been done to investigate cloud oversubscription without
specifically measuring the impact on revenues, and little
work investigates the affects of priority classes on revenues
in an oversubscribed cloud. To address this need, this paper
contributes by using the simulation tool CloudSim to
investigate how adding a priority class of VMs to an
oversubscribed datacenter affects VM debt and QoS. The
rest of the paper is organized as follows: Section 2 provides
a brief literature review; Section 3 provides an overview of
the concept of oversubscription; Section 4 briefly discusses
the economics of cloud computing; Section 5 compares
doi: 10.29268/stcc.2014.2.1.2
International Journal of Cloud Computing (ISSN 2326-7550) Vol. 2, No. 1, January-March 2014
16 http://www.hipore.com/ijcc/
cloud computing to other industries that overbook resources;
Section 6 describes the motivations and tools used for the
simulations; Section 7 shows Experiment 1 and its results;
Section 8 discusses Experiment 2 and its results; Section 9
Compares Experiments 1 and 2; Section 10 overviews
Experiment 3 and its results Section 11 reviews some
limitations and future work; finally, Section 12 concludes.
2. LITERATURE REVIEWThis chapter reviews the major research literature in the
area of oversubscribed cloud computing as it pertains to this
study. For organizational purposes, the research in this area
has been generally split into nine different categories:
memory oversubscription, bandwidth oversubscription,
CPU oversubscription, energy efficiency, optimal resource
allocation, multi-class users, maximizing revenue in the
cloud, measuring performance impact, and safe overbooking.
2.1 MEMORY OVERSUBSCRIPTION
Of all the computing resources, the ability to effectively
oversubscribe memory provides a challenging problem for
researchers (Hines et al., 2011). In their overview of
oversubscription, Wang et al. (2012) show that both
quiescing and live migration can be used independently to
remediate overload in a memory oversubscribed cloud. As a
continuation of this work, the authors quiesce VMs with
lower work values first to allow VMs with higher work
values to perform normally and to reduce the number of
migrations needed. Williams et al. (2011) present
Overdriver in an attempt to reduce performance degradation
that comes with memory overload. They use a new method
called cooperative swap for transient overloads and VM
migration for sustained overloads. Hines et al. (2011)
present a framework called Ginkgo that can be used to
automate the redistribution of memory among VMs. Ginkgo
uses an application performance profile along with other
constraints, such as performance level thresholds established
by the SLA, as criteria for memory allocation decisions.
2.2 BANDWIDTH OVERSUBSCRIPTION Bandwidth is another resource that can be
oversubscribed. As the cloud gains in popularity, network
traffic continues to increase which can lead to bottlenecks
and latency (Breitgand & Epstein, 2012). Jain et al. (2012)
focus on remediating overload using VM migration in a tree
topology data center network. They concurrently consider
the load constraints of servers and the traffic capacity
constraints of the tree edges to develop algorithms that
relieve as many hot servers as the network will allow. They
do so by migrating a portion of their VMs to cold servers.
Guo et al. (2013) focus on optimizing the distribution of
network traffic and throughput using a load balancing
technique in a fat-tree data center network.
Breitgand and Epstein (2012) attempt to improve
bandwidth utilization by applying concepts of the Stochastic
Bin Packing problem (SBP). They suggest three algorithms
to allocate VMs belonging to a single SLA class so that the
probability of meeting bandwidth demands is at least the
minimum calculated value.
Wo et al. (2012) use a greedy-based VM placement
algorithm that is traffic-aware to improve the locality of
servers running the same application. They also introduce a
revenue model designed to determine the overbooking ratio
that will maximize profits by reducing the number of SLA
violations.
2.3 CPU OVERSUBSCRIPTION Zhang et al. (2012) consider a cloud that has
overcommitted its processor power. They introduce a VM
migration algorithm called Scattered that focuses on
pinpointing the best VMs for migration based on evaluation
of their workload degree of correlation. Using two
variations of migration, standard migration and VM swap,
Scattered is shown to limit the number of migrations
required to relieve overload and can tolerate larger
overcommit ratios.
2.4 ENERGY EFFICIENCY Moreno and Xu (2012) focus on the value of
overbooking for greener computing. Using a multi-layer
Neural Network, they attempt to predict resource usage
patterns by studying historical data and using the results to
develop optimal allocation algorithms. When overload does
occur a Largest VM First approach is used to select VMs for
migration. Moreno and Xu (2011) attempts to use cloud
oversubscription to promote energy efficiency in real-time
cloud datacenters. Their approach uses customer utilization
patterns to more safely overallocate resources and considers
SLA and energy consumption in the process.
2.5 OPTIMAL RESOURCE ALLOCATION Ghosh and Naik (2012) evaluate the history of CPU
usage of VMs to establish a one-sided tolerance limit that
represents a threshold of risk based on the probability of
overload and SLA violations. They propose that these
analytics can be applied to develop a smart risk-aware
resource allocation tool that can be used to place incoming
requests.
Tomas and Tordsson (2013) propose a new framework
for VM placement. An admission control module
determines if a new job request can be deployed.
Applications are monitored and profiled to help predict their
behavior and predominant type of resource usage (i.e. bursty
CPU or I/O). A smart overbooking scheduler then
determines the best location for the application to be
deployed.
Breitgand et al. (2012) approach optimizing resource
allocation by creating the extended SLA (eSLA) that
International Journal of Cloud Computing (ISSN 2326-7550) Vol. 2, No. 1, January-March 2014
17 http://www.hipore.com/ijcc/
provides a probability for successful VM launch in addition
to an availability probability. The eSLA allows for more
aggressive overcommit ratios without increasing the number
of eSLA violations.
2.6 MULTI-CLASS USERS Patouni et. al (2014) briefly discuss introducing a
fairness factor for allocating physical resources in the cloud
amongst multiple classes of users. However, their concept is
not fully developed and they do not consider
oversubscription.
2.7 MAXIMIZING REVENUE IN THE CLOUD Feng et al. (2012b) considers maximizing cloud
revenues by implementing dynamic resource allocation. The
allocation is based on SLA values and considers other
factors such as pricing mechanisms, arrival rates, service
rate, and available resources. However, it does not consider
oversubscription in their model nor does it consider multiple
class levels.
2.8 MEASURING PERFORMANCE IMPACT Hoeflin & Reeser (2012) attempts to quantify the impact
overbooking has on cloud performance. The relationship
between overbooking level and VM utilization is considered
as well monitoring parameters such as CPU utilization and
throughput. These are used to suggest reasonable levels of
oversubscription based on SLA constraints.
2.9 SAFE OVERBOOKING Luis (2014) explores safe overbooking methods that use
the concept of application brownout to help mitigate
performance degradation caused by overload. Tomas &
Tordsson (2014) attempts to implement a risk-aware
overbooking framework. Fuzzy logic is used to measure the
risk of overbooking decisions to help identify the
appropriate level of overbooking.
While all of these works consider topics related to
individual aspects of this research, none of them look at the
impact of overbooking on both performance and revenues in
a multi-class system. This is the primary contribution of this
work.
3. OVERVIEW OF OVERSUBSCRIPTION To oversubscribe a resource means to offer more of that
resource than there is actually capacity for under the
assumption most customers will not actually consume their
entire portion. The goal is to diminish the sum of unutilized
resources and thus increase profits. This section provides a
basic summary of oversubscription in other industries as
well as in the cloud. It also discusses the risks inherent to
employing oversubscription in a cloud computing system.
3.1 OVERSUBSCRIPTION IN OTHER INDUSTRIES
Oversubscribing resources is not a concept unique to
cloud computing. Hotels overbook rooms. When there are
less no-shows than expected, customers must downgrade
rooms or go to another hotel and are compensated for their
denial of services (Noone & Lee, 2011). The healthcare
industry overbooks doctors' time which can lead to
increased waiting time for customers and physician
overtime costs when all patients arrive for their
appointments (Zacharias & Pinedo, 2013). Airlines have
been known to overbook seats (Coughlan, 1999) and cargo
space (Singhaseni, Wu, & Ojiako, 2013). When more
customers show up than predicted, they are typically moved
to another flight which causes delays and other
inconveniences for the customer. To better accommodate
passengers when this occurs, airlines will sometimes form
alliances with their competitors to expand the number of
flights bumped customers can be moved to (Chen & Hao,
2013). The impact of this alliance can be taken into
consideration when developing overbooking policies.
Additionally, the class system can be taken into
consideration with first-class flights typically having lower
levels of overbooking than coach (Coughlan, 1999).
3.2 OVERSUBSCRIPTION IN CLOUD COMPUTING Like the lodging, healthcare, and airline industries, cloud
computing provides ample opportunity for oversubscription.
In recent years, companies have started to notice that they
are only utilizing a small portion of their available resources
(resources being memory, CPU, disk, and bandwidth
capacity). In fact, CSPs on average use only 53% of the
available memory, while CPU utilization is normally only at
40% in most datacenters (Toms & Tordsson, 2013).
Simulations done to study the CPU utilization patterns of
individual VMs have shown that 84% of VMs reach their
maximum utilization levels less than 20% of the time
(Ghosh & Naik, 2012). The underutilization of resources is
a major concern to most CSPs considering the amount of
resources required to run and maintain large datacenters.
Datacenters require a great deal of infrastructure that
consumes large amounts of power (Moreno & Xu, 2012).
Oversubscription helps to maximize resource utilization
which can in-turn help to reduce these costs and increase
profitability.
In the area of cloud computing, a cloud is said to be
oversubscribed when the sum of customers' requests for a
resource exceeds the available capacity. There can be
oversubscription on both the customer's end or the
provider's end (Williams et al., 2011). Oversubscription
stemming from the customer occurs when they do not
reserve enough computing power to meet their needs.
Oversubscription on the provider's end occurs when CSPs
book more requested capacity than they can actually support.
This type of oversubscription is more common than the
former as many customers tend to reserve more resources
than they need (Ghosh & Naik, 2012). Thus, this paper will
focus on overbooking by the CSP.
International Journal of Cloud Computing (ISSN 2326-7550) Vol. 2, No. 1, January-March 2014
18 http://www.hipore.com/ijcc/
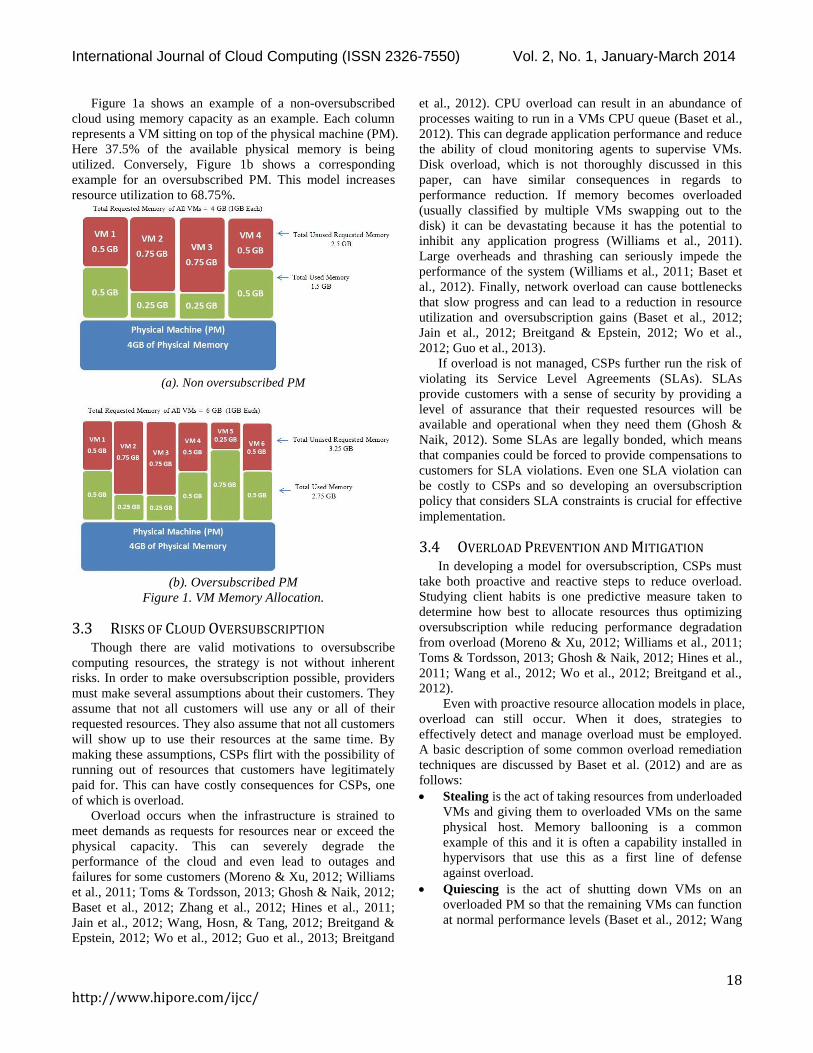
Figure 1a shows an example of a non-oversubscribed
cloud using memory capacity as an example. Each column
represents a VM sitting on top of the physical machine (PM).
Here 37.5% of the available physical memory is being
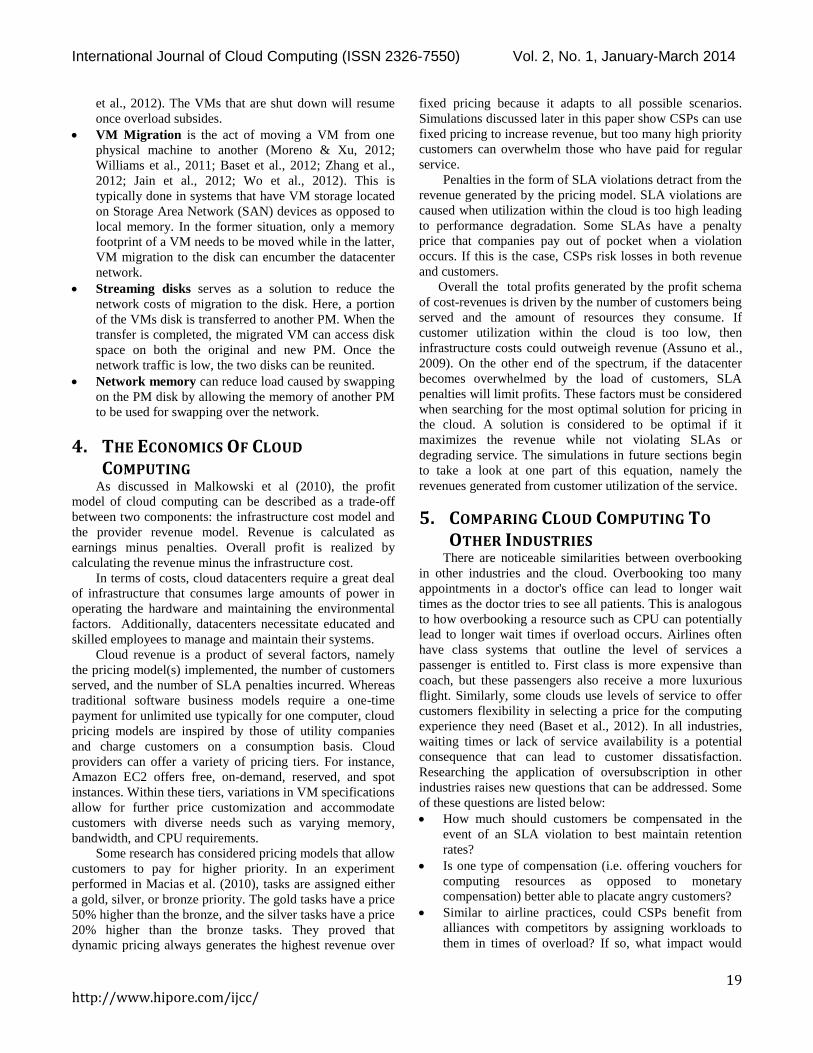
utilized. Conversely, Figure 1b shows a corresponding
example for an oversubscribed PM. This model increases
resource utilization to 68.75%.
(a). Non oversubscribed PM
(b). Oversubscribed PM
Figure 1. VM Memory Allocation.
3.3 RISKS OF CLOUD OVERSUBSCRIPTION Though there are valid motivations to oversubscribe
computing resources, the strategy is not without inherent
risks. In order to make oversubscription possible, providers
must make several assumptions about their customers. They
assume that not all customers will use any or all of their
requested resources. They also assume that not all customers
will show up to use their resources at the same time. By
making these assumptions, CSPs flirt with the possibility of
running out of resources that customers have legitimately
paid for. This can have costly consequences for CSPs, one
of which is overload.
Overload occurs when the infrastructure is strained to
meet demands as requests for resources near or exceed the
physical capacity. This can severely degrade the
performance of the cloud and even lead to outages and
failures for some customers (Moreno & Xu, 2012; Williams
et al., 2011; Toms & Tordsson, 2013; Ghosh & Naik, 2012;
Baset et al., 2012; Zhang et al., 2012; Hines et al., 2011;
Jain et al., 2012; Wang, Hosn, & Tang, 2012; Breitgand &
Epstein, 2012; Wo et al., 2012; Guo et al., 2013; Breitgand
et al., 2012). CPU overload can result in an abundance of
processes waiting to run in a VMs CPU queue (Baset et al.,
2012). This can degrade application performance and reduce
the ability of cloud monitoring agents to supervise VMs.
Disk overload, which is not thoroughly discussed in this
paper, can have similar consequences in regards to
performance reduction. If memory becomes overloaded
(usually classified by multiple VMs swapping out to the
disk) it can be devastating because it has the potential to
inhibit any application progress (Williams et al., 2011).
Large overheads and thrashing can seriously impede the
performance of the system (Williams et al., 2011; Baset et
al., 2012). Finally, network overload can cause bottlenecks
that slow progress and can lead to a reduction in resource
utilization and oversubscription gains (Baset et al., 2012;
Jain et al., 2012; Breitgand & Epstein, 2012; Wo et al.,
2012; Guo et al., 2013).
If overload is not managed, CSPs further run the risk of
violating its Service Level Agreements (SLAs). SLAs
provide customers with a sense of security by providing a
level of assurance that their requested resources will be
available and operational when they need them (Ghosh &
Naik, 2012). Some SLAs are legally bonded, which means
that companies could be forced to provide compensations to
customers for SLA violations. Even one SLA violation can
be costly to CSPs and so developing an oversubscription
policy that considers SLA constraints is crucial for effective
implementation.
3.4 OVERLOAD PREVENTION AND MITIGATION In developing a model for oversubscription, CSPs must
take both proactive and reactive steps to reduce overload.
Studying client habits is one predictive measure taken to
determine how best to allocate resources thus optimizing
oversubscription while reducing performance degradation
from overload (Moreno & Xu, 2012; Williams et al., 2011;
Toms & Tordsson, 2013; Ghosh & Naik, 2012; Hines et al.,
2011; Wang et al., 2012; Wo et al., 2012; Breitgand et al.,
2012).
Even with proactive resource allocation models in place,
overload can still occur. When it does, strategies to
effectively detect and manage overload must be employed.
A basic description of some common overload remediation
techniques are discussed by Baset et al. (2012) and are as
follows:
Stealing is the act of taking resources from underloaded
VMs and giving them to overloaded VMs on the same
physical host. Memory ballooning is a common
example of this and it is often a capability installed in
hypervisors that use this as a first line of defense
against overload.
Quiescing is the act of shutting down VMs on an
overloaded PM so that the remaining VMs can function
at normal performance levels (Baset et al., 2012; Wang
International Journal of Cloud Computing (ISSN 2326-7550) Vol. 2, No. 1, January-March 2014
19 http://www.hipore.com/ijcc/
et al., 2012). The VMs that are shut down will resume
once overload subsides.
VM Migration is the act of moving a VM from one
physical machine to another (Moreno & Xu, 2012;
Williams et al., 2011; Baset et al., 2012; Zhang et al.,
2012; Jain et al., 2012; Wo et al., 2012). This is
typically done in systems that have VM storage located
on Storage Area Network (SAN) devices as opposed to
local memory. In the former situation, only a memory
footprint of a VM needs to be moved while in the latter,
VM migration to the disk can encumber the datacenter
network.
Streaming disks serves as a solution to reduce the
network costs of migration to the disk. Here, a portion
of the VMs disk is transferred to another PM. When the
transfer is completed, the migrated VM can access disk
space on both the original and new PM. Once the
network traffic is low, the two disks can be reunited.
Network memory can reduce load caused by swapping
on the PM disk by allowing the memory of another PM
to be used for swapping over the network.
4. THE ECONOMICS OF CLOUD
COMPUTING As discussed in Malkowski et al (2010), the profit
model of cloud computing can be described as a trade-off
between two components: the infrastructure cost model and
the provider revenue model. Revenue is calculated as
earnings minus penalties. Overall profit is realized by
calculating the revenue minus the infrastructure cost.
In terms of costs, cloud datacenters require a great deal
of infrastructure that consumes large amounts of power in
operating the hardware and maintaining the environmental
factors. Additionally, datacenters necessitate educated and
skilled employees to manage and maintain their systems.
Cloud revenue is a product of several factors, namely
the pricing model(s) implemented, the number of customers
served, and the number of SLA penalties incurred. Whereas
traditional software business models require a one-time
payment for unlimited use typically for one computer, cloud
pricing models are inspired by those of utility companies
and charge customers on a consumption basis. Cloud
providers can offer a variety of pricing tiers. For instance,
Amazon EC2 offers free, on-demand, reserved, and spot
instances. Within these tiers, variations in VM specifications
allow for further price customization and accommodate
customers with diverse needs such as varying memory,
bandwidth, and CPU requirements.
Some research has considered pricing models that allow
customers to pay for higher priority. In an experiment
performed in Macias et al. (2010), tasks are assigned either
a gold, silver, or bronze priority. The gold tasks have a price
50% higher than the bronze, and the silver tasks have a price
20% higher than the bronze tasks. They proved that
dynamic pricing always generates the highest revenue over
fixed pricing because it adapts to all possible scenarios.
Simulations discussed later in this paper show CSPs can use
fixed pricing to increase revenue, but too many high priority
customers can overwhelm those who have paid for regular
service.
Penalties in the form of SLA violations detract from the
revenue generated by the pricing model. SLA violations are
caused when utilization within the cloud is too high leading
to performance degradation. Some SLAs have a penalty
price that companies pay out of pocket when a violation
occurs. If this is the case, CSPs risk losses in both revenue
and customers.
Overall the total profits generated by the profit schema
of cost-revenues is driven by the number of customers being
served and the amount of resources they consume. If
customer utilization within the cloud is too low, then
infrastructure costs could outweigh revenue (Assuno et al.,
2009). On the other end of the spectrum, if the datacenter
becomes overwhelmed by the load of customers, SLA
penalties will limit profits. These factors must be considered
when searching for the most optimal solution for pricing in
the cloud. A solution is considered to be optimal if it
maximizes the revenue while not violating SLAs or
degrading service. The simulations in future sections begin
to take a look at one part of this equation, namely the
revenues generated from customer utilization of the service.
5. COMPARING CLOUD COMPUTING TO
OTHER INDUSTRIES There are noticeable similarities between overbooking
in other industries and the cloud. Overbooking too many
appointments in a doctor's office can lead to longer wait
times as the doctor tries to see all patients. This is analogous
to how overbooking a resource such as CPU can potentially
lead to longer wait times if overload occurs. Airlines often
have class systems that outline the level of services a
passenger is entitled to. First class is more expensive than
coach, but these passengers also receive a more luxurious
flight. Similarly, some clouds use levels of service to offer
customers flexibility in selecting a price for the computing
experience they need (Baset et al., 2012). In all industries,
waiting times or lack of service availability is a potential
consequence that can lead to customer dissatisfaction.
Researching the application of oversubscription in other
industries raises new questions that can be addressed. Some
of these questions are listed below:
How much should customers be compensated in the
event of an SLA violation to best maintain retention
rates?
Is one type of compensation (i.e. offering vouchers for
computing resources as opposed to monetary
compensation) better able to placate angry customers?
Similar to airline practices, could CSPs benefit from
alliances with competitors by assigning workloads to
them in times of overload? If so, what impact would
International Journal of Cloud Computing (ISSN 2326-7550) Vol. 2, No. 1, January-March 2014
20 http://www.hipore.com/ijcc/
that have on overbooking models when compared to
more traditional models?
Can having levels of service similar to airline classes
improve overbooking policies by implementing varying
degrees of overbooking to the different levels?
The answers to these questions may give CSPs an edge
in the highly competitive market that is outsourcing
computing power, yet there are many ways in which cloud-
based oversubscription differs from other industries. Other
industries tend to maximize oversubscription by optimizing
a single primary resource. CSPs can oversubscribe several
resources with hopes to optimize the use of existing
computing infrastructures. When these oversubscription
methods fail, the results may be felt by all subscribers of the
service. Outside of the cloud, the impact of oversubscription
is not always universal. For this reason, proper optimization
of resources within the cloud is extremely important as it
allows providers to offer competitive pricing and also
ensures customer satisfaction.
6. SIMULATING THE EFFECTS OF
OVERSUBSCRIPTIONMuch research on oversubscription focuses on
maximizing resource utilization without exploring the
economic effects in detail. Thus, the simulation tool
CloudSim is used to investigate the difference in revenues
and QoS between oversubscribed and non-oversubscribed
datacenters as a first step towards this goal. Inspired by the
multi-class service model of airlines, additional simulations
are employed to examine these metrics in a priority class
scenario. The simulations attempt to shed light on the
answers to three main research questions: 1) Does
oversubscribing the datacenter CPU have the potential to
increase revenue? 2) Does adding priority to the
oversubscription scheduling policy have the potential to
increase revenue? 3) How does giving priority to some
VMs in an oversubscribed datacenter affect the performance
and debt of both the priority and non-priority VMs?
6.1 CLOUDSIM CloudSim is a discrete event simulator built upon
GridSim that allows for the simulation of virtualized cloud
computing environments. The version of CloudSim used in
these experiments is 3.03.
Experiments 1 and 2 focus on utilizing different VM
scheduling policies within the CloudSim framework,
namely the TimeShared, TimeSharedOverSubscription, and
the TimeSharedOverSubscriptionPriority policies, the last
of which was developed for this research. Experiment 3
focuses on adjusting the power VM allocation policy so that
the TimeSharedOverSubscriptionPriority VM scheduling
policy can be implemented in a power-aware datacenter
with VM migration turned on. Experiment 3 utilizes the
power classes within CloudSim that are introduced in
(Beloglazov & Buyya, 2012).
6.2 CALCULATING DEBT In the simulations, the base price of a regular VM
instance is $.09 per hour. This is the same as the cost of a
standard small, pay-as-you-go VM instance on Windows
Azure.1 For priority VMs, the price is $0.15 per hour. The
price set for priority VMs is intended to allow comparison
of revenues in the priority and non-priority oversubscription
configurations. However, further research may explore the
optimum price for a priority instance given the factors that
affect revenues.
As is typical with most cloud IaaS providers, customers
are only charged for the time that their instances are running.
The simulations follow this precedent by only charging
VMs for the total actual CPU time they use. However, in the
simulations, CPU time is not rounded up to the next hour as
is the case with many IaaS providers.2 3
The calculations
used for computing the total datacenter debt are represented
by the formula below.
𝐷 = 𝑐𝑛 ∑𝑡𝑛
3600𝑣𝑛∈𝑉
+ 𝑐𝑝 ∑𝑡𝑝
3600𝑣𝑝∈𝑉
(1)
where:
𝐷 = Total Datacenter Debt 𝑉 = Set of all VMs in the Datacenter
𝑣𝑛 = Subset of VMs that are non-priority𝑣𝑝 = Subset of VMs that are priority
𝑐𝑛 = Hourly charge for a non-priority VM𝑐𝑝 = Hourly charge for a priority VM
𝑡𝑛 = Cumulative CPU time for a non-priority VM𝑡𝑝 = Cumulative CPU time for a priority VM
7. EXPERIMENT 1: SCALING INITIAL MIPSALLOCATION
The first Experiment was initially presented in
Householder et al. (2014). As an extension, this work
conducts the simulations using 500 hosts. In Experiment 1,
the initial mips allocation is used to scale back non-priority
VMs.
7.1 SIMULATION SETUP In Experiment 1, three main scenarios are simulated and
compared. In the first scenario, the workloads are executed
using a time-shared (TS) VM scheduling policy that does
not allow for oversubscription. All VMs are given 6,000
1 http://www.windowsazure.com/en-
us/pricing/details/virtual-machines/ 2http://www.rackspace.com/cloud/servers/pricing/
3 http://www.rackspace.com/cloud/servers/pricing/
International Journal of Cloud Computing (ISSN 2326-7550) Vol. 2, No. 1, January-March 2014
21 http://www.hipore.com/ijcc/
mips per physical element (PE) and are charged $0.09 per
hour. In the second scenario, the time-shared
oversubscription (TSO) VM scheduling policy is employed
in a non-priority setting. All VMs are allotted 6,000 mips
per PE and are charged at a rate of $0.09 per hour. In the
third scenario, the TSO VM scheduling policy is also
employed, but a percentage of the VMs are given priority
over the others so that their jobs run faster than they
typically would in a non-priority configuration.
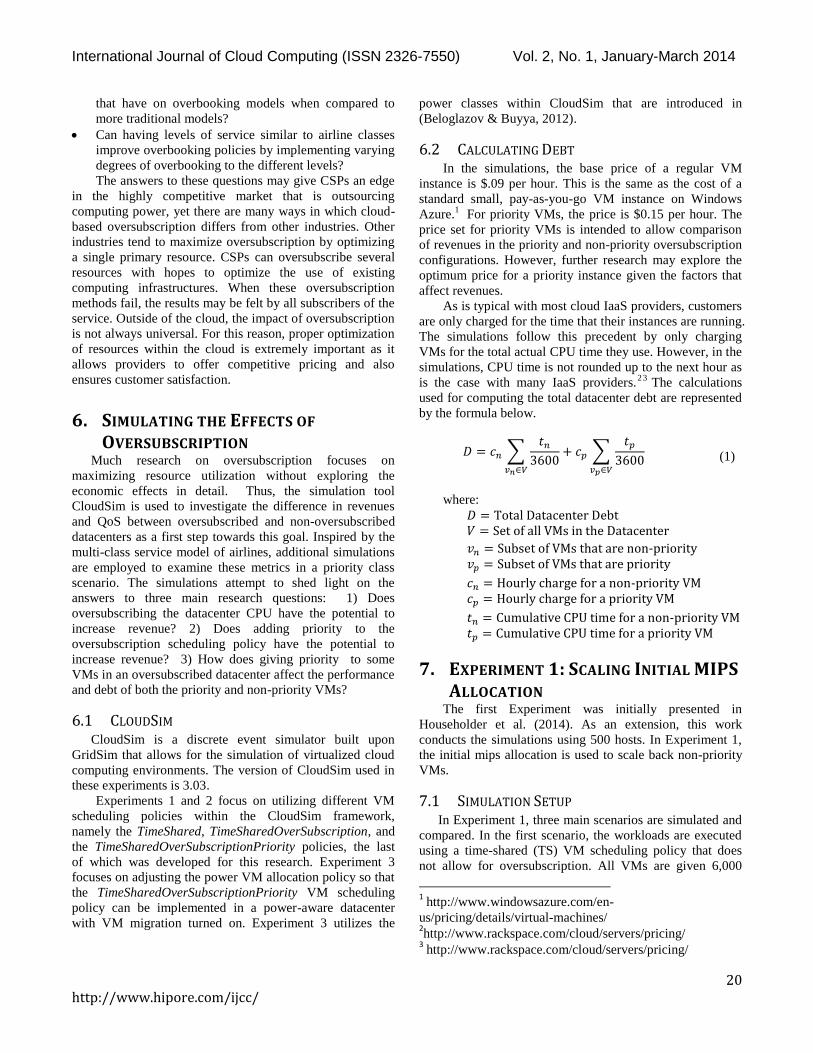
Table 1. Cost and MIPS of Priority and Non-Priority VMs.
VM Instance Type Price Per Hour ($) MIPS
Non-Priority 0.09 5,000
Priority 0.15 6,000
In order to give a subset of the VMs priority, they are
allotted 6,000 mips per PE while the other non-priority VMs
are scaled back to 5,000 mips per PE. The priority VMs are
charged $0.15 per hour while the non-priority VMs are still
charged $0.09 per hour. The differences between priority
and non-priority VM instances can be seen in Table 1.
Each simulation sets up a single datacenter comprised of
500 physical hosts. Each host is given 10 GB/s of
bandwidth, 16 GB of RAM, and 1024 GB of storage. Each
host is also allocated 48,000 mips distributed across 8 cores,
allowing each core up to 6,000 mips. The hosts are
dynamically carved into VMs using
VMAllocationPolicySimple which assigns a VM to the host
with the fewest cores currently in use (Calheiros et al.,
2011). Each VM is given 100 MB/s of bandwidth, 2 GB of
RAM, and 10 GB of storage. Additionally, each VM is
allocated 2 cores. mips per core are allocated to each VM
based on the VM instance type as is noted in Table 1. The
configurations for the hosts and VMs can be seen in Table 2.
Table 2. Experiment 1 Specifications.
Resources Host VM
Bandwidth (MB/s) 10,240 100
RAM (GB) 16 2
Storage 1,024 10
MIPS 48,000
Cores (PEs) 8 2
Each scenario is tested using three different workload
files obtained from the Parallel Workloads Archive.4 These
files represent the logs of actual workloads ran on real
systems and, in this study, consist of the following three
workloads: Workload 1 (NASA-iPSC-1993-3.1-cln.swf.gz),
Workload 2 (OSC-Clust-2000-3.1-cln.swf.gz), and
Workload 3 (LLNL-Atlas-2006-2.1-cln.swf.gz).
The workloads are used to generate cloudlets which are
jobs assigned to the VMs (Calheiros et al., 2011). Within a
VM, the cloudlets are scheduled using the
CloudletSchedulerTimeShared scheduling policy that
4 http://www.cs.huji.ac.il/labs/parallel/workload/
implements a round robin algorithm. For each workload,
simulations are run for 5 different configurations. These
configurations include time-shared (TS), time-shared
oversubscription non-priority (TSO-NP), time-shared
oversubscription with 10% of the VMs given priority (TSO-
P 10%), time-shared oversubscription with 20% of the VMs
given priority (TSO-P 20%), and time-shared
oversubscription with 40% of the VMs given priority (TSO-
P 40%). For each of these configurations, simulations for
1000, 2000, 3000, 4000, and 5000 VMs are run.
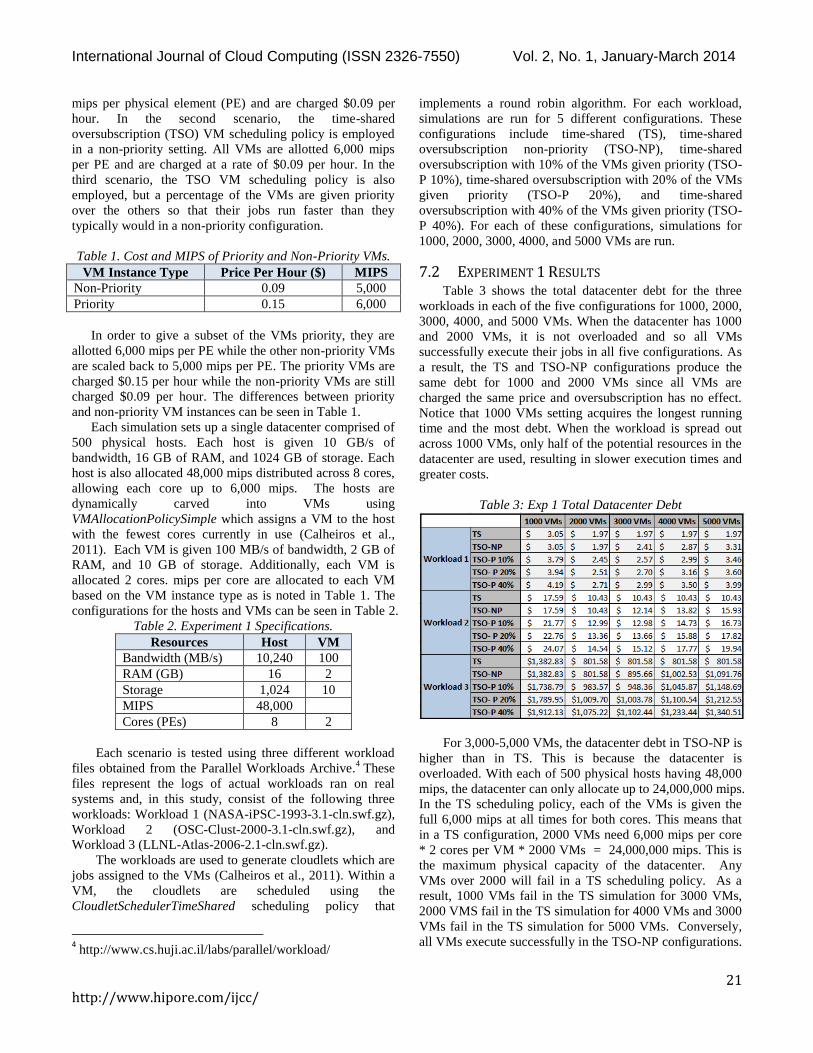
7.2 EXPERIMENT 1 RESULTS Table 3 shows the total datacenter debt for the three
workloads in each of the five configurations for 1000, 2000,
3000, 4000, and 5000 VMs. When the datacenter has 1000
and 2000 VMs, it is not overloaded and so all VMs
successfully execute their jobs in all five configurations. As
a result, the TS and TSO-NP configurations produce the
same debt for 1000 and 2000 VMs since all VMs are
charged the same price and oversubscription has no effect.
Notice that 1000 VMs setting acquires the longest running
time and the most debt. When the workload is spread out
across 1000 VMs, only half of the potential resources in the
datacenter are used, resulting in slower execution times and
greater costs.
Table 3: Exp 1 Total Datacenter Debt
For 3,000-5,000 VMs, the datacenter debt in TSO-NP is
higher than in TS. This is because the datacenter is
overloaded. With each of 500 physical hosts having 48,000
mips, the datacenter can only allocate up to 24,000,000 mips.
In the TS scheduling policy, each of the VMs is given the
full 6,000 mips at all times for both cores. This means that
in a TS configuration, 2000 VMs need 6,000 mips per core
* 2 cores per VM * 2000 VMs = 24,000,000 mips. This is
the maximum physical capacity of the datacenter. Any
VMs over 2000 will fail in a TS scheduling policy. As a
result, 1000 VMs fail in the TS simulation for 3000 VMs,
2000 VMS fail in the TS simulation for 4000 VMs and 3000
VMs fail in the TS simulation for 5000 VMs. Conversely,
all VMs execute successfully in the TSO-NP configurations.
International Journal of Cloud Computing (ISSN 2326-7550) Vol. 2, No. 1, January-March 2014
22 http://www.hipore.com/ijcc/
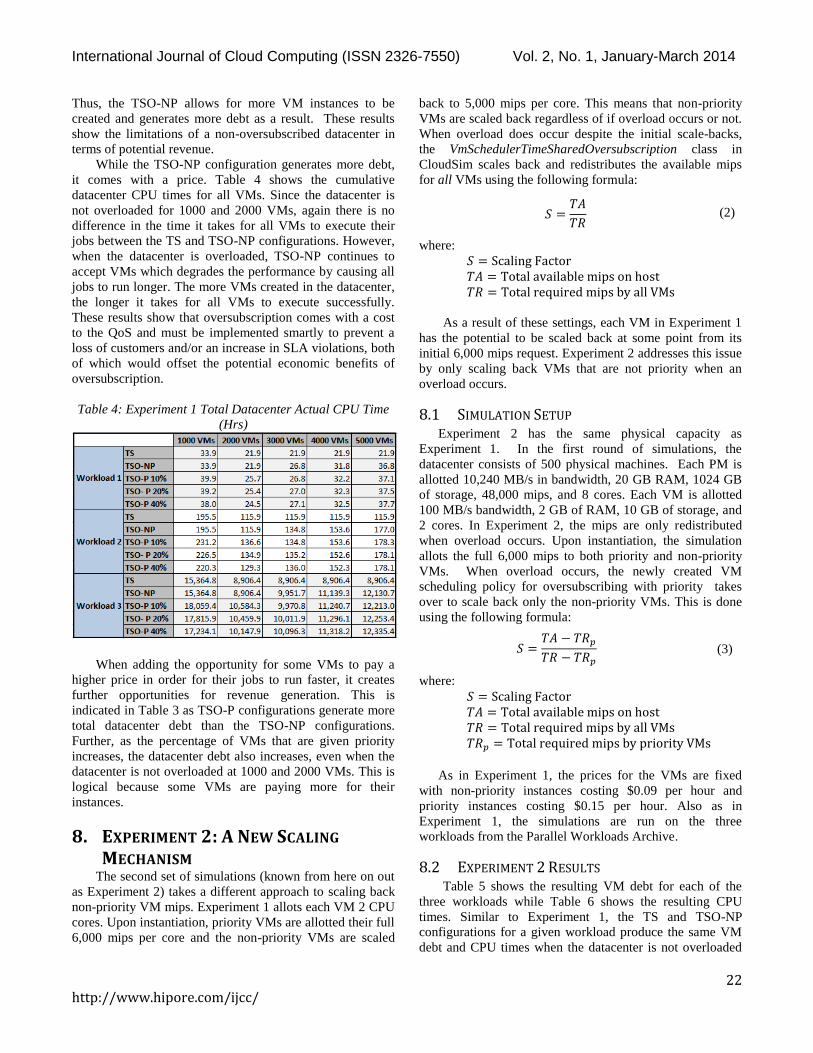
Thus, the TSO-NP allows for more VM instances to be
created and generates more debt as a result. These results
show the limitations of a non-oversubscribed datacenter in
terms of potential revenue.
While the TSO-NP configuration generates more debt,
it comes with a price. Table 4 shows the cumulative
datacenter CPU times for all VMs. Since the datacenter is
not overloaded for 1000 and 2000 VMs, again there is no
difference in the time it takes for all VMs to execute their
jobs between the TS and TSO-NP configurations. However,
when the datacenter is overloaded, TSO-NP continues to
accept VMs which degrades the performance by causing all
jobs to run longer. The more VMs created in the datacenter,
the longer it takes for all VMs to execute successfully.
These results show that oversubscription comes with a cost
to the QoS and must be implemented smartly to prevent a
loss of customers and/or an increase in SLA violations, both
of which would offset the potential economic benefits of
oversubscription.
Table 4: Experiment 1 Total Datacenter Actual CPU Time
(Hrs)
When adding the opportunity for some VMs to pay a
higher price in order for their jobs to run faster, it creates
further opportunities for revenue generation. This is
indicated in Table 3 as TSO-P configurations generate more
total datacenter debt than the TSO-NP configurations.
Further, as the percentage of VMs that are given priority
increases, the datacenter debt also increases, even when the
datacenter is not overloaded at 1000 and 2000 VMs. This is
logical because some VMs are paying more for their
instances.
8. EXPERIMENT 2: A NEW SCALING
MECHANISM The second set of simulations (known from here on out
as Experiment 2) takes a different approach to scaling back
non-priority VM mips. Experiment 1 allots each VM 2 CPU
cores. Upon instantiation, priority VMs are allotted their full
6,000 mips per core and the non-priority VMs are scaled
back to 5,000 mips per core. This means that non-priority
VMs are scaled back regardless of if overload occurs or not.
When overload does occur despite the initial scale-backs,
the VmSchedulerTimeSharedOversubscription class in
CloudSim scales back and redistributes the available mips
for all VMs using the following formula:
𝑆 =𝑇𝐴
𝑇𝑅 (2)
where:
𝑆 = Scaling Factor
𝑇𝐴 = Total available mips on host 𝑇𝑅 = Total required mips by all VMs
As a result of these settings, each VM in Experiment 1
has the potential to be scaled back at some point from its
initial 6,000 mips request. Experiment 2 addresses this issue
by only scaling back VMs that are not priority when an
overload occurs.
8.1 SIMULATION SETUP Experiment 2 has the same physical capacity as
Experiment 1. In the first round of simulations, the
datacenter consists of 500 physical machines. Each PM is
allotted 10,240 MB/s in bandwidth, 20 GB RAM, 1024 GB
of storage, 48,000 mips, and 8 cores. Each VM is allotted
100 MB/s bandwidth, 2 GB of RAM, 10 GB of storage, and
2 cores. In Experiment 2, the mips are only redistributed
when overload occurs. Upon instantiation, the simulation
allots the full 6,000 mips to both priority and non-priority
VMs. When overload occurs, the newly created VM
scheduling policy for oversubscribing with priority takes
over to scale back only the non-priority VMs. This is done
using the following formula:
𝑆 =𝑇𝐴 − 𝑇𝑅𝑝
𝑇𝑅 − 𝑇𝑅𝑝
(3)
where:
𝑆 = Scaling Factor
𝑇𝐴 = Total available mips on host 𝑇𝑅 = Total required mips by all VMs
𝑇𝑅𝑝 = Total required mips by priority VMs
As in Experiment 1, the prices for the VMs are fixed
with non-priority instances costing $0.09 per hour and
priority instances costing $0.15 per hour. Also as in
Experiment 1, the simulations are run on the three
workloads from the Parallel Workloads Archive.
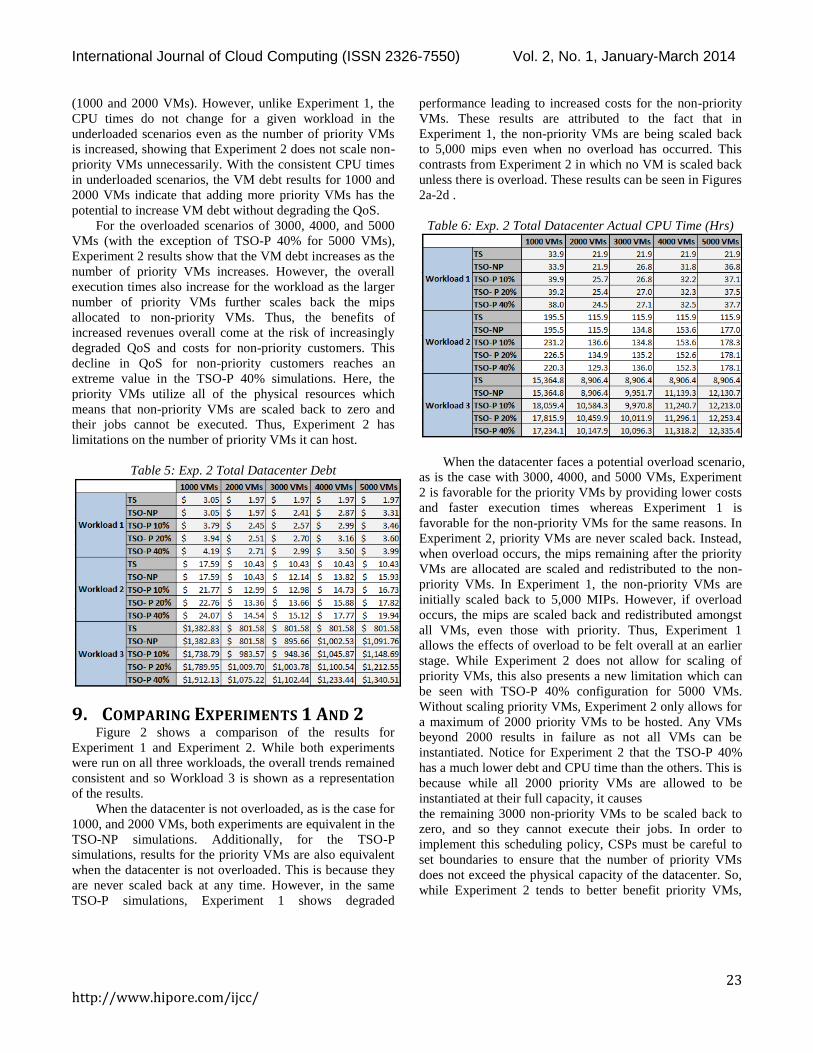
8.2 EXPERIMENT 2 RESULTS Table 5 shows the resulting VM debt for each of the
three workloads while Table 6 shows the resulting CPU
times. Similar to Experiment 1, the TS and TSO-NP
configurations for a given workload produce the same VM
debt and CPU times when the datacenter is not overloaded
International Journal of Cloud Computing (ISSN 2326-7550) Vol. 2, No. 1, January-March 2014
23 http://www.hipore.com/ijcc/
(1000 and 2000 VMs). However, unlike Experiment 1, the
CPU times do not change for a given workload in the
underloaded scenarios even as the number of priority VMs
is increased, showing that Experiment 2 does not scale non-
priority VMs unnecessarily. With the consistent CPU times
in underloaded scenarios, the VM debt results for 1000 and
2000 VMs indicate that adding more priority VMs has the
potential to increase VM debt without degrading the QoS.
For the overloaded scenarios of 3000, 4000, and 5000
VMs (with the exception of TSO-P 40% for 5000 VMs),
Experiment 2 results show that the VM debt increases as the
number of priority VMs increases. However, the overall
execution times also increase for the workload as the larger
number of priority VMs further scales back the mips
allocated to non-priority VMs. Thus, the benefits of
increased revenues overall come at the risk of increasingly
degraded QoS and costs for non-priority customers. This
decline in QoS for non-priority customers reaches an
extreme value in the TSO-P 40% simulations. Here, the
priority VMs utilize all of the physical resources which
means that non-priority VMs are scaled back to zero and
their jobs cannot be executed. Thus, Experiment 2 has
limitations on the number of priority VMs it can host.
Table 5: Exp. 2 Total Datacenter Debt
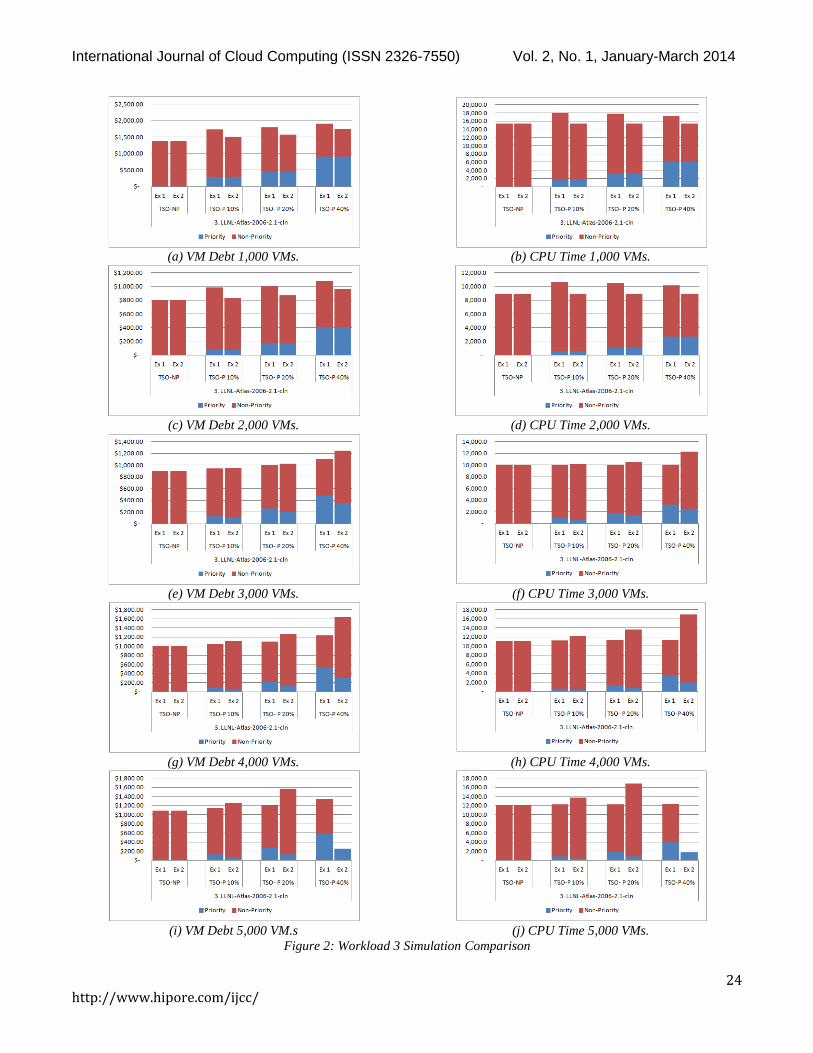
9. COMPARING EXPERIMENTS 1 AND 2Figure 2 shows a comparison of the results for
Experiment 1 and Experiment 2. While both experiments
were run on all three workloads, the overall trends remained
consistent and so Workload 3 is shown as a representation
of the results.
When the datacenter is not overloaded, as is the case for
1000, and 2000 VMs, both experiments are equivalent in the
TSO-NP simulations. Additionally, for the TSO-P
simulations, results for the priority VMs are also equivalent
when the datacenter is not overloaded. This is because they
are never scaled back at any time. However, in the same
TSO-P simulations, Experiment 1 shows degraded
performance leading to increased costs for the non-priority
VMs. These results are attributed to the fact that in
Experiment 1, the non-priority VMs are being scaled back
to 5,000 mips even when no overload has occurred. This
contrasts from Experiment 2 in which no VM is scaled back
unless there is overload. These results can be seen in Figures
2a-2d .
Table 6: Exp. 2 Total Datacenter Actual CPU Time (Hrs)
When the datacenter faces a potential overload scenario,
as is the case with 3000, 4000, and 5000 VMs, Experiment
2 is favorable for the priority VMs by providing lower costs
and faster execution times whereas Experiment 1 is
favorable for the non-priority VMs for the same reasons. In
Experiment 2, priority VMs are never scaled back. Instead,
when overload occurs, the mips remaining after the priority
VMs are allocated are scaled and redistributed to the non-
priority VMs. In Experiment 1, the non-priority VMs are
initially scaled back to 5,000 MIPs. However, if overload
occurs, the mips are scaled back and redistributed amongst
all VMs, even those with priority. Thus, Experiment 1
allows the effects of overload to be felt overall at an earlier
stage. While Experiment 2 does not allow for scaling of
priority VMs, this also presents a new limitation which can
be seen with TSO-P 40% configuration for 5000 VMs.
Without scaling priority VMs, Experiment 2 only allows for
a maximum of 2000 priority VMs to be hosted. Any VMs
beyond 2000 results in failure as not all VMs can be
instantiated. Notice for Experiment 2 that the TSO-P 40%
has a much lower debt and CPU time than the others. This is
because while all 2000 priority VMs are allowed to be
instantiated at their full capacity, it causes
the remaining 3000 non-priority VMs to be scaled back to
zero, and so they cannot execute their jobs. In order to
implement this scheduling policy, CSPs must be careful to
set boundaries to ensure that the number of priority VMs
does not exceed the physical capacity of the datacenter. So,
while Experiment 2 tends to better benefit priority VMs,
International Journal of Cloud Computing (ISSN 2326-7550) Vol. 2, No. 1, January-March 2014
24 http://www.hipore.com/ijcc/
(a) VM Debt 1,000 VMs.
(c) VM Debt 2,000 VMs.
(e) VM Debt 3,000 VMs.
(g) VM Debt 4,000 VMs.
(i) VM Debt 5,000 VM.s
(b) CPU Time 1,000 VMs.
(d) CPU Time 2,000 VMs.
(f) CPU Time 3,000 VMs.
(h) CPU Time 4,000 VMs.
(j) CPU Time 5,000 VMs.
Figure 2: Workload 3 Simulation Comparison
International Journal of Cloud Computing (ISSN 2326-7550) Vol. 2, No. 1, January-March 2014
25 http://www.hipore.com/ijcc/
Experiment 1 has the potential to host more VMs resulting
in higher potential for oversubscription.
Both Experiments 1 and 2 indicate that allowing some
VMs to pay more for priority allocation has the potential to
increase revenues. Unfortunately these benefits come at the
risk of SLA violations due to decreased performance.
Additionally, some of the increased VM debt generated
comes from charging non-priority VMs for extra CPU time
acquired due to their resources being scaled back. This
raises the question of fairness to non-priority VMs.
If implemented in a real datacenter, the higher costs and
extended execution times may lead to unhappy customers
that will seek other CSPs for further requests. In the next
experiment, some of the concerns regarding fairness to non-
priority VMs and SLA violations are addressed.
10. EXPERIMENT 3: OVERSUBSCRIPTION
WITH VM MIGRATION The third set of simulations (known from here as
Experiment 3) utilizes the VM scheduling policy
implemented in Experiment 2 in conjunction with VM
migration in a power-aware datacenter. With this
combination, non-priority VMs can be scaled back to allow
a PM to host more VMs. When a host becomes over-utilized
past a certain threshold value, VMs can be migrated from
the over-utilized host to an underutilized host. Additionally,
when all VMs from an under-utilized host can be migrated,
the migration is implemented and the newly empty under-
utilized host is turned off to conserve energy.
10.1 SIMULATION SETUP The migration simulations implement the power classes
that can be found in CloudSim 3.0 and were developed in
Beloglazov and Buyya (2012). In these simulations, there
are 250 hosts. Each host is allotted 48,000 mips and 8 cores
which means there are 6,000 mips/core. Hosts are given 18
GB of RAM, 1 Gbit/s of bandwidth, and 1000 GB of
storage. In the datacenter, half of the hosts are HP ProLiant
ML110 G4 servers and the other half are HP ProLiant ML
110 G5 servers. A power model is implemented that
classifies the power consumption for each server type at
different load levels. These consumption values for each
server are based on real data. The Hosts are carved into
homogeneous virtual machines. Each VM is given 2 PEs
and 6,000 mips/PE. Each VM is also allotted 1.7 GB of
RAM and 0.1 Gbit/s of bandwidth.
PlanetLab Workloads. For these simulations,
cloudlets are generated using the dynamic cloudlet
scheduling policy in CloudSim which creates a VM to host
each job in the workload. The workloads used for these
experiments are two PlanetLab workloads. The description
of the workloads can be seen in Table 7. Each workload
represents a workload trace for 1 day from a random server
in PlanetLab (Beloglazov & Buyya, 2012). Inside each
workload file, there are jobs that represent data from virtual
machines on that given server in the given day. These jobs
will become cloudlets and each cloudlet is hosted by a
single VM. Inside of each job file, there are 288 random
samples of values that indicate the CPU utilization
percentage for that VM in 5 minute intervals.
Table 7. Description of Workloads. Date Name Number of
VMs
Mean
Utilization
03/06/2011 20110306 898 16.83%
04/20/2011 20110420 1033 15.21%
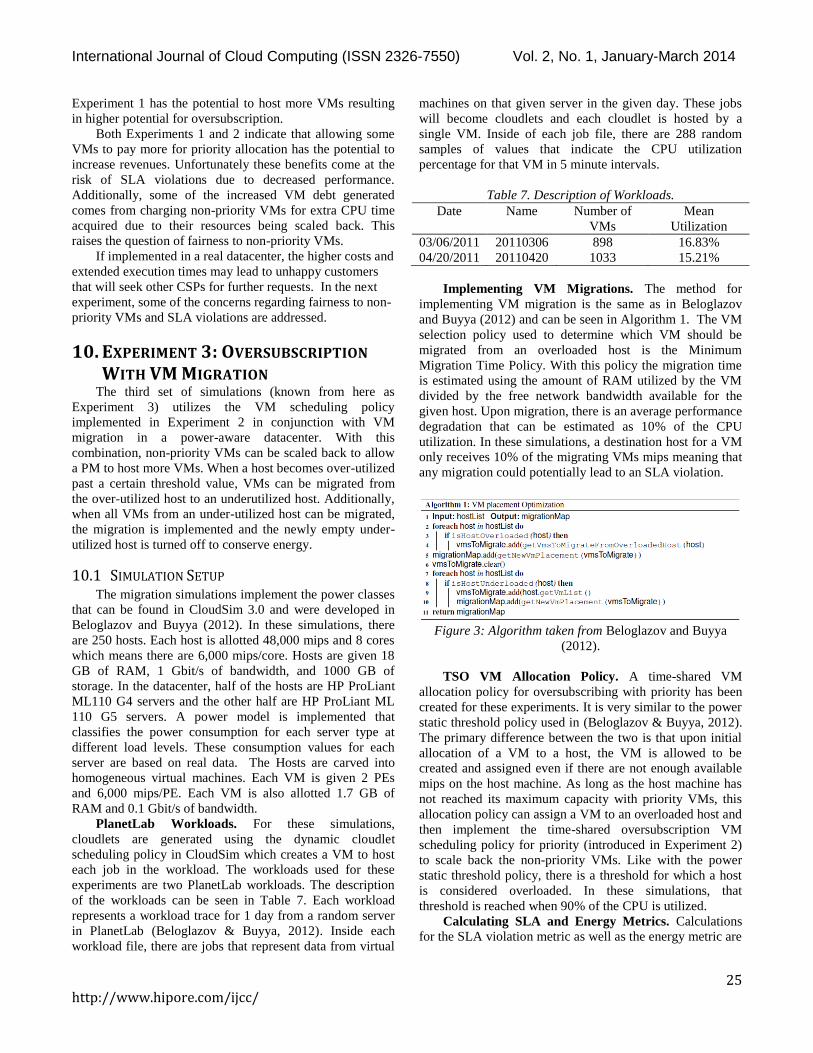
Implementing VM Migrations. The method for
implementing VM migration is the same as in Beloglazov
and Buyya (2012) and can be seen in Algorithm 1. The VM
selection policy used to determine which VM should be
migrated from an overloaded host is the Minimum
Migration Time Policy. With this policy the migration time
is estimated using the amount of RAM utilized by the VM
divided by the free network bandwidth available for the
given host. Upon migration, there is an average performance
degradation that can be estimated as 10% of the CPU
utilization. In these simulations, a destination host for a VM
only receives 10% of the migrating VMs mips meaning that
any migration could potentially lead to an SLA violation.
Figure 3: Algorithm taken from Beloglazov and Buyya
(2012).
TSO VM Allocation Policy. A time-shared VM
allocation policy for oversubscribing with priority has been
created for these experiments. It is very similar to the power
static threshold policy used in (Beloglazov & Buyya, 2012).
The primary difference between the two is that upon initial
allocation of a VM to a host, the VM is allowed to be
created and assigned even if there are not enough available
mips on the host machine. As long as the host machine has
not reached its maximum capacity with priority VMs, this
allocation policy can assign a VM to an overloaded host and
then implement the time-shared oversubscription VM
scheduling policy for priority (introduced in Experiment 2)
to scale back the non-priority VMs. Like with the power
static threshold policy, there is a threshold for which a host
is considered overloaded. In these simulations, that
threshold is reached when 90% of the CPU is utilized.
Calculating SLA and Energy Metrics. Calculations
for the SLA violation metric as well as the energy metric are
International Journal of Cloud Computing (ISSN 2326-7550) Vol. 2, No. 1, January-March 2014
26 http://www.hipore.com/ijcc/
identical to those utilized in (Beloglazov & Buyya, 2012).
SLA violations are calculated using two metrics. The first is
the percentage of time that a host receives 100% CPU
utilization and the other is the overall performance
degradation that is caused by VM migrations. The product
of these two metrics is used to determine the SLA violation
metric.
As previously described, energy consumption is based
on a power model for two server types. These values are
based on real data for the server that identifies the power
consumption in watts for various loads.
Compensating Non-Priority VMs. The results of the
simulations in Experiments 1 and 2 show that the QoS for
non-priority VMs may become severely degraded due to
increased running times for their jobs. As a result of these
increased running times, the debt calculation in Equation 1
used in the first two experiments may be unfair to non-
priority customers as their longer running jobs lead to
increased VM debt. Thus, in Experiment 3, a compensation
factor is added to make the cost to non-priority customers
more fair.
In order to calculate the compensation factor for non-
priority VMs, the running times for each VM is first
estimated using Equation 4 where 𝑅 is the estimated run
time, 𝐿 is the cloudlet length, �̅�is the average mips, and 𝐶 is
the number of cores.
𝑅 =𝐿
�̅�𝐶(4)
This estimation is calculated for each non-priority VM
and the results are summed together. Note that since a job in
a PlanetLab workload changes its CPU utilization every 5
minutes, the average mips being utilized for each job is used
to estimate the total requested mips for the VM.
The extra debt accumulated by non-priority VMs due to
degraded service is calculated by taking the difference in
actual and estimated run times and multiplying it by the
price for a non-priority VM using Equation 5 where 𝐷𝐸𝑥𝑡𝑟𝑎
is the extra debt and 𝑇 is the run time.
𝐷𝐸𝑥𝑡𝑟𝑎 = (𝑇𝐴𝑐𝑡𝑢𝑎𝑙 − 𝑇𝐸𝑠𝑡𝑖𝑚𝑎𝑡𝑒𝑑) ∗ 0.09 (5)
Finally, the extra debt is subtracted from the original
debt value calculated to get the adjusted debt value using
Equation 6.
𝐷𝐴𝑑𝑗𝑢𝑠𝑡𝑒𝑑 = 𝐷𝐴𝑐𝑡𝑢𝑎𝑙 − 𝐷𝐸𝑥𝑡𝑟𝑎 (6)
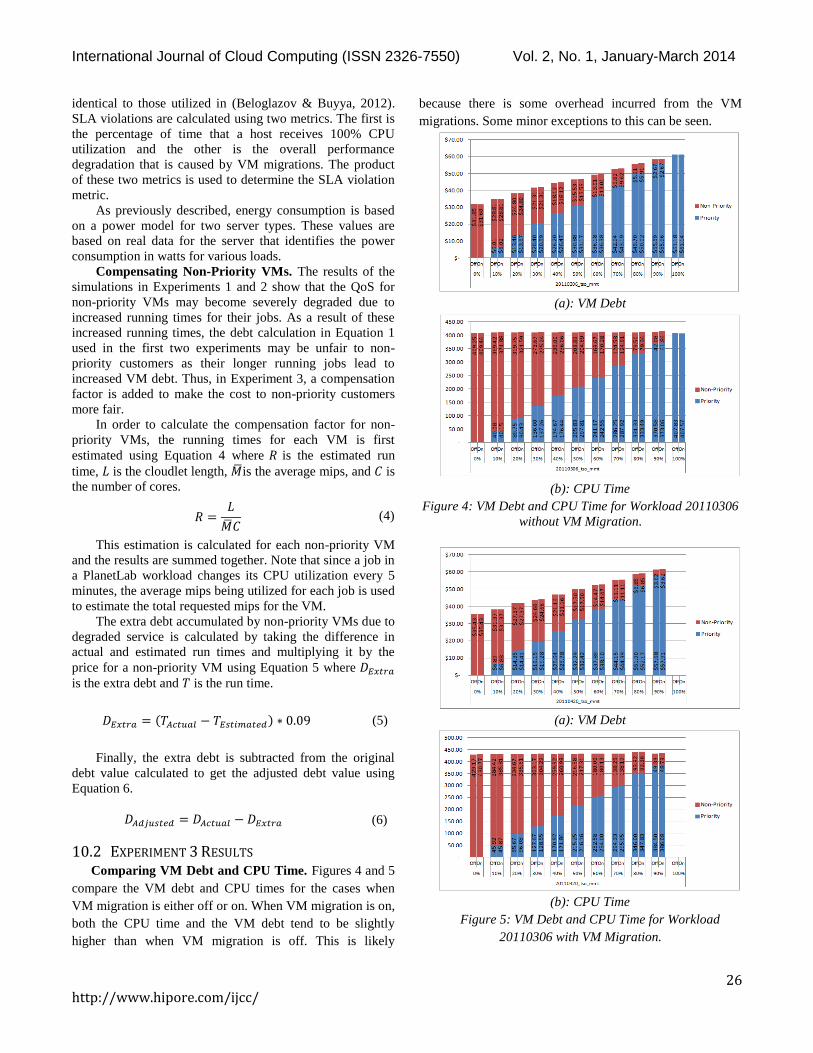
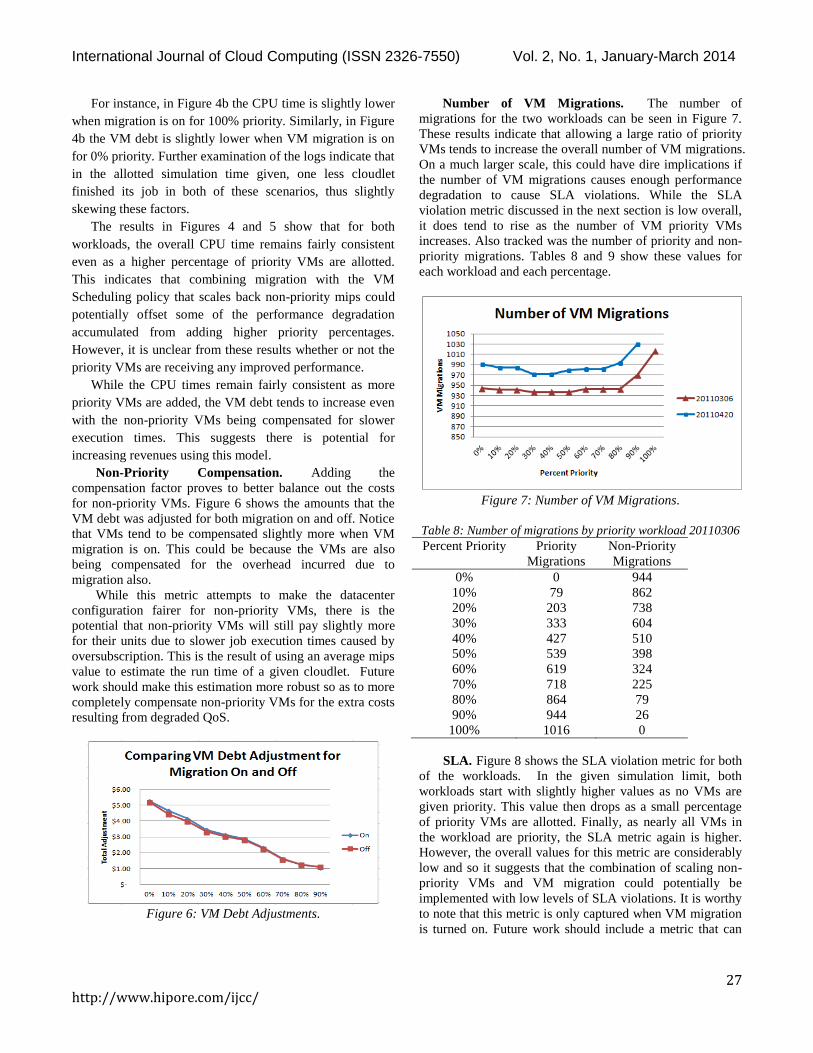
10.2 EXPERIMENT 3 RESULTS Comparing VM Debt and CPU Time. Figures 4 and 5
compare the VM debt and CPU times for the cases when
VM migration is either off or on. When VM migration is on,
both the CPU time and the VM debt tend to be slightly
higher than when VM migration is off. This is likely
because there is some overhead incurred from the VM
migrations. Some minor exceptions to this can be seen.
(a): VM Debt
(b): CPU Time
Figure 4: VM Debt and CPU Time for Workload 20110306
without VM Migration.
(a): VM Debt
(b): CPU Time
Figure 5: VM Debt and CPU Time for Workload
20110306 with VM Migration.
International Journal of Cloud Computing (ISSN 2326-7550) Vol. 2, No. 1, January-March 2014
27 http://www.hipore.com/ijcc/
For instance, in Figure 4b the CPU time is slightly lower
when migration is on for 100% priority. Similarly, in Figure
4b the VM debt is slightly lower when VM migration is on
for 0% priority. Further examination of the logs indicate that
in the allotted simulation time given, one less cloudlet
finished its job in both of these scenarios, thus slightly
skewing these factors.
The results in Figures 4 and 5 show that for both
workloads, the overall CPU time remains fairly consistent
even as a higher percentage of priority VMs are allotted.
This indicates that combining migration with the VM
Scheduling policy that scales back non-priority mips could
potentially offset some of the performance degradation
accumulated from adding higher priority percentages.
However, it is unclear from these results whether or not the
priority VMs are receiving any improved performance.
While the CPU times remain fairly consistent as more
priority VMs are added, the VM debt tends to increase even
with the non-priority VMs being compensated for slower
execution times. This suggests there is potential for
increasing revenues using this model.
Non-Priority Compensation. Adding the
compensation factor proves to better balance out the costs
for non-priority VMs. Figure 6 shows the amounts that the
VM debt was adjusted for both migration on and off. Notice
that VMs tend to be compensated slightly more when VM
migration is on. This could be because the VMs are also
being compensated for the overhead incurred due to
migration also.
While this metric attempts to make the datacenter
configuration fairer for non-priority VMs, there is the
potential that non-priority VMs will still pay slightly more
for their units due to slower job execution times caused by
oversubscription. This is the result of using an average mips
value to estimate the run time of a given cloudlet. Future
work should make this estimation more robust so as to more
completely compensate non-priority VMs for the extra costs
resulting from degraded QoS.
Figure 6: VM Debt Adjustments.
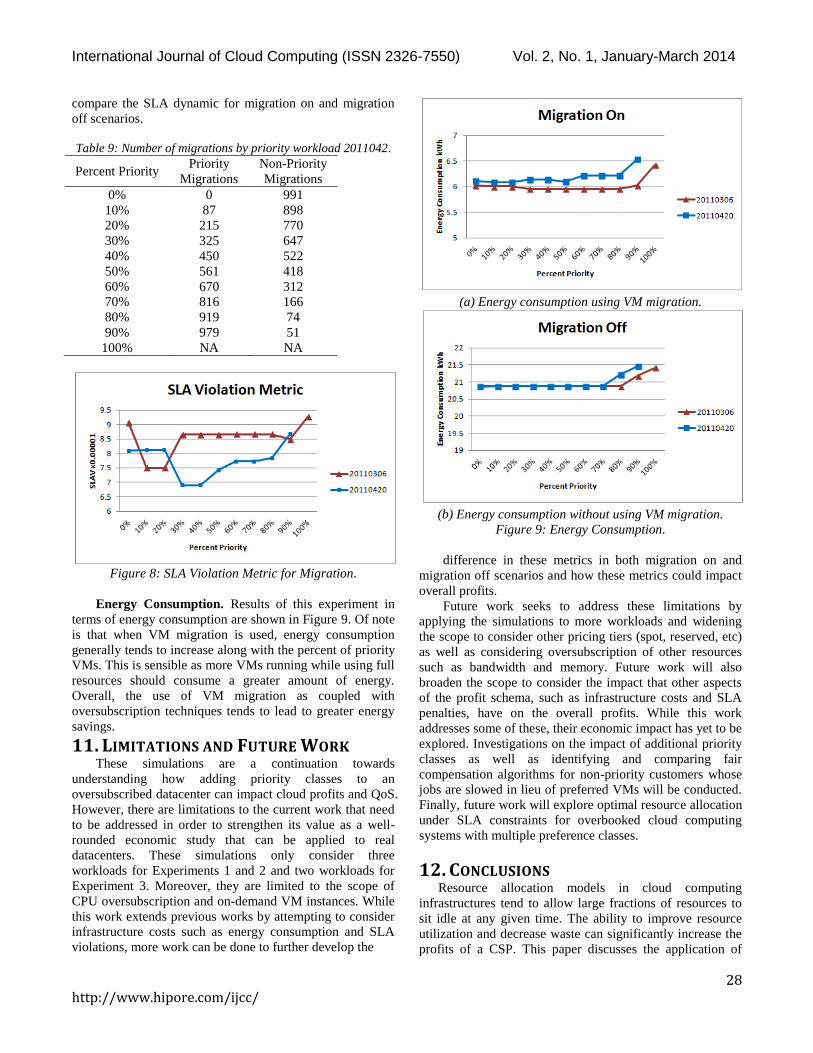
Number of VM Migrations. The number of
migrations for the two workloads can be seen in Figure 7.
These results indicate that allowing a large ratio of priority
VMs tends to increase the overall number of VM migrations.
On a much larger scale, this could have dire implications if
the number of VM migrations causes enough performance
degradation to cause SLA violations. While the SLA
violation metric discussed in the next section is low overall,
it does tend to rise as the number of VM priority VMs
increases. Also tracked was the number of priority and non-
priority migrations. Tables 8 and 9 show these values for
each workload and each percentage.
Figure 7: Number of VM Migrations.
Table 8: Number of migrations by priority workload 20110306
Percent Priority Priority
Migrations
Non-Priority
Migrations
0% 0 944
10% 79 862
20% 203 738
30% 333 604
40% 427 510
50% 539 398
60% 619 324
70% 718 225
80% 864 79
90% 944 26
100% 1016 0
SLA. Figure 8 shows the SLA violation metric for both
of the workloads. In the given simulation limit, both
workloads start with slightly higher values as no VMs are
given priority. This value then drops as a small percentage
of priority VMs are allotted. Finally, as nearly all VMs in
the workload are priority, the SLA metric again is higher.
However, the overall values for this metric are considerably
low and so it suggests that the combination of scaling non-
priority VMs and VM migration could potentially be
implemented with low levels of SLA violations. It is worthy
to note that this metric is only captured when VM migration
is turned on. Future work should include a metric that can
International Journal of Cloud Computing (ISSN 2326-7550) Vol. 2, No. 1, January-March 2014
28 http://www.hipore.com/ijcc/
compare the SLA dynamic for migration on and migration
off scenarios.
Table 9: Number of migrations by priority workload 2011042.
Percent Priority Priority
Migrations
Non-Priority
Migrations
0% 0 991
10% 87 898
20% 215 770
30% 325 647
40% 450 522
50% 561 418
60% 670 312
70% 816 166
80% 919 74
90% 979 51
100% NA NA
Figure 8: SLA Violation Metric for Migration.
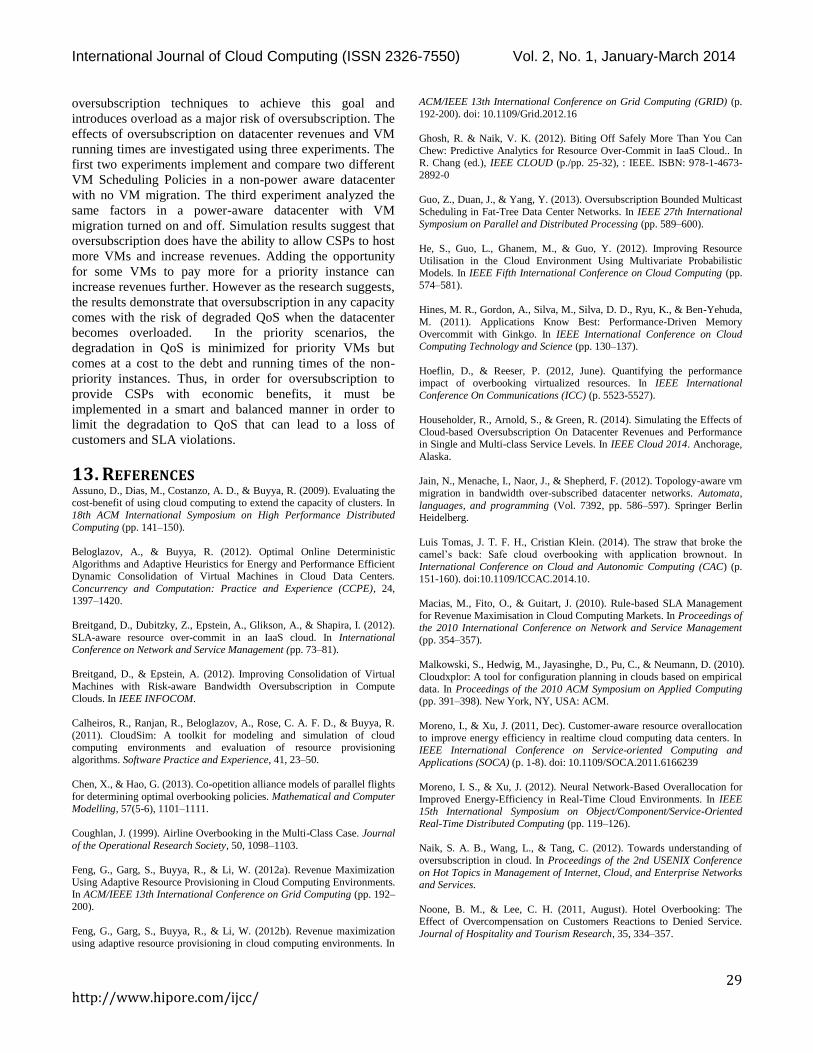
Energy Consumption. Results of this experiment in
terms of energy consumption are shown in Figure 9. Of note
is that when VM migration is used, energy consumption
generally tends to increase along with the percent of priority
VMs. This is sensible as more VMs running while using full
resources should consume a greater amount of energy.
Overall, the use of VM migration as coupled with
oversubscription techniques tends to lead to greater energy
savings.
11. LIMITATIONS AND FUTURE WORKThese simulations are a continuation towards
understanding how adding priority classes to an
oversubscribed datacenter can impact cloud profits and QoS.
However, there are limitations to the current work that need
to be addressed in order to strengthen its value as a well-
rounded economic study that can be applied to real
datacenters. These simulations only consider three
workloads for Experiments 1 and 2 and two workloads for
Experiment 3. Moreover, they are limited to the scope of
CPU oversubscription and on-demand VM instances. While
this work extends previous works by attempting to consider
infrastructure costs such as energy consumption and SLA
violations, more work can be done to further develop the
(a) Energy consumption using VM migration.
(b) Energy consumption without using VM migration.
Figure 9: Energy Consumption.
difference in these metrics in both migration on and
migration off scenarios and how these metrics could impact
overall profits.
Future work seeks to address these limitations by
applying the simulations to more workloads and widening
the scope to consider other pricing tiers (spot, reserved, etc)
as well as considering oversubscription of other resources
such as bandwidth and memory. Future work will also
broaden the scope to consider the impact that other aspects
of the profit schema, such as infrastructure costs and SLA
penalties, have on the overall profits. While this work
addresses some of these, their economic impact has yet to be
explored. Investigations on the impact of additional priority
classes as well as identifying and comparing fair
compensation algorithms for non-priority customers whose
jobs are slowed in lieu of preferred VMs will be conducted.
Finally, future work will explore optimal resource allocation
under SLA constraints for overbooked cloud computing
systems with multiple preference classes.
12. CONCLUSIONSResource allocation models in cloud computing
infrastructures tend to allow large fractions of resources to
sit idle at any given time. The ability to improve resource
utilization and decrease waste can significantly increase the
profits of a CSP. This paper discusses the application of
International Journal of Cloud Computing (ISSN 2326-7550) Vol. 2, No. 1, January-March 2014
29 http://www.hipore.com/ijcc/
oversubscription techniques to achieve this goal and
introduces overload as a major risk of oversubscription. The
effects of oversubscription on datacenter revenues and VM
running times are investigated using three experiments. The
first two experiments implement and compare two different
VM Scheduling Policies in a non-power aware datacenter
with no VM migration. The third experiment analyzed the
same factors in a power-aware datacenter with VM
migration turned on and off. Simulation results suggest that
oversubscription does have the ability to allow CSPs to host
more VMs and increase revenues. Adding the opportunity
for some VMs to pay more for a priority instance can
increase revenues further. However as the research suggests,
the results demonstrate that oversubscription in any capacity
comes with the risk of degraded QoS when the datacenter
becomes overloaded. In the priority scenarios, the
degradation in QoS is minimized for priority VMs but
comes at a cost to the debt and running times of the non-
priority instances. Thus, in order for oversubscription to
provide CSPs with economic benefits, it must be
implemented in a smart and balanced manner in order to
limit the degradation to QoS that can lead to a loss of
customers and SLA violations.
13. REFERENCESAssuno, D., Dias, M., Costanzo, A. D., & Buyya, R. (2009). Evaluating the cost-benefit of using cloud computing to extend the capacity of clusters. In
18th ACM International Symposium on High Performance Distributed
Computing (pp. 141–150).
Beloglazov, A., & Buyya, R. (2012). Optimal Online Deterministic
Algorithms and Adaptive Heuristics for Energy and Performance Efficient Dynamic Consolidation of Virtual Machines in Cloud Data Centers.
Concurrency and Computation: Practice and Experience (CCPE), 24,
1397–1420.
Breitgand, D., Dubitzky, Z., Epstein, A., Glikson, A., & Shapira, I. (2012).
SLA-aware resource over-commit in an IaaS cloud. In International Conference on Network and Service Management (pp. 73–81).
Breitgand, D., & Epstein, A. (2012). Improving Consolidation of Virtual
Machines with Risk-aware Bandwidth Oversubscription in Compute
Clouds. In IEEE INFOCOM.
Calheiros, R., Ranjan, R., Beloglazov, A., Rose, C. A. F. D., & Buyya, R.
(2011). CloudSim: A toolkit for modeling and simulation of cloud computing environments and evaluation of resource provisioning
algorithms. Software Practice and Experience, 41, 23–50.
Chen, X., & Hao, G. (2013). Co-opetition alliance models of parallel flights
for determining optimal overbooking policies. Mathematical and Computer
Modelling, 57(5-6), 1101–1111.
Coughlan, J. (1999). Airline Overbooking in the Multi-Class Case. Journal
of the Operational Research Society, 50, 1098–1103.
Feng, G., Garg, S., Buyya, R., & Li, W. (2012a). Revenue Maximization
Using Adaptive Resource Provisioning in Cloud Computing Environments. In ACM/IEEE 13th International Conference on Grid Computing (pp. 192–
200).
Feng, G., Garg, S., Buyya, R., & Li, W. (2012b). Revenue maximization
using adaptive resource provisioning in cloud computing environments. In
ACM/IEEE 13th International Conference on Grid Computing (GRID) (p.
192-200). doi: 10.1109/Grid.2012.16
Ghosh, R. & Naik, V. K. (2012). Biting Off Safely More Than You Can
Chew: Predictive Analytics for Resource Over-Commit in IaaS Cloud.. In R. Chang (ed.), IEEE CLOUD (p./pp. 25-32), : IEEE. ISBN: 978-1-4673-
2892-0
Guo, Z., Duan, J., & Yang, Y. (2013). Oversubscription Bounded Multicast
Scheduling in Fat-Tree Data Center Networks. In IEEE 27th International
Symposium on Parallel and Distributed Processing (pp. 589–600).
He, S., Guo, L., Ghanem, M., & Guo, Y. (2012). Improving Resource
Utilisation in the Cloud Environment Using Multivariate Probabilistic Models. In IEEE Fifth International Conference on Cloud Computing (pp.
574–581).
Hines, M. R., Gordon, A., Silva, M., Silva, D. D., Ryu, K., & Ben-Yehuda,
M. (2011). Applications Know Best: Performance-Driven Memory
Overcommit with Ginkgo. In IEEE International Conference on Cloud Computing Technology and Science (pp. 130–137).
Hoeflin, D., & Reeser, P. (2012, June). Quantifying the performance impact of overbooking virtualized resources. In IEEE International
Conference On Communications (ICC) (p. 5523-5527).
Householder, R., Arnold, S., & Green, R. (2014). Simulating the Effects of
Cloud-based Oversubscription On Datacenter Revenues and Performance in Single and Multi-class Service Levels. In IEEE Cloud 2014. Anchorage,
Alaska.
Jain, N., Menache, I., Naor, J., & Shepherd, F. (2012). Topology-aware vm
migration in bandwidth over-subscribed datacenter networks. Automata,
languages, and programming (Vol. 7392, pp. 586–597). Springer Berlin Heidelberg.
Luis Tomas, J. T. F. H., Cristian Klein. (2014). The straw that broke the
camel’s back: Safe cloud overbooking with application brownout. In
International Conference on Cloud and Autonomic Computing (CAC) (p.
151-160). doi:10.1109/ICCAC.2014.10.
Macias, M., Fito, O., & Guitart, J. (2010). Rule-based SLA Management
for Revenue Maximisation in Cloud Computing Markets. In Proceedings of the 2010 International Conference on Network and Service Management
(pp. 354–357).
Malkowski, S., Hedwig, M., Jayasinghe, D., Pu, C., & Neumann, D. (2010).
Cloudxplor: A tool for configuration planning in clouds based on empirical
data. In Proceedings of the 2010 ACM Symposium on Applied Computing (pp. 391–398). New York, NY, USA: ACM.
Moreno, I., & Xu, J. (2011, Dec). Customer-aware resource overallocation to improve energy efficiency in realtime cloud computing data centers. In
IEEE International Conference on Service-oriented Computing and
Applications (SOCA) (p. 1-8). doi: 10.1109/SOCA.2011.6166239
Moreno, I. S., & Xu, J. (2012). Neural Network-Based Overallocation for
Improved Energy-Efficiency in Real-Time Cloud Environments. In IEEE 15th International Symposium on Object/Component/Service-Oriented
Real-Time Distributed Computing (pp. 119–126).
Naik, S. A. B., Wang, L., & Tang, C. (2012). Towards understanding of
oversubscription in cloud. In Proceedings of the 2nd USENIX Conference
on Hot Topics in Management of Internet, Cloud, and Enterprise Networks and Services.
Noone, B. M., & Lee, C. H. (2011, August). Hotel Overbooking: The Effect of Overcompensation on Customers Reactions to Denied Service.
Journal of Hospitality and Tourism Research, 35, 334–357.
International Journal of Cloud Computing (ISSN 2326-7550) Vol. 2, No. 1, January-March 2014
30 http://www.hipore.com/ijcc/
Patouni, E., Merakos, L., & Verikoukis, C. (2014, Feb). Fair allocation of
cloud amp;amp; physical resources for multi-class users. In IEEE 3rd symposium on Network cloud computing and applications (NCCA)(p. 37-
37). doi: 10.1109/NCCA.2014.14
Singhaseni, C., Wu, Y., & Ojiako, U. (2013). Modeling Overbookings on
Air Cargo Transportation. International Journal of Physical Distribution
and Logistics Management, 43(8), 638–656.
Tomas, L., & Tordsson, J. (2014). An autonomic approach to risk-aware
data center overbooking. IEEE Transactions on Cloud Computing, (2)3, 292–305.
Toms, L., & Tordsson, J. (2013). Improving cloud infrastructure utilization through overbooking. In ACM Cloud and Autonomic Computing
Conference.
Wang, L., Hosn, R. A., & Tang, C. (2012). Remediating Overload in Over-
Subscribed Computing Environments. In IEEE Fifth International
Conference on Cloud Computing (pp. 860–867).
Williams, D., Jamjoom, H., Liu, Y.-H., & Weatherspoon, H. (2011).
Overdriver: Handling Memory Overload in an Oversubscribed Cloud. In ACM SIGPLAN/SIGOPS International Conference on Virtual Execution
Environments.
Wo, T., Sun, Q., Li, B., & Hu, C. (2012). Overbooking-Based Resource
Allocation in Virtualized Data Center. In IEEE 15th International Symposium on Object/Component/Service-Oriented Real-Time Distributed
Computing Workshops (pp. 142–149).
Zacharias, C., & Pinedo, M. (2013). Appointment Scheduling with No-
Shows and Overbooking. Production and Operations Management, (23)5,
788-801.
Zhang, X., Shae, Z.-Y., Zheng, S., & Jamjoom, U. (2012). Virtual machine
migration in an over-committed cloud. In Network Operations and Management Symposium (pp.196–203)
AuthorsRachel Householder has a B.Sc. in
Integrated Mathematics and a M.Sc. in
Computer Science from Bowling Green
State University. She worked as a
Research Assistant for two years at the
Institutional Research Office and as a
high school mathematics teacher for three
years. Her research interests include cloud computing and
business intelligence.
Robert Green received his B.S. in
Computer Science & Applied
Mathematics from Geneva College in
2005, his M.S. from Bowling Green
State University in 2007, and his Ph.D.
from the University of Toledo in 2012.
He currently serves as an Assistant
Professor of Computer Science Professor at Bowling Green
State University. His research interests including Cloud
Computing, High Performance Computing, Population-
based Metaheuristics, Software Development (Mobile
Applications and Web Development), and the modeling,
evaluation, and analysis of complex systems.
ISSN:2326-7542(Print) ISSN:2326-7550(Online)A Technical Publication of the Services Society
hipore.com