impax asset management group plc...market cap of universe typical # of stocks strategy launched...
TRANSCRIPT
Norfolk House 31 St James’s Square London SW1Y 4JR UK Tel: +44 (0)20 7434 1122 Fax: +44 (0)20 7437 1245 Impax Asset Management Ltd is authorised and regulated by the Financial Services Authority Impax is a registered investment advisor with the SEC
Impax Asset Management Group plc
Interim Results: 16 May 2012
For the period 1 October 2011 – 31 March 2012

2
Agenda
• Business update
• Annual results
• Q&A
Ian Simm (Chief Executive)
Charlie Ridge (CFO)

3
Highlights (for H1: 1 October 2011 – 31 March 2012)
• Assets under management (“AUM”) increased 7% to £2,025m, up from £1,896m
• H1 revenue £9.2m (H1, 2011: £9.9m)
• Operating earnings* £2.2m (H1, 2011: £2.9m)
• Unaudited loss before tax of £2.7m (H1, 2011: £2.05m profit), inclusive of £4.8m charges arising from previously disclosed unvested share schemes
• Diluted earnings per share 1.45 pence (adjusted**) (H1, 2011: 1.27 pence (adjusted**))
• Solid investment performance, particularly from Water Strategy
• Progress in international expansion
- Hong Kong office fully operational
- Launch of US Impax Green Markets Fund
• Platform for business development
- Resource Scarcity
- Real Assets
* revenue less operating costs
** adjusted to exclude IFRS2 charges for shares schemes intended to be satisfied by primary shares, and include the related tax benefit reported in Other Comprehensive Income and the dilution effect of unvested share awards

4
Environmental Markets Update
• Further expansion of core target sectors
- LED market grew 71% in 2011 to ca. 10% of global lighting market
- Smart grid market grew 22% in 2011
• Significant policy advancement
- Durban global agreement to plan for reducing greenhouse gases
- EU Energy Roadmap: renewables rising to at least 55% of energy supply by 2050
- US Utility MACT regulation, limiting coal-fired power plant mercury emissions. 50GW retirements expected
- China 5-year plan, expectation of c. US$780bn investment in water conservation, treatment and recycling by 2020
• Large corporates remain active despite tough markets
- Pentair – Tyco Flow Control (water infrastructure, US$4.9bn)
- ABB – Thomas & Betts (power grid, US$3.9bn)
- Ecolab – Nalco (water treatment, US$8.0bn)
- Siemens – Ruggedcom (smart grid, CAD 384mn)
- Xylem spin out from ITT (water infrastructure, US$4.5bn)

5
Strategy Performance (to 31/03/12) in GBP
FTSE indices are total return (source: FactSet). FX rates taken 4pm (source: WM Reuters)
2007 2008 2009 2010 2011 YTD
Environmental Specialists 17.5% -20.2% 29.1% 11.9% -17.8% 10.2%
Environmental Leaders N/A N/A 21.9% 15.1% -12.0% 12.2%
Water N/A N/A 24.9% 20.3% -9.0% 14.5%
FTSE World Index 9.5% -18.2% 19.6% 16.3% -5.8% 9.0%
FTSE ET50 69.4% -37.1% 15.2% -2.2% -27.4% 4.7%

6
Impax AUM Breakdown
Investment strategy AUM (£) 31/03/12 AUM (£) 30/09/11
Environmental Specialists 877m 838m
- Impax Environmental Markets plc 369m 343m
- Impax Environmental Markets (Ireland) 135m 162m
- Third Party funds/accounts 373m 333m
Environmental Leaders 304m 252m
- Third Party funds/accounts 304m 252m
Water 226m 204m
- Third Party funds/accounts 226m 204m
Asia-Pacific 239m 209m
- Impax Asian Environmental Markets plc 233m 202m
- Impax Asian Environmental Markets (Ireland) 2m 3m
- Third Party funds/accounts 4m 4m
Private Equity / other 379m 393m
TOTAL £2,025m £1,896m

7
AUM analysed by Geographic Region (Client Domicile*)
Principal funds/partners • Impax Environmental Markets plc • Impax Environmental Markets (Ireland) • Impax Asian Environmental Markets plc • Impax Asian Environmental Markets (Ireland) • BNP Paribas Investment Partners • ASN Bank • Alm. Brand Invest • LD
• BNP Paribas Investment Partners • DIAM
• Impax Green Markets • PAX World
AUM 30/09/11 Total £1,896m AUM 31/03/12 Total £2,024m
• Impax New Energy Investors Fund I • Impax New Energy Investors Fund II
Multi-region
* Estimated breakdown based on fund domicile
8
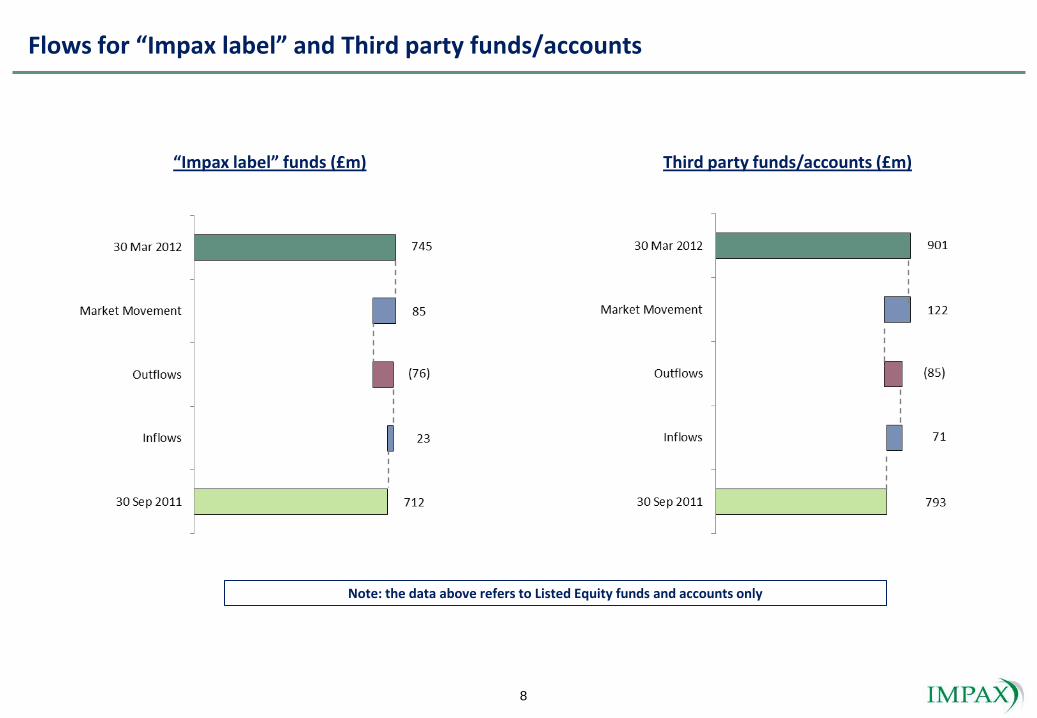
Flows for “Impax label” and Third party funds/accounts
“Impax label” funds (£m) Third party funds/accounts (£m)
Note: the data above refers to Listed Equity funds and accounts only

9
Private Equity Highlights
• Significant investment opportunity
- Substantial need across the EU to fund construction of renewable power plants
- Investment in projects offering stable, long-term, inflation-protected cashflow
- Considerable “proprietary” deal flow from Impax network
• NEF I
- Fund I (€125m) now fully invested/committed
- Impax committed to invest €3.76m into Fund (€2.75m drawn)
- Core portfolio is “utility quality” and ready for sale when market conditions turn favourable
• NEF II
- €330m of committed capital (Impax 1%)
- 28% invested / committed / reserved (France, Germany, Poland & Italy)
- Strong deal pipeline
10
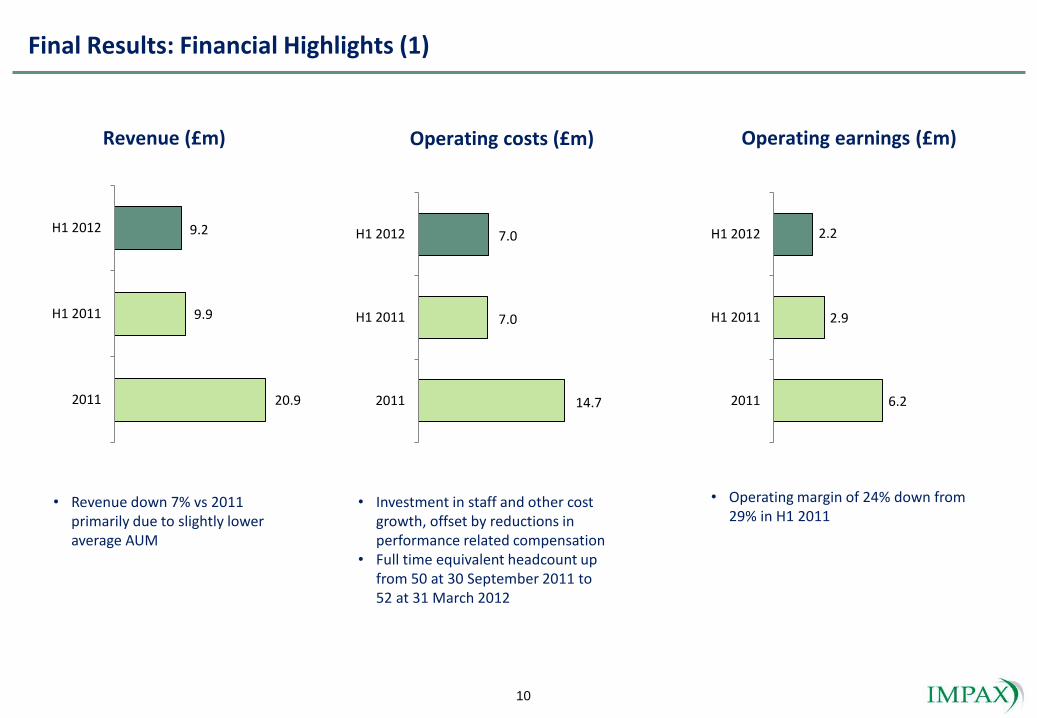
Final Results: Financial Highlights (1)
Revenue (£m) Operating costs (£m) Operating earnings (£m)
• Revenue down 7% vs 2011 primarily due to slightly lower average AUM
• Investment in staff and other cost growth, offset by reductions in performance related compensation
• Full time equivalent headcount up from 50 at 30 September 2011 to 52 at 31 March 2012
• Operating margin of 24% down from 29% in H1 2011
20.9
9.9
9.2
2011
H1 2011
H1 2012
14.7
7.0
7.0
2011
H1 2011
H1 2012
6.2
2.9
2.2
2011
H1 2011
H1 2012
11
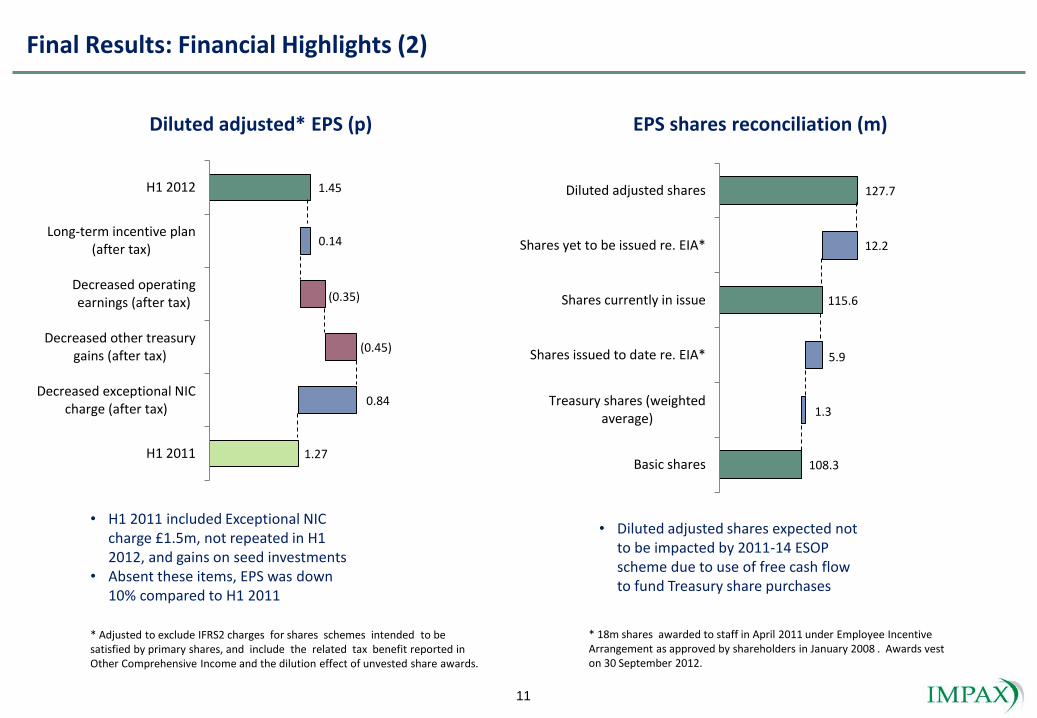
Final Results: Financial Highlights (2)
Diluted adjusted* EPS (p) EPS shares reconciliation (m)
• H1 2011 included Exceptional NIC charge £1.5m, not repeated in H1 2012, and gains on seed investments
• Absent these items, EPS was down 10% compared to H1 2011
• Diluted adjusted shares expected not to be impacted by 2011-14 ESOP scheme due to use of free cash flow to fund Treasury share purchases
* 18m shares awarded to staff in April 2011 under Employee Incentive Arrangement as approved by shareholders in January 2008 . Awards vest on 30 September 2012.
108.3
115.6
127.7
1.3
5.9
12.2
Basic shares
Treasury shares (weightedaverage)
Shares issued to date re. EIA*
Shares currently in issue
Shares yet to be issued re. EIA*
Diluted adjusted shares
* Adjusted to exclude IFRS2 charges for shares schemes intended to be satisfied by primary shares, and include the related tax benefit reported in Other Comprehensive Income and the dilution effect of unvested share awards.
1.27
1.45
0.84
(0.45)
(0.35)
0.14
H1 2011
Decreased exceptional NICcharge (after tax)
Decreased other treasurygains (after tax)
Decreased operatingearnings (after tax)
Long-term incentive plan(after tax)
H1 2012

12
Final Results: Financial Highlights (3)
Investments (£m) Cash reserves (£m) Cash reserve analysis (£m)
• IGMF launch with seed funding of $5m
• IARF closed during period. Impax redeemed £1.5m
• Continued strong cash generation • Buy back programme commenced,
959,000 shares bought into Treasury
4.8
6.4
3.0
(1.5)
0.1
30 Sep 2011
Seed fundinginjection
Seed fundingredemption
Mark tomarket
31 Mar 2012
6.3
(6.6)
(3.1)
16.0
"Available" cash
Risk buffer
Private Equitycommitments
Cash as at 31 Mar 2012
20.0
16.0
(4.5)
(0.8)
(0.3)
(1.5)
2.5
0.3
30 Sep 2011
2011 bonuspayments
Dividends paid
Share buy backs
Net investmentoutflow
Operating cashflows
Working capital
31 Mar 2012

13
Prospects for expansion
• Proven franchise in an area of increasing interest to investors; attractive platform for individuals / teams with expertise in complementary investment management areas
• Resource scarcity
- Wider perspective of Environmental Markets
- Potentially attractive to new customer segments
- Established agriculture / food investment team recruited
- Product expansion to follow
• Real assets
- Active review of investor appetite to back new strategies
14
Outlook
• Attractive prospects for environmental markets to sustain “superior growth”
- Major overhaul underway in energy policies worldwide
- Demographics and weak asset base driving investment in environmental infrastructure
• Active investment management ideal for exploiting inefficient prices
- Rapidly changing market drivers
- Expert team can interpret technology and policy issues
- Valuation anomalies across regions
• Impax “platform” well positioned for further expansion
- Stable investment team with global coverage
- Highly regarded, proven investment process
- Established distribution model
• Scope for increase in operating margin
- Scalable products with strong track records
- Infrastructure in place to support significantly higher AUM

15
Appendix

16
Income Statement
6 months 6 months Year ended ended ended
2012 2011 2011 £'000 £'000 £'000
Revenue 9,193 9,858 20,931
Bonuses (1,906) (2,409) (5,268) Other operating costs (5,073) (4,553) (9,428) Operating earnings 2,214 2,896 6,235
Share-based payment charge for EIA extension scheme* (3,829) - (3,647) Exceptional long-term incentive scheme charge (88) (1,530) (1,090) Other long-term incentive scheme related charges (929) - (619)
Fair value (losses)/gains (37) 702 785 Change in third party interest in consolidated funds (97) (117) (117) Investment income 79 102 171
(Loss)/Profit before taxation (2,687) 2,053 1,718
Taxation 529 (454) (652)
(Loss)/Profit for the period (2,158) 1,599 1,066
* 18m shares awarded to staff in April 2011 under the Employee Incentive Arrangement as approved by shareholders in January 2008. Awards vest on 30 September 2012.

17
Balance Sheet
31 Mar 2012 31 Mar 2011 30 Sep 2011
£'000 £'000 £'000
Goodwill and intangibles 1,807 1,674 1,668
Other non current assets 794 270 509
2,601 1,944 2,177
Cash 16,292 16,293 21,416
Current asset investments 9,361 4,595 3,930
Other current assets 3,798 3,480 3,433
Total assets 32,052 26,312 30,956
Current liabilities 8,997 7,138 7,870
Non current liabilities 853 1,198 1,586
Net assets 22,202 17,976 21,500
Shareholder's equity 22,202 17,976 21,500
Note: The balance sheet includes effects due to the consolidation of investments. Cash reserves not including consolidated funds are £16.0m (Mar 2011: £14m, Sep 2011: £20.0m)

18
AUM – Monthly Development (£million)*
*AUM stated as of month end

19
• Employee Share Option Plan (“ESOP”)
- Designed to incentivise management and key senior staff to deliver strong personal performance that contributes to increasing shareholder value
- Strike price for “10% out-of-the-money” options to be based upon average of IPX price for 30 trading days following release of final results. Strike for FY2011 awards determined at 49.6p.
- 4.5m options awarded in respect of FY2011. Up to 9.5m options to be awarded in respect of 2012-14 financial years at the Board’s discretion
- Options vest on the 3rd anniversary of the award subject to continuing employment (December 2014 re FY2011 awards), and must be exercised within 3 years of vesting
• Board intention to apply free cash flow generated by operating activities to finance the buyback of shares into Treasury
- 959,000 shares bought into Treasury during the Period to March 2012
- Treasury shares intended to be utilised to satisfy employee share-based award obligations, reducing requirement to issue new shares
Remuneration Policy Update

20
Impax Overview: A Compelling Business Proposition
• Attractive sector for specialist investment managers
- Environmental policy addressing unsustainable economic development globally
- 1400+ quoted companies growing rapidly, US$500 billion+ (annual revenues)
- Growing evidence that institutions are allocating to this sector
- Understanding technology & regulation key to identifying mis-priced assets
• Impax has a well proven business model
- Founded in 1998. Highly qualified, stable management team with significant equity stake
- £2,024 million assets under management/advisory (31 March 2012)
- Carefully selected investment strategies with significant capacity
- Investment management infrastructure to support further growth
• Growth in shareholder value based on:
- Building on excellent investment track record
- Multiple distribution partners to complement direct sales
- Operational leverage of revenue growth exceeding cost growth
- Excess cash flow used for business development and dividends

21
Geographic scope
Cap Bias Market cap of
universe Typical # of
stocks Strategy launched
Comparison Indices
Global All Cap c.US$4tn 40-60 Mar 2008 MSCI World FTSE EOAS
Global Small-Mid Cap c.US$400bn 70-80 Feb 2002 MSCI World Small
Cap FTSE ET50
Regional All Cap c.US$900bn 40-60 Oct 2009
MSCI AC Asia Pacific (ex Japan)
FTSE EO Asia
Pacific ex Japan
Global All Cap c.US$500bn 50-70
Apr 2005
MSCI World FTSE EOAS
Investment Strategies
Listed
Equity
Investment
Universe
c. 1,400
companies*
Market cap
c.US$4tn
ENVIRONMENTAL LEADERS
Universe of c.1400
companies*
WATER
Universe of c.300 companies
ENVIRONMENTAL SPECIALISTS
Universe of c.900 companies
ASIA-PACIFIC
Universe of c.450 companies
*Includes ‘Environmental Specialists’ (50-100% in environmental markets) and ‘companies in transition’ (20-50% in environmental markets)
Private Equity IMPAX NEW ENERGY INVESTORS I LP
IMPAX NEW ENERGY INVESTORS II LP
22
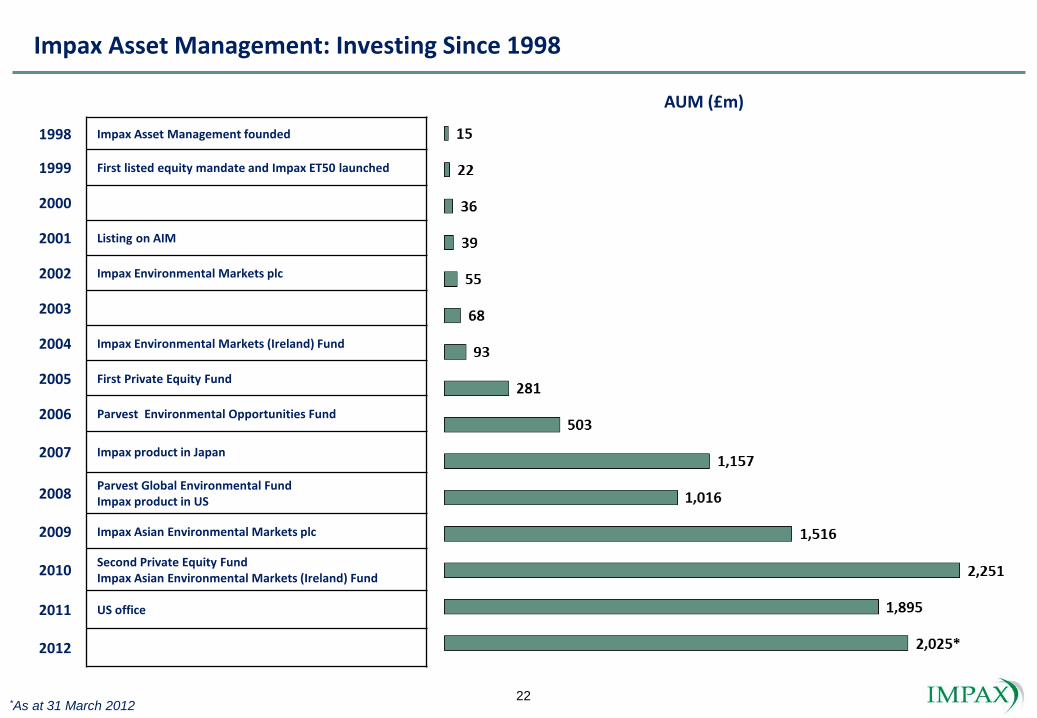
AUM (£m)
Impax Asset Management: Investing Since 1998
1998 Impax Asset Management founded
1999 First listed equity mandate and Impax ET50 launched
2000
2001 Listing on AIM
2002 Impax Environmental Markets plc
2003
2004 Impax Environmental Markets (Ireland) Fund
2005 First Private Equity Fund
2006 Parvest Environmental Opportunities Fund
2007 Impax product in Japan
2008 Parvest Global Environmental Fund Impax product in US
2009 Impax Asian Environmental Markets plc
2010 Second Private Equity Fund Impax Asian Environmental Markets (Ireland) Fund
2011 US office
2012
*As at 31 March 2012

23
Renewable Energy
Developers and IPPs
Solar Energy Generation Equipment
Wind Power Generation Equipment
Biofuels Other Renewables Equipment
Power Network Efficiency
Industrials Energy
Efficiency
Buildings Energy
Efficiency
Transport Energy
Efficiency
Energy Storage
Water Infra-
structure
Water Treatment Equipment
Water Utilities
Pollution Control
Solutions
Environmental Testing & Gas
Sensing
Waste Technology Equipment
Recycling & Value Added
Waste Processing
Hazardous Waste
Management
General Waste Management
Environmental Consultancies
Carbon & Other Environmental Assets Trading
Energy
Waste
Water
Renewable & Alternative Energy** Energy Efficiency**
Pollution Control Water Infrastructure & Technologies**
Environmental Support Services** Waste Management & Technologies**
Sector Classification*
* http://www.ftse.com/Indices/FTSE_Environmental_Markets_Index_Series/index.jsp ** Sub-sectors have an additional ‘diversified’ category not shown
above for the sake of clarity

24
• Growing demand for sector indices
• Impax ET50 Index operating since 1999
• Impax-FTSE partnership established in 2007
• FTSE now marketing 18 indices world-wide
• Impax revenue share and brand/profile benefits
FTSE’s Partner for Environmental Indices

25
Competitors
Listed Equities
• Products from large, branded asset managers not typically “consultant quality”
• Limited number of boutiques
• Sub-sector products, e.g. alternative energy, tend to underperform broader strategies
• Little direct competition in North America, Asia
Private Equity
• Established peer group validates investment hypothesis
- “Renewable energy only” funds
- Hybrid funds, including renewables alongside infrastructure, energy
• Several funds raising capital, but NEF II fund-raising complete

26
• MD, Private Equity
• 32 years in sector
(8 at Impax)
• Banker & fund
manager (Lazard,
EBRD)
• Chairman since
2004
• 33 years investment
expertise
• Ex Martin Currie
Bruce Jenkyn-
Jones Peter
Rossbach
Ken Locklin
Keith Falconer
• Chief Executive
• 22 years sector
expertise (16 at
Impax)
• Physicist, ex
McKinsey
Ian Simm
• CFO
• 25 years finance
expertise (4 at
Impax)
• Accountant, ex
Deutsche Bank
Charlie Ridge
Extensive Sector Expertise
• MD, Listed
Equities
• 21 years in sector
(13 at Impax)
• Chemist, ex BT
Alex. Brown
Ominder Dhillon
• Head of
Distribution
• 21 years financial
experience
• Ex Fidelity
International
• MD, US
• 30 years financial
experience/20
years in sector
• Ex Clean Energy
Group

27
Investors in segregated accounts
European
Institution
Investors in Impax pooled vehicles
+ > 100
other
institutions
White label funds
Strong Institutional Investor Relationships

28
UK:
- Collins Stewart
- plus direct sales
Continental Europe:
- BNP Paribas Investment
Partners
- ASN Bank
Asia/Australia:
- BNP Paribas Investment
Partners
- DIAM (Japan)
United States:
- Pax World
Well-Placed Distribution Partners

29
Disclaimer This document has been prepared by Impax Asset Management Group plc and approved by Impax Asset Management Limited (Impax, authorized and regulated by the Financial Services Authority). The information and any opinions contained in this document have been compiled in good faith, but no representation or warranty, express or implied, is made as to their accuracy, completeness or correctness. Impax, its officers, employees, representatives and agents expressly advise that they shall not be liable in any respect whatsoever for any loss or damage, whether direct, indirect, consequential or otherwise however arising (whether in negligence or otherwise) out of or in connection with the contents of or any omissions from this document. This document does not constitute an offer to sell, purchase, subscribe for or otherwise invest in units or shares of any fund managed by Impax. It may not be relied upon as constituting any form of investment advice and prospective investors are advised to ensure that they obtain appropriate independent professional advice before making any investment in any such Fund. Any offering is made only pursuant to the relevant offering document and the relevant subscription application, all of which must be read in their entirety. Prospective investors should review the offering memorandum, including the risk factors in the offering memorandum, before making a decision to invest. Past performance of a fund is no guarantee as to its performance in the future. This presentation is not an advertisement and is not intended for public use or distribution as an advertisement for investment management services or any fund managed by Impax Asset Management Ltd.