impediments to advanced technology adoption for canadian...
TRANSCRIPT

Impediments to Advanced Technology Adoption forCanadian Manufacturers
by
John Baldwin*
and
Zhengxi Lin**
11F0019MPE No. 173ISSN: 1200-5223
ISBN: 0-662-30788-7
No. 173
* Micro Economic Analysis Division24th Floor, R.H. Coats Building
Statistics CanadaOttawa, K1A 0T6 (613) 951-8588
E-mail: [email protected] Fax: (613) 951-5403
** formerly of Statistics Canadaand now with
Human Resources Development Canada
August 2001
The authors’ names are listed alphabetically.
This paper represents the views of the authors and does not necessarily reflect the opinions ofStatistics Canada.
Aussi disponible en français


Analytical Studies Branch – Research Paper Series - iii - Statistics Canada No. 11F0019MPE No. 173
Table of Contents
Abstract ........................................................................................................................................... v
Acknowledgements ....................................................................................................................... vii
1. Introduction ............................................................................................................................1
2. Advanced Technology Adoption: An Overview of Benefits and Impediments ...................2
2.1 Data Source....................................................................................................................................... 2
2.2 Benefits of Advanced Technology Adoption.................................................................................. 4
2.3 Impediments to Advanced Technology Adoption ......................................................................... 7
3. Determinants of Impediments to Advanced Technology Adoption........................................11
3.1 Alternative Measures of Technologic and Innovative Activity.................................................. 11
3.2 Plant Characteristics...................................................................................................................... 12
3.3 Empirical Results ........................................................................................................................... 13
4. Conclusion ................................................................................................................................20
Appendix .......................................................................................................................................22
References.....................................................................................................................................25


Analytical Studies Branch – Research Paper Series - v - Statistics Canada No. 11F0019MPE No. 173
Abstract
Using survey data, this paper investigates problems that firms in the Canadian manufacturingsector face in their decision to adopt advanced technology. The data show that while the use ofadvanced technology is relatively important (users account for over 80% of all shipments), it isnot widespread among firms (users represent only about one-third of all establishments). Oneexplanation lies in the fact that while advanced technologies provide a wide range of benefits,firms also face a series of problems that impede them from adopting advanced technology. Theseimpediments fall into five groups: cost-related, institution-related, labour-related, organization-related, and information-related.
While it might be expected that impediments would be higher for non-users than users oftechnologies, the opposite occurs. We posit that the reason for this is that innovation involves alearning process. Innovators and technology users face problems that they have to solve and themore innovative firms have greater problems. We test this by examining the factors that arerelated to whether a firm reports that it faced impediments. Our multivariate analysis reveals thatimpediments are reported more frequently among technology users than non-users; and morefrequently among innovating firms than non-innovating ones. We conclude that the informationon impediments in technology and other related surveys (innovation) should not be interpreted asimpenetrable barriers that prevent technology adoption. Rather, these surveys indicate areaswhere successful firms face and solve problems.
Keywords: manufacturing, advanced technology adoption, benefits, costs, impedimentsJEL: L60, O33


Analytical Studies Branch – Research Paper Series - vii - Statistics Canada No. 11F0019MPE No. 173
Acknowledgements
We would like to thank Bob Gibson and David Sabourin for their assistance with the data. Anearlier version was presented at the 1999 Statistics Canada Economic Conference. We wouldalso like to thank our discussant, David Steward-Patterson, and the conference participants forhelpful comments and suggestions. A shortened version will be published in the journalResearch Policy.


Analytical Studies Branch – Research Paper Series - 1 - Statistics Canada No. 11F0019MPE No. 173
1. Introduction
Despite the fact that adoption of advanced technologies is closely related to productivity gainsand other measures of firm performance (Baldwin, Diverty and Sabourin, 1995; Beaumont andSchroder, 1997; Papaconstantinou et al. 1996; Tracey, Vonderrembse and Lim, 1999), only aboutone-third of Canadian establishments used at least one advanced technology in their productionprocess in 1993 (Baldwin and Sabourin, 1995). This raises the issue as to why some Canadianfirms use advanced technologies extensively but others do not adopt them at all.
The decision to adopt advanced technologies ultimately rests with the benefits the technologyprovides and the costs associated with its adoption. In the 1993 Canadian Survey of Innovationand Advanced Technology, advanced technology users identified a wide range of benefits such asimprovements in productivity, product quality and working conditions; reductions in productioncosts associated with such factors as lower labour requirements and inventory; reduced materialand energy consumption; increased equipment utilization and reduced product rejection(Baldwin, Sabourin and Rafiquzzaman, 1996). At the same time, they also reported a host ofcosts associated with technology acquisition, e.g., education and training, time and cost todevelop required software, and increased maintenance expenses. In addition to these costs, allfirms reported a series of other impediments to their technology adoption. These includeinstitution-related problems associated with tax regimes, and government regulations andstandards; labour-related problems such as shortage of skills, training difficulties, and labourcontracts; organizational or strategic problems associated with difficulties in introducingimportant changes to the organization, management attitude, and worker resistance; information-related problems such as lack of scientific and technical information, technological services, andtechnical support from vendors. Similar lists of impediments have been used to investigatebarriers to innovation (Arundel, 1997).
This paper investigates the importance of impediments to the technology adoption process. Weask whether there is evidence that non-users of technology find that the impediments to adoptionare greater than do technology users and whether there are particular areas where theimpediments are greatest. Section 2 discusses the survey data used and provides an overview ofthe benefits and impediments outlined by plant managers. Section 3 examines the factors that arerelated to a plant reporting that it faces an impediment. The section focuses primarily on whethernon-users of technology are more likely to report an impediment. We find that technology usersare more likely, not less likely, to report many types of impediments. We conclude that barriersto technology adoption, at least as measured in technology surveys, should not be interpreted tobe impenetrable barriers that prevent technology adoption. Rather, these surveys indicate areaswhere successful firms face and solve problems.

Analytical Studies Branch – Research Paper Series - 2 - Statistics Canada No. 11F0019MPE No. 173
2. Advanced Technology Adoption: An Overview of Benefits andImpediments
Since the technology adoption decision is closely related to the net benefits that are perceived toflow from the implementation of new equipment, this section outlines the benefits of advancedtechnology adoption in the Canadian manufacturing sector, and the extent to which firms facevarious impediments. We begin with a brief introduction of the data used in the analysis.
2.1 Data Source
The data used for this analysis are extracted from the 1993 Survey of Innovation and AdvancedTechnology (SIAT) of Statistics Canada. Stratified by size, industry and province, the 1993 SIATsample is randomly drawn from a frame of all establishments in the Canadian manufacturingsector, which is maintained in the Business Register Division of Statistics Canada. There areeight sections to the survey questionnaire. Three sections of the survey examine the incidence ofadvanced technology use at the plant level, the benefits derived therefrom, and the impedimentsthat plants reported as delaying technology adoption. The survey also explores the innovationactivity of the firm owning the plant—incidence of innovation, existence of research anddevelopment units, and the characteristics of the firm’s competitive environment. These dataprovide us with measures of impediments to technology use and measures of the technologicaland innovative activity of establishments and their owning enterprises. In addition, the surveyprovides us with certain general characteristics such as ownership, degree of competition, andextent of employee unionization. More details on the survey can be found in Baldwin andSabourin (1995), and Baldwin, Sabourin and Rafiquzzaman (1996).
Data from the SIAT survey are combined with data drawn from the Census of Manufactures ofStatistics Canada on various characteristics of each of the plants in the survey—size, age,nationality (domestic- or foreign-controlled), and growth over the decade prior to the survey.These and other characteristics are used in a multivariate analysis to determine the factors thatare related to whether a firm indicated that it faced different impediments to the acquisition andadoption of advanced technology.
The survey collects information on 22 detailed advanced manufacturing technologies.1 For thisanalysis, these categories are classified into six groups according to their specific function in theproduction process—design and engineering, fabrication and assembly, automated materialhandling, inspection and communications, manufacturing information systems, and integrationand control. Table 1 itemizes these technologies and the functional group into which they fall.
1 Related surveys that focus only on technology have been done by the Australian Bureau of Statistics (1989) and theU.S. Bureau of the Census (1989, 1993).
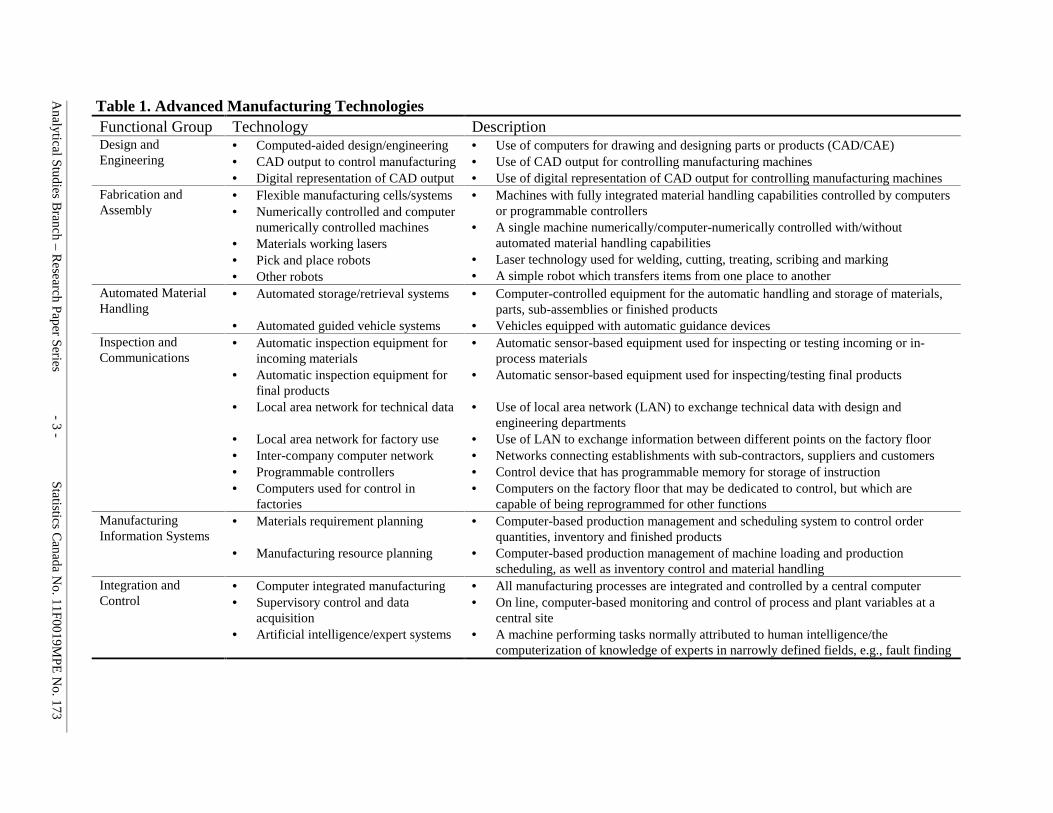
Table 1. Advanced Manufacturing TechnologiesFunctional Group Technology DescriptionDesign andEngineering
• Computed-aided design/engineering• CAD output to control manufacturing• Digital representation of CAD output
• Use of computers for drawing and designing parts or products (CAD/CAE)• Use of CAD output for controlling manufacturing machines• Use of digital representation of CAD output for controlling manufacturing machines
Fabrication andAssembly
• Flexible manufacturing cells/systems• Numerically controlled and computer numerically controlled machines• Materials working lasers• Pick and place robots• Other robots
• Machines with fully integrated material handling capabilities controlled by computersor programmable controllers
• A single machine numerically/computer-numerically controlled with/withoutautomated material handling capabilities
• Laser technology used for welding, cutting, treating, scribing and marking• A simple robot which transfers items from one place to another
Automated MaterialHandling
• Automated storage/retrieval systems
• Automated guided vehicle systems
• Computer-controlled equipment for the automatic handling and storage of materials,parts, sub-assemblies or finished products
• Vehicles equipped with automatic guidance devicesInspection andCommunications
• Automatic inspection equipment forincoming materials
• Automatic inspection equipment forfinal products
• Local area network for technical data
• Local area network for factory use• Inter-company computer network• Programmable controllers• Computers used for control in
factories
• Automatic sensor-based equipment used for inspecting or testing incoming or in-process materials
• Automatic sensor-based equipment used for inspecting/testing final products
• Use of local area network (LAN) to exchange technical data with design andengineering departments
• Use of LAN to exchange information between different points on the factory floor• Networks connecting establishments with sub-contractors, suppliers and customers• Control device that has programmable memory for storage of instruction• Computers on the factory floor that may be dedicated to control, but which are
capable of being reprogrammed for other functionsManufacturingInformation Systems
• Materials requirement planning
• Manufacturing resource planning
• Computer-based production management and scheduling system to control orderquantities, inventory and finished products
• Computer-based production management of machine loading and productionscheduling, as well as inventory control and material handling
Integration andControl
• Computer integrated manufacturing• Supervisory control and data
acquisition• Artificial intelligence/expert systems
• All manufacturing processes are integrated and controlled by a central computer• On line, computer-based monitoring and control of process and plant variables at a
central site• A machine performing tasks normally attributed to human intelligence/the
computerization of knowledge of experts in narrowly defined fields, e.g., fault finding
Analytical S
tudies Branch – R
esearch Paper Series - 3 - Statistics Canada N
o. 11F0019MPE
No. 173

Analytical Studies Branch – Research Paper Series - 4 - Statistics Canada No. 11F0019MPE No. 173
Table 2. Advanced Technology Adoption in the Canadian Manufacturing Sector, 1993Number of Technologies in Use
0 1 to 4 5 to 9 10+% of Shipments 18.9 22.3 26.7 32.1% of Establishments 65.1 23.6 8.6 2.7
Source: Baldwin and Sabourin (1995).
Technology-using plants tend to be large, though not numerous. Establishments that used at leastone advanced technology accounted for over 81% of all Canadian manufacturing shipments in1993 (Table 2).2 However, the adoption of advanced technologies is not extensive. Only a littleover one-third of establishments used at least one advanced technology.
What is it then that leads some firms to use advanced technologies but others to not adopt themat all? The decision to adopt advanced technologies ultimately rests on the benefits that thetechnology provides and the costs associated with its adoption. The latter depend upon theimpediments that firms face. The next two sub-sections outline the benefits and impedimentsassociated with technology adoption.
2.2 Benefits of Advanced Technology Adoption
The benefits of technology use are far ranging—from increasing productivity, to improvingflexibility, to producing higher quality products, to reducing production costs (Beaumont andSchroder, 1997; Rischel and Burns, 1997; Small, 1998).
Improvements in productivity occur when the same output can be produced with fewer inputs.This leads to a reduction in production costs. Production costs can also be reduced when lowercost inputs can be substituted for higher cost inputs, when lower skilled labour can be substitutedfor higher skilled labour. Flexibility is a benefit when product line diversity can be extended bynew technologies. Product quality improvements result from lower scrappage rates or from morereliable products, i.e., computer power sources that have lower failure rates.
The benefits and effects associated with advanced technology adoption reported by managers intechnology-using plants are itemized in Table 3. Since benefits are likely to be technologyspecific and the functional groups adopted correspond to different stages of the productionprocess, the benefits are reported for of each of the four different functional groups describedabove—design and engineering (DE), fabrication and assembly (FA), automatic materialhandling (AMH), and inspection and communications (IC).3 Columns 1 to 4 are weighted byshipments; Columns 5 to 8 by establishments.4 It should be noted, of course, that the functionalgroups are not used independently of one another. But by comparing how the percentage of 2 An additional 3% of shipments were accounted for by establishments that planned to use at least one advancedtechnology within the next two years.3 The other two functional groups of technologies (manufacturing information systems, and integration and control)are relatively uncommon and not as frequently used. Their results are hence not reported.4 Shipment-weighted percentages indicate the proportion of shipments from plants that used the technology.Establishment-weighted percentages present the fraction of establishments using the technology.

Analytical Studies Branch – Research Paper Series - 5 - Statistics Canada No. 11F0019MPE No. 173
plants (weighted or unweighted by shipments) reporting a specific benefit differs acrossfunctional group categories, we can investigate whether the most important categories varies byfunctional group. Generally, they do not.
An improvement in overall productivity (sometimes referred to as total factor productivity) is themost frequently reported benefit associated with advanced technology adoption. Over half ofdesign and engineering, fabrication and assembly, and automatic material handling technologyusers reported an improvement in productivity. The dominance of this benefit is even moreevident when the results are weighted by shipments. Design and engineering, fabrication andassembly, and automatic material handling technology users that registered an improvement inproductivity accounted for 70% to 77% of shipments. Productivity improvement is also the mostimportant benefit category for inspection and communication technology users, but here it sharesthe lead with improvements in product quality.
Overall productivity improvements can be achieved through a variety of means, e.g., a reductionin labour usage, raw material or energy consumption, and better equipment utilization. Tovarious degrees, advanced technology users identify benefits in all of these areas. But thedominant category here is a reduction in labour requirements. Labour costs are not, however,reduced by substituting unskilled for skilled labour. In general, a larger percentage of firmsindicates that skill levels increased rather than decreased. Generally, the second most importantcause of productivity enhancement results from increases in equipment utilization—especially inlarge plants using fabrication and assembly and automated material handling technologies. In allcases, the adoption of advanced technologies led to greater, not less, capital investment. Thus thebenefits of advanced technology use are accompanied by greater costs—both because of the needfor more skilled labour and increases in capital investment.
The second most important benefit resulting from the adoption of advanced technologies is animprovement in product quality. One-third to slightly more than half of users felt that theirproduct quality had improved; the share of total user shipments accounted for by establishmentsreporting such a benefit ranged from a low of 47% for design and engineering technology usersto a high of 65% for technology users in the fabrication and assembly area. Much of this qualityimprovement is associated with lower scrappage rates. The percentage of establishmentsindicating that they had lower product rejection rates as a result of the introduction of advancedtechnologies is almost as high as those indicating that product quality had improved—especiallyso for users of advanced technologies in fabrication and assembly.
Advanced technology users also report that improved product flexibility was a benefit therebyconfirming predictions that new advanced technologies would have a dramatic effect in this area(Young, Francis and Young, 1993; Spina et al., 1996). Finally, a good percentage of firms reportthat working conditions had improved as a result of advanced technology use. In summary,advanced technology users report an impressive list of benefits, with productivity and qualityimprovements being the most important.

Table 3. Benefits and Effects of Advanced Technology Adoption% of Shipments % of Establishments
Benefit/EffectDesign
andengineering
Fabricationand
assembly
Automaticmaterialhandling
Inspectionand
communications
Designand
engineering
Fabricationand
assembly
Automaticmaterialhandling
Inspectionand
communications(1) (2) (3) (4) (5) (6) (7) (8)
Improvement in productivity 70.1 75.9 77.4 54.6 56.0 55.7 54.2 34.3Reduction in labour requirements 48.6 72.1 50.0 31.5 35.3 47.6 54.2 21.7Reduction in material consumption 19.0 34.1 15.0 13.8 17.2 24.0 15.2 10.7Reduction in energy consumption 9.8 24.3 7.7 11.7 7.3 15.1 8.7 6.6Increase in equipment utilization 29.5 43.3 56.3 29.3 13.0 23.8 20.2 12.4Increase in capital requirements 33.2 52.6 58.6 30.1 25.6 35.2 27.3 18.8Reduction in capital investment 3.9 6.1 5.6 3.0 3.0 4.7 3.7 1.5Reduction in inventory 9.3 43.2 20.2 22.1 8.0 22.0 23.0 9.7Improvement in product quality 46.7 65.2 56.8 51.2 43.1 52.9 32.6 33.7Reduction in product rejection 18.3 57.8 52.6 41.3 20.9 39.9 24.2 22.5Reduction in set-up time 38.7 51.2 46.4 11.0 26.8 38.7 19.6 10.8Increase in product flexibility 37.4 48.7 52.5 19.0 30.1 32.2 18.3 12.7Improvement in working conditions 28.5 43.8 58.5 19.2 18.0 33.5 29.8 15.2Reduction in environmentaldamage
5.3 26.2 7.4 11.2 8.4 15.7 11.6 8.4
Increase in skill requirements 54.2 56.0 58.8 47.2 34.0 32.4 25.1 26.4Reduction in skill requirements 8.2 15.8 5.0 5.6 4.8 9.7 7.6 3.1
Note: Benefits and effects are not mutually exclusive; neither is the use of groups of technologies.Source: Baldwin, Sabourin and Rafiquzzaman (1996).
Analytical S
tudies Branch – R
esearch Paper Series - 6 - Statistics Canada N
o. 11F0019MPE
No. 173

Analytical Studies Branch – Research Paper Series - 7 - Statistics Canada No. 11F0019MPE No. 173
2.3 Impediments to Advanced Technology Adoption
The impediments that were investigated in the SIAT survey can be divided into five groups. Thefirst includes a set of general cost-related problems associated with advanced technologyadoption, including the cost of capital, the cost of technology acquisition, the cost of relatedequipment acquisition, the cost of related software development, and increased maintenanceexpenses.
Four other areas were also identified—impediments that arise from government policy (what wecall institutional-related problems), from labour market imperfections, from internal organizationproblems and from imperfections in the market for information. Each of these also increases thecosts of adopting advanced technology—but the causes are somewhat more narrowly focusedthan the general cost-related items that are included in the first category.
Labour-related problems include difficulties that arise because new technologies and innovationgenerally need higher skill levels (Baldwin, Gray and Johnson, 1996; Baldwin and Da Pont,1996). In the face of these needs, a firm may encounter impediments to adoption if there is ashortage of skills available on the market, or if it faces training difficulties in overcomingdeficiencies, or if its labour contracts act to constrain its ability to substitute labour across tasks.
Organizational problems are those associated with difficulties in implementing the types ofinternal change in a firm that are required for the adoption of advanced technologies. The first ofthese is the difficulty in introducing important changes to the organization. For example, theintroduction of computer-aided design may require new structures that link engineeringdevelopment with the production department so that the advantages of concurrent engineeringpractices can be fully exploited. Other organizational problems stem from a poor attitude ofsenior management towards new technologies, or worker resistance.
Institution-related problems are those associated with tax regimes (both the R&D tax credit andcapital cost allowances) and with government regulations and standards. Information-relatedproblems arise if markets for knowledge are imperfect.
They include lack of scientific and technical information, technological services, and technicalsupport from vendors.
Table 4 reports the percentage of plant managers who reported that these problems impeded theadoption of advanced technologies. Two measures of technological activity are used to examinedifferences in the impediments faced by the more technologically active. First, we report thepercentage of technology users and technology non-users that reported the impediment, where atechnology user is defined as a plant that uses any of the 22 advanced technologies. We alsodivide the sample of plants into those whose parent company reported an innovation (defined asthe introduction of a new product or process) in the three year period prior to the survey andthose who did not report an innovation during that period. Columns 1 to 5 contain the percent ofshipments in plants reporting a particular impediment; Columns 6 to 10 the percentage of

Analytical Studies Branch – Research Paper Series - 8 - Statistics Canada No. 11F0019MPE No. 173
establishments (duly weighted to represent the manufacturing population) reporting that theyexperienced the particular impediment. The importance given to the impediments will differ inthe first panel (Columns 1 to 5) from the second panel (Columns 6 to 10) if larger firms are morelikely to designate an impediment as important.
Among the five broad groups of impediments, general cost-related problems are the mostimportant and most frequently reported by firms. Economics is at work in the innovation processin that broad generic classes of costs like equipment and capital are seen to have an impact on theinvestment decision. Contributory cost factors (in order of importance) are cost of equipment,cost of capital investment, cost of technology acquisition, cost of software development, andmaintenance expenses. Over two-thirds of establishments encountered at least one of theseimpediments, accounting for nearly 80% of all manufacturing shipments. Whether we use thepercentage of establishments (Column 6) or the share of shipments (Column 1), the rankings ofthese factors are about the same, thereby indicating that large and small firms place about equalemphasis on these general cost-related impediments.
Labour-related problems, stemming from skill shortages, training difficulties or labour contracts,are the area where specific problems are most important. Some 29% of establishments reportedthem as impediments. Shipments from establishments that experienced at least one of thesedifficulties amounted to 37% of total manufacturing output.
The next most important group are organization-related problems caused by difficulties inintroducing important changes to the organization, management attitude and worker resistance.One out of every five firms experienced one of these problems. Contrary to the other categorieshowever, the share of shipments in plants reporting this problem (34%) is significantly higherthan the percentage of establishments with the problem (21%), thereby indicating that largerestablishments are more likely to have these problems.
The least important category of impediments consists of institution-related problems (associatedwith the R&D investment tax credit, capital cost allowance and government regulations) andinformation-related problems (such as lack of scientific and technical information, lack oftechnological services and lack of technical support from vendors).
If impediments are the primary deterrents to technology use and innovation, it might be expectedthat non-users and non-innovators would report higher impediments. This is not the case. Withrare exceptions, the percentage of users reporting impediments is markedly and consistentlyhigher than among non-users; it is also more frequent among innovators than non-innovators.

Table 4. Impediments to Advanced Technology Adoption% of Shipments % of Establishments
Impediment Allfirms
Technologyuser
Non-user
Innovator Non-innovator
Allfirms
Technologyuser
Non-user
Innovator Non-innovator
(1) (2) (3) (4) (5) (6) (7) (8) (9) (10)Cost-related 79.1 83.5 58.7 82.9 66.4 68.5 76.9 63.1 72.6 65.9 Capital 49.2 50.7 42.1 49.8 46.9 47.0 48.9 45.7 47.6 46.6 Equipment 56.4 58.6 46.1 59.6 45.6 53.0 58.8 49.3 56.7 50.8 Software development 21.8 23.6 12.9 21.6 22.4 17.5 22.9 14.1 21.1 15.4 Maintenance 13.3 14.0 10.1 14.1 10.7 12.4 12.8 12.1 12.2 12.5 Technology acquisition 28.8 30.1 23.1 30.1 24.6 27.9 28.1 27.8 26.9 28.5
Institution-related 15.5 15.9 13.2 16.5 11.9 16.4 16.6 16.4 18.6 15.1 R&D investment tax credit 7.6 8.0 5.8 8.7 3.8 7.7 9.8 6.4 11.7 5.3 Capital cost allowance 8.7 9.5 4.9 9.7 5.0 8.4 9.5 7.6 9.9 7.4 Regulations and standards 7.2 7.4 6.3 6.8 8.4 9.9 8.1 11.1 9.3 10.3
Labour-related 37.2 39.9 24.2 39.0 30.9 28.8 34.5 25.2 33.7 25.8 Skill shortage 22.8 24.3 15.7 24.0 18.7 20.2 22.7 18.6 23.3 18.3 Training difficulty 19.3 20.7 12.8 19.8 17.5 16.8 20.5 14.4 18.0 16.0 Labour contract 13.0 14.2 7.3 13.4 11.3 5.8 7.2 4.9 7.2 4.9
Organization-related 34.1 37.3 18.9 35.9 28.1 20.9 26.1 17.7 24.9 18.5 Difficulty in introducing change 23.3 25.7 11.9 25.4 16.2 13.0 15.9 11.1 17.2 10.4 Management attitude 16.7 18.5 8.3 16.8 16.4 7.9 9.4 7.0 9.2 7.2 Worker resistance 11.0 11.3 9.4 11.5 8.9 9.0 10.7 7.9 9.8 8.5
Information-related 24.9 26.6 16.8 27.2 17.1 16.0 19.6 13.7 22.0 12.3 Lack of information 12.4 12.3 12.9 12.9 10.7 10.4 10.5 10.4 13.3 8.7 Lack of service 9.8 10.1 8.3 10.4 7.7 7.7 8.2 7.4 10.4 6.0 Lack of support from vendors 10.9 11.3 8.8 11.5 8.8 8.6 11.0 7.1 12.1 6.4Note: Impediment groups as well as sub-group components are not mutually exclusive. Group-level results refer to incidence of experiencing any of theimpediments within the group.
Analytical S
tudies Branch – R
esearch Paper Series - 9 - Statistics Canada N
o. 11F0019MPE
No. 173

Analytical Studies Branch – Research Paper Series - 10 - Statistics Canada No. 11F0019MPE No. 173
A learning-by-doing model of technology adoption can explain this phenomenon. Firms have toassess the benefits of implementing technological changes. Firms that are innovative reapsubstantial benefits as we have already demonstrated. In order to reap those benefits, they have toincur the higher costs of new equipment and of research and development facilities. Otherresearch has shown that there are many types of costs that are higher for technology users andinnovators. For one, more technologically advanced firms find that their skill requirementsincrease after new technologies are introduced (Baldwin, Gray and Johnson, 1996). Training ismore likely in firms that are high-tech users or innovators (Baldwin, 1999). Moreover, firms thatare innovators are more likely to be developing greater competencies in other areas besides justhuman resources. Baldwin and Johnson (1996 and 1999) show that more innovative firms(especially those that introduced new products and new processes) develop greater competenciesin a wide range of areas. They gain more from their high-risk innovation strategy, but they riskmore and they incur higher costs because they have to master a wider range of competencies.
Therefore, when we compare users and non-users, we are dealing with two very differentpopulations. Technology users or innovative firms have been exposed to the problems that comewith an innovative strategy. Before adopting new technologies, firms have a basic understandingof the problems that they will face. This impression is correct only with regards to the broadoverview of the relative importance of the different problems that they face. As proof of this, therelative ranking for users and non-users is quite similar—the correlation between the scores ofusers and non-users or innovators and non-innovators (whether using percentage ofestablishments or percentage of shipments is over 0.95). But the level of impediments isgenerally lower for non-users or for non-innovators. It is by attempting an innovative ortechnologically advanced strategy that a firm learns about the true intensity of the problems thatit has to solve.
The one area where differences between technology users and non-users are generally smaller iswith respect to government policy. When it comes to assessing the usefulness of R&D subsidyprograms or the problems with government regulations, non-users are able ex ante to betterassess the likelihood that government activity will benefit or restrict them.
In summary, we should expect a more advanced technology strategy to lead to more impedimentsbeing reported. While differences in impediments between technology users and non-users maybe explained in the context of the learning-by-doing process of technology adoption, there areother factors that may come into play that need to be examined within a multivariate framework.Previous work has shown that there are inherent differences in terms of certain firmcharacteristics between technology users and non-users; and between innovating firms and non-innovating ones.5 It may be that these characteristics also contribute to the observed differencesin impediments. In the next section, we ask whether differences in the impediments persist aftercontrolling for firm characteristics.
5 For example, Baldwin and Diverty (1995) have shown that technology use is positively associated with firm sizeand output growth; the tendency for larger firms to be more innovative is also well documented (e.g., Baldwin,Gellatly, Johnson and Peters (1998); Evangelista and Sirilli (1997); Cosh, Hughes and Wood (1996)).
Analytical Studies Branch – Research Paper Series - 11 - Statistics Canada No. 11F0019MPE No. 173
3. Determinants of Impediments to Advanced Technology Adoption
To examine the factors that are associated with impediments, we use multivariate analysis torelate the probability of reporting an impediment to whether a plant is technologically advancedand a set of plant characteristics, such as size, growth, region, and degree of innovativeness.
The regressions are performed for each of the five major groups of impediments: cost-related,institution-related, labour-related, organization-related, and information-related. For each group,the dependent variable takes a value of one if a plant reports any of the problems within thegroup; the value of zero otherwise. Since the dependent variable is dichotomous, we estimate therelationship with a logistic regression.6
3.1 Alternative Measures of Technologic and Innovative Activity
Four different measures of technological activity are used to test the robustness of our hypothesisthat impediments are higher in more technological advanced or more innovative firms.
The first is USER—Whether the plant uses advanced technology in the production process at all.This is a dichotomous variable taking a value of one if the plant uses any of the 22 technologiesand zero otherwise. This measure distinguishes technology users from non-users but does nottake into account the intensity of technology use.
The second TECHUSE measures the total number of advanced technologies in use. This is acontinuous variable reflecting the total number of advanced technologies that a firm uses and itranges in value from 0 to 22. This measure takes into account the intensity of technology use. Itsform imposes a monotonic relationship between the number of technologies in use and theprobability of reporting an impediment.
The third consists of a set of binary variables capturing different intensities—0, 1 to 4, 5 to 9 and10 and more technologies. This measure takes into account the intensity of technology use and itallows for the possibility of a non-linear impact of the number of technologies that are used.
It should be noted that the first three measures essentially nest within each other, therebyallowing us to test whether capturing intensity as opposed to incidence of use matters.
Finally, the fourth variable—INNOV—measures whether the plants were innovative. Thisvariable is broader than just the technology use variable. Innovative activities are measured by adichotomous variable indicating if the plant’s controlling firm introduced either a major productor process innovation in the three years prior to the survey.
6 Probit analysis, an alternative for dichotomous dependent variables, was tried and resulted in the same qualitativeresults.

Analytical Studies Branch – Research Paper Series - 12 - Statistics Canada No. 11F0019MPE No. 173
3.2 Plant Characteristics
Certain plant characteristics have been shown to be closely related to whether technology is used(Baldwin and Diverty, 1995) or whether a firm is innovative (Baldwin, Hanel and Sabourin,2001). These include region, industrial sector, intensity of competition, age, output growthpatterns, ownership, size and unionization.
These variables are included because they are expected to represent aspects of technology usethat are not captured by the technology variables used. While we include variables such as USERor TECHUSE that measure the amount of technology use, these variables cannot completelycapture the complexity or sophistication of the actual technological environment. Since larger,younger and foreign-controlled plants are more likely to use any technology (Baldwin andDiverty, 1995; Baldwin and Sabourin, 1997), we expect that plants with these characteristics aremore technologically advanced in many dimensions and, therefore, should be more likely toreport an impediment. Size of the establishment is measured by four binary variables capturingthe number of employees: under 20, 20 to 99, 100 to 499, and 500 and over. Age of the firm ismeasured by three binary variables: born prior to 1975, between 1975 and 1984, and after 1984.
We also include regional binary variables to capture the same technological-intensityphenomenon. The incidence of advanced technology use is less in Atlantic Canada and Quebecrelative to other provinces (Baldwin and Sabourin, 1995) and, therefore, the overall technicalsophistication of these regions should also be reflected in generally lower impediments. Fiveeconomic regions are used in the regression analysis: Atlantic Canada consists of Newfoundland,Prince Edward Island, Nova Scotia and New Brunswick; Quebec; Ontario; the Prairie provinces,which includes Manitoba, Saskatchewan and Alberta; and British Columbia.
Growth of the plant is included for three reasons. First, growth is a measure of success andsuccess is highly correlated with the degree of innovativeness in a firm (Baldwin, 1996; Baldwinand Johnson, 1998). Although we capture major innovations with INNOV, there are other moreminor aspects that are omitted and that the growth variable is meant to represent. Therefore, weshould expect growth to be positively related to impediments. Second, growing firms aretechnological sophisticated (Baldwin and Diverty, 1995). Third, growth itself leads to problems.Growing firms have to learn how to deal with the problems associated with larger size. Growingorganizations have to change. New labour skills associated with running a larger firm arerequired. These problems are likely to be particularly severe in the area of labour impediments.Output growth patterns are measured as the change in a plant’s manufacturing shipments over the10-year period from 1982 to 1992. Ranking firms according to their growth in shipments duringthis period, we create three growth classes with an equal number of firms in each class. These arelow or negative growth, medium growth, and high growth. Nationality of ownership isrepresented by a binary variable, CANADIAN, that takes a value of one if the plant’s parentindicated that it was controlled by Canadians and zero, otherwise.

Analytical Studies Branch – Research Paper Series - 13 - Statistics Canada No. 11F0019MPE No. 173
The importance of unionization in a plant is also posited to be related to impediments—thoughnot necessarily because of any connection to technological sophistication. Rather it is includedbecause it is sometimes seen as a factor that would make technology adoption more difficultbecause it increases the costs to management of changing work patterns during the introductionof new technological processes. Unionization is a binary variable that takes on a value of one ifthe parent firm reports that any of its employees are covered by a collective agreement.
We also posit that the environment within which a plant operates will affect the nature of theimpediments that are encountered. The first characteristic that we consider is whether theindustry environment is advanced with regards to the degree of innovation being produced. Someindustries are more innovative and, therefore, plants in these industries are more likely to faceimpediments. The innovative environment is captured with an industry taxonomy developed byRobson, Townsend and Pavitt (1988) that has been used successfully in research that explains theprobability that a firm will innovate (Baldwin, Hanel and Sabourin, 2001). Firms are classifiedinto three sectors according to their industrial activities: core innovative sector, secondaryinnovative sector, and other innovative sector.7 The core sector is the one that has been found inwork for the UK and the US (Robson, Townsend and Pavitt, 1988) and for Canada (Baldwin andHanel, 2002) to be the sector that produces more innovations than it uses. The "other" sectoringests new products and machinery and equipment from the core and secondary sectors. Ifproduction of an innovation rather than its adoption is a signal of sophistication, we shouldexpect the core, secondary and "other" sectors to rank in this order with regards to the probabilityof reporting an impediment.
The second environmental characteristic that is posited to affect the development of impedimentsis the competitive environment. Competition is important in that it affects innovation ortechnological competencies. Elsewhere, we have found that there is a positive relationshipbetween competition and innovation (Baldwin, Hanel and Sabourin, 2001). The intensity ofcompetition that a firm faces is measured by the number of rivals directly competing in themarketplace for the sale of its main product(s): 0 to 5 competitors, 6 to 19 competitors, and 20 ormore competitors. More detail on variables, as well as sample statistics, are reported in Table 5.
3.3 Empirical Results
The regression results for the probability of reporting impediments in each of the five major areasare reported in Table 6. The coefficients are all calculated against the omitted category—which isa plant that did not use advanced technologies, did not introduce innovation, was located inOntario, was in the “other” innovation using sector, faced the smallest number of competitors (5or less), was born before 1975, was a slow grower, was foreign-owned, was in the smallest sizeclass (less than 20 employees), and whose employees were not unionized. The regressions areestimated on a sample of 1,936 establishments. Column 1 contains the estimates for cost-related
7 The core innovative sector includes refined petroleum, chemical, electrical and electronic industries; the secondaryinnovative sector includes fabricated metals, rubber and plastics, transportation equipment, primary metals, and non-metallic minerals; the other innovative sector includes paper, wood, food and beverages, textile and clothing,printing and publishing, furniture and fixture, and other manufacturing industries.

Analytical Studies Branch – Research Paper Series - 14 - Statistics Canada No. 11F0019MPE No. 173
problems; Column 2 for institution-related problems; Column 3 for labour-related problems;Column 4 organization-related problems; and Column 5 for information-related problems. In thistable, we measure technology use by the range of number of technologies in use. Results forother measures—incidence of technology use, intensity of technology use, and an interactiveterm between using technology and being an innovator are presented in Appendix Tables A1through A3. Table A1 reports the regression results when technology use is measured by a singledummy variable indicating whether a firm uses advanced technology or not; Table A2 whentechnology use is measured by the actual number of technologies used; and Table A3 when firmactivities are measured by the interaction between technology use and innovation—non-user non-innovator, non-user innovator, user non-innovator, and user innovator.
The parameter estimates in Table 6 show the qualitative impacts of the explanatory variables. Tobetter describe the quantitative impacts of each of the variables, we report in Table 7 theprobability that each of the five advanced technology adoption impediments will occur. Theseprobabilities are estimated using the regression results presented in Table 6, evaluated at thesample mean values.8 Again, Column 1 contains estimates for cost-related problems; Column 2for institution-related problems; Column 3 for labour-related problems; Column 4 fororganization-related problems; and Column 5 for information-related problems.
The results demonstrate that technology use is positively associated with impediments in almostall areas. From Table 6, we can see that those plants reporting the use of 10 or more technologiesare significantly more likely to have faced cost impediments, institutional impediments, labourimpediments, and information impediments. When only incidence is used (USER), a significanteffect is found for cost-related, labour and organization problems (Table A1). When intensity oftechnology use (TECHUSE) is included, a significant effect is found for cost-related, and labourproblems (Table A2).
Innovators are found to report significantly greater institutional, and information impediments.When technology users are divided into innovators and non-innovators (Table A3), theinnovators are found to have a greater likelihood than non-innovators of reporting impedimentsfor institutional and informational impediments. But what is most significant is that thecombination of being a technology user and an innovator is significantly related to allimpediments. Firms that are using advanced technologies and reporting an active innovationprogram are solving more complex, more comprehensive technological problems. That thisgroup is most likely to report impediments in all areas lends support to our hypothesis thatimpediments are realized as a firm implements a complex innovation strategy.
The effect of the intensity of technology use can be quite large. For example, other things beingequal (evaluating at the mean value), the probability of a plant reporting cost-related problems isestimated to be 89% among plants that use 10 or more technologies compared to 66% amongnon-users (Table 7)—an increase of over 20 percentage points. For institution-related problems,it increases from 14% to 29%. By way of comparison, going from non-innovative to innovativestatus increases the probability of facing institution-related impediments from 13% to 17%. The
8� ���� ������� ������� � ������ �� � ���������� �� ��� �� ������� ��� � �� �� �� � �����!�� � ����� ������ �� �� ��probability.

Analytical Studies Branch – Research Paper Series - 15 - Statistics Canada No. 11F0019MPE No. 173
probability of reporting labour-related impediments increases by about 15 percentage pointsbetween non-users and users of 10 or more technologies; and the probability of reportinginformation-related impediments differs by 7 percentage points. The effect of being an innovatoris 8 percentage points in the case of information-related impediments.
These results then demonstrate both a certain commonality, but they also show that thedeterminants of the impediments vary from one group to another. This is the case for most of theother variables.
Other important plant characteristics affecting several areas include the intensity of competition aplant faces, and the age of a firm. Specifically, for cost-, labour- and information-relatedproblems, the more competitors a firm faces, the higher the likelihood it faces such problems.The probability of cost-related problems is 10 percentage points higher for those that face 20 ormore competitors than for those facing 0 to 5 competitors (75% versus 65%). The difference is 8and 5 percentage points for labour- and information-related problems. This confirms ourhypothesis that the effect of competition arises because competition engenders moretechnological competencies.
There are also substantial regional effects that accord with our technological intensity hypothesis.Firms in Atlantic Canada and Quebec report significantly fewer cost- and labour-relatedproblems than they were expected to do—based on their lower technology use. There is about 10percentage points difference between firms located in Atlantic Canada and in Ontario for cost-related impediments.
Younger plants are also more likely to experience cost-, institutional- and labour-relatedproblems. Some 77% of those born after 1984 face cost-related problems compared to 64% ofthose born prior to 1975. Younger firms face about 10 percentage points difference (26% versus16%) for labour-related problems and a 7 percentage points difference (18% versus 11%) forinformation-related problems. Since younger plants are more likely to be advanced technologyusers, the positive relationship between youth and impediments also accords with our maintainedhypothesis.
Unionization significantly increases the probability of labour and organizational impediments. Aplant that reports its employees are covered by a collective agreement increases its probability ofreporting impediments in each of these areas by about 3 to 5 percentage points; but this is arelatively small effect compared to most of the other variables.
Growth has the expected effect on labour-related problems. Plants that are faster growers arelikely to report more labour-related problems. The difference between the slowest and fastestgrowing categories is 6 percentage points. Another variable that has little impact on impedimentsis the innovation sector within which a plant finds itself. Thus, there is little to distinguishinnovation-producing from innovation-using sectors in terms of the impediments that are faced.

Analytical Studies Branch – Research Paper Series - 16 - Statistics Canada No. 11F0019MPE No. 173
There is generally no significant effect of ownership on the probability that an impediment isreported—except in the area of information flows. Even here the effect is relatively small—only4 percentage points.
How do the various impediment categories compare? For cost-related impediments, technologyuse, region, competition, age, and growth matter. Institution-related problems are likely to behigher when a firm uses multiple advanced technologies, performs innovative activities, is inOntario, in the core sector, has more competitors, and is younger. Compared to cost-relatedproblems, innovation matters more when firms assess whether the government programs—capital cost allowance, R&D assistance and regulation—provide impediments.
For labour-related problems, the general pattern that was observed for cost- and institution-related problems holds. Technology use is important—as is competition, age, and region. Theyounger the firm is, the higher is the likelihood of labour-related problems (the probability is26% for those born since 1985, 21% for those born between 1975 and 1984, and 16% for thoseborn before 1975). Similarly, faster growing firms are more likely to experience labour-relatedproblems (the probability is 24% for those experiencing medium to high growth compared to18% for those experiencing low or negative growth). Once again, marked regional differences areobserved—establishments located in Atlantic Canada and Quebec have a probability of 18% and14% of experiencing labour-related problems compared to 26% for those located in the rest ofthe country. In contrast to the cost and institution-related areas, unionization is important forlabour-related problems.
There are fewer significant determinants of organization-related problems than in the case ofeither cost-, institutional- or labour-related problems. Region, competition and age matter here aselsewhere, but the effect of technology use is less; innovation combined with technology usebecomes significant—thereby suggesting that organizational problems are more important infirms that have adopted a complex technology/innovation strategy. Size is more important herethan it was for the other categories, but it is the medium-sized plants not the largest ones that aremore likely to report impediments. Unionization increases organizational impediments, one ofwhich is worker resistance to change.
Information-related problems also are characterized by the common technology, competition andage variables. But here innovation by itself is significant and when interacted with technologyuse (Table A3). What is also unique about this category is that Canadian-owned plants facesignificantly more impediments when it comes to information problems, while this does notoccur for the other categories.

Analytical Studies Branch – Research Paper Series - 17 - Statistics Canada No. 11F0019MPE No. 173
Table 5. Variable Definition and Sample StatisticsVariable Definition Means Std. Dev.COSTPROB = 1 if any cost-related problem is reported 0.6848 0.4647INSTPROB = 1 if any institution-related problem is reported 0.1644 0.3707LABOPROB = 1 if labour-related problem is reported 0.2883 0.4531ORGAPROB = 1 if any organization-related problem is reported 0.2095 0.4071INFOPROB = 1 if any information-related problem is reported 0.1598 0.3665USER = 1 if any technology is used 0.3886 0.4876TECH USE = Total number of technologies used 1.5936 2.8457Number of tech use: 1-4 = 1 if 1-4 technologies are used 0.2509 0.4337 5-9 = 1 if 5-9 technologies are used 0.1047 0.3062 10+ = 1 if 10+ technologies are used 0.0330 0.1786Use of functional tech: DE tech = 1 if any design and engineering technology is used 0.2734 0.4458 FA tech = 1 if any fabrication and assembly technology is used 0.1855 0.3888 AMH tech = 1 if any automatic material handling technology is used 0.0313 0.1741 IC tech = 1 if any inspection and communication technology is used 0.2174 0.4126 Innovator = 1 if any innovating activity is introduced 0.3804 0.4856Region: Atlantic = 1 if locates in Atlantic Canada 0.0487 0.2153 Quebec = 1 if locates in Quebec 0.3182 0.4659 Ontario = 1 if locates in Ontario 0.3958 0.4892 Prairie = 1 if locates in the Prairie provinces 0.1522 0.3593 British Columbia = 1 if locates in British Columbia 0.0851 0.2792Industrial sector: Core innovative = 1 if one of the core innovative industries 0.1554 0.3624 Secondary innovative = 1 if one of the secondary innovative industries 0.3080 0.4618 Other innovative = 1 if one of the other innovative industries 0.5366 0.4988Number of competitors: 0-5 = 1 if facing 0-5 competitors 0.2841 0.4511 6-19 = 1 if facing 6-19 competitors 0.3042 0.4602 20+ = 1 if facing 20+ competitors 0.4117 0.4923Year of birth: Prior to 1975 = 1 if born before 1975 0.2918 0.4547 1975-1984 = 1 if born between 1975 and 1984 0.2908 0.4543 After 1984 = 1 if born after 1984 0.4174 0.4933Output growth patterns: Low = 1 if experiencing low shipment growth 0.3507 0.4773 Medium = 1 if experiencing medium shipment growth 0.4239 0.4943 High = 1 if experiencing high shipment growth 0.1987 0.3991 Canadian = 1 if owned by Canadians 0.8798 0.3252Number of employees: 1-19 = 1 if 1-19 employees 0.5177 0.4998 20-99 = 1 if 20-99 employees 0.3446 0.4754 100-499 = 1 if 100-499 employees 0.1204 0.3256 500+ = 1 if 500+ employees 0.0172 0.1301Union = 1 if employees are unionized 0.2917 0.4547Number of observations 1936
Note: Sample statistics are weighted by the establishment weight.

Table 6. Logistic Regression Results for Reporting Technology Adoption ImpedimentsIndep. Var. Dep. Var. = Costprob
(1)Dep. Var. = Instprob
(2)Dep. Var. = Laboprob
(3)Dep. Var. = Orgaprob
(4)Dep. Var. = Infoprob
(5)Coefficient T-ratio Coefficient T-ratio Coefficient T-ratio Coefficient T-ratio Coefficient T-ratio
1-4 tech use 0.6320 4.80 -0.1897 -1.16 0.1665 1.30 0.2015 1.43 0.0610 0.375-9 tech use 0.5623 2.84 0.0731 0.32 0.2337 1.27 0.2209 1.10 0.6219 2.9510+ tech use 1.3727 3.22 0.9125 2.62 0.7218 2.38 0.4455 1.40 0.5691 1.66Innovator 0.1558 1.30 0.3297 2.25 0.1555 1.30 0.0813 0.62 0.6460 4.38Atlantic -0.5790 -2.50 -1.2703 -3.18 -0.5121 -1.96 -0.6865 -2.09 0.3317 1.11Quebec -0.2243 -1.79 -1.0762 -6.35 -0.7705 -5.71 -0.1232 -0.87 0.0919 0.57Prairie 0.1437 0.90 -0.5582 -2.88 -0.0762 -0.50 0.0903 0.53 0.4510 2.43British Columbia 0.0175 0.09 -0.2143 -0.96 0.0890 0.48 -0.3519 -1.52 -0.1640 -0.63Core sector 0.0061 0.04 -0.3420 -1.69 0.1179 0.75 -0.1585 -0.92 0.2859 1.56Secondary sector -0.1780 -1.54 -0.0622 -0.43 0.1095 0.92 -0.2655 -1.97 0.0276 0.186-19 competitors 0.3797 2.89 0.4303 2.53 0.2288 1.62 0.1603 1.04 0.3961 2.2720+ competitors 0.4832 3.88 0.1729 1.05 0.4489 3.38 0.2898 1.98 0.4292 2.56Born 1975-1984 0.3280 2.33 -0.0453 -0.23 0.3492 2.29 0.2916 1.81 -0.0516 -0.27Born after 1984 0.6805 4.91 0.5428 3.05 0.6056 4.09 0.1719 1.08 0.5053 2.88Medium growth 0.0164 0.14 0.2961 2.05 0.3366 2.76 0.0666 0.49 -0.1068 -0.71High growth -0.2579 -1.46 0.0592 0.26 0.3447 1.96 0.1733 0.93 0.1237 0.59Canadian-owned 0.2579 1.42 -0.0045 -0.02 0.1148 0.65 -0.1523 -0.83 0.3817 1.7320-99 employees -0.1002 -0.75 -0.4053 -2.42 -0.0588 -0.43 0.1328 0.88 -0.0792 -0.46100-499 employees 0.6225 2.54 -0.4448 -1.50 0.3909 1.71 0.5630 2.32 0.0390 0.14500+ employees 0.5948 1.08 -1.3722 -2.09 0.3599 0.80 0.5632 1.22 -0.2321 -0.44Union 0.1007 0.80 0.1977 1.27 0.2094 1.65 0.2975 2.19 0.1334 0.86Constant -0.3147 -1.29 -1.6852 -5.40 -1.9094 -7.47 -1.7711 -6.60 -3.0828 -9.60Summary statistics: N 1936 1936 1936 1936 1936 n (Dep. Var. = 1) 1326 318 558 406 309 LL function -1147.3 -814.8 -1106.5 -961.4 -810.0��� 2 118.5 100.6 112.6 64.6 81.2 % right prediction 70.3 83.6 71.6 79.0 84.2
Note: The reference groups are firms using no advanced technology, performing no innovative activities, located in Ontario, belonging to the “other” industrialsector, facing 0-5 competitors, born prior to 1975, experiencing low output growth, owned by foreigners, with 1-19 employees, and employees are not unionized.Critical values for t statistics are 2.58 for a 1% two-tailed test, 1.96 for 5% two-tailed test and 1.65 for a 10% two-tailed test.
Analytical S
tudies Branch – R
esearch Paper Series - 18 - Statistics Canada N
o. 11F0019MPE
No. 173

Analytical Studies Branch – Research Paper Series - 19 - Statistics Canada No. 11F0019MPE No. 173
Table 7. Estimated Probability of Experiencing Technology Adoption ImpedimentsCost-
relatedInstitution-
relatedLabour-related
Organization-related
Information-related
(1) (2) (3) (4) (5)Percent
Number of tech use: 0 66.1 14.4 21.1 17.8 12.7 1-4 78.6 14.4 21.1 17.8 12.7 5-9 77.4 14.4 21.1 17.8 21.4 10+ 88.5 29.5 35.5 17.8 20.5Innovator 71.7 17.5 21.5 17.8 19.1Non-innovator 71.7 13.3 21.5 17.8 11.0Region: Atlantic 61.1 7.4 17.7 10.2 12.9 Quebec 69.2 8.8 14.2 18.3 12.9 Ontario 73.7 22.0 26.4 18.3 12.9 Prairie 73.7 13.9 26.4 18.3 18.9 British Columbia 73.7 22.0 26.4 18.3 12.9Industrial sector: Core innovative 71.7 11.5 21.5 19.1 13.7 Secondary innovative 71.7 15.5 21.5 15.3 13.7 Other 71.7 15.5 21.5 19.1 13.7Number of competitors: 0-5 65.0 13.2 18.5 16.2 10.5 6-19 73.1 19.0 18.5 16.2 14.9 20+ 75.0 13.2 26.2 20.5 15.3Year of birth: Before 1975 63.5 12.1 16.1 16.6 11.4 1975-1984 70.7 12.1 21.4 21.1 11.4 After 1984 77.4 19.2 26.0 16.6 17.6Output growth patterns: Low 71.7 13.3 18.1 17.8 13.7 Medium 71.7 17.1 23.7 17.8 13.7 High 71.7 13.3 23.8 17.8 13.7Canadian-owned 71.7 14.8 21.5 17.8 14.2Foreign-owned 71.7 14.8 21.5 17.8 10.2Number of employees: 1-19 70.2 17.0 20.7 16.9 13.7 20-99 70.2 12.0 20.7 16.9 13.7 100-499 81.4 17.0 27.8 26.3 13.7 500+ 70.2 4.9 20.7 16.9 13.7Union 71.7 14.8 24.1 21.1 13.7Non-union 71.7 14.8 20.5 16.6 13.7
Note: Probabilities are calculated by setting coefficients insignificantly different from zero at 10% to zero andevaluated at the sample mean values. For dummy variables, this is done by using the sum of the unweightedcoefficient of the variable and the weighted coefficients of other groups of dummy variables, where the weight is thecorresponding variable’s share in the sample.

Analytical Studies Branch – Research Paper Series - 20 - Statistics Canada No. 11F0019MPE No. 173
In short, while there is a common set of factors that significantly affect the likelihood of a firmreporting impediments, there are important differences. Cost-related problems are positivelyassociated primarily with the intensity of technology use, the intensity of competition, andyounger firms. Institution-related problems are more common among innovators and youngerestablishments. Regional differences associated with the actual probability of reporting animpediment are also quite striking in institution-related problems. Labour-related problems aremore serious among firms that extensively use advanced technology, that face more intensivecompetition, in younger establishments, and in those experiencing higher growth. Organization-related problems are more characteristic of older, big and unionized establishments. Information-related problems are more typical among technology users; among innovators; among youngfirms; and among Canadian-owned establishments.
4. Conclusion
This paper has investigated various problems that firms in the Canadian manufacturing sectorface as they adopt advanced technology. Although extremely important, the use of advancedtechnology is not widespread among manufacturing plants. One explanation lies in the fact thatwhile advanced technologies provide a wide range of benefits, plants also face a series ofimpediments that prevent them from adopting advanced technology. There are broadly fivecategories of problems faced by firms—cost-related, institution-related, labour-related,organization-related, and information-related.
Cost-related problems include cost of capital, cost of technology acquisition, cost of relatedequipment acquisition, cost of related software development, and increased maintenanceexpenses. Institutional-related problems stem from taxation practices involving R&D investment,tax credits and capital cost allowances, and from government regulations and standards. Labour-related problems arise from a shortage of skills, training difficulties, and labour contracts.Organization-related problems are associated with difficulties in introducing changes to a firm’sstructure that are required for ingesting new technologies, poor management attitude, and workerresistance. Information-related problems arise from lack of scientific and technical information,technological services, and technical support from vendors.
With rare exceptions, it is observed that the percentage of plants reporting impediments ismarkedly and consistently higher among technology users than non-users; more frequent amonginnovating firms than those not introducing innovation. This suggests that impediments ariseduring the innovation process as firms learn by doing. Users in the process of adopting newtechnologies are confronted with various problems and must overcome them. Non-users mayhave a general idea of the importance of the various impediments, but until they face them theyare unable to appreciate their severity. Some of these problems are very complex in nature, andtheir magnitudes cannot be easily determined ex ante.
Regression analysis confirms that many of the impediments are related to variables that capturethe technological complexity of the firms—either incidence or intensity of technology use andinnovator competencies. But these impediments are also positively associated with many plant

Analytical Studies Branch – Research Paper Series - 21 - Statistics Canada No. 11F0019MPE No. 173
characteristics that are correlated with technological competencies. Both of these factssubstantiate the view that impediments are learned. They may be barriers; but they are barriersthat do not stop innovation and the adoption of new technologies. They are obstacles that areovercome as technology is introduced into the plant. This confirms associated work thatexamined the differences between innovative and non-innovative firms in the service sector(Gellatly and Peters, 1999).
This view influences the way in which impediments outlined in technology and innovationsurveys should be interpreted. They should not be interpreted as impenetrable barriers thatprevent technological adoption. No doubt, such problems exist—but they are not what are beingmeasured in these surveys. Rather these surveys indicated the area where successful firms faceand solve problems. As such, they provide a guide as to the areas where those problems are likelyto be more intense—though we must be cautious here with our interpretation because we do nothave dollar measures; we only have the frequency of impediments that are reported.
It is also noteworthy that the nature of problems that have to be addressed differs across thevarious actors involved. Cost-related problems are higher where there is more competition andyounger establishments. Institution-related problems are more common among innovators andyounger establishments. Labour-related problems are more serious among firms that extensivelyuse advanced technology, that face more intensive competition, younger establishments, andthose experiencing higher growth. Organization-related problems are more likely in older,medium-sized and unionized establishments. Information-related problems are more typicalamong technology users; among innovators; among young firms; and among Canadian-ownedestablishments. Regional differences are also observed in all of these groups of impediments.Plants in the more technologically advanced regions face more impediments.

Appendix
Table A1. Logistic Regression Results for Reporting Technology Adoption Impediments (Use of technology or not)Indep. Var. Dep. Var. = Costprob
(1)Dep. Var. = Instprob
(2)Dep. Var. = Laboprob
(3)Dep. Var. = Orgaprob
(4)Dep. Var. = Infoprob
(5)Coefficient T-ratio Coefficient T-ratio Coefficient T-ratio Coefficient T-ratio Coefficient T-ratio
User 0.6467 5.33 -0.0581 -0.40 0.2110 1.78 0.2193 1.68 0.2325 1.59Innovator 0.1604 1.35 0.3620 2.49 0.1700 1.43 0.0871 0.66 0.6778 4.64Atlantic -0.5789 -2.50 -1.2743 -3.19 -0.5129 -1.97 -0.6863 -2.10 0.3170 1.06Quebec -0.2230 -1.78 -1.0575 -6.27 -0.7666 -5.69 -0.1231 -0.87 0.0879 0.54Prairie 0.1417 0.89 -0.5549 -2.87 -0.0786 -0.51 0.0882 0.52 0.4510 2.44British Columbia 0.0100 0.05 -0.2393 -1.08 0.0770 0.41 -0.3582 -1.55 -0.1802 -0.69Core sector 0.0154 0.10 -0.2974 -1.48 0.1368 0.88 -0.1491 -0.87 0.2994 1.65Secondary sector -0.1761 -1.52 -0.0606 -0.42 0.1130 0.95 -0.2637 -1.96 0.0280 0.196-19 competitors 0.3869 2.95 0.4232 2.50 0.2321 1.65 0.1625 1.05 0.3644 2.1020+ competitors 0.4847 3.90 0.1775 1.08 0.4525 3.41 0.2910 1.99 0.4217 2.52Born 1975-1984 0.3312 2.35 -0.0393 -0.20 0.3523 2.31 0.2935 1.82 -0.0623 -0.33Born after 1984 0.6821 4.93 0.5509 3.10 0.6087 4.12 0.1740 1.09 0.5178 2.96Medium growth 0.0131 0.11 0.2993 2.07 0.3358 2.75 0.0654 0.48 -0.0927 -0.62High growth -0.2622 -1.49 0.0700 0.31 0.3439 1.96 0.1721 0.93 0.1364 0.65Canadian-owned 0.2564 1.42 -0.0327 -0.15 0.1038 0.59 -0.1558 -0.85 0.3461 1.5820-99 employees -0.1083 -0.82 -0.4148 -2.48 -0.0669 -0.49 0.1289 0.85 -0.0673 -0.40100-499 employees 0.6353 2.61 -0.3596 -1.23 0.4199 1.85 0.5744 2.39 0.1421 0.52500+ employees 0.9132 1.76 -0.7438 -1.21 0.6348 1.50 0.6824 1.57 0.0398 0.08Union 0.1003 0.80 0.1915 1.23 0.2067 1.63 0.2960 2.18 0.1299 0.84Constant -0.3161 -1.29 -1.6838 -5.42 -1.9092 -7.49 -1.7714 -6.60 -3.0645 -9.59Summary statistics: N 1936 1936 1936 1936 1936 n (Dep. Var. = 1) 1326 318 558 406 309 LL function -1149.2 -819.4 -1108.1 -961.7 -813.7��� 2 114.6 91.4 109.2 64.0 73.7 % right prediction 70.3 83.6 71.0 79.0 84.0
Note: The reference groups are non-users, performing no innovative activities, located in Ontario, belonging to the “other” industrial sector, facing 0-5competitors, born prior to 1975, experiencing low output growth, owned by foreigners, with 1-19 employees, and employees are not unionized.
Analytical S
tudies Branch – R
esearch Paper Series - 22 - Statistics Canada N
o. 11F0019MPE
No. 173

Table A2. Logistic Regression Results for Reporting Technology Adoption Impediments (Total number of technologies used)Indep. Var. Dep. Var. = Costprob
(1)Dep. Var. = Instprob
(2)Dep. Var. = Laboprob
(3)Dep. Var. = Orgaprob
(4)Dep. Var. = Infoprob
(5)Coefficient T-ratio Coefficient T-ratio Coefficient T-ratio Coefficient T-ratio Coefficient T-ratio
Tech use 0.0991 3.95 0.0511 2.00 0.0574 2.74 0.0259 1.15 0.0569 2.37Innovator 0.1736 1.46 0.2899 1.98 0.1419 1.18 0.0981 0.74 0.6557 4.48Atlantic -0.5833 -2.53 -1.2500 -3.13 -0.5054 -1.94 -0.6899 -2.11 0.3243 1.09Quebec -0.2543 -2.04 -1.0402 -6.19 -0.7712 -5.73 -0.1340 -0.95 0.0849 0.53Prairie 0.1271 0.80 -0.5431 -2.81 -0.0756 -0.49 0.0849 0.50 0.4549 2.46British Columbia 0.0161 0.08 -0.2048 -0.92 0.0992 0.53 -0.3541 -1.53 -0.1596 -0.61Core sector 0.0485 0.31 -0.3310 -1.64 0.1273 0.81 -0.1408 -0.82 0.2952 1.62Secondary sector -0.1662 -1.44 -0.0665 -0.46 0.1105 0.93 -0.2606 -1.94 0.0280 0.196-19 competitors 0.3915 2.99 0.4410 2.60 0.2420 1.72 0.1638 1.06 0.3745 2.1620+ competitors 0.4825 3.89 0.1799 1.09 0.4517 3.40 0.2914 1.99 0.4228 2.53Born 1975-1984 0.3504 2.49 -0.0547 -0.28 0.3541 2.32 0.2986 1.86 -0.0612 -0.32Born after 1984 0.6747 4.89 0.5364 3.02 0.6023 4.07 0.1727 1.09 0.5131 2.93Medium growth 0.0196 0.17 0.2899 2.01 0.3359 2.76 0.0693 0.51 -0.0928 -0.62High growth -0.2597 -1.48 0.0501 0.22 0.3378 1.92 0.1720 0.93 0.1296 0.62Canadian-owned 0.2708 1.50 -0.0016 -0.01 0.1291 0.73 -0.1511 -0.82 0.3711 1.6920-99 employees -0.0622 -0.47 -0.4563 -2.74 -0.0669 -0.49 0.1503 1.00 -0.0615 -0.36100-499 employees 0.6453 2.64 -0.5222 -1.76 0.3510 1.53 0.5915 2.44 0.0736 0.27500+ employees 0.5816 1.08 -1.1545 -1.80 0.3359 0.75 0.6132 1.34 -0.2496 -0.47Union 0.1196 0.95 0.1757 1.13 0.2100 1.66 0.3063 2.27 0.1372 0.89Constant -0.2627 -1.08 -1.7393 -5.60 -1.9170 -7.51 -1.7468 -6.53 -3.0732 -9.60Summary statistics: N 1936 1936 1936 1936 1936 n (Dep. Var. = 1) 1326 318 558 406 309 LL function -1155.4 -817.6 -1106.0 -962.4 -812.3��� 2 102.3 95.2 113.5 62.5 76.7 % right prediction 69.9 83.6 71.7 79.0 84.0
Note: The reference groups are non-users, performing no innovative activities, located in Ontario, belonging to the “other” industrial sector, facing 0-5competitors, born prior to 1975, experiencing low output growth, owned by foreigners, with 1-19 employees, and employees are not unionized.
Analytical S
tudies Branch – R
esearch Paper Series - 23 - Statistics Canada N
o. 11F0019MPE
No. 173

Table A3. Logistic Regression Results for Reporting Technology Adoption Impediments (Interaction between technology use and innovation)Indep. Var. Dep. Var. = Costprob
(1)Dep. Var. = Instprob
(2)Dep. Var. = Laboprob
(3)Dep. Var. = Orgaprob
(4)Dep. Var. = Infoprob
(5)Coefficient T-ratio Coefficient T-ratio Coefficient T-ratio Coefficient T-ratio Coefficient T-ratio
Non-user innovator 0.1910 1.28 0.2556 1.35 0.3084 1.94 0.1190 0.66 0.6908 3.59User innovator 0.7936 4.99 0.3299 1.78 0.3543 2.30 0.3019 1.80 0.9094 4.88User non-innovator 0.6811 4.29 -0.1794 -0.89 0.3400 2.21 0.2478 1.45 0.2473 1.20Atlantic -0.5792 -2.50 -1.2748 -3.19 -0.5133 -1.97 -0.6865 -2.10 0.3171 1.06Quebec -0.2204 -1.76 -1.0684 -6.32 -0.7552 -5.59 -0.1208 -0.85 0.0891 0.55Prairie 0.1413 0.88 -0.5542 -2.87 -0.0795 -0.52 0.0878 0.51 0.4508 2.44British Columbia 0.0084 0.04 -0.2278 -1.02 0.0679 0.36 -0.3604 -1.56 -0.1813 -0.70Core sector 0.0161 0.10 -0.2964 -1.47 0.1378 0.88 -0.1490 -0.87 0.2993 1.65Secondary sector -0.1754 -1.51 -0.0620 -0.43 0.1159 0.97 -0.2635 -1.96 0.0283 0.196-19 competitors 0.3882 2.96 0.4217 2.49 0.2367 1.68 0.1636 1.06 0.3650 2.1020+ competitors 0.4844 3.89 0.1819 1.10 0.4502 3.39 0.2906 1.99 0.4215 2.52Born 1975-1984 0.3304 2.34 -0.0400 -0.21 0.3516 2.31 0.2930 1.82 -0.0624 -0.33Born after 1984 0.6842 4.93 0.5412 3.04 0.6190 4.18 0.1763 1.11 0.5189 2.96Medium growth 0.0132 0.11 0.3003 2.08 0.3363 2.76 0.0659 0.48 -0.0926 -0.62High growth -0.2601 -1.48 0.0642 0.28 0.3502 1.99 0.1738 0.93 0.1370 0.65Canadian-owned 0.2548 1.41 -0.0298 -0.14 0.1005 0.57 -0.1565 -0.85 0.3458 1.5820-99 employees -0.1105 -0.83 -0.4095 -2.44 -0.0760 -0.55 0.1266 0.84 -0.0681 -0.40100-499 employees 0.6356 2.62 -0.3674 -1.25 0.4254 1.88 0.5748 2.39 0.1428 0.52500+ employees 0.9253 1.78 -0.7846 -1.27 0.6773 1.60 0.6906 1.59 0.0434 0.09Union 0.1015 0.80 0.1840 1.18 0.2128 1.68 0.2971 2.19 0.1303 0.84Constant -0.3239 -1.32 -1.6501 -5.29 -1.9528 -7.59 -1.7811 -6.57 -3.0695 -9.49Summary statistics: N 1936 1936 1936 1936 1936 n (Dep. Var. = 1) 1326 318 558 406 309 LL function -1149.2 -819.0 -1107.3 -961.7 -813.7��� 2 114.8 92.2 110.9 64.1 73.8 % right prediction 70.4 83.6 71.4 79.1 84.0
Note: The reference groups are non-user non-innovator, located in Ontario, belonging to the “other” industrial sector, facing 0-5 competitors, born prior to 1975,experiencing low output growth, owned by foreigners, with 1-19 employees, and employees are not unionized.
Analytical S
tudies Branch – R
esearch Paper Series - 24 - Statistics Canada N
o. 11F0019MPE
No. 173

Analytical Studies Branch – Research Paper Series - 25 - Statistics Canada No. 11F0019MPE No. 173
References
Arundel, A. 1997. “Enterprise Strategies and Barriers to Innovation.” In Innovation Measurementand Policies. Edited by A. Arundel and R. Garrelfs (eds.) European Commission, EIMS publication50. pp. 101-108.
Australian Bureau of Statistics. 1989. Manufacturing Technology Statistics. Catalogue No. 81230.Canberra.
Baldwin, J.R. 1996. "Innovation: The Key to Success in Small Firms." In Evolutionary Economicsand the New International Political Economy. Edited by J. de la Mothe and G. Paquette. London:Pinter.
Baldwin, J.R. 1999. Innovation, Training and Success. Research Paper No. 137. AnalyticalStudies Branch. Ottawa: Statistics Canada.
Baldwin, J.R. and M. Da Pont. 1996. Innovation in Canadian Manufacturing Enterprises.Catalogue 88-513-XPB. Analytical Studies Branch. Ottawa: Statistics Canada.
Baldwin, J.R. and B. Diverty. 1995. Advanced Technology Use in Canadian ManufacturingEstablishments. Research Paper No. 85. Analytical Studies Branch. Ottawa: Statistics Canada.
Baldwin, J.R., B. Diverty and D. Sabourin. 1995. Technology Use and IndustrialTransformation: Empirical Perspectives. Research Paper No. 75 Analytical Studies Branch.Ottawa: Statistics Canada. Also published in T. Courchene (ed.) Technology, Information andPublic Policy. John Deutsch Institute for the Study of Economic Policy. Kingston, Ontario.Queen’s University.
Baldwin, J.R., G. Gellatly, J. Johnson and V. Peters. 1998. Innovation in Dynamic ServiceIndustries. Catalogue No. 88-516-XPB. Analytical Studies Branch. Ottawa: Statistics Canada.
Baldwin, J.R., T. Gray and J. Johnson. 1996. “Advanced Technology Use and Training in CanadianManufacturing.” Canadian Business Economics 5: fall, 1996. 51-70.
Baldwin, J.R. and J. Johnson. 1996. “Business Strategies in Innovative and Non-InnovativeFirms in Canada.” Research Policy 25: 785-804.
Baldwin, J.R. and J. Johnson. 1998. “Innovator Typologies, Related Competencies, andPerformance.” In G. Eliasson, C. Green and C. McCann, Jr. (ed), Microfoundations of EconomicGrowth: A Schumpeterian Perspective, 227-253, Ann Arbor, Michigan: The University ofMichigan Press.
Baldwin, J.R. and J. Johnson. 1999. “Innovation and Entry.” In Are Small Firms Important?Their Role and Impact. Edited by Z. Acs. Kluwer.

Analytical Studies Branch – Research Paper Series - 26 - Statistics Canada No. 11F0019MPE No. 173
Baldwin, J.R. and P. Hanel. 2002. Knowledge Creation and Innovation Activity in an OpenEconomy. Cambridge: Cambridge University Press. Forthcoming.
Baldwin, J.R. and D. Sabourin. 1995. Technology Adoption in Canadian Manufacturing.Catalogue No. 88-512. Analytical Studies Branch. Ottawa: Statistics Canada.
Baldwin, J.R. and D. Sabourin. 1997. “Factors affecting technology adoption: A Comparison ofCanada and the United States.” Canadian Economic Observer. Ottawa: Statistics Canada. Augustpp. 3.1-3.17.
Baldwin, J.R., P. Hanel and D. Sabourin. 2001. “Determinants of Innovative Activity inCanadian Manufacturing Firms.” In Innovation and Firm Performance. EconometricExplorations of Survey Data. Edited by Alfred Kleinknecht and P. Mohnen. London andBasingstoke: Palgrave. Forthcoming.
Baldwin, J.R., D. Sabourin and M. Rafiquzzaman. 1996. Benefits and Problems Associated withTechnology Adoption in Canadian Manufacturing. Catalogue No. 88-514. Analytical StudiesBranch. Ottawa: Statistics Canada.
Beaumont, N.B. and R.M. Schroder. 1997. “Technology, Manufacturing Performance andBusiness Performance amongst Australian Manufacturers.” Technovation 17(6) 297-307.
Cosh, A., A. Hughes and E. Wood. 1996. “Innovation in UK SMEs: Causes and theConsequences for Firm Failure and Acquisition.” Working Paper 48. Cambridge: University ofCambridge ESRC Centre for Business Research.
Evangelista, R. and G. Sirilli. 1997. “Innovation in Services and Manufacturing: Results from theItalian Surveys.” Working Paper 73. Cambridge: University of Cambridge ESRC Centre forBusiness Research.
Gellatly. G. and V. Peters. 1999. Differences in Innovator and Non-Innovator Profiles: SmallEstablishments in Business Services. Research Paper No. 143. Analytical Studies Branch.Ottawa: Statistics Canada.
OECD. 1991. Managing Manpower for Advanced Manufacturing Technology. Paris:Organisation for Economic Co-Operation and Development.
Papaconstantinou, G., N. Sakurai, A. Wyckoff, J. Fagerberg and E. Ionnidis. 1996. TechnologyDiffusion, Productivity and International Competitiveness: An Empirical Analysis. Report for theEuropean Commission. EIMS Publication No. 13.
Rischel, T.D. and O.M. Burns. 1997. “The Impact of Technology on Small ManufacturingFirms.” Journal of Small Business Management 35: 2-10.

Analytical Studies Branch – Research Paper Series - 27 - Statistics Canada No. 11F0019MPE No. 173
Robson, M., J. Townsend and K. Pavitt. 1988. “Sectoral Patterns of Production and Use ofInnovations in the UK: 1945-1983.” Research Policy 17: 1-14.
Small, M.H. 1998. “Objectives for Adopting Advanced Manufacturing Systems: Promise andPerformance.” Industrial Management and Data Systems 98: 129-37.
Spina, G., E. Bartezzaghi, A. Bart, R. Cagliano, D. Draaijer and H. Boer. 1996. StrategicallyFlexible Production: The Multifocused Manufacturing Paradigm.” International Journal ofOperations and Production Management 16: 20-41.
Tracey, M., M.A. Vonderrembse and J.S. Lim. 1999. “Manufacturing Technology and StrategyFormulation: Keys to Enhancing Competitiveness and Improving Performance.” Journal ofOperations Management 17: 4111-428.
United States Bureau of the Census. 1989. Manufacturing Technology 1988. SMT (88-1).Washington: U.S. Department of Commerce.
United States Bureau of the Census. 1993. Manufacturing Technology: Prevalence and Plans forUse: 1993. SMT (93-3). Current Industrial Reports. Washington: U.S. Department of Commerce.
Young, R.C., J.D. Francis and C. Young. 1993. “Innovation, High-Technology Use andFlexibility in Small Manufacturing Firms.” Growth and Change 24: 67-86.