impedimetric characterization of human blood using three-electrode based
DESCRIPTION
dwdwdwTRANSCRIPT
12
J Electr Bioimp, vol. 3, pp. 12–19, 2012Received: 16 Jan 2012, published: 28 Jul 2012
doi:10.5617/jeb.238
Impedimetric characterization of human blood using three-electrode based ECIS devices Rangadhar Pradhan 1,2, Analava Mitra 1, Soumen Das 1
1. School of Medical Science and Technology, Indian Institute of Technology Kharagpur, West Bengal, India 721302 2. Email any correspondence to: [email protected] Abstract In this study, three-electrode based electric cell-substrate impedance sensing (ECIS) devices were used to study the electrical properties of blood and its constituents using electrochemical impedance spectroscopy. The three-electrode based ECIS devices were fabricated by using micromachining technology with varying sizes for working, reference and counter electrodes. The blood and its constituents such as serum, plasma, and red blood cells (RBCs) were prepared by conventional methods and stored for impedance measurement using fabricated microdevices. Equivalent circuits for blood, serum, plasma and RBCs were proposed using the software package ZSimpWin to validate the experimental data. The proposed equivalent circuit models of blood and its components have excellent agreement up to a frequency of 1 MHz. It is evident from the experimental results that blood and its components have specific impedance signatures that decrease with the increase of frequency. Blood shows higher impedance than the other samples in the lower frequency range (<50 kHz). It was also found that above 50 kHz, the impedance value of RBCs is nearly the same as whole blood. The impedance of serum and plasma steadily decreases with the increase of frequency up to 100 kHz and flattens out after that. The minimum impedance value achieved for serum and plasma is much less than the value obtained for whole blood. Keywords: Bioimpedance, blood, serum and plasma, red blood cells, equivalent circuit.
Introduction
Blood is an important functional body fluid that transports oxygen as well as nutrients, vitamins, and metabolites to each part of the body. Blood is a heterogeneous tissue consisting of plasma, serum, and different blood cells such as red blood cells (RBCs), white blood cells (WBCs), and platelets all of which have diverse functions and structures. Therefore precise knowledge of physical, biological, chemical, and electrical properties of blood and its constituents is of great importance in medicine and biology [1]. The investigation of haematological and biochemical parameters of blood are studied by microscopy of blood cells, automated blood cell counters, and routine biochemical techniques, which are labor-consuming and expensive [1-3]. Thus to overcome the above shortcomings, bioimpedance spectroscopy has been used to study the different parameters of blood such as glucose [4-5], urea [6-7], lactate [8-9], cholesterol [10-11], nitric oxide [12] etc. Also the electrical characterization of blood and its components are essential to study different biomedical
applications, such as the separation of cancer cells from normal blood cells [13-14], deterioration of preserved blood [15], and dielectric coagulometry [16]. The bioimpedance spectroscopy method has been used for decades to investigate the electrical properties of cell and tissue because of its several advantages including its low cost, ease of application, noninvasiveness, and capability for online monitoring [17]. Also the sample volumes required by microelectrodes realised by microfabrication techniques in recent decades are reduced compared to macroelectrodes. In general blood shows three distinct dielectric dispersion regions represented by α, β, and γ. The α dispersion occurs within a frequency range between 10 Hz and 1000 Hz and is associated with the diffusion process of ions. The β dispersion occurs as a result of the dielectric properties of the cell membrane and its interaction with the extra- and intracellular matrices. Thus this dispersion is physiologically significant and it arises within the range of 1 kHz to 10 MHz. The dispersion, found at very high frequencies (>1 GHz) is known as γ dispersion and it arises due to the presence of water content in tissue [18]. Also contact of the electrodes with the biological tissue leads to electrochemical phenomena that introduce additional impedance known as polarisation impedance to the system [19]. This well-known phenomenon is specific for a given electrode-electrolyte interface, with the potential due to the polarisation impedance dependent upon the metal-electrolyte combination, current density, and frequency [20]. In the present work several ECIS devices having different dimensions are fabricated by micromachining techniques and used to study the electrical properties of blood and its constituents (serum, plasma and RBCs). Equivalent circuits for different solutions have been developed to describe the mechanism of interface phenomena for electrode/tissue and/or electrode/ biochemical solution. Materials and methods
Design rule
The commercially available ECIS device (8W1E, Applied Biophysics) has a smaller sensing electrode than the reference electrode (RE) and produces an excellent result in the higher frequency range. However, in lower frequency ranges, the polarisation effect of the electrode incorporates noise into the measurement due to formation of double

Pradhan et al.: Impedimetric characterization of human blood. J Electr Bioimp, 3, 12-19, 2012
13
layer capacitance between the charged electrode surface and the available ions in the surrounding electrolytic solution [20]. This effect is prominent for biological samples due to the high conductivity of its buffer solution. To avoid the undesirable drifting of electrode potential, three-electrode techniques are adopted for the present ECIS device study. Incorporation of a reference electrode will measure the working electrode (WE) potential, independent of charges that occur at the counter electrode (CE). Mishra et al. [21] have shown that the WE should be smaller than the RE to minimize the influence of the impedance of the electrolyte and the RE. For the present design, the authors kept the WE and RE ratio at 0.01 to achieve optimum result. Brett and Brett [22] have shown that the surface area ratio of CE and WE should be larger than 10 in order to support the current generated at the WE. The ratio is kept at 100 in the present design of ECIS devices. The gap between the electrodes is 100 µm in all the cases to avoid cross contamination of the cell lines [23-24]. The dimensions of WE, RE, and CE of different designs are described in Table 1. The details of the schematic drawing of electrodes for a single device is given in Fig. 1. Table 1. Dimensions of different design of three electrode devices.
Devices Electrode dimensions (µm2) Distance between
electrodes ( µm)
Design 1 WE- 50×50, RE- 500×500, CE- 500×500 100
Design 2 WE- 100×100, RE- 1000×1000, CE- 1000×1000 100
Design 3 WE- 150×150, RE- 1500×1500, CE- 1500×1500 100
Design 4 WE- 200×200, RE- 2000×2000, CE- 2000×2000 100
Fig. 1: Schematic representation of three-electrode based ECIS devices.
Device fabrication
The ECIS devices were fabricated on 2 inch diameter Pyrex wafers using metal deposition and photolithography techniques. Initially, the wafers were cleaned and thin layers of chromium (Cr) and gold (Au) were thermally evaporated onto the wafers. Subsequently, the electrode
traces and its contact pads were lithographically dened using a positive photoresist and the Cr and Au layers were selectively removed by a wet etching process to dene the metal patterns on the substrate. Finally, a second lithography step was performed to apply another photosensitive polymer (SU8) layer as a passivation coating over the metal electrodes. In this step, only the electrode sensors and contact pads were exposed to make contact with the electrolyte as shown in Fig. 2.
The photoresist was hard baked to impart stability and inertness to the polymer. The wafers were then diced into single devices for subsequent packaging and measurements. Finally, the individual device was fixed within a printed circuit board and electrical connections were taken from the device to external equipment using thin metal wires. Cloning cylinders were then aligned and attached to serve as an electrolyte reservoir around the three-electrode system by using PDMS as glue.
Fig. 2: Microphotograph of different three-electrode devices. Inset is the enlarged view of Design 4.
Sample preparation
Phosphate buffered saline (PBS) was prepared by mixing 8 g of NaCl, 0.2 g of KC1, 1.15 g Na2HPO4, and 0.2 g of KH2PO4 in one litre distilled water at pH 7.4 [25].
To prepare the serum, the collected whole blood was kept in a test tube for 15-30 minutes and allowed to clot. The clot was removed by centrifuging at 1000×g for 10 minutes in a refrigerated centrifuge. The resulting supernatant (serum) was stored in room temperature for impedance measurement [26].
To prepare the RBC and plasma, the collected human whole blood was kept in test tube with an anticoagulant (dipotassium ethylenediamine-tetraacetic acid (K2EDTA, 1.8 mg/ml)) and then centrifuged for 6 minutes at 1400×g using a refrigerated centrifuge. The centrifuged sample forms three layers from top to bottom namely: plasma, leucocytes, and erythrocytes. The resulting supernatant is aspirated carefully and stored at room temperature for impedance measurement. The erythrocyte pellets were collected and washed two times with PBS and stored in PBS for further impedance measurement [27].
Impedance measurement
The electrical impedance measurements of blood and its constituents were carried out using a computer controlled electrochemical workstation SP 150 (Bio-Logic, France) by
Cloning cylinder
RE CE
WE
Contact pads
Connecting leads

Pradhan et al.: Impedimetric characterization of human blood. J Electr Bioimp, 3, 12-19, 2012
14
connecting the fabricated device directly to the system. Initially, however, the electrodes of all designs were dipped in PBS (pH 7.4) without any cells to establish the impedance characteristics of PBS for understanding and calculating the equivalent circuit parameters of the device functionality. All the measurements were performed with an actuation voltage of 10 mV and frequency range from 100 Hz to 1 MHz with 51 sample points in between in a logarithmic scale. All the measurements were repeated ten times and then averaged to get the impedance value for each frequency. The aforementioned electrochemical workstation has a built-in facility to reduce the noise margin of the measured impedance data through software interpretation. The Nyquist data was obtained from the four designed devices and subsequently exported to ZsimpWin software for further analysis with equivalent circuit simulation. Various electrical parameters of the equivalent circuit model were extracted by iterative processes for analysis of the impedance characteristics for various components of blood samples with relative standard error. Equivalent circuit simulation The impedance spectroscopy data found from experiment was imported to ZsimpWin (version 3.10) to develop the equivalent circuit model of the samples. The modelling was performed by an iterative process. In this process, the chi-squared (χ2) value for the entire model – a measure of the fitting error – played a significant role in validating the simulation. The electrochemical theories and the suggestions made via Boukamp also helped to determine the components in such a way that each component addition to the equivalent circuit model should reduce χ2 value by one-order of magnitude [28]. In the present study the χ2 value of the order of 1.5×10⁻³ or below was acceptable for a given model [29].
Results and Discussion
Impedance of PBS
Fig. 3 shows a Bode plot for experimental and ZsimpWin simulated data for PBS along with its equivalent circuit.
The equivalent circuit adopted for this study is comprised of a constant phase element (CPE), QS, that represents interface capacitance shunted by a charge transfer resistance, RCT, together in series with the solution resistance, RS. A good agreement between experimental and simulated results was observed. The χ2 value was calculated and ranged from 3.59×10⁻⁵ to 2.32×10⁻⁵ for different designs. This result is also comparable with previous literature [30-31].
Fig. 3: Bode Plot of PBS with its equivalent circuit.
Impedance of blood Fig. 4 shows the Bode plot of blood for different microelectrode based ECIS devices. From Fig. 4 it is evident that blood shows high impedance at low frequencies, and decreases in steps at higher frequencies. In the present experiment, only one dispersion in the frequency range up to 10 kHz is found, as shown in Fig. 4. At lower frequencies, the membrane effectively insulates the cytoplasm and current can only flow around the cells, but as frequency increases, the cell membrane becomes more conductive and current can pass through the cells. The cells themselves effectively behave as a resistive path to the current flow. Thus the current flow depends on the ratio of the cytoplasm complex impedance to that of the total solution present in the system as revealed in Fig. 4.
Fig. 4: Bode Plot of Blood with its equivalent circuit.

Pradhan et al.: Impedimetric characterization of human blood. J Electr Bioimp, 3, 12-19, 2012
15
The insulation property of double layered cell membrane is equivalent to the dielectric material of a capacitor in an electric circuit, whereas the conductive cytoplasm can be considered as a resistor. The interfacial phenomena form an electrical double layer (EDL) between an electrode and electrolytic solution, which may also be modelled as a capacitor. Thus combining the mechanisms of an EDL, cell membrane, and cytoplasm, the equivalent electrical circuit presented in Fig. 4 can be arrived at. The first part of the circuit shown as RS represents the extracellular solution resistance offered by the conductivity of the bulk solution and a wire connection. The second part of the circuit is the combined equivalent circuit of the electrolytic solution and blood cells present in blood. The solution capacitance, CS represents the dielectric property of water present in the blood. RI represents the interior resistance of a cell while QM represents the dielectric property of the electrode/ electrolyte interface including the cell membrane capacitance.
The impedance of the CPE is a measure of the non-faradaic impedance, which arises from the interface capacitance or polarisation of an electrode. The impedance of the CPE is expressed as,
Where, 1j = − , 0 < n < 1 and Q is a constant with dimension Fsn-1 [32]. The values of the electric components (ECs) of the proposed equivalent circuit for blood with relative standard error (e %) for each parameter are given in Table 2. Table 2. Values of electric components of blood for different designs with relative standard error (e %)
ECs Design 1 Design 2 Design 3 Design 4
Data e % Data e % Data e % Data e % RS (Ω) 1353 1.83 1112 1.85 906.5 1.79 654.8 1.74
CS
(Fsn-1) ×10-9
46.12 4.98 55.13 5.01 66.43 4.81 90.19 4.64
RI
(Ω) 1588 3.01 1306 2.99 1060 2.81 767 2.67
QM
(Fsn-1) ×10-9
5.05 3.16 6.14 3.16 7.52 3 10.36 2.87
n 0.92 0.03 0.92 0.03 0.92 0.03 0.92 0.03 χ2
value 1.06×10⁻³ 1.06×10⁻³ 9.66×10⁻⁴ 8.96×10⁻⁴
From the Table 2, it is evident that the solution
resistance for different designs decreases with the increase of electrode dimensions due to the larger surface area allowing more charges to pass away. Thus the smaller devices show higher impedance than the larger devices as smaller devices have more polarisation impedance and high electrolytic resistance. The χ2 values for different dimensions vary from 1.06×10⁻³ to 9.66×10⁻⁴, which justifies the validity of the proposed model. Thus it can be
concluded that the proposed equivalent circuit model of blood has excellent fitting up to a frequency of 1 MHz. Impedance of serum and plasma Fig. 5 shows the Bode plot of serum and plasma for different microdevices. It is evident from Fig. 5 that the impedance decreases with the increase of frequency and the impedance of smaller devices shows higher impedance than the larger devices. Blood serum consists of water with proteins, hormones, minerals, and carbon dioxide, while plasma consists of serum with fibrin and other clotting factors. Thus both serum and plasma are rich sources of electrolytes and are subjects to the mechanism of interfacial phenomena that occurs between electrode and electrolytes.
When a metal electrode is immersed into an electrolytic solution, an EDL is formed at the interface between metal and electrolyte. The electrochemical phenomena of EDL are governed by the Gouy-Chapman-Stern model. According to the model, the EDL consists of two layers, the inner Stern layer and the outer diffuse layer. The Stern layer has a width of on an atomic magnitude and the ions present in this layer possess ionic bonding between each other. However, the outer diffuse layer is semi-infinite with the ions present in this layer distributed unevenly and is governed by Poisson-Boltzmann theory. But both plasma and serum contain biochemical substances such as protein, enzymes, hormones, etc. along with electrolytes. Therefore, by investigating the mechanism of EDL with respect to biochemical substances along with electrolytes, an equivalent circuit model is proposed in Fig. 5.
Fig.5: Bode Plot of serum and plasma with its equivalent circuit.
The impedance of the interface between the electrode and electrolyte (RCT) arises from the charge transfer within the Stern/Helmholtz layer and also by diffusion limitation within the Gouy-Chapman layer [33]. The biochemical substances present in the serum and plasma covalently couple with electrodes. The EDL possesses covalent coupling as well as regular ionic bonding, decreasing the compactness of EDL. Thus the double layer capacitance is
1( ) ( ) (1)nZ jQ
ω ω=

Pradhan et al.: Impedimetric characterization of human blood. J Electr Bioimp, 3, 12-19, 2012
16
replaced by a CPE and the electrolytes assumed to behave as a resistor (RS). The values of the electric components of the proposed equivalent circuit for plasma and serum are given in Table 3. Table 3. Values of electric components of plasma and serum for different designs with relative standard error (e %).
It may evident from Table 3 that the bulk resistance for serum and plasma decreases with the increase of dimensions of the working electrodes. The χ2 values for different dimensions vary in the range of 4.36×10⁻⁴ to 8.45×10⁻⁴ for both serum and plasma, providing an excellent fit of impedance data up to 1 Hz. Impedance of RBCs Fig. 6 shows the Bode plot of RBCs for different microdevices. It is evident from Fig. 6 that the impedance decreases with the increase of frequency and smaller devices show higher impedance than larger devices. With regards to red blood cells, Maxwell-Wagner polarisations occur at the electrode/electrolyte/membrane, and membrane/cytoplasm interfaces as described in the impedance of blood section. This polarization is dependent on the conductivity and permittivity of the cell interior, membrane, and suspending medium. The electrolytes present in the suspending medium react with the electrodes and form an EDL. However this EDL reacts with the membrane proteins of the RBCs and forms a distorted EDL. Therefore, the double layer capacitance of the electrolytic solution is replaced by a CPE. Thus by combining the effect of EDL, cell membrane and cytoplasm, an equivalent circuit is proposed (inset of Fig. 6).
This equivalent circuit is similar to the equivalent circuit of blood as described in Fig. 4. The values of the electric components of the proposed equivalent circuit for RBCs are given in Table 4. It is evident from Table 4 that the values of the solution resistance decrease with the
increase of electrode dimensions. In this case, the χ2 values for different dimensions vary in the range of 2.62×10⁻³ to 4.79×10⁻³.
Fig. 6: Bode Plot of RBCs with its equivalent circuit. Table 4. Values of electric components of RBC for different designs with relative standard error (e %).
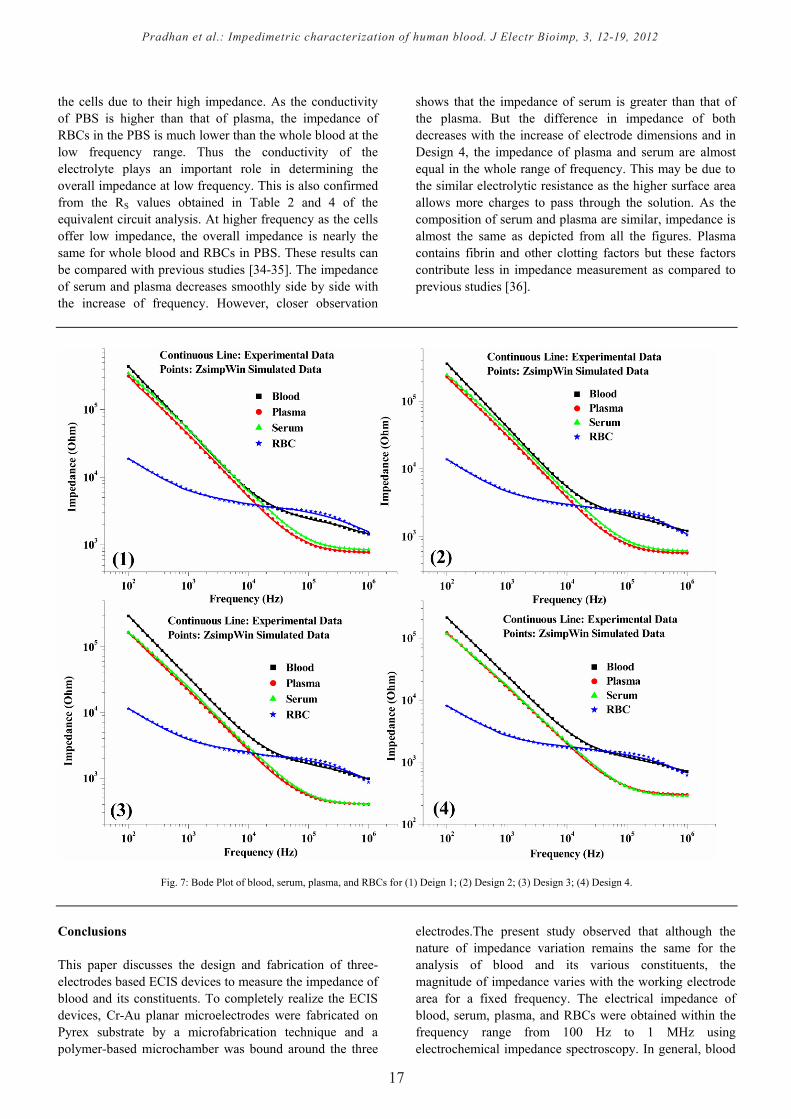
Comparison of impedance of blood and its constituents The impedances of blood, serum, plasma, and RBCs for different designs are presented in Fig. 7. It indicates clearly that blood shows higher impedance than the others in the low frequency range up to 50 kHz. Within this frequency range, blood, serum, and plasma impedance values steadily decrease with frequency and thereafter the rate of decrease slowes down only for the blood samples whereas for serum and plasma samples the impedance flattens at around 105
Hz onwards for all the devices. On the other hand, the impedance of RBCs in PBS is much lower and decreases slowly with frequency compared to the blood up to 10 kHz. Thereafter, the impedance value is nearly the same for both the samples. At lower frequency the electrical current will mainly flow through the electrolyte and rarely pass through
ECs Design 1 Design 2 Design 3 Design 4 Data e % Data e % Data e % Data e %
Plasma RS (Ω) 761 0.8 555 0.8 395 0.78 294 0.75
CS
(Fsn-1) ×10-9
8 2.23 11 2.13 15 2.07 20 2
n 0.91 0.02 0.91 0.02 0.91 0.02 0.91 0.02 RCT
(kΩ) 1224 6.5 874 6.1 616 5.8 462 5.6
χ2
value 8.45×10⁻⁴ 7.74×10⁻⁴ 7.28×10⁻⁴ 6.79×10⁻⁴
Serum RS (Ω) 833 0.73 596 0.68 395 0.65 280 0.62
CS
(Fsn-1) ×10-9
7.33 1.88 9.90 1.77 14.8 1.7 20.6 1.61
n 0.90 0.02 0.90 0.02 0.90 0.02 0.90 0.02 RCT
(kΩ) 882 3.46 626 3.22 415 3.08 292 2.90
χ2
value 5.97×10⁻⁴ 5.28×10⁻⁴ 4.83×10⁻⁴ 4.36×10⁻⁴
ECs Design 1 Design 2 Design 3 Design 4
Data e % Data e % Data e % Data e %
RS (Ω) 991 5.76 774 4.24 604 5.81 445 5.9 CS
(Fsn-1) ×10-9
20.2 6.56 30.32 5.2 33.1 6.56 49.5 6.94
RI (Ω) 2225 2.98 1651 2.4 1371 2.98 998 3.21 QM
(Fsn-1) ×10-3
1289 9.29 1583 7.8 2046 9.3 2681 10.6
n 0.80 0.59 0.61± 0.45 0.60 0.41 0.61 0.46
χ2
value 3.7×10⁻³ 2.62×10⁻³ 3.8×10⁻³ 4.79×10⁻³
Pradhan et al.: Impedimetric characterization of human blood. J Electr Bioimp, 3, 12-19, 2012
17
the cells due to their high impedance. As the conductivity of PBS is higher than that of plasma, the impedance of RBCs in the PBS is much lower than the whole blood at the low frequency range. Thus the conductivity of the electrolyte plays an important role in determining the overall impedance at low frequency. This is also confirmed from the RS values obtained in Table 2 and 4 of the equivalent circuit analysis. At higher frequency as the cells offer low impedance, the overall impedance is nearly the same for whole blood and RBCs in PBS. These results can be compared with previous studies [34-35]. The impedance of serum and plasma decreases smoothly side by side with the increase of frequency. However, closer observation
shows that the impedance of serum is greater than that of the plasma. But the difference in impedance of both decreases with the increase of electrode dimensions and in Design 4, the impedance of plasma and serum are almost equal in the whole range of frequency. This may be due to the similar electrolytic resistance as the higher surface area allows more charges to pass through the solution. As the composition of serum and plasma are similar, impedance is almost the same as depicted from all the figures. Plasma contains fibrin and other clotting factors but these factors contribute less in impedance measurement as compared to previous studies [36].
Fig. 7: Bode Plot of blood, serum, plasma, and RBCs for (1) Deign 1; (2) Design 2; (3) Design 3; (4) Design 4.
Conclusions
This paper discusses the design and fabrication of three-electrodes based ECIS devices to measure the impedance of blood and its constituents. To completely realize the ECIS devices, Cr-Au planar microelectrodes were fabricated on Pyrex substrate by a microfabrication technique and a polymer-based microchamber was bound around the three
electrodes.The present study observed that although the nature of impedance variation remains the same for the analysis of blood and its various constituents, the magnitude of impedance varies with the working electrode area for a fixed frequency. The electrical impedance of blood, serum, plasma, and RBCs were obtained within the frequency range from 100 Hz to 1 MHz using electrochemical impedance spectroscopy. In general, blood

Pradhan et al.: Impedimetric characterization of human blood. J Electr Bioimp, 3, 12-19, 2012
18
and its various constituents show higher impedances at lower frequencies that steadily decrease to lower values with the increase of frequency.
Although blood, serum, and plasma have nearly the same impedance up to 10 kHz, the impedance of RBCs shows minimal impedance due to the high conductivity of the electrolyte used (PBS). The results obtained in the present study are consistent with published results in which the impedance values are in general inversely proportional to the active working electrode area. The proposed equivalent circuits for blood, serum, plasma and RBCs show excellent fittings of their corresponding impedance data up to 1 MHz.
In the equivalent circuit model, double layer capacitance is replaced by CPE for blood and RBC samples, whereas for serum and plasma impedance is controlled by diffusion limited charge transfer at the electrode surface. This work would contribute to a better understanding of the electrical characterization of the blood under its various physiological conditions. However, extensive investigations are still needed in order to use these devices as sensors. Acknowledgements The authors thank the staff members of the MEMS Lab, IIT Kharagpur for their support towards this work. References 1. Wolf M, Gulich R, Lunkenheimer P, Loidl A. Broadband
dielectric spectroscopy on human blood. Biochim. Biophys. Acta, Gen. Subj. 2011;1810(8):727-40. http://dx.doi.org/10.1016/j.bbagen.2011.05.012
2. Faulkner, W. P. and Meites, S. editors: Selected methods of clinical chemistry (1982), Washington, DC, American Association for Clinical Chemistry, Inc, Vol. 9.
3. Mauro B. Quality specification in haematology: the automated blood cell count. Clin. Chim. Acta. 2004;346(1):45-4. http://dx.doi.org/10.1016/j.cccn.2004.02.038
4. Amaral CF, Brischwein M, Wolf B. Multiparameter techniques for non-invasive measurement of blood glucose. Sens. Actuators, B. 2009;140(1):12-6. http://dx.doi.org/10.1016/j.snb.2009.04.023
5. Ferrante do Amaral CE, Wolf B. Current development in non-invasive glucose monitoring. Med. Eng. Phys. 2008;30(5):541-9. http://dx.doi.org/10.1016/j.medengphy.2007.06.003
6. Cortina M, Esplandiu MJ, Alegret S, del Valle M. Urea impedimetric biosensor based on polymer degradation onto interdigitated electrodes. Sens. Actuators, B. 2006;118(1-2):84-9. http://dx.doi.org/10.1016/j.snb.2006.04.062
7. Lakard B, Herlem G, Lakard S, Antoniou A, Fahys B. Urea potentiometric biosensor based on modified electrodes with urease immobilized on polyethylenimine films. Biosens. Bioelectron.2004;19(12):1641-7. http://dx.doi.org/10.1016/j.bios.2003.12.035
8. Gamero M, Pariente F, Lorenzo E, Alonso C. Nanostructured rough gold electrodes for the development of lactate oxidase-based biosensors. Biosens. Bioelectron. 2010;25(9):2038-4. http://dx.doi.org/10.1016/j.bios.2010.01.032
9. Lupu A, Valsesia A, Bretagnol F, Colpo P, Rossi F. Development of a potentiometric biosensor based on nanostructured surface for lactate determination. Sens. Actuators, B. 2007;127(2):606-2. http://dx.doi.org/10.1016/j.snb.2007.05.020
10. Aghaei A, Milani Hosseini MR, Najafi M. A novel capacitive biosensor for cholesterol assay that uses an electropolymerized molecularly imprinted polymer. Electrochim. Acta. 2010;55(5):1503-8. http://dx.doi.org/10.1016/j.electacta.2009.09.033
11. Szwacki J, Lisowska-Oleksiak A, Szpakowska M. Polymer membranes loaded with lipids for taste sensing: electrochemical impedance spectroscopy studies. Desalina. 2006;198(1-3):1-7. http://dx.doi.org/10.1016/j.desal.2006.09.002
12. Xu Y, Hu C, Hu S. A reagentless nitric oxide biosensor based on the direct electrochemistry of hemoglobin adsorbed on the gold colloids modified carbon paste electrode. Sens. Actuators, B. 2010;148(1):253-8. http://dx.doi.org/10.1016/j.snb.2010.05.028
13. Han K-H, Han A, Frazier AB. Microsystems for isolation and electrophysiological analysis of breast cancer cells from blood. Biosens. Bioelectron. 2006;21(10):1907-4. http://dx.doi.org/10.1016/j.bios.2006.01.024
14. Polevaya Y, Ermolina I, Schlesinger M, Ginzburg B-Z, Feldman Y. Time domain dielectric spectroscopy study of human cells: II. Normal and malignant white blood cells. Biochim. Biophys. Acta, Biomembr.1999;1419(2):257-71. http://dx.doi.org/10.1016/S0005-2736(99)00072-3
15. Yoshihito H, Ikuya O, Yoichi K, Shinji O, Akio Y, Koji A. Temporal variation of dielectric properties of preserved blood. Phys. Med. Biol. 2008;53(1):295. http://dx.doi.org/10.1088/0031-9155/53/1/021
16. Hayashi Y, Katsumoto Y, Omori S, Yasuda A, Asami K, Kaibara M. Dielectric Coagulometry: A New Approach To Estimate Venous Thrombosis Risk. Anal. Chem. 2010; 82(23): 9769-4. http://dx.doi.org/10.1021/ac101927n
17. Tao D, Adler A. In Vivo Blood Characterization From Bioimpedance Spectroscopy of Blood Pooling. IEEE Trans. Instrum. Meas. 2009;58(11):3831-8. http://dx.doi.org/10.1109/TIM.2009.2020836
18. Foster, KR, Schwan, HP. Dielectric properties of tissues and biological materials: a critical review. Crit. Rev. Biomed. Eng. 1989;17:25–104.
19. Fricke H. The theory of electrolytic polarization. Philos. Mag. 1932; 14:310-8.

Pradhan et al.: Impedimetric characterization of human blood. J Electr Bioimp, 3, 12-19, 2012
19
20. Schwan HP. Alternating current electrode polarisation. Biophys. 1966;3:181-201. http://dx.doi.org/10.1007/BF01191612
21. Mishra NN, Retterer S, Zieziulewicz TJ, Isaacson M, Szarowski D, Mousseau DE, Lawrence DA, Turner JN. On-chip micro-biosensor for the detection of human CD4+ cells based on AC impedance and optical analysis. Biosens. Bioelectron. 2005; 21: 696-4. http://dx.doi.org/10.1016/j.bios.2005.01.011
22. Brett CMA, Brett AMO. Electrochemistry-Priniciples. Methods and Applications. Oxford University Press, London, UK. 1993;185-6.
23. Lind R, Connolly P, Wilkinson CDW, Thomson RD. Finite-element analysis applied to extracellular microelectrode design, Sens. Actuators, B. 1991;3:23-0. http://dx.doi.org/10.1016/0925-4005(91)85004-3
24. Breckenridge LJ, Wilson RJA, Connolly P, Curtis ASG, Dow JAT, Blackshaw SE, Wilkinson CDW. Advantages of using microfabricated extracellular electrodes for in vitro neuronal recording. J. Neurosci. Res. 1995;42:266-6. http://dx.doi.org/10.1002/jnr.490420215
25. Dulbecco R, Vogt M. Plaque formation and isolation of pure lines with poliomyelitis viruses. J. Exp. Med. 1954;99(2): 167-82. http://dx.doi.org/10.1084/jem.99.2.167
26. Henry JB. Clinical Diagnosis and Management by Laboratory Methods, WB Saunders Company, Philadelphia, PA. 1979;1:60.
27. Thavasu PW, Longhurst S, Joel SP, Slevin ML, Balkwill FR. Measuring cytokine levels in blood: Importance of anticoagulants, processing, and storage conditions. J. Immunol. Methods. 1992;153(1-2):115-4. http://dx.doi.org/10.1016/0022-1759(92)90313-I
28. Boukamp BA. Equivalent Circuits: User’s Manual. University of Twente, Netherlands. 1993;2nd Edition.
29. Cui X, Martin DC. Electrochemical deposition and characterization of poly(3,4-ethylenedioxythiophene) on neural microelectrode arrays. Sens. Actuators, B.2003;89(1-2):92-02. http://dx.doi.org/10.1016/S0925-4005(02)00448-3
30. Franks W, Schenker I, Schmutz P, Hierlemann A. Impedance characterization and modeling of electrodes for biomedical applications. IEEE Trans. Biomed. Eng. 2005;52:1295-02. http://dx.doi.org/10.1109/TBME.2005.847523
31. Padmaraj D, Miller JH Jr, Wosik J, Zagozdzon-Wosik W. Reduction of electrode polarization capacitance in low-frequency impedance spectroscopy by using mesh electrodes. Biosens. Bioelectron. 2011;29:13-7. http://dx.doi.org/10.1016/j.bios.2011.06.050
32. Bisquert J, Garcia-Belmonte G, Bueno P, Longo E, Bulhoes LOS. Impedance of constant phase element (CPE)-blocked diffusion in film electrodes. J. Electroanal. Chem. 1998; 452(2):229-234. http://dx.doi.org/10.1016/S0022-0728(98)00115-6
33. Franks W, Schenker I, Schmutz P, Hierlemann A. Impedance characterization and modeling of electrodes for biomedical applications. IEEE Trans. Biomed. Eng.2005;52(7):1295-02. http://dx.doi.org/10.1109/TBME.2005.847523
34. Sakamoto K, Kanai H. Electrical Characteristics of Flowing Blood. Biomedical Engineering, IEEE Trans. Biomed. Eng. 1979;26:686-5. http://dx.doi.org/10.1109/TBME.1979.326459
35. Visser K. Electric conductivity of stationary and flowing human blood at low frequencies. Med. Biol. Eng. Comput. 1992; 30: 636-40. http://dx.doi.org/10.1007/BF02446796
36. Tian-Xian Z. Contributions of suspending medium to electrical impedance of blood. Biochim. Biophys. Acta, Gen. Subj. 1994; 1201: 179-5. http://dx.doi.org/10.1016/0304-4165(94)90039-6