implementation of an active scheme closedown report
TRANSCRIPT

IMPLEMENTATION OF AN ACTIVE FAULT LEVEL MANAGEMENT SCHEME WPDT1007 CLOSEDOWN REPORT
Page 2 of 50
IMPLEMENTATION OF AN ACTIVE FAULT LEVEL MANAGEMENT SCHEME CLOSEDOWN REPORT
Document Control
Name Date
Prepared by: Jonathan Berry 09.03.2015
Reviewed by: Roger Hey 09.03.2015
Approved by: Nigel Turvey 10.03.2015
Revision History
Date Issue Status
28.01.2015 1 FINAL for review
17.02.2015 2 FINAL
10.03.2015 3 FINAL following Ofgem review
Report Title : Implementation of an active fault level management scheme: Close-Down Report
Report Status : FINAL
Project Ref : WPDT1007
Date : 10.03.2015

Page 3 of 50
IMPLEMENTATION OF AN ACTIVE FAULT LEVEL MANAGEMENT SCHEME CLOSEDOWN REPORT
Contents 1 Executive Summary ...................................................................................................... 6
2 Project Background ...................................................................................................... 6
3 Scope and objectives ................................................................................................... 7
4 Success criteria............................................................................................................. 7
5 Details of the work carried out .................................................................................... 8
5.1 Device Design ..................................................................................................... 8
5.2 Device Testing .................................................................................................... 9
5.2.1 Preparation ............................................................................................... 9
5.2.2 Tests .......................................................................................................... 10
5.2.3 Results ....................................................................................................... 11
5.2.4 Issues ......................................................................................................... 12
5.2.5 Next Steps and Resolutions ...................................................................... 13
5.3 Detailed Design................................................................................................... 13
5.3.1 Pulseclose Operation ................................................................................ 13
5.3.2 Autonomous transfer of fault level data .................................................. 14
5.3.3 Impedance System .................................................................................... 15
5.3.4 System Protection ..................................................................................... 16
5.4 System Integration ............................................................................................. 16
5.4.1 Natural Disturbance detection ................................................................. 17
5.4.2 Parallel Operation Detection .................................................................... 17
5.4.3 Final Device System Testing ...................................................................... 19
5.5 Site Installation ................................................................................................... 21
5.5.1 Site Design and Preparation ..................................................................... 21
5.5.2 Switchgear Installation.............................................................................. 21
5.5.3 Device Installation ..................................................................................... 22
5.5.4 Commissioning and Energisation .............................................................. 25
6 The outcomes of the Project ....................................................................................... 27
6.1 PM7000 Firmware .............................................................................................. 27
6.2 Pad-Mounted Style IntelliRupter® PulseCloser and Resistor Performance ....... 28
6.3 Installation and Connection of AFLM ................................................................. 28
6.4 Control, Communications and Data Storage ...................................................... 28
6.5 AFLM Results and Accuracy ................................................................................ 29
6.5.1 Reliability ................................................................................................... 29
6.5.2 Data Range ................................................................................................ 29
6.5.3 Modelled Data .......................................................................................... 31
6.5.4 Comparison – Monitored vs Modelled ..................................................... 31
6.5.5 Peak Fault Level ........................................................................................ 36
6.5.6 10ms RMS Fault Level ............................................................................... 38
6.6 Technology Readiness Level ............................................................................... 40
6.7 Increasing Network Connections and Contractual Arrangements .................... 40

Page 4 of 50
IMPLEMENTATION OF AN ACTIVE FAULT LEVEL MANAGEMENT SCHEME CLOSEDOWN REPORT
7 Performance compared to the original Project aims, objectives and success criteria 43
7.1 Integration of technologies to provide real-time fault level values .................. 43
7.2 Installation of Active Fault Monitoring device at Primary Substation ............... 43
7.3 Success Criteria ................................................................................................... 43
7.3.1 Conduct factory acceptance tests of fault level monitoring devices ....... 43
7.3.2 Install and commission the active fault level management scheme ........ 43
7.3.3 Ability to monitor fault levels in real-time to accommodate additional distributed generation without the need for large-scale network reinforcement 43
7.3.4 Integrate distributed generation into the network more quickly ............ 43
7.3.5 Development of an engineering interface and control methodology ...... 44
7.3.6 New contractual arrangements to maximise generation connectivity .... 44
8 Required modifications to the planned approach during the course of the Project .. 45
9 Significant variance in expected costs ......................................................................... 46
10 Lessons learnt for future Innovation Projects ............................................................. 47
10.1 Device Control .................................................................................................... 47
10.2 Network Impact Analysis .................................................................................... 47
10.3 Technology and System Integration Testing ...................................................... 47
10.4 Network Modelling Requirements ..................................................................... 48
10.5 Team Structure ................................................................................................... 48
11 Planned implementation ............................................................................................. 49
12 Facilitate Replication .................................................................................................... 49
13 Contact details ............................................................................................................. 50
14 Appendices ................................................................................................................... 50
DISCLAIMER Neither WPD, nor any person acting on its behalf, makes any warranty, express or implied, with respect to the use of any information, method or process disclosed in this document or that such use may not infringe the rights of any third party or assumes any liabilities with respect to the use of, or for damage resulting in any way from the use of, any information, apparatus, method or process disclosed in the document. © Western Power Distribution 2015 No part of this publication may be reproduced, stored in a retrieval system or transmitted, in any form or by any means electronic, mechanical, photocopying, recording or otherwise, without the written permission of the Future Networks Manager, Western Power Distribution, Herald Way, Pegasus Business Park, Castle Donington. DE74 2TU. Telephone +44 (0) 1332 827446. E-mail [email protected]

Page 5 of 50
IMPLEMENTATION OF AN ACTIVE FAULT LEVEL MANAGEMENT SCHEME CLOSEDOWN REPORT
Glossary
Abbreviation Term
AFLM Active Fault Level Monitor
CBD Central Business District
CT Current Transformer
DG Distributed Generation
FAT Factory Acceptance Testing
GB Great Britain
HV High Voltage
IEC International Electrotechnical Commission
IFI Innovation Funding Incentive
IPR Intellectual Property Rights
NER Neutral Earthing Resistor
NMS Network Management System
ORL Outram Research Limited
PB Parsons Brinckerhoff
PMIR Pad Mounted IntelliRupter
PQ Power Quality
SAT Site Acceptance Testing
SIT System Integration Testing
SPEN Scottish Power Energy Networks
THD Total Harmonic Distortion
VT Voltage Transformer
WPD Western Power Distribution

Page 6 of 50
IMPLEMENTATION OF AN ACTIVE FAULT LEVEL MANAGEMENT SCHEME CLOSEDOWN REPORT
1 Executive Summary This report details the approach taken in seeking to develop, test and install an Active Fault Level Monitor (AFLM) as part of this LCNF Tier-1 project. The project started in February 2012 and its aims were split in to two phases as follows:
Phase 1 - Develop the AFLM product and carry out Factory Acceptance Testing (FAT) in a controlled laboratory environment; and
Phase 2 – Installation of an AFLM device at a Primary substation involving Site Acceptance Testing (SAT), commissioning, open-loop analysis and potentially closed loop analysis of the active fault level management scheme within an 11kV substation.
The project was completed in December 2014 following the successful implementation of an AFLM device in to Ladywood Primary substation, Birmingham. This document reports the project’s background, details of the work carried out to facilitate the successful implementation of the device, findings and learning outcomes to be taken forwards to allow the device’s integration as a business as usual initiative. The original project budget was £710k with the project costs at closedown at £690.3k.
2 Project Background The accommodation of distributed generation within 11kV networks may be limited at present due to fault level issues. The implementation of an active fault level management scheme has the potential to defer and/or avoid costly network reinforcement, whilst increasing network security. This facilitates the installation of distributed generation close to large demand centres, which has the potential to reduce electrical distribution losses and increase the efficiency of the Distribution System. The project aims to expedite distributed generation connections through monitoring fault level conditions in real-time. This will also allow a practical understanding of how close simulated fault levels are to actual values. Real-time fault level monitoring will be used to manage the connection of a distributed generator to increase the power supplied from renewable energy resources and to manage the fault level to avoid exceeding equipment ratings. The project will be implemented in two phases: Phase 1 will involve the integration and factory acceptance testing of the fault level monitoring devices. Phase 2 will involve the implementation of the fault level monitoring devices within a field trial network to manage the connection of a distributed generator, firstly through open-loop control and then through closed loop control.

Page 7 of 50
IMPLEMENTATION OF AN ACTIVE FAULT LEVEL MANAGEMENT SCHEME CLOSEDOWN REPORT
3 Scope and objectives The primary objective of the project is to expedite the connection of a new combined heat and power (CHP) plant. The project will encompass an 11kV substation area and associated distribution network so as to monitor, actively, the fault level. This will facilitate the management of the new CHP plant connection. The active management solution is required as an interim measure whilst the two low impedance 132 / 11 kV transformers at the substation are replaced with higher impedance transformers, removing any potential fault level issues.
4 Success criteria The success criteria detailed below were identified at the point of project registration. These success criteria were be used to determine the positive and negative learning throughout this report.
1. Conduct factory acceptance tests of fault level monitoring device;
2. Install and commission the active fault level management scheme;
3. Ability to monitor fault levels in real-time to accommodate additional distributed generation without the need for large-scale network reinforcement;
4. Integrate distributed generation into the network more quickly;
5. Development of an engineering interface and control methodology; and
6. New contractual arrangements to maximise generation connectivity.

Page 8 of 50
IMPLEMENTATION OF AN ACTIVE FAULT LEVEL MANAGEMENT SCHEME CLOSEDOWN REPORT
5 Details of the work carried out
5.1 Device Design The initial objective of the project was to develop a suitable device that was first ready for full factory acceptance testing and then on-site installation. The AFLM device was to be developed through the integration of two existing products, S&C Electric’s Pad-Mounted Style IntelliRupter® PulseCloser and Outram Research Limited’s (ORL) PM7000-FLM. A brief overview of the two products is provided below:
S&C Electric’s Pad-Mounted Style IntelliRupter® PulseCloser – This is an intelligent 11kV auto-recloser, which uses point-on-wave technology to minimise the effect of reclosing a healthy network on to a non-healthy (faulted) system. It has control over the connection to each of the three phases independently; and
ORL’s PM7000-FLM – This is a device that was originally developed as part of a Scottish Power Energy Networks (SPEN) Innovation Funding Incentive (IFI) project. It is an extension to a commercially available Power Quality (PQ) monitor that is able to extrapolate changes in the system’s voltage and current to calculate the fault level of the connected system when natural network disturbances occur.
Preparatory work had been undertaken, prior to the registration of the project, to understand the device requirements and feasibility of the creation of the AFLM. The fundamental operation of the device is that the Pad-Mounted Style IntelliRupter® PulseCloser creates a network disturbance (termed artificial), which provides a spike in current on the network and a small drop in voltage for a short period of time. This disturbance is then captured by the PM7000-FLM and a fault level value for both Peak and RMS for the electrical system it is connected. Following registration, the concept design needed to be developed to a stage where it was ready to be tested in a High Voltage (HV) laboratory. This was carried out through a series of face-to-face meetings between Western Power Distribution (WPD), the device providers S&C and ORL and Parsons Brinckerhoff (PB) who provided engineering consultancy support throughout the project. The key requirement was for the Pad-Mounted Style IntelliRupter® PulseCloser to deliver a pulse of current and change of voltage that was useable by the PM7000-FLM to deliver an accurate representation of the system fault level, whilst not causing any disturbance to connected customers of the system. A pulse of current is generated by the Pad-Mounted Style IntelliRupter® PulseCloser through its ability to operate its three poles (one per phase) independently. This means that the device can close one of its poles and pulse another for a period of time to create a short-term connection between two phases. Originally it was planned that the two phases would close via a solid connection (with nearly zero impedance), however, when modelled, even with the effect of point-on-wave pulseclosing the current generated, albeit for a very short period of time (maximum 10ms), would be 50% of the fault current that would be generated for the inception of a fault. Therefore, an

Page 9 of 50
IMPLEMENTATION OF AN ACTIVE FAULT LEVEL MANAGEMENT SCHEME CLOSEDOWN REPORT
immediate learning point for the project was that a suitable impedance between the two pulseclosing phases was required to minimise the current seen on the 11kV system. A model was created to understand what a suitable impedance would be to ensure that whilst producing a disturbance on the network it would not cause any customers connected to the network any PQ or other issues. For the purpose of the laboratory testing this was decided to be 20Ω, which would be in the form of an inductor (reactance). This 20Ω inductance, on an 11kV system, would create a current of 550A for the time it was connected to the system, equivalent to a 10MVA load.
5.2 Device Testing As this device was the first of its kind it was necessary to test the complete device in a laboratory, to prove the accuracy of the device and both the mechanical and electrical strength prior to installation, commissioning and energisation on WPD’s 11kV network. A laboratory that can provide 11,000 volts at the same time as current in excess of 30,000A was required. Many laboratories exist that can provide significant current or voltage but not simultaneously. S&C, at their headquarters in Chicago, have an accredited laboratory that has the required capability; therefore this was chosen as the test facility. Other facilities with the required capabilities were explored, such as IPH in Berlin and KEMA in Arnham, however, due to the timescales to deliver the project these options became unviable. 5.2.1 Preparation In order to replicate the on-site conditions as closely as possible, WPD standard current and voltage measurement instruments, that will be installed in the equipment on-site, were shipped to the Chicago Laboratory. This equipment was:
Voltage transformers (VTs) – 11000/110v Class 3P 50VA; and
Current Transformers (CTs) – 2000/5A 5P20 25VA. It was also ensured that the tests were carried out at 50Hz, which is standard to the UK. A detailed test procedure was developed between WPD, PB and S&C Electric’s laboratory team to ensure what was required was firstly deliverable and that the tests could be completed in the allotted time. The schedule comprised a variety of tests at different Peak and RMS fault levels, some high (above 10kA) and some low (below 10kA), a variety of X/R ratios and with tests with either a load connected or disconnected. These different laboratory conditions allow a close representation of the different network conditions that can be seen on the 11kV network in Birmingham and Great Britain (GB).

Page 10 of 50
IMPLEMENTATION OF AN ACTIVE FAULT LEVEL MANAGEMENT SCHEME CLOSEDOWN REPORT
5.2.2 Tests A series of tests were outlined, as described above, with a specific Peak and RMS fault level, X/R ratio and whether a 200A (3.8MVA at 11kV) load would be connected. An extract of the testing schedule is shown in Figure 5-1.
Figure 5-1: Extract of Testing Schedule
Before the testing of the AFLM took place a “bolted” fault was carried out to measure the actual Peak and RMS fault levels as a point of reference. This then acted as a means to determine the accuracy of the AFLM. The laboratory network arrangement is illustrated in Figure 5-2.
Figure 5-2: Laboratory network arrangement

Page 11 of 50
IMPLEMENTATION OF AN ACTIVE FAULT LEVEL MANAGEMENT SCHEME CLOSEDOWN REPORT
Explanation of switches and circuit breakers:
MS1 – Generator Switch (only to be closed once operating frequency is achieved); CB1 – Circuit Breaker to close the IntelliRupter® on to the system; S1 – Bypass Switch to determine if a resistance is added to the “disturbance”; CB2 – Circuit Breaker to close Load (L) on to the system; and S2 – Switch to short the system.
As referenced in Figure 5-1, a series of tests, with varying prospective fault levels and X/R ratios, simulating differing network scenarios, were performed. 5.2.3 Results The results of the tests carried out in Section 5.2.2 are detailed in Figure 5-3.
Figure 5-3: Laboratory Test Results
A selection of test results summarised above of both the Peak and RMS fault levels can be seen to be within 5% accuracy of the reference bolted fault. This was the original aim of the project, to create a device that is suitable for a variety of distribution network arrangements, illustrated by the different loads, X/R ratios and prospective fault levels. Other considerations for the device testing, in preparation for its connection on to the 11kV system in Birmingham, was the potential for it to, whilst performing its fault level monitoring function, disturb customers connected to the system through voltage flicker or harmonic distortions. Therefore, in order to ensure that the AFLM device complies with power quality standards for voltage fluctuations (ER P28) and harmonic distortion (ER G5/4), the waveforms during test were observed and analysed. As shown in Figure 5-3, the greatest voltage step change was 2.76% for the system conditions with a measured 10ms Peak fault level of 31.34kA without the 200A load connected. ER P28 prescribes a general limit of 3% on the allowable magnitude of voltage changes. The average percentage voltage deviation was 1.84% for the test cases considered. The THD limit on the 11kV network is 4% averaged over a 10 minute period. Figure 5-4 shows the change in total harmonic distortion (THD) varies between instantaneous values of 2.2% and 4.7% for the a-b and c-b phases of the network, respectively. Therefore, due to the pulseclosing on the network lasting 5ms, when measured over a 10 minute period this THD will not be detrimental to the network or connected customers.
X/R Ratio Switching Operation Maximum Voltage Minimum Voltage Voltage fluctuation
(No Unit) (No Unit) Peak (kA)RMS @ 10ms
(kA)Peak (kA)
RMS @ 10ms
(kA)
Peak
(kA)
RMS @
10ms (kA)(kV) (kV) (%)
30With 200A load
connected13.83 5.10 13.37 4.87 3.33% 4.46% 6.417 6.353 1.00%
30Without 200A load
connected13.83 5.10 13.50 5.24 2.37% -2.70% 6.447 6.384 0.98%
13.3With 200A load
connected12.88 5.09 13.27 4.95 -2.99% 2.79% 6.289 6.193 1.53%
13.3Without 200A load
connected12.88 5.09 13.38 5.03 -3.88% 1.32% 6.453 6.298 2.40%
23With 200A load
connected31.34 13.10 30.40 13.50 3.01% -3.38% 6.298 6.150 2.35%
23Without 200A load
connected31.34 13.10 31.02 12.87 1.01% 1.74% 6.451 6.273 2.76%
Measured Fault Current Predicted Fault Current % Difference

Page 12 of 50
IMPLEMENTATION OF AN ACTIVE FAULT LEVEL MANAGEMENT SCHEME CLOSEDOWN REPORT
A paper was produced for CIRED, Stockholm 2013, detailing the process and learning from the AFLM device testing. The full paper and poster are provided in Appendix B1 and B2 respectively.
Figure 5-4: Total harmonic distortion of the wave form
5.2.4 Issues The Pad-Mounted Style IntelliRupter® PulseCloser is, in its traditional operation, designed to determine between load and fault current following the Pad-Mounted Style IntelliRupter® PulseCloser opening under a fault condition to understand whether the disconnected part of the system can be re-energised, i.e. detect that the fault is no longer present and it is safe to re-close the system. This operation meant that during the testing of the complete device, due to the initial 20Ω impedance being resistive, it saw this, during its pulseclose operation, as being a connected load and that the system could be closed, therefore locking the phases closed. In order to remove this unwanted performance of the Pad-Mounted Style IntelliRupter® PulseCloser an inductive impedance, at the same value of 20Ω, was used. This meant that when the device performed its pulseclosing operation it detected a faulted system, due to the phase shift induced by the inductive impedance. All tests were then carried out utilising the 20Ω inductance. Another issue encountered during the testing of the AFLM device was induced magnetic flux of the measurement CTs for the AFLM. The CTs used are the standard CTs that are installed in WPD’s 11kV switchgear to provide protection measurement information on the system. When operating on the system there is usually a constant current passed through the CTs and for the instance of a fault the large current seen is for a small period of time, compared to the time it sees general load current. However, during the testing of the AFLM the CTs were carrying no current, except for large fault currents during the test operations. This large current, in some of the CTs, created a significant magnetic flux that generated a substantial phase shift, meaning that they had to be switched for a non-affected CT.

Page 13 of 50
IMPLEMENTATION OF AN ACTIVE FAULT LEVEL MANAGEMENT SCHEME CLOSEDOWN REPORT
5.2.5 Next Steps and Resolutions Following the successful testing of the AFLM device, where the integration of the Pad-Mounted Style IntelliRupter® PulseCloser pulseclosing operation and the detection via the PM7000 was proven and the fault levels were extrapolated to the required accuracy, the next step was to design a full system that could send the fault level values, in real time, autonomously to a required destination (WPD’s network management system or other). The issue relating to the impedance used to dampen the effect of the Pad-Mounted Style IntelliRupter® PulseCloser pulseclosing between two phases on the system having to be an inductance for the tests needed to be considered and resolved. This is explained in detail within Section 5.3. A key learning point from the testing was that during the bolted faults, to act as a reference for the monitored fault levels, the AFLM measurement CTs should be disconnected from the test network to ensure that no magnetising flux is induced.
5.3 Detailed Design This section details the work carried out following the testing on the device in preparation for the on-site installation. Four key elements of the detailed design are:
Control of the pulseclosing AFLM operation;
Transfer fault level value to a remote destination autonomously;
Design and manufacture of a suitable impedance unit; and
Design the protection of the system against mal operation of the AFLM. 5.3.1 Pulseclose Operation In order to maximise the lifetime of the Pad-Mounted Style IntelliRupter® PulseCloser, as it is a mechanical device, and to ensure that one phase of the system is not overstressed it must be designed that every time a pulse close operation happens it is between two different phases. The phase rotation is to be:
R – Y;
Y – B; and
R – B. These operations are illustrated in Figure 5-5.

Page 14 of 50
IMPLEMENTATION OF AN ACTIVE FAULT LEVEL MANAGEMENT SCHEME CLOSEDOWN REPORT
CB
Fault Level Monitor
30Ω
20Ω
RYB IntelliRupter
Resistor
Figure 5-5: AFLM Device Phase Operation
Several options for the pulseclosing control were investigated, with the optimal two being the amendment of the existing S&C Electric Pad-Mounted Style IntelliRupter® PulseCloser software, or to add an additional system to provide the control. In order to have greater control and visibility of the system an external system was decided upon. This system was developed by Nortech Management Ltd, where through the use of their, previously established, Envoy device, software was developed to be able to control the pulseclose operation, both in terms of the two phases that pulseclose and the interval between which these operations take place. In order to facilitate this, a fibre optic connection between the Pad-Mounted Style IntelliRupter® PulseCloser and Envoy device was developed. The use of a fibre optic cable ensured that there was no electrical connection between the Pad-Mounted Style IntelliRupter® PulseCloser and the AFLM control unit. 5.3.2 Autonomous transfer of fault level data As discussed in Section 5.3.1, Nortech Management Ltd was utilised to provide the Pad-Mounted Style IntelliRupter® PulseCloser pulseclose control. It was decided that, due to Nortech carrying out the pulseclose operation package, they would be used to provide the transfer of data from on site to a database system remotely. This was carried out by utilising WPD’s existing iHost system to store the AFLM data. This data was required to be provided in real-time to allow remote access to the data for analysis.

Page 15 of 50
IMPLEMENTATION OF AN ACTIVE FAULT LEVEL MANAGEMENT SCHEME CLOSEDOWN REPORT
5.3.3 Impedance System In order to create a device that can be installed on to the 11kV system, in Birmingham, the current created when two phases are pulseclosed via the Pad-Mounted Style IntelliRupter® PulseCloser were dampened through suitable impedance. As explained in Section 5.2.4 an inductance had to be used to allow the successful testing of the device, however, an inductor installation on site is not suitable, due to the size, cost and electrical requirements relating to their installation on site. Therefore, a resolution to the issue of the Pad-Mounted Style IntelliRupter® PulseCloser understanding a resistive impedance to be a load current on the system was required. Following discussions with the software developers within S&C Electric, it was determined that the software could be developed where it did not investigate the type of current that it sees through the Pad-Mounted Style IntelliRupter® PulseCloser under pulseclose operations, meaning that a suitable resistive impedance could be used. Following S&C Electric’s commitment to develop the Pad-Mounted Style IntelliRupter® PulseCloser software a suitable resistor for installation was investigated. Many companies provide resistors for the installation on distribution and/or transmission networks. Often DNOs install Neutral Earthing Resistors (NER) on to their 11kV network, at a Primary substation, to limit the earth fault current, however, these devices are single phase units and unsuitable for the AFLM application. A unit was required that could limit the current through the AFLM to a suitable value, which following investigation, was decided to be 550A, which equates to 10MVA at 11kV. This relates to 20Ω of resistive impedance:
𝑍 = 𝑉
𝐼=
11000
550= 20Ω
Although a 20Ω resistance was deemed appropriate, as this was a trial it was decided that other resistive values should be investigated that further limit the current seen by the system to minimise the potential visibility to connected customers. The following values were selected:
30Ω (365A); and
50Ω (220A). A manufacturer, HVR International, who produces ceramic resistors for many power systems applications, was approached to produce a suitable resistor. The detail of the resistor, contained within the rating plate, is provided in Appendix D – Resistor Rating Plate.

Page 16 of 50
IMPLEMENTATION OF AN ACTIVE FAULT LEVEL MANAGEMENT SCHEME CLOSEDOWN REPORT
5.3.4 System Protection As the complete system was now understood, in terms of the control methodology, the data capture element and the magnitude of the current created under an AFLM operation, it was now required to appropriately protect the wider 11kV system from a mal operation of the AFLM device. Some of these potential mal operations are:
Pulseclose operation fails and the two phases remaining connected for an extended period of time;
The resistor degrades or fails and the magnitude of the current increases; or
The control system fails and an unexpected operation is carried out, such as three phases pulseclosing simultaneously.
As discussed in Section 5.3.3 the current through the device will range between 220A and 550A for a period of less than 10ms. In order to protect the 11kV from any mal operation, the most onerous condition was considered, which is that the 220A (50Ω) current remains on the 11kV system longer than has been designed. In order to mitigate against this having any wider system impacts a definite time protection setting of 90A 0.3s was applied. This means that if the system were to see 90A for a period of 0.3s, thirty times greater the length of time than expected as a maximum, then a circuit breaker would open and disconnect the AFLM device from the wider system.
5.4 System Integration Following the final design of the device to calculate the system fault level for the instance of an artificial disturbance, generated by the AFLM, it was decided that additional parameters were required to be understood. These parameters were to enable greater utilisation of the AFLM device and its data. The additional parameters were:
Fault level data generated from natural disturbances on the 11kV system where the AFLM is connected; and
An indication of whether the substation was operating in parallel or radial configuration.
Through the addition of these parameters it would mean that the AFLM device has greater applicability for the installation on to all 11kV systems at a primary substation.

Page 17 of 50
IMPLEMENTATION OF AN ACTIVE FAULT LEVEL MANAGEMENT SCHEME CLOSEDOWN REPORT
5.4.1 Natural Disturbance detection In order to maximise the utilisation of the existing assets, a system whereby both the natural and artificial disturbances can be detected and extrapolated in a single PM7000-FLM unit was required. The PM7000-FLM developer, ORL, undertook this activity. The PM7000-FLM device has four current input contacts, in normal AFLM operation only two are used, one for the red phase and the other for the blue phase. This meant the device already had the capacity to take the required number of current inputs:
Red phase AFLM connection;
Blue phase AFLM connection;
Red phase AFLM Transformer Incomer connection; and
Blue phase AFLM Transformer Incomer connection. The transformer incomer currents were utilised for the natural disturbance monitoring detection as this circuit breaker would be subjected to all faults on the connected 11kV system, whereas if it was connected to an 11kV feeder connection, a disturbance would have been required on that particular feeder for an accurate natural disturbance value to be recorded. This arrangement is illustrated in Appendix E – System Architecture Diagram. 5.4.2 Parallel Operation Detection The configuration of the network is critical to the value of fault level on the system. A significant element of this is whether the substation is running in parallel operation or not, where parallel operation is defined as two transformers, or transformer windings, being connected together, which will in turn reduce the upstream impedance of the system and cause the fault level to increase. This paralleling can be achieved either at the substation, through the configuration of 11kV circuit breakers or remotely through the connection of 11kV circuits remote to the substation, however, having the same paralleling effect. In order to understand this effect on the system, for all situations, a development of the PM7000-FLM was required. This work was undertaken to understand specific detail of the electrical flow to differentiate when the network is operating in parallel or not. When the network is operating in parallel configuration it is usual that the current, voltage and power from the two distinct transformers will match each other, along with other characteristics like harmonics. The parallel operation detection system was developed and is based on the examination of the changes in currents occurring through the two transformers. If load changes are shared between two transformers, i.e. running in parallel, the changes are expected to be identical in shape, although the amplitude may differ due to tap change differences. The system also needs to consider that the current in two non-parallel connected transformers may be similar, depending on transformer loadings, meaning that parallel operation may produce different currents, whilst non-parallel operation may produce comparable currents. This

Page 18 of 50
IMPLEMENTATION OF AN ACTIVE FAULT LEVEL MANAGEMENT SCHEME CLOSEDOWN REPORT
potential phenomenon meant that rather than considering the magnitudes of each current and looking for them to match, the system needed to investigate the change in currents. When current changes occur, these changes will be detectable through each of the two transformers being investigated for parallel or non-parallel operation. Through this investigation it can be determined that if the change in current is represented through both transformers at the exact same instant then the transformers can be considered as operating in parallel. Figure 5-6 provides an example of two transformers operating in parallel, where it can be seen that the currents of the phases are sharing the change in current, indicated by the graphs tracing each other.
Figure 5-6: Parallel operation graph
09:49:5210/10/14
09:54:4010/10/14
50:30 51:00 51:30 52:00 52:30 53:00 53:30 54:00Time 00:04:48 (mm:ss)
570
580
590
AC Current (Aac)
650
660
AC Current (Aac)
690
700AC Current (Aac)
660
670
AC Current (Aac)
Maximum Minimum AverageAac RMS of Ia 676 655 667Aac RMS of Ic 708 686 698
Maximum Minimum AverageAac RMS of Ia2 664 644 655Aac RMS of Ic2 590 570 581

Page 19 of 50
IMPLEMENTATION OF AN ACTIVE FAULT LEVEL MANAGEMENT SCHEME CLOSEDOWN REPORT
5.4.3 Final Device System Testing In order to minimise the works required on site in relation to testing and to minimise the risk of the device failing under test, System Integration Testing (SIT) was carried out at the University of Manchester’s HV laboratory. The key requirements of the tests were as follows:
Resistor device – ensuring network suitability;
Control system – ensuring performance was as expected; and
Soak testing – ensuring the system would operate over a period of time.
Resistor Testing The resistor, developed under this project, had not previously been utilised on a DNO’s system, therefore it was required to carry out a series of tests to ensure it was suitable for site installation. The current (I) tests had been carried out at the manufacturer’s facility, as is standard for all the resistor units that are produced, therefore the tests required related to voltage, being:
95kV lightning impulse; and
28kV power frequency withstand. These tests were carried out following the IEC specifications for switchgear, IEC 6227-11 and IEC 60060-12.
Figure 5-7: Resistor in Test Laboratory
1 Standards/IEC, B., 62271 -1 High- Voltage switchgear and control gear, in Part 1 : Common Specification.
2011, British Standards 2 IEC, 60060 - 1 High Voltage Test Techniques in Part 1: General Definition and Test Requirements. 1989.

Page 20 of 50
IMPLEMENTATION OF AN ACTIVE FAULT LEVEL MANAGEMENT SCHEME CLOSEDOWN REPORT
Control System and Soak Testing The design of the AFLM control system had been developed specifically for this project, where the Pad-Mounted Style IntelliRupter® PulseCloser’s pulseclose operation would be controlled by Nortech’s Envoy, discussed in Section 5.3.1. The Pad-Mounted Style IntelliRupter® PulseCloser is a self-powered device, meaning that to operate correctly it requires 11kV, which the laboratory provided, with the resistor also connected, to as closely as possible replicate the site configuration. The Envoy, through a modem, is connected to the Pad-Mounted Style IntelliRupter® PulseCloser via a fibre-optic cable, which provides electrical isolation from the two devices, allowing fast and reliable communications to be achieved. The control system was tested in three phases:
Confirming control;
Confirming pulseclose operation; and
Confirming repeatability. The confirmation of control was achieved by sending a manually driven signal from the Envoy to the Pad-Mounted Style IntelliRupter® PulseCloser to open and close each phase of the Pad-Mounted Style IntelliRupter® PulseCloser. Following the successful testing of Pad-Mounted Style IntelliRupter® PulseCloser control the automated operation of the pulseclose activity was tested. This test was also successful, with the Pad-Mounted Style IntelliRupter® PulseCloser successfully carrying out the three configurations of pulseclosing when instructed by Envoy. In order to test the repeatability of the automated control (soak testing) it was decided that a period of eight hours operation was required with the device operating once an hour, confirming that it is suitable for site installation. During the first soak test there were sporadic failures of the automated process, where the Envoy device could not confirm the pre-operation status of the Pad-Mounted Style IntelliRupter® PulseCloser, which meant that it would not send the pulseclose operation request. The Envoy was, for periods, understanding that a pole of the Pad-Mounted Style IntelliRupter® PulseCloser was closed when in fact it was open. Following detailed investigation by Nortech it was learnt that the Envoy configuration was checking the status of the poles during the pulseclose operation and not confirming the final status once the pulseclose operation was completed. This was resolved following an update of the Envoy software, whereby the final status of the Pad-Mounted Style IntelliRupter® PulseCloser’s poles was confirmed following the completion of the pulseclose operation. This update allowed the successful soak testing of the complete AFLM device. This change resulted in an additional improvement to the system, whereby extra logic safeguards were implemented to ensure that the Envoy would not initiate a pulse-closing operation if it detected that a Pad-Mounted Style IntelliRupter® PulseCloser pole was already in a closed state.

Page 21 of 50
IMPLEMENTATION OF AN ACTIVE FAULT LEVEL MANAGEMENT SCHEME CLOSEDOWN REPORT
5.5 Site Installation In order to install the AFLM device in to the chosen substation, Ladywood, significant electrical and civil works were required. The following sections detail the design and construction activities undertaken as part of the project. 5.5.1 Site Design and Preparation As the AFLM device had not been installed on a DNO’s network previously it was decided that the device must have its own dedicated circuit breaker. This would mean that the device could be appropriately protected from causing any unwanted effects on the system, such as excessive currents, whilst also being protected from other faults on the existing system. Following discussions with WPD Policy Engineers it was also decided that the Pad-Mounted Style IntelliRupter® PulseCloser and Resistor should be installed in its own compound, where access was only permitted when the system was open, isolated and connected to earth, to minimise potential risk of tampering or injury to personnel. This system was managed through signage and a unique key for the AFLM compound access. This process is defined in WPD’s policy documents relating to the device. The detail of the signs is provided in Appendix G – FLM Access Signage. This was required due to it being the first installation and may not be required in future installations. The complete site design can be seen in Appendix F – Site Design. 5.5.2 Switchgear Installation In order to integrate a new 11kV circuit breaker in to the existing network a three panel arrangement was required. This requirement was due to the existing switchgear being GEC KN series circuit breakers that were installed in the early 1960s, which due to having compound filled busbar arrangements are not easily extended. Therefore, an interconnector circuit, which is a cable connection between two primary substations that in the instance of a major outage of the system can provide power between substations, was used. This meant that two additional circuit breakers were required to make this connection. The 11kV integration methodology is detailed in Appendix C – Single Line Diagram. The 3-panel switchboard was installed in to site in October 2013, however, due to ongoing works at the substation, which were to change the two 132/11/11kV transformers due to existing fault level issues, the decision was taken to not connect this switchboard on to the network until the first transformer had been replaced and re-commissioned. This was due to the fact that the interconnector to be used was part of the alternative supply plan if there was an unplanned outage whilst the substation was operating on one transformer rather than two. This meant the switchgear was commissioned and energised at the same time as the AFLM device, in February 2014.

Page 22 of 50
IMPLEMENTATION OF AN ACTIVE FAULT LEVEL MANAGEMENT SCHEME CLOSEDOWN REPORT
5.5.3 Device Installation A robust foundation was required to house the Pad-Mounted Style IntelliRupter® PulseCloser and Resistor. At the specified site there was an existing large foundation that was no longer used, therefore the decision was made to adapt this foundation. The changes required were to cut out parts of the existing foundation to allow the cable connections between the switchgear to the Pad-Mounted Style IntelliRupter® PulseCloser and then from the Pad-Mounted Style IntelliRupter® PulseCloser to the Resistor. Appendix F – Site Design details both the civil and electrical design works for the site. As previously discussed the AFLM compound is only to be accessed when the AFLM circuit breaker is open, isolated and connected to earth, therefore a palisade fence was installed to ensure this was appropriately managed. Figure 5-11 shows the finished device installation and compound arrangement. Both the Pad-Mounted Style IntelliRupter® PulseCloser and Resistor are suitable for outdoor installation, therefore no form of weather protective covering was required; this would be equally applicable to any future site installation.
Figure 5-8: Pad-Mounted Style IntelliRupter® PulseCloser on site

Page 23 of 50
IMPLEMENTATION OF AN ACTIVE FAULT LEVEL MANAGEMENT SCHEME CLOSEDOWN REPORT
Figure 5-9: Resistor on site
Figure 5-10: AFLM Installation at Ladywood – Side View

Page 24 of 50
IMPLEMENTATION OF AN ACTIVE FAULT LEVEL MANAGEMENT SCHEME CLOSEDOWN REPORT
Figure 5-11: AFLM Installation at Ladywood – Top View
On delivery of the Pad-Mounted Style IntelliRupter® PulseCloser to site it was decided that the earth connection for the Pad-Mounted Style IntelliRupter® PulseCloser was not robust enough. The earth connection was a removable thin copper bar, which is standard in America. This was uprated to be to WPD standard specification. The detail of the upgrade can be seen in Figure 5-12.
Figure 5-12: Earth bar upgrade of Pad-Mounted Style IntelliRupter® PulseCloser

Page 25 of 50
IMPLEMENTATION OF AN ACTIVE FAULT LEVEL MANAGEMENT SCHEME CLOSEDOWN REPORT
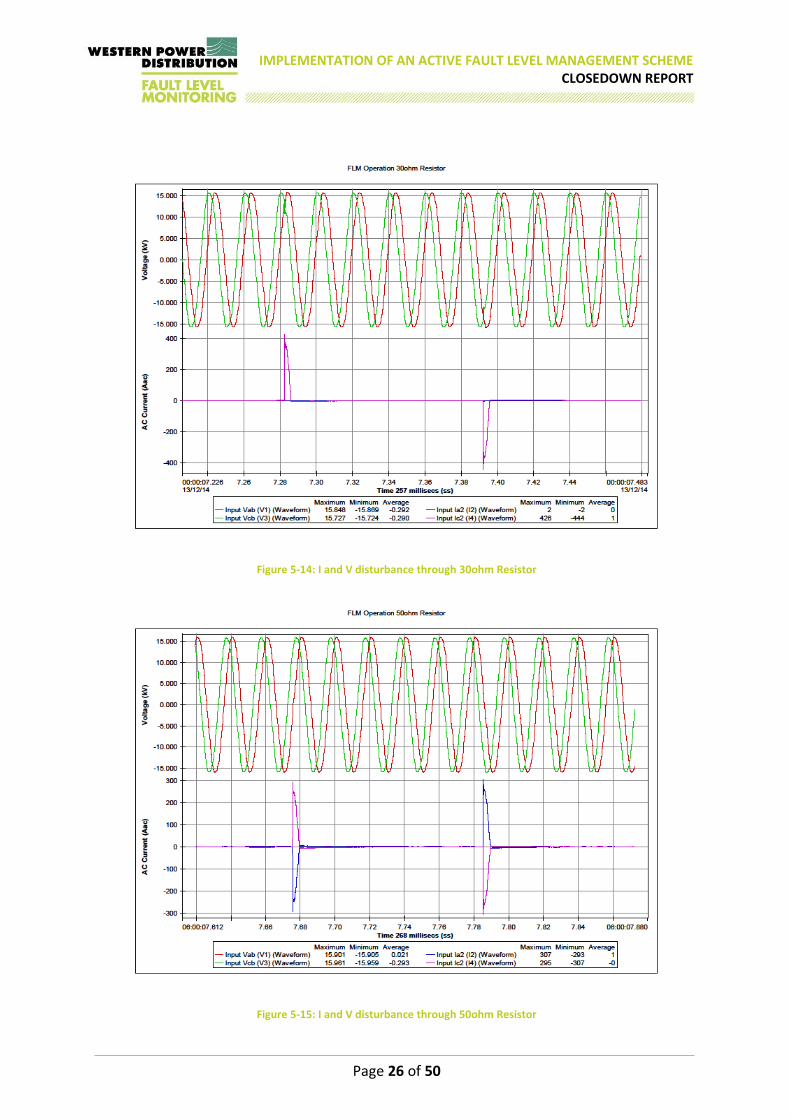
5.5.4 Commissioning and Energisation Following the connection of the switchgear to the 11kV system the commissioning of the AFLM device was undertaken. This work was carried out according to a pre-defined schedule and replicated the system integration testing carried out at the University of Manchester. Firstly, the controlled operation of the Pad-Mounted Style IntelliRupter® PulseCloser was tested, where the signals for operation were manually triggered. In order to minimise the risk to the wider system, for the instance of mal operation, the Resistor was disconnected from the system. This meant that the Pad-Mounted Style IntelliRupter® PulseCloser when closing or pulseclosing was not actually connecting the two phases together but performing the intended function. This test was carried out three times on each permutation of pulseclose operation. Following the successful testing of the manually controlled pulseclose operation the automatic operation via the Envoy was tested, again with the resistor disconnected. This test was again carried out for three complete cycles of pulseclose permutation successfully. These two tests completed the off load testing (Resistor disconnected) requirements of the AFLM device. The Resistor was then connected to the Pad-Mounted Style IntelliRupter® PulseCloser and the previous two tests were carried out again. After each manually controlled operation, of the pulseclosing, the current and voltage detail was gathered and investigated to ensure that the actual data was as expected. Figure 5-13, Figure 5-14 and Figure 5-15 show the performance of the voltage and current for each of the three impedance values of the Resistor.
Figure 5-13: I and V disturbance through 20ohm Resistor
Page 26 of 50
IMPLEMENTATION OF AN ACTIVE FAULT LEVEL MANAGEMENT SCHEME CLOSEDOWN REPORT
Figure 5-14: I and V disturbance through 30ohm Resistor
Figure 5-15: I and V disturbance through 50ohm Resistor

Page 27 of 50
IMPLEMENTATION OF AN ACTIVE FAULT LEVEL MANAGEMENT SCHEME CLOSEDOWN REPORT
6 The outcomes of the Project The description of the work carried out, in Section 5 of this report, outlines the process followed to design, test, install and demonstrate the AFLMS device. Throughout this project a number of challenges arose and were successfully overcome in providing the detailed project outcomes, which is a device that when instructed provides a real-time fault level value for both Peak and RMS of the 11kV network it’s connected. This project has identified a clear outcome for the DNO community in confirming that an AFLM device is achievable and can be integrated in to an existing 11kV distribution network.
6.1 PM7000 Firmware The fundamental role of the PM7000 and specifically the firmware is to extrapolate fault level values for both natural and artificial disturbances, where these disturbances are captured through the dynamic monitoring of both the voltage and current of the system. As detailed in Section 5.2.4 the use of an inductor to add impedance in the system was proposed, limiting the effect of the disturbance on the network, however, due to test conditions and requirements for real network connection a resistor was required. Following the commissioning and energisation of the AFLM it was ascertained that the length of the pulse close operation had reduced, due to the utilisation of a resistor rather than an inductor. The PM7000 takes three data points during the Pad-Mounted Style IntelliRupter® PulseCloser pulseclose operation (now 5ms) and the initial firmware was, due to the reduction in pulse length, missing the final data point from the pulse, seen in Figure 6-1.
5ms
Time
Cu
rre
nt
Original data points
Revised data points
Legend
Figure 6-1: FLM Pulse
Following the identification of this, due to spurious fault level predictions, a revised version of firmware was developed, that ensured all three data points were within the Pad-Mounted Style IntelliRupter® PulseCloser’s pulseclose operation. Several further firmware upgrades and developments were required in order to mitigate specific data cleansing issues.

Page 28 of 50
IMPLEMENTATION OF AN ACTIVE FAULT LEVEL MANAGEMENT SCHEME CLOSEDOWN REPORT
6.2 Pad-Mounted Style IntelliRupter® PulseCloser and Resistor Performance The Pad-Mounted Style IntelliRupter® PulseCloser device, through the demonstration within this project, has proven to deliver a reliable and repeatable artificial disturbance on to the 11kV network. This disturbance then allows the fault level to be accurately monitored. Throughout the project lifecycle there has been no mechanical or electrical issues with the device, including any negative effects leading to the disturbance of supply to customers, such as harmonic or flicker issues.
6.3 Installation and Connection of AFLM The project designed and implemented a safe and reliable installation methodology of the AFLM. A dedicated 11kV circuit breaker was installed for the connection of the AFLM along with specific protection, described in Section 5.3.4. A WPD policy is now in place for the Application and Connection of AFLM Devices on to the 11kV network.
6.4 Control, Communications and Data Storage Following the energisation of the AFLM device on the 27th February 2014, the device has successfully been controlled by the Nortech Envoy, discussed in Section 5.3.1. This illustrates that a robust and suitable mechanism for the control of the Pad-Mounted Style IntelliRupter® PulseCloser in order to initiate a pulseclose operation is in place. The Envoy mechanism has been designed in such a way that the frequency of pulseclose operations can be remotely changed, to allow for more or less frequent fault level monitoring. This element of design is particularly useful as different substations will have varying levels of natural disturbances, allowing fault levels to be generated, therefore the frequency of artificial disturbances can easily and accurately be selected. iHost was selected as the storage medium for the data generated by the AFLM. Throughout the project this proved to be a successful option, where it allowed remote access to WPD personnel and also project partners, who could use real-time data generated by the AFLM device but also use all the stored data to generate reports, compare performance over different time frames and interrogate the operation of the device remotely. This was a clear advantage over having a data storage system that was accessible only to WPD personnel and allowed the flexibility to perform a variety of data interrogation activities.

Page 29 of 50
IMPLEMENTATION OF AN ACTIVE FAULT LEVEL MANAGEMENT SCHEME CLOSEDOWN REPORT
6.5 AFLM Results and Accuracy 6.5.1 Reliability The AFLM was set to operate every six hours (four operations per day) starting at 00:00 (midnight). For the thirty day period analysed below, a total of 120 operations of the AFLM were carried out. In total, 83 data sets were recorded in iHost. This gives a reliability figure of 70%. Learning has shown that this figure is driven by the PM7000 not reliably detecting the change in voltage and current when the Pad-Mounted Style IntelliRupter® PulseCloser pulsecloses on to the 50Ω resistor, due to the low voltage disturbance value generated and communications issues to the data repository. 6.5.2 Data Range The maximum, minimum and average fault level measurements recorded during the time period are shown in Table 6.1 below.
Description Monitor Peak (kA) Monitor 10ms RMS (kA)
Max 21.86 7.69
Average 18.50 6.91
Min 15.98 6.16
Range 5.88 1.53 Table 6-1: Summary of Fault Currents for whole period
To further understand the spread of fault level values, the data was divided into different operating times. Table 6.2 and Table 6.3 below show the range of values for each of the four different timed operations for Peak and RMS respectively.
Peak (kA) 00:00 06:00 12:00 18:00
Max 19.17 20.18 21.86 20.56
Average 17.35 18.52 19.44 18.84
Min 15.98 16.56 16.87 16.68
Range 3.19 3.62 4.99 3.88 Table 6-2: Summary of Peak Fault Current by Operation Time
10ms RMS (kA) 00:00 06:00 12:00 18:00
Max 7.07 7.36 7.69 7.56
Average 6.59 6.91 7.18 7.00
Min 6.16 6.30 6.38 6.40
Range 0.91 1.06 1.31 1.16 Table 6-3: Summary of 10ms RMS Fault Current by Operation Time
Figure 6-2 and Figure 6-3 below show the relationship between the Peak fault level and 10ms RMS fault level respectively for each AFLM operation time for the whole period studied.

Page 30 of 50
IMPLEMENTATION OF AN ACTIVE FAULT LEVEL MANAGEMENT SCHEME CLOSEDOWN REPORT
Figure 6-2: Peak Fault Current Variation with Time
Figure 6-3: 10ms RMS Fault Current Variation with Time
Figure 6-2 and Figure 6-3 show that the fault current at Ladywood Substation is at a low at 00:00 and at a high at 12:00. This profile was expected due to the substation being located close to Birmingham City Centre, where there are a large number of business customers and offices connected. This is confirmed by the substation demand curves with demand at 00:00 around 8MVA and at 12:00 around 11MVA on a working day. This learning shows that a daily variance in fault level is present on the network and supports the need for dynamic network modelling.
15
16
17
18
19
20
21
22
23
00:00:00 06:00:00 12:00:00 18:00:00 00:00:00
Fau
lt C
urr
en
t (k
A)
AFLM Operation Time
AFLM Fault Current by Time - Peak (kA)
6
6.2
6.4
6.6
6.8
7
7.2
7.4
7.6
7.8
8
00:00:00 06:00:00 12:00:00 18:00:00 00:00:00
Fau
lt C
urr
en
t (k
A)
AFLM Operation Time
AFLM Fault Current by Time - 10ms RMS (kA)

Page 31 of 50
IMPLEMENTATION OF AN ACTIVE FAULT LEVEL MANAGEMENT SCHEME CLOSEDOWN REPORT
6.5.3 Modelled Data Using half hourly voltage and power flow data collected via WPD’s data logger system3 the values for the 30 minute period prior to the AFLM operation were added to the PSS/E model of the substation. The 11kV demand was treated as a lumped load attached directly to the 11kV busbar, i.e. not shared along different HV feeders. For all studies carried out in this report, the National Grid Fault infeed was fixed; giving a fixed upstream fault infeed value at Ladywood substation. WPD’s G74 script4 was then used to calculate the fault level for each time interval using a fault level infeed for the 11kV load of 1MVA/MVA and 2MVA/MVA. 1MVA/MVA is the standard recommendation for 11kV networks, however, this value could be high or low dependant on the type of load connected to a substation, where it is expected that a purely domestic load would give the lowest MVA/MVA infeed and a purely heavy industrial load would give the largest. 6.5.4 Comparison – Monitored vs Modelled
Peak Fault Levels In all graphs below, the red line represents the modelled fault level using a fault infeed of 1MVA/MVA for 11kV loads. The blue line represents the modelled fault level using a fault infeed of 2MVA/MVA of 11kV load. The green line represents the values calculated by the AFLM device.
Figure 6-4: Modelled vs Monitored Peak Fault Current at 00:00
3 WPD’s database of power, voltage and current measurements from the network
4 WPD’s mechanism to calculate fault levels according to ENA G74 requirements in PSS/E
15
15.5
16
16.5
17
17.5
18
18.5
19
19.5
20
Fau
lr C
urr
en
t (k
A)
Date
Monitored vs Modelled Peak Fault Current at 00:00

Page 32 of 50
IMPLEMENTATION OF AN ACTIVE FAULT LEVEL MANAGEMENT SCHEME CLOSEDOWN REPORT
Figure 6-5:Monitored vs Modelled Peak Fault Current at 06:00
Figure 6-6: Monitored vs Modelled Peak Fault Current at 12:00
16
16.5
17
17.5
18
18.5
19
19.5
20
20.5
21
Fau
lt C
urr
en
t (k
A)
Date
Monitored vs Modelled Fault Current at 06:00
16
17
18
19
20
21
22
Fau
lt C
urr
en
t (k
A)
Date
Monitored vs Modelled Fault Current at 12:00

Page 33 of 50
IMPLEMENTATION OF AN ACTIVE FAULT LEVEL MANAGEMENT SCHEME CLOSEDOWN REPORT
Figure 6-7: Monitored vs Modelled Peak Fault Current at 18:00
The 00:00 and 06:00 graphs show that the fault level calculated from the PSS/E models is relatively stable and does not show any major changes day to day. The 12:00 and 18:00 graphs clearly show lower fault levels at weekends compared to weekdays and a much greater variation in fault level value. The monitored values show significant variations at all four time periods but greater correlation to modelled results can be seen in the 12:00 and 18:00 graphs.
16
16.5
17
17.5
18
18.5
19
19.5
20
20.5
21
Fau
lt C
urr
et
(kA
)
Date
Monitored vs Modelled Fault Current at 18:00

Page 34 of 50
IMPLEMENTATION OF AN ACTIVE FAULT LEVEL MANAGEMENT SCHEME CLOSEDOWN REPORT
10ms RMS Fault Level In all graphs below, the red line represents the modelled fault level using a fault infeed of 1MVA/MVA for 11kV loads. The blue line represents the modelled fault level using a fault infeed of 2MVA/MVA of 11kV load. The green line represents the values calculated by the ALFM device.
Figure 6-8: Monitored vs Modelled 10ms RMS Fault Current at 00:00
Figure 6-9: Monitored vs Modelled 10ms RMS Fault Current at 06:00
6
6.2
6.4
6.6
6.8
7
7.2
7.4
7.6
7.8
8
Fau
lt C
urr
en
t (k
A)
Date
Modelled vs Monitored 10ms RMS Fault Current at 00:00
6
6.2
6.4
6.6
6.8
7
7.2
7.4
7.6
7.8
8
Fau
lt C
urr
en
t (k
A)
Date
Modelled vs Monitored 10ms RMS Fault Current at 06:00

Page 35 of 50
IMPLEMENTATION OF AN ACTIVE FAULT LEVEL MANAGEMENT SCHEME CLOSEDOWN REPORT
Figure 6-10: Monitored vs Modelled 10ms RMS Fault Current at 12:00
Figure 6-11: Monitored vs Modelled 10ms RMS Fault Current at 18:00
As with the Peak fault level data, 00:00 and 06:00 graphs show that the fault level calculated from PSS/E models is relatively stable and does not show any major changes day to day. The 12:00 and 18:00 graphs clearly show greater fault level fluctuations and lower values at weekends compared to weekdays.
6
6.2
6.4
6.6
6.8
7
7.2
7.4
7.6
7.8
8
Fau
lt C
urr
en
t (k
A)
Date
Monitored vs Modelled 10ms RMS Fault Current at 12:00
6
6.2
6.4
6.6
6.8
7
7.2
7.4
7.6
7.8
8
Fau
lt C
urr
en
t (k
A)
Date
Monitored vs Modelled 10ms RMS Fault Current at 18:00

Page 36 of 50
IMPLEMENTATION OF AN ACTIVE FAULT LEVEL MANAGEMENT SCHEME CLOSEDOWN REPORT
6.5.5 Peak Fault Level Table 6.4 below shows the cumulative total of modelled peak values within a percentage error of the monitored values.
% Error Model to Monitored
(Peak)
Count of values within %
(1MVA/MVA)
% of data values (1MVA/MVA)
Count values within %
(2MVA/MVA)
% of data values (2MVA/MVA)
0% 0 0.00% 0 0.00%
1% 11 13.25% 7 8.43%
2% 19 22.89% 14 16.87%
3% 23 27.71% 21 25.30%
4% 27 32.53% 33 39.76%
5% 31 37.35% 43 51.81%
6% 37 44.58% 51 61.45%
7% 41 49.40% 60 72.29%
8% 47 56.63% 69 83.13%
9% 49 59.04% 75 90.36%
10% 52 62.65% 77 92.77%
11% 57 68.67% 77 92.77%
12% 70 84.34% 82 98.80%
13% 76 91.57% 83 100.00%
14% 80 96.39%
15% 80 96.39%
16% 80 96.39%
17% 82 98.80%
18% 82 98.80%
19% 83 100.00% Table 6-4: Cumulative Total of Modelled Peak Fault levels within % Error of Monitored Fault Level
Table 6.4 shows that using a fault infeed value of 1MVA/MVA of load, 37.35% of modelled values are within 5% of the monitored values. Increasing the fault infeed to 2MVA/MVA of load increases this percentage to 51.81%.

Page 37 of 50
IMPLEMENTATION OF AN ACTIVE FAULT LEVEL MANAGEMENT SCHEME CLOSEDOWN REPORT
Figure 6-12: Peak Fault Level % Error 1MVA/MVA Model to Monitor
Figure 6-13: Peak Fault Level % Error 2MVA/MVA Model to Monitor
Figure 6-12 and Figure 6-13 above show the percentage error of the monitored results compared to the corresponding modelled value. Assuming a ±5% margin of error on all monitored values, for each modelled value outside of this the change in modelled fault current required to be within 5% of the monitored value was calculated. A summary of the fault current changes are provided in Table 6.5 below.
-10.00%
-5.00%
0.00%
5.00%
10.00%
15.00%
20.00%
00:00:00 06:00:00 12:00:00 18:00:00
% E
rro
r
Time
Peak Data % Error - 1MVA/MVA Model vs Monitored
-15.00%
-10.00%
-5.00%
0.00%
5.00%
10.00%
15.00%
00:00:00 06:00:00 12:00:00 18:00:00
% E
rro
r
Time
Peak Data % Error - 2MVA/MVA Model vs Monitored

Page 38 of 50
IMPLEMENTATION OF AN ACTIVE FAULT LEVEL MANAGEMENT SCHEME CLOSEDOWN REPORT
1MVA/MVA 2MVA/MVA
Max Fault Current Change (kA) 3.02 1.56
Average Fault Current Change(kA) 1.02 -0.01
Min Fault Current Change (kA) -0.15 -1.10
Range (kA) 3.17 2.65
No. Values below monitored range 48 21
No. values above monitored range 4 19 Table 6-5: Summary of Error Correction required for Model = Monitor ±5%
Figure 6-12, Figure 6-13 and Table 6.5 show that the accuracy of the AFLM device is much better when comparing its data to the 2MVA/MVA infeed values rather than the 1MVA/MVA, where the average value of difference is only 0.01kA and a maximum difference of 1.56kA. This evidence further supports the need for active dynamic modelling to account for the changing load and mix of generation on the network. 6.5.6 10ms RMS Fault Level Table 6.6 below shows the cumulative total of modelled RMS values within a percentage error of the monitored values.
% Error Model to
Monitored (10ms RMS)
Count of values within
% (1MVA/MVA)
% of data values (1MVA/MVA)
Count values within %
(2MVA/MVA)
% of data values (2MVA/MVA)
0% 0 0.00% 0 0.00%
1% 8 9.64% 14 16.87%
2% 13 15.66% 23 27.71%
3% 22 26.51% 31 37.35%
4% 29 34.94% 41 49.40%
5% 32 38.55% 52 62.65%
6% 34 40.96% 62 74.70%
7% 42 50.60% 66 79.52%
8% 45 54.22% 70 84.34%
9% 55 66.27% 75 90.36%
10% 61 73.49% 80 96.39%
11% 70 84.34% 82 98.80%
12% 75 90.36% 82 98.80%
13% 78 93.98% 82 98.80%
14% 82 98.80% 83 100.00%
15% 83 100.00% Table 6-6: Cumulative Total of Modelled 10ms RMS Fault Levels within % Error of Monitor
Table 6.6 shows that using a fault infeed value of 1MVA/MVA of load, 38.55% of monitored values is within 5% of the modelled values. Increasing the fault infeed to 2MVA/MVA of load increases this percentage to 62.65%.

Page 39 of 50
IMPLEMENTATION OF AN ACTIVE FAULT LEVEL MANAGEMENT SCHEME CLOSEDOWN REPORT
Figure 6-14: 10ms RMS Fault Level % Error 1MVA/MVA Model to Monitor
Figure 6-15: 10ms RMS Fault Level % Error 2MVA/MVA Model to Monitor
Figure 6-14 and Figure 6-15 above show the percentage error of the monitored results compared to the corresponding modelled value. Assuming a ±5% margin of error on all monitored values, for each modelled value outside of this the change in modelled fault current required to be within 5% of the monitored value was calculated. A summary of the fault current changes are provided in Table 6.7 below.
-10.00%
-5.00%
0.00%
5.00%
10.00%
15.00%
20.00%
00:00:00 06:00:00 12:00:00 18:00:00
% E
rro
r
Time
10ms RMS Data % Error - 1MVA/MVA Model vs Monitored
-15.00%
-10.00%
-5.00%
0.00%
5.00%
10.00%
00:00:00 06:00:00 12:00:00 18:00:00
% E
rro
r
Time
10ms RMS Data % Error - 2MVA/MVA Model vs Monitored

Page 40 of 50
IMPLEMENTATION OF AN ACTIVE FAULT LEVEL MANAGEMENT SCHEME CLOSEDOWN REPORT
1MVA/MVA 2MVA/MVA
Max Fault Current Change (kA) 0.69 0.22
Average Fault Current Change(kA) 0.32 -0.13
Min Fault Current Change (kA) 0.00 -0.57
Range (kA) 0.69 0.79
No. Values below monitored range 51 9
No. values above monitored range 0 22 Table 6-7: Summary of Error Correction required for Model = Monitor ±5%
Figure 6-14, Figure 6-15 and Table 6.7 shows that using the modelled values at 1MVA/MVA all the values are below the monitored values. The modelled values calculated using 2MVA/MVA the majority of the values are within a 5% tolerance of the monitored value. As with the Peak data, the AFLM device values are closer to the modelled values at 2MVA/MVA. This RMS data further supports the need for accurate dynamic modelling of the system.
6.6 Technology Readiness Level The initial Technology Readiness Level (TRL) for the AFLM device was 6. This was due to the fact that although the individual elements had been developed and tested on their own, the integration of the complete device was still untested. Following the successful integration of the device the TRL has increased from 6 – 7. Further developments are required to improve the TRL to 8, including the further integration of the control and communications with the PM7000 power monitoring device.
6.7 Increasing Network Connections and Contractual Arrangements The amount of fault level headroom available is calculated by subtracting the real-time network fault level from the fault level rating of the equipment. The real-time network fault level varies depending on a number of factors including network configuration, embedded generation and load contribution; however, the fault level rating of equipment is a fixed value. The AFLM device has the capability to provide both natural and artificial disturbance real-time data. Under natural disturbance conditions the AFLM device automatically captures an updated real-time fault level value when current and voltage disturbances are seen on the network, typically due to switching operations and notable load changes. However, if no natural disturbances are available then an AFLM artificial disturbance is triggered to provide a real-time fault level value. Under artificial disturbance operation the AFLM can be triggered to provide an on-demand fault level value. This on-demand fault level value will then be used to ascertain the instantaneous fault level headroom in real-time to determine if an embedded generator can remain/connect on the network. Therefore, there is now the capability to make an informed decision on whether or not it is safe to allow additional generation. In practise the fault

Page 41 of 50
IMPLEMENTATION OF AN ACTIVE FAULT LEVEL MANAGEMENT SCHEME CLOSEDOWN REPORT
level calculations and decision making would be carried out automatically by an integrated control system, presenting the results in either an existing Network Management System (NMS) or another selected format. There are various aspects that need to be carefully considered in implementing the AFLM scheme for the control of embedded generation. Several fundamental decisions and calculations would need to be carried out, such as understanding the operation of the network, i.e. whether it is in a normal or abnormal configuration, which will allow additional information to be considered in determining the connection of a generator. Through WPD’s development of Alternative Connection Offers and Agreements the requirements of a generator under ‘Limitation of Capacity’ for an alternative connection are defined. These documents clearly set out the process and requirements to customers, including the time to disconnect or carry out the instructed action and the actions if a customer fails to carry out the required instruction. Instructions that could be provided to a customer in order to actively manage their connection for fault level issues are:
Specify that the customer must De-energise the Connection Point and the Customer’s Installation from the Company’s Distribution System; and
Specify that the customer must De-energise Generator X from the Company’s Distribution System.
Key information to be used for the contractual arrangements for flexible generation connections, based on real-time fault level data, is the historic analysis of fault level data in the form of actual modelling of the network conditions and power flows to understand the constraint times (in hours or days) that can be expected based on historic trends. Figure 6-16 shows a flowchart of the decisions in order to determine a generator’s connection to the system.
Page 42 of 50
IMPLEMENTATION OF AN ACTIVE FAULT LEVEL MANAGEMENT SCHEME CLOSEDOWN REPORT
Generation Connected to
Network
Has Fault Level changed? AFLM DataLeave Generation
ConnectedNO
YES
Is NEW Fault Level greater than permissible limit?
Site Specific Fault Level
limits (including safety margin)
Leave Generation Connected
NO
Send disconnection signal to Gen Unit
YES
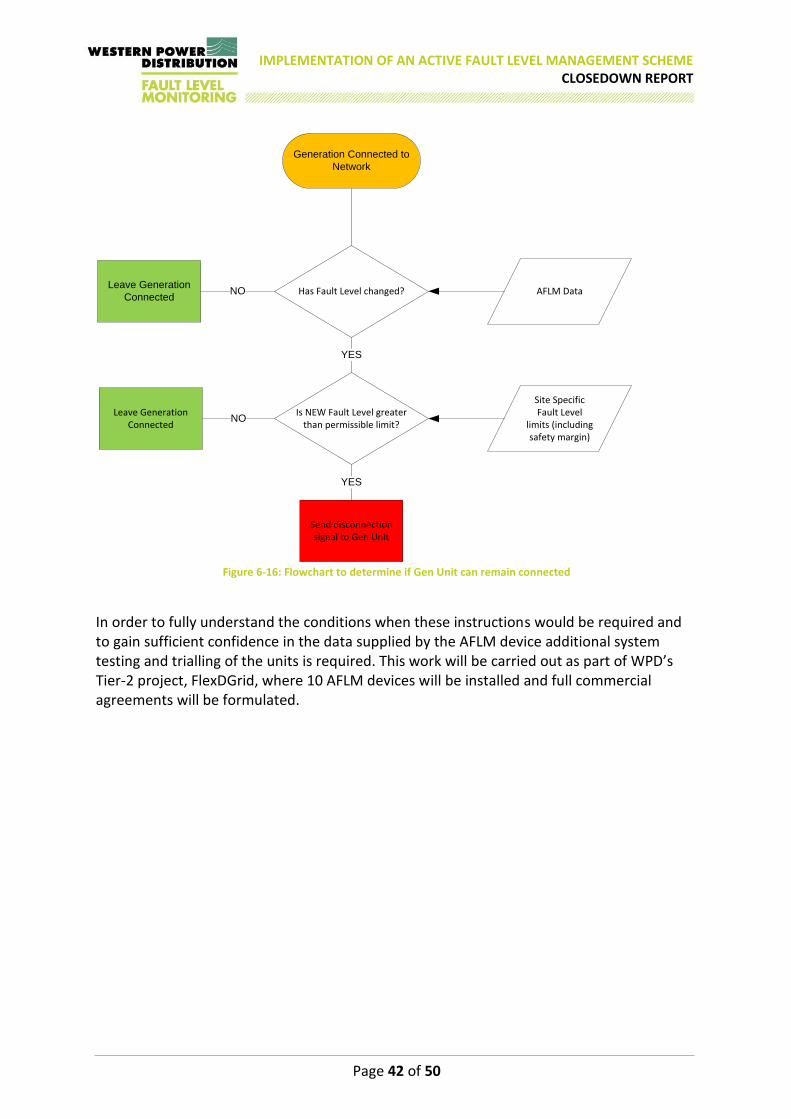
Figure 6-16: Flowchart to determine if Gen Unit can remain connected
In order to fully understand the conditions when these instructions would be required and to gain sufficient confidence in the data supplied by the AFLM device additional system testing and trialling of the units is required. This work will be carried out as part of WPD’s Tier-2 project, FlexDGrid, where 10 AFLM devices will be installed and full commercial agreements will be formulated.

Page 43 of 50
IMPLEMENTATION OF AN ACTIVE FAULT LEVEL MANAGEMENT SCHEME CLOSEDOWN REPORT
7 Performance compared to the original Project aims, objectives and success criteria
7.1 Integration of technologies to provide real-time fault level values
Integration of Outram fault level monitor and S&C intellirupter device, which will provide a controllable (non-customer affecting) fault to be analysed and relayed in real-time
The project developed a working system combining the PM7000 and Pad-Mounted Style IntelliRupter® PulseCloser to provide a non-customer affecting disturbance that enabled Peak and 10ms RMS fault levels to be extrapolated. The Pad-Mounted Style IntelliRupter® PulseCloser, through the development of the Nortech Envoy control methodology, is fully controllable.
7.2 Installation of Active Fault Monitoring device at Primary Substation The project successfully installed an AFLM device on to the 11kV and has subsequently operated for a 12 month period, as originally stated.
7.3 Success Criteria 7.3.1 Conduct factory acceptance tests of fault level monitoring devices Successfully completed to schedule in July 2012. Details provided in Section 5.2. 7.3.2 Install and commission the active fault level management scheme Successfully completed to schedule in February 2014. Details provided in Section 5.5. 7.3.3 Ability to monitor fault levels in real-time to accommodate additional distributed
generation without the need for large-scale network reinforcement Significant learning towards the use of real-time fault level data in order to minimise the requirement for large-scale network reinforcement has been achieved. Section 6.5 details the learning achieved from the real-time Peak and RMS data that has been obtained. Section 6.7 provides a detailed understanding of the engineering and contractual requirements to successfully integrate additional generation connections on to the network. 7.3.4 Integrate distributed generation into the network more quickly The development and implementation of the AFLM device has proven that Peak and RMS fault levels can be generated, at a controllable point in time, to better understand the real-time network conditions compared to the existing methodology of utilising the worst-case fault level of the affected network. Additional testing is required and more extensive trials, which will form part of FlexDGrid in order to fully determine its reliability. In the future, following further trials, if a generator wants to connect to the 11kV system the time to connect will be in the region of six months rather than 24 months.

Page 44 of 50
IMPLEMENTATION OF AN ACTIVE FAULT LEVEL MANAGEMENT SCHEME CLOSEDOWN REPORT
7.3.5 Development of an engineering interface and control methodology Throughout the project a detailed methodology for the integration of the AFLM device on to the 11kV network and the active control of the device was completed. During this project a WPD policy was created for the Application and Connection of 11kV AFLM Devices.
7.3.6 New contractual arrangements to maximise generation connectivity As discussed in Section 6.7, the different scenarios to understand the process to facilitate the connection of additional generation on to an existing network without the need for expensive and long lead time reinforcement have been documented. Modelling work has shown that the worst-case fault level of a substation can occur as infrequently as 5% of the year (18 days). Therefore, to enable customers to connect additional generation, the AFLM device fault level data needs to be used appropriately to realise the benefits of moving from worst-case to real-time fault level data. Below is a simplified approach to be followed for the condition to determine whether a disconnected generator can reconnect.
Generation to Connect to
Network
Has Fault Level changed?AFLM Data –
Fault Level DataDo not connect Gen
UnitNO
YES
Is NEW Fault Level LOWER than permissible limit?
Site Specific Fault Level
limits (including safety margin)
NO
Send able to Connect signal to Gen Unit
YES
Do not connect Gen
Unit
Gen Unit Fault Level
contribution (Specific Site
Detail)
AFLM Data – Fault Level Data
Figure 7-1: Flowchart to determine if Gen Unit can connect
As discussed in Section 6.7, WPD’s Alternative Connection Offer and Agreement documents currently in place will enable flexible generator connections relating to fault level constraints on the network, once the additional testing and trialling has been successfully completed.

Page 45 of 50
IMPLEMENTATION OF AN ACTIVE FAULT LEVEL MANAGEMENT SCHEME CLOSEDOWN REPORT
8 Required modifications to the planned approach during the course of the Project
Minor modifications to the design of the AFLM device were encountered throughout the project; however, this didn’t need any change to the planned approach to the project. Some of these design changes are documented below:
Control of the AFLMS Device
Following testing of the device and significant learning about the possibilities and benefits of being able to dynamically control the regularity of the pulseclosing operations, for instances where the natural disturbances on different substations were more or less prevalent, an external control system was preferred over the Pad-Mounted Style IntelliRupter® PulseCloser’s internal controls.
Resistor During initial testing it was identified that an impedance was required between the two phases pulseclosing in order to dampen the effects to a point where the current created and voltage dip seen would not be customer affecting.
Location of Parallel Detection Testing Two substations were selected, rather than the specific project substation location, Hall Green and Cheapside, where they normally ran in non-parallel and parallel operation respectively. Following this modification a more robust testing methodology was achieved as the mechanism was tested, successfully, on two distinct elements of network.

Page 46 of 50
IMPLEMENTATION OF AN ACTIVE FAULT LEVEL MANAGEMENT SCHEME CLOSEDOWN REPORT
9 Significant variance in expected costs
Description Budget (£k) Cost (£k)
Variation (%)
Device Value 380.000 367.962 -3.3
Equipment & Installation 95.000 93.487 -1.6
Consultancy Support 180.000 175.035 -2.8
Project Management 55.000 53.845 -2.1
TOTAL 710.000 690.329 -2.8 Table 9-1: Project Costs
There were no significant variances in the project costs.

Page 47 of 50
IMPLEMENTATION OF AN ACTIVE FAULT LEVEL MANAGEMENT SCHEME CLOSEDOWN REPORT
10 Lessons learnt for future Innovation Projects
10.1 Device Control A modification through the project was the decision to use Nortech’s Envoy device to control the operation of the AFLM rather than the integrated control system of the Pad-Mounted Style IntelliRupter® PulseCloser. The use of the Envoy device enabled a co-ordinated integration approach for the different devices to be included to form the AFLM device. A significant learning point was to ensure the most suitable and technically capable control system is utilised to ensure the functionality and operability of any device is maximised.
10.2 Network Impact Analysis Prior to the physical works, relating to the project, commencing a detailed study of the proposed AFLM device’s effect on the 11kV network was undertaken. The importance of carrying out such a study was highlighted through the identification that a suitably rated resistor was required to ensure that the device’s effect on network parameters, current and voltage, would not be customer disturbing. The measured effects of a new device on a network, where possible, should be understood on a variety of network conditions. A key learning point was to understand the differing values produced in terms of both the fault level and parallel detection data. A variety of 11kV conditions were considered, due to network switching, to provide fault level readings to be analysed against modelled values, as well as installing the parallel detection element of the device on two different primary substations to understand the impact on a wider location basis.
10.3 Technology and System Integration Testing A key learning point throughout this project was the importance of testing. Through the testing of the technology, pulseclose and fault level prediction, and the full system integration the site installation work was significantly de-risked. It was understood that the individual parts of the system worked but testing of the complete system, prior to site installation, was critical to the success of the project. Testing the technology performance in an accredited laboratory provided a considerable amount of learning as to how the device operates, how it needed to be developed for inclusion on to a real network and also the accuracy of performance, benchmarked against actual faults on a system. Full system integration testing enabled the control and communications device (Envoy) to be fully tested in a non-network connected environment. This was carried out at the University of Manchester, as detailed in Section 5.4.3. The benefit of carrying this out on a system that was operating at 11kV but did not risk disconnecting any customers from the system was significant. This testing allowed for different regimes to be tested, along with the

Page 48 of 50
IMPLEMENTATION OF AN ACTIVE FAULT LEVEL MANAGEMENT SCHEME CLOSEDOWN REPORT
performance of the system for a failure of part or all of the system, ensuring that the required response was achieved for a number of failure modes, which delivered confidence in the product to move towards site installation. A recommendation is that for all devices that have an effect on network parameters, such as voltage or current, should, as a full system, be tested in a laboratory environment to reduce the risk of mal operation and to better understand the performance of the system under different failure modes. Also, utilising test facilities outside the UK isn’t as expensive or complex as initially envisioned. It is more critical to ensure that a device is appropriately tested in a suitable facility that can carry out and rigorously document the tests required.
10.4 Network Modelling Requirements Learning from the trialling of the AFLM device connected to the network has shown that, as proposed at the project’s outset, the fault level on the 11kV network varies throughout the day, which is driven by the changing power flows on the system. Further work is required to investigate the differences between the modelled and monitored values and where the differences originate. A significant element is the MVA/MVA fault infeed value of the demand and generation connected to the network. Allowing additional time for modelling would have provided greater clarity as to the performance of the AFLM device.
10.5 Team Structure Having a project team with a diverse set of skills has been integral to the success of the project. Using a large engineering consultancy, Parsons Brinckerhoff, brought a breadth of knowledge to the project and the ability to quickly access individuals with the skills required at different phases as the project, such as an expert in high power laboratory testing. Working with project partners like Nortech and Outram Research, as SMEs, enabled changes to designs and processes to be completed quickly; as they had the flexibility to adapt to the project’s needs. S&C Electric enabled a flexible approach to the high power testing as part of the project and provided significant experience and a pro-active outlook to enable the required modifications for the requirements of the project.

Page 49 of 50
IMPLEMENTATION OF AN ACTIVE FAULT LEVEL MANAGEMENT SCHEME CLOSEDOWN REPORT
11 Planned implementation
The AFLM device has been tested on a single substation for a 12-month period. This learning has shown significant promise to be further developed, to better understand the real-time fault level of an 11kV network. Understanding the fault level on a wider variety of substations, with different load and generation type that have varying MVA/MVA infeed values would enable DNO modelling practices and procedures to be developed and updated. Therefore, this work is to be transferred to WPD’s LCNF Tier-2 project, FlexDGrid.
The work carried out in this LCNF Tier-1 project has significantly de-risked the implementation of the AFLM device for FlexDGrid. Additional work is required to facilitate the calculation of RMS values at a variety of time domains, such as 70ms and 90ms in order to accurately represent the break fault level of a system.
12 Facilitate Replication
The AFLM device, using a mechanical disturbance mechanism (Pad-Mounted Style IntelliRupter® PulseCloser – pulseclose operation), is fully developed. As discussed in this document further work is to be carried out to confirm and further develop the accuracy of the fault level values provided.
Two policies are now in place within WPD. The first is an Engineering Specification that details the technical requirements and criteria of the 11kV device. The second is a Standard Technique, which is an application and connection guidance document, providing detail on what is required to integrate an AFLM device on to an 11kV, such as:
Connection requirements on to the 11kV network;
Integration of the device with existing measurement equipment on the proposedsite; and
Protection philosophy for the device and the network.
These policies, on request, have been made available to all DNOs.
Following the production of polices this has allowed the AFLM device to be documented in WPD’s standard asset register system CROWN, which enables a standard maintenance regime to developed and carried out.
Within Section 6.5 a methodology has been presented to determine and analyse the results presented by the AFLM device. This methodology will enable other DNOs or installers of an AFLM device to understand and interpret the results produced.
There has been no relevant foreground IPR registered as part of this project.

Page 50 of 50
IMPLEMENTATION OF AN ACTIVE FAULT LEVEL MANAGEMENT SCHEME CLOSEDOWN REPORT
13 Contact details Jonathan Berry Innovation and Low Carbon Networks Engineer Western Power Distribution Fourth Floor Toll End Road Tipton DY4 0HH e-mail: [email protected] telephone: 0121 6 239 459 website: www.westernpowerinnovation.co.uk
14 Appendices
A. LCN Fund Registration Pro-forma B. Dissemination
1. CIRED 2013 Paper 2. CIRED 2013 Poster
C. 11kV Single Line Diagram D. Resistor Rating Plate E. System Architecture Diagram F. Site Design G. AFLM Access Signage

IMPLEMENTATION OF AN ACTIVE FAULT LEVEL MANAGEMENT SCHEME CLOSEDOWN REPORT
Appendix A – REGISTRATION PRO-FORMA

Notes on completion Before completing this form, please refer to the LCN Fund Governance Document.Please use the default font (Verdana font size 9) in your submission, the text entry areas are predetermined and should not be changed. Please ensure all content is contained within the boundaries of the text areas. The full-completed submission should not exceed 4 pages in total.
First Tier Pro-forma
Project title
DNO
Participant DNOs
Project summary
Problem(s)Please provide a narrative which explains the Problem(s) which being addressed by the Project.
Registration Date
‹1›

Scope and ObjectivesPlease describe the scope and objectives of the Project should be clearly defined including the benefits which should directly accrue to the Distribution System.
Success CriteriaPlease give details of how the DNO will evaluate whether the Project has been successful.
Method(s)This section should set out the Method or Methods that will be trialled in order to solve the Problem. The type of Method should be identified where possible e.g. technical or commercial.
Problem(s) continued
‹2›

RisksThe DNO should highlight any material, known risks that could impact the Project’s costs and/or programmes.
Scale of projectPlease justify the scale of the Project. In particular, the DNO should explain why there would be less potential for new learning if the Project were a smaller scale.
Geographical areaDetails of where the Trial(s) will take place. If the Project is a collaboration, the DNO area(a) in which the Trial(s) take place should be identified.
Potential for new learningDetail what the parties hope to learn and how the learning will be disseminated.
TRLThis should be between 5-8 to be eligible for Tier 1 Funds.
Predicted start and end dates.DNOs should provide an estimate of the expected project starting and completion dates.
Start Date: End Date:Project partners and external fundersPlease give details of actual or potential Project Partners and External Funding Support as appropriate
‹3›

Please tick if the project conforms to the default IPR arrangements set out in the LCN Fund Governance Document?
The DNO should indicate if the Project does not conform to the default IPR conditions. A justification for alternative arrangements and why the Project should still be approved must be provided, in accordance with paragraph 2.18 of the Governance Document.
Please tick if you do not consent to the First tier pro-forma being published in full.If you do not consent please identify any information in the completed First Tier LCN Project Registration that you do not wish to be published.The DNO must demonstrate that it (or its Project Partners) will face commercial harm from its disclosure and that information is considered eligible for exemption under the Freedom of Information Act 2000 or the Environmental Information Regulations 2004. All information submitted within the First Tier LCN Project Registration Pro-forma will be made available on the Ofgem website, unless Ofgem has agreed otherwise as part of the Registration process set out above.
Estimated Project fundingAn indication of the revenue allowed for within the DPCR5 settlement that is likely to be saved as a result of the project.
An indication of the total Allowable First Tier Project Expenditure that the DNO expects to reclaim the for the whole project.
Revenue allowed for in the DPCR5 Settlement (£)
Indicative total Allowable First Tier Project Expenditure (£)
Please tick if the project involves making payments to related undertakings
The DNO must set out all payments that it proposes to make to itself or any Related Undertaking. Further, if a payment is to be made to any Related Undertaking that is a Distribution System User, the DNO must demonstrate that it has offered the same terms to similar Distribution System Users on the part of the network that is within the Project boundary and has used reasonable endeavours to identify such Users.
‹4›

IMPLEMENTATION OF AN ACTIVE FAULT LEVEL MANAGEMENT SCHEME CLOSEDOWN REPORT
Appendix B.1 – CIRED PAPER

C I R E D 22nd International Conference on Electricity Distribution Stockholm, 10-13 June 2013
Paper 0619
CIRED2013 Session 3 Paper No 0619
IMPLEMENTATION OF AN ACTIVE FAULT LEVEL MONITORING SYSTEM FOR
DISTRIBUTED GENERATION INTEGRATION
Jonathan BERRY Samuel JUPE Mike MEISINGER
Western Power Distribution – UK Parsons Brinckerhoff – UK S&C Electric Europe Ltd – UK
[email protected] [email protected] [email protected]
John OUTRAM
Outram Research Limited – UK
ABSTRACT
This paper describes the practical implementation of an
active fault level monitoring system to facilitate the
integration of distributed generation (DG) within 11kV
distribution networks. The system is being tested in the UK
by a consortium comprising Western Power Distribution,
Parsons Brinckerhoff, S&C Electric Company and Outram
Research Limited. Laboratory tests were conducted for a
variety of system fault levels and network running
arrangements. Results from the laboratory tests showed
that the fault level was consistently predicted to be within
4.5% of measured three-phase faults applied to the system.
INTRODUCTION
The increase in fault level contribution from rotating machines is a significant barrier to the connection of new synchronous generators, for example combined heat and power (CHP) units, within 11kV networks [1]. In order to ensure the integrity of the power system, fault levels need to be maintained below equipment ratings. Current network reinforcement options would involve the replacement of switchgear with higher-rated equipment or replacement of transformers with a higher impedance core. These solutions often entail significant capital expenditure and may involve long lead times for installation, delaying the connection time of generators on to the network. Fault level is a measure of electrical stress when an unintentional conducting path (fault) causes a short circuit. This causes potentially very high fault currents to flow in the electricity lines, cables and substation equipment. The amount of fault current varies from location to location; depending on how electrically close the fault is to the energy sources (for example a transformer or rotating plant). This paper describes the development and testing of an active fault level monitoring system to facilitate the integration of distributed generation (DG) within 11kV distribution networks. The system is being laboratory tested and subsequently field tested in the UK by a consortium comprising Western Power Distribution, Parsons Brinckerhoff, S&C Electric Company and Outram Research Limited.
The UK electricity network regulator, Ofgem, has established the Low Carbon Networks (LCN) Fund to support projects, sponsored by the distribution network operators (DNOs), to trial new technology, operating and commercial arrangements [2]. For the purposes of this project, through the LCN Fund [3], two existing products have been combined to provide fault level predictions in real-time: S&C Electric’s IntelliRupter
® PulseCloser and
Outram Research Limited’s PM7000 Fault Level Monitor (FLM). An IntelliRupter
® PulseCloser is an intelligent
electric switching device that, in normal operation, is used to detect, interrupt, and isolate faults. The PM7000 is an electricity network device that monitors power quality. The PM7000 provides a hardware platform for fault level monitoring and prediction algorithms. This project aims to demonstrate the feasibility of real-time fault level predictions to facilitate quicker and more cost-effective DG connections, permitting an increase in power supplied from renewable energy sources whilst managing the fault level to avoid exceeding equipment ratings. Moreover, the system could allow the network to be operated in a more secure configuration. In addition, the project will also improve the practical understanding of how close simulated fault levels are to actual values. System studies can result in pessimistic fault level calculations [4] and an active monitoring system overcomes the drawbacks associated with passive monitoring techniques.
BACKGROUND
Driven by UK Government policy [5], the increasing
requirement to connect new DG (such as renewable and
CHP) to distribution networks will impact on the operation
of the network in a number of areas including voltage levels
and fault levels. In some cases this could result in the fault
level exceeding the design limit of the network equipment
unless actions are taken to mitigate this issue [6].
The contribution of induction machines to short-circuit
currents can be significant and must be considered when
evaluating system fault levels. Standard procedures for
calculating short circuit currents of induction machines
require detailed machine data, which may not be available.
Moreover, the results obtained using standards may lead to
conservative design and unnecessary expense [4].
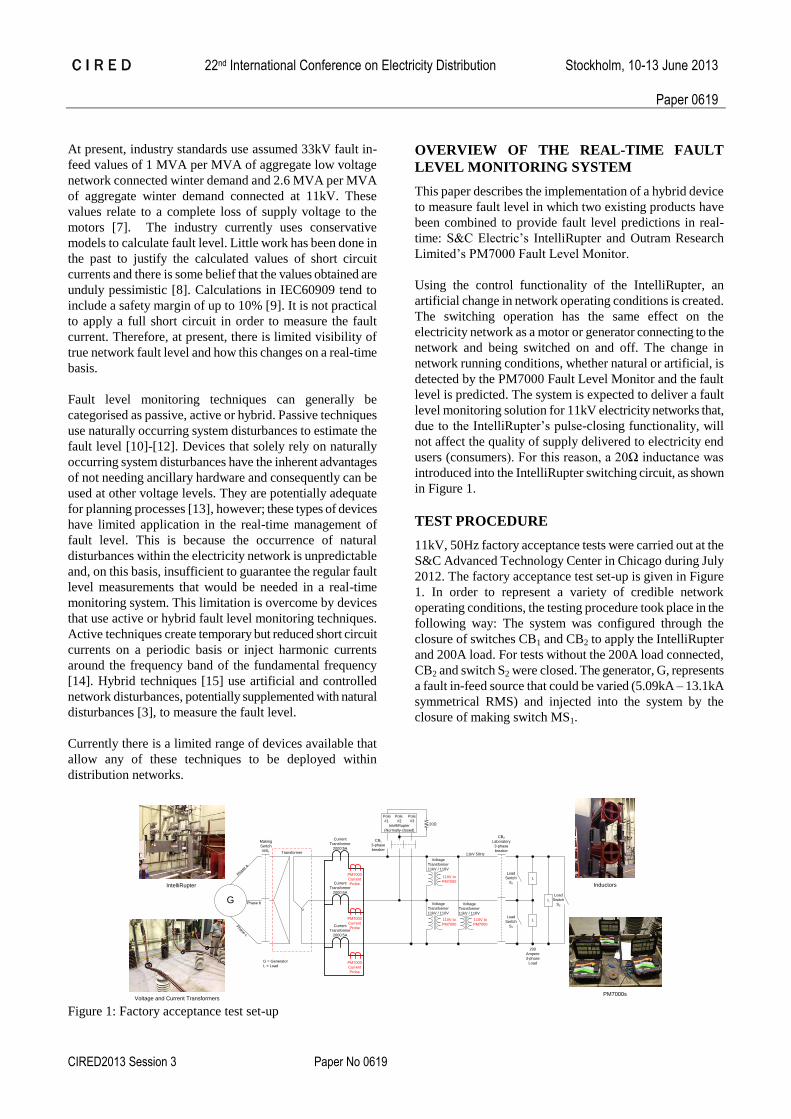
C I R E D 22nd International Conference on Electricity Distribution Stockholm, 10-13 June 2013
Paper 0619
CIRED2013 Session 3 Paper No 0619
At present, industry standards use assumed 33kV fault in-
feed values of 1 MVA per MVA of aggregate low voltage
network connected winter demand and 2.6 MVA per MVA
of aggregate winter demand connected at 11kV. These
values relate to a complete loss of supply voltage to the
motors [7]. The industry currently uses conservative
models to calculate fault level. Little work has been done in
the past to justify the calculated values of short circuit
currents and there is some belief that the values obtained are
unduly pessimistic [8]. Calculations in IEC60909 tend to
include a safety margin of up to 10% [9]. It is not practical
to apply a full short circuit in order to measure the fault
current. Therefore, at present, there is limited visibility of
true network fault level and how this changes on a real-time
basis.
Fault level monitoring techniques can generally be
categorised as passive, active or hybrid. Passive techniques
use naturally occurring system disturbances to estimate the
fault level [10]-[12]. Devices that solely rely on naturally
occurring system disturbances have the inherent advantages
of not needing ancillary hardware and consequently can be
used at other voltage levels. They are potentially adequate
for planning processes [13], however; these types of devices
have limited application in the real-time management of
fault level. This is because the occurrence of natural
disturbances within the electricity network is unpredictable
and, on this basis, insufficient to guarantee the regular fault
level measurements that would be needed in a real-time
monitoring system. This limitation is overcome by devices
that use active or hybrid fault level monitoring techniques.
Active techniques create temporary but reduced short circuit
currents on a periodic basis or inject harmonic currents
around the frequency band of the fundamental frequency
[14]. Hybrid techniques [15] use artificial and controlled
network disturbances, potentially supplemented with natural
disturbances [3], to measure the fault level.
Currently there is a limited range of devices available that
allow any of these techniques to be deployed within
distribution networks.
OVERVIEW OF THE REAL-TIME FAULT
LEVEL MONITORING SYSTEM
This paper describes the implementation of a hybrid device
to measure fault level in which two existing products have
been combined to provide fault level predictions in real-
time: S&C Electric’s IntelliRupter and Outram Research
Limited’s PM7000 Fault Level Monitor.
Using the control functionality of the IntelliRupter, an
artificial change in network operating conditions is created.
The switching operation has the same effect on the
electricity network as a motor or generator connecting to the
network and being switched on and off. The change in
network running conditions, whether natural or artificial, is
detected by the PM7000 Fault Level Monitor and the fault
level is predicted. The system is expected to deliver a fault
level monitoring solution for 11kV electricity networks that,
due to the IntelliRupter’s pulse-closing functionality, will
not affect the quality of supply delivered to electricity end
users (consumers). For this reason, a 20Ω inductance was
introduced into the IntelliRupter switching circuit, as shown
in Figure 1.
TEST PROCEDURE
11kV, 50Hz factory acceptance tests were carried out at the
S&C Advanced Technology Center in Chicago during July
2012. The factory acceptance test set-up is given in Figure
1. In order to represent a variety of credible network
operating conditions, the testing procedure took place in the
following way: The system was configured through the
closure of switches CB1 and CB2 to apply the IntelliRupter
and 200A load. For tests without the 200A load connected,
CB2 and switch S2 were closed. The generator, G, represents
a fault in-feed source that could be varied (5.09kA – 13.1kA
symmetrical RMS) and injected into the system by the
closure of making switch MS1.
IntelliRupter
Voltage and Current TransformersPM7000s
Inductors
G
PM7000
Current
Probe
PM7000
Current
Probe
PM7000
Current
Probe
20Ω
110V to
PM7000
110V to
PM7000
110V to
PM7000
L
L
L
Making
Switch
MS1
CB1
3-phase
breaker
Current
Transformer
2000:5A
Load
Switch
S2
Load
Switch
S2
Load
Switch
S2
CB2
Laboratory
3-phase
breaker11kV 50Hz
200
Ampere
3-phase
Load
Transformer
Current
Transformer
2000:5A
Current
Transformer
2000:5A
Voltage
Transformer
11kV / 110V
Voltage
Transformer
11kV / 110V
Voltage
Transformer
11kV / 110V
Pha
se a
Phase c
Phase b
G = Generator
L = Load
-
Pole Pole Pole
#1 #2 #3
IntelliRupter
(Normally-closed)
Figure 1: Factory acceptance test set-up

C I R E D 22nd International Conference on Electricity Distribution Stockholm, 10-13 June 2013
Paper 0619
CIRED2013 Session 3 Paper No 0619
The generation source and transformer configuration were
varied to provide a range of different X/R ratios (13.3 –
30.0). With the fault in-feed source applied to the network,
the IntelliRupter performed a controlled switching operation
to connect and disconnect a 20Ω inductance across phases a
and b for two ¼ cycles (5ms).
For each test configuration, the PM7000 was used to
monitor the voltage and current waveforms, using voltage
transformer (VT) and current transformer (CT) sensors to
detect the system disturbances introduced by the
IntelliRupter operation. In this way, the fault level
monitoring system was used to predict the fault level of the
test network. In order to validate the accuracy of the fault
level monitoring system predictions, a three-phase fault was
applied to the network for each test configuration and the
predictions were directly compared to the measured fault
level.
TESTING RESULTS
Fault level prediction
A selection of test results are summarised in Table 1. The
greatest difference between measured and predicted fault
levels was 4.5%. This result occurred for the 90ms RMS
fault level prediction, when the test network was configured
with an X/R ratio of 30 and 200A load was connected to the
system. Across a range of test conditions, the average
percentage difference for both 10ms peak and 90ms RMS
fault level predictions was 2.7%.
Power quality effects
In order to ensure that the fault level monitoring system
complies with power quality standards for voltage
fluctuations (ER P28) [16] and harmonic distortion (ER
G5/4-1) [17], the waveforms were observed and analysed.
As given in Table 1, the greatest voltage step change was
2.76% for the system conditions with a measured 10ms peak
fault level of 31.34kA without the 200A load connected. ER
P28 prescribes a general limit of 3% on the allowable
magnitude of voltage changes. The average percentage
voltage deviation was 1.84% for the test cases considered.
As given in Figure 2, the change in total harmonic distortion
(THD) varies between 2.2% and 4.7% for the a-b and c-b
phases of the network, respectively.
DISCUSSION
The integration of the PM7000 Fault Level Monitor and
IntelliRupter within 11kV networks represents a novel step,
which provides the total fault current contribution, without
necessarily needing the exact detail of the elements which
contribute to this total. The equipment overcomes the
drawbacks associated with other passive and active devices.
X/R Ratio Switching Operation Maximum Voltage Minimum Voltage Voltage fluctuation
(No Unit) (No Unit)Peak @
10ms (kA)
RMS @
90ms (kA)
Peak @
10ms (kA)
RMS @
90ms (kA)
Peak @
10ms (kA)
RMS @
90ms
(kA)
(kV) (kV) (%)
30With 200A load
connected13.83 5.10 13.37 4.87 3.33% 4.46% 6.417 6.353 1.00%
30Without 200A load
connected13.83 5.10 13.50 5.24 2.37% -2.70% 6.447 6.384 0.98%
13.3With 200A load
connected12.88 5.09 13.27 4.95 -2.99% 2.79% 6.289 6.193 1.53%
13.3Without 200A load
connected12.88 5.09 13.38 5.03 -3.88% 1.32% 6.453 6.298 2.40%
23With 200A load
connected31.34 13.10 30.40 13.50 3.01% -3.38% 6.298 6.150 2.35%
23Without 200A load
connected31.34 13.10 31.02 12.87 1.01% 1.74% 6.451 6.273 2.76%
Measured Fault Current Predicted Fault Current % Difference
Table 1: Fault level prediction results and voltage fluctuation readings
20:33:23.05419/07/12
20:33:23.38019/07/12
23.15 23.20 23.25 23.30Time 326 millisecs (ss)
-10.000
0.000
10.000
Vo
ltag
e (
kV
)
2.0
4.0
Valu
e (
%)
Maximum Minimum Average% THD of Vab 4.7 0.4 1.1% THD of Vcb 2.2 0.5 0.8Input Vab (V1) (Waveform) 15.787 -15.764 -0.026Input Vcb (V3) (Waveform) 15.777 -15.756 0.132
Figure 2: Total harmonic distortion of the wave form

C I R E D 22nd International Conference on Electricity Distribution Stockholm, 10-13 June 2013
Paper 0619
CIRED2013 Session 3 Paper No 0619
High precision VTs and CTs allow the PM7000 to monitor
voltage and current waveforms with a high degree of
accuracy. The fully supported PM7000 hardware platform
provides powerful processing capability, allowing the three-
phase fault contribution to be monitored. The IntelliRupter
provides the PM7000 Fault Level Monitor with controlled,
non-customer-affecting, disturbances that overcome the sole
reliance on naturally occurring system disturbances. For the
worst case voltage fluctuation and assuming background
flicker levels to be 50% of the network limit (typical of the
real network environment), the acceptable repetition rate of
controlled disturbances is 360 seconds. The THD values
presented in Figure 2 are instantaneous values. When
considered over a ten-minute period (as prescribed in G5/4-
1) the averaged effect on THD would be negligible.
CONCLUSION
The laboratory tests have demonstrated that the
IntelliRupter and PM7000 devices can be successfully
combined and used to provide a fault level prediction within
4.5% of the measured fault level for the test cases
considered. Using control functionality of the IntelliRupter
to provide a disturbance, there is the possibility of
predicting the fault level in real-time without causing any
customer disturbance.
Since there is limited capability, at present, to monitor fault
levels in 11kV electricity networks, and the maximum
acceptable measurement error is considered to be ± 5% of
the actual fault level value, the results are considered to be
highly encouraging.
The next steps in the project are to characterise the network
and to use a novel integration process to monitor fault levels
in an 11kV urban substation in the UK. This will form the
technical basis of commercial contracts that will allow
distribution system fault levels to be managed in real-time
through switching operations and the connection /
disconnection of additional generation.
ACKNOWLEDGMENTS
The authors would like to thank the following for their help
during the fault level monitoring system tests: Supporting
staff at Western Power Distribution; Martin Snell and David
Hawkins at Parsons Brinckerhoff; Chris Bevan, Jim
Niemira, Terry Bellei and the staff at the S&C Advanced
Technology Center, Chicago, Illinois, USA.
REFERENCES
[1] A. Collinson, F. Dai, A. Beddoes and J. Crabtree,
2003, Solutions for the connection and operation of
distributed generation, Crown, London, UK.
[2] Ofgem, 2012, Low Carbon Networks Fund
Governance Document (Version 5), Ofgem, London,
UK.
[3] Western Power Distribution, 2012, Implementation of
an active fault level management scheme (First Tier
Pro-forma), Ofgem, London, UK.
[4] G. E. Williamson, N. Jenkins, G. C. Cornfield, 1996,
“Use of naturally occurring system disturbances to
estimate the fault current contribution of induction
motors”, IEE Proc.-Gener. Transm. Distrib. Vol 143,
No. 3, 243 – 248.
[5] Department of Energy and Climate Change, 2011,
Carbon Plan: Delivering our low carbon future,
Crown, London, UK.
[6] KEMA Ltd, 2005, The contribution to distribution
network fault levels from the connection of distributed
generation, Crown, London, UK.
[7] Energy Networks Association, 1992, Engineering
Recommendation G74: Procedure to meet the
requirements on IEC 909 for the calculation of short
circuit currents, ENA, London, UK.
[8] G. C. Cornfield, 1993, "Estimating system fault level
from naturally occurring disturbances ", Proceedings
IEE Colloquium on Instrumentation in the Electrical
Supply Industry, 13/1 – 13/4
[9] International Electrotechnical Commission, 2000, IEC
TR 60909-4: Examples for the calculation of short
circuit currents, IEC, Geneva, Switzerland.
[10] S. Conner and A. J. Cruden, 2012, "Development of
an Algorithm utilising a Digital Signal Controller to
accurately determine in near “Real-Time” the Fault
Level in DG", Proceedings 47th
International
Universities' Power Engineering Conference.
[11] K. O. H. Pedersen, A. H. Nielsen and N. K. Poulsen,
2003, “Short-circuit impedance measurement”, IEE
Proc.-Gener. Transm. Distrib, vol. 150, no.2, 169-
174.
[12] S. Yang and F. Yang, 2009, "Algorithm Development
for Electricity Supply Fault Level Monitor Applied in
Distribution Generation", Proceedings International
Conference on Electrical Engineering, 1-6.
[13] Scottish Power, 2011, IFI Report 2010/11, Scottish
Power, Glasgow, Scotland.
[14] E. S. Ibrahim, 2004, "Experimental Measurements of
Fault Level For Sceco West, Kingdom of Saudi
Arabia”, JKAU: Eng. Sci, vol.15, no.1, 83-102.
[15] EPRI, 2010, Patent Application 20100085065:
Passive Agent System Impedance Monitoring Station
and Method, US Patent and Trademark Office.
[16] Energy Networks Association, 1989, Engineering
Recommendation P28: Planning limits for voltage
fluctuations, ENA, London, UK.
[17] Energy Networks Association, 2005, Engineering
Recommendation G5/4-1: Planning levels for
harmonic voltage distortion and the connection of
non-linear equipment to transmission systems and
distribution network in the UK, ENA, London, UK.

IMPLEMENTATION OF AN ACTIVE FAULT LEVEL MANAGEMENT SCHEME CLOSEDOWN REPORT
Appendix B.2 – CIRED POSTER
CIRED 2013 poster session – Paper 0619 – session 3
IMPLEMENTATION OF AN ACTIVE FAULT LEVEL MONITORING SYSTEM FOR DISTRIBUTED GENERATION INTEGRATION
Paper Number 0619
Project Overview • This poster describes the practical implementation of an active fault level monitoring system to facilitate the integration of distributed generation within 11kV distribution networks.
• Results from the laboratory tests showed that the fault level was consistently predicted to be within 4.5% of measured three-phase faults applied to the system.
• Based on the laboratory tests the fault level monitoring system will be taken forwards to 11kV network field trials from December 2013 onwards.
IntelliRupter
Voltage and Current TransformersPM7000s
Inductors
G
PM7000
Current
Probe
PM7000
Current
Probe
PM7000
Current
Probe
20Ω
110V to
PM7000
110V to
PM7000
110V to
PM7000
L
L
L
Making
Switch
MS1
CB1
3-phase
breaker
Current
Transformer
2000:5A
Load
Switch
S2
Load
Switch
S2
Load
Switch
S2
CB2
Laboratory
3-phase
breaker11kV 50Hz
200
Ampere
3-phase
Load
Transformer
Current
Transformer
2000:5A
Current
Transformer
2000:5A
Voltage
Transformer
11kV / 110V
Voltage
Transformer
11kV / 110V
Voltage
Transformer
11kV / 110V
Pha
se a
Phase c
Phase b
G = Generator
L = Load
-
Pole Pole Pole
#1 #2 #3
IntelliRupter
(Normally-closed)
X/R Ratio Switching Operation Maximum Voltage Minimum Voltage Voltage fluctuation
(No Unit) (No Unit)Peak @
10ms (kA)
RMS @
90ms (kA)
Peak @
10ms (kA)
RMS @
90ms (kA)
Peak @
10ms (kA)
RMS @
90ms
(kA)
(kV) (kV) (%)
30With 200A load
connected13.83 5.10 13.37 4.87 3.33% 4.46% 6.417 6.353 1.00%
30Without 200A load
connected13.83 5.10 13.50 5.24 2.37% -2.70% 6.447 6.384 0.98%
13.3With 200A load
connected12.88 5.09 13.27 4.95 -2.99% 2.79% 6.289 6.193 1.53%
13.3Without 200A load
connected12.88 5.09 13.38 5.03 -3.88% 1.32% 6.453 6.298 2.40%
23With 200A load
connected31.34 13.10 30.40 13.50 3.01% -3.38% 6.298 6.150 2.35%
23Without 200A load
connected31.34 13.10 31.02 12.87 1.01% 1.74% 6.451 6.273 2.76%
Measured Fault Current Predicted Fault Current % Difference
Jonathan Berry Western Power Distribution, UK
Samuel Jupe Parsons Brinckerhoff, UK
Mike Meisinger S&C Electric Europe Ltd, UK
John Outram Outram Research Limited, UK

IMPLEMENTATION OF AN ACTIVE FAULT LEVEL MANAGEMENT SCHEME CLOSEDOWN REPORT
Appendix C – NETWORK SINGLE LINE DIAGRAM


IMPLEMENTATION OF AN ACTIVE FAULT LEVEL MANAGEMENT SCHEME CLOSEDOWN REPORT
Appendix D – RESISTOR RATING PLATE

200
200
10 190
10
190
NOTE : Shorting Bar in circuit when supplied
Enclosure IP rating : IP 54 Anti condensation heater (s) voltage and wattage : 240 Vac / 100 WInterior lighting voltage : 240 Vac / 50 HzApparatus Mass M: 850 kg
Interphase resistance values at 20°C (with shorting bar removed) :
Interphase resistance values at 20°C (with shorting bar in circuit) :
Rated voltage Ur : 12 kVRated short-time withstand current Ik : 25 kARated peak withstand current Ip: 62.5 kARated duration of short circuit tk : 1 secondLightning impulse withstand voltage, BIL Up : 95 kVp Short duration power frequency withstand voltage Ud : 28 kV (rms)Maximum rated insertion current : 600A ( 12 kV / 20 )Normal operation maximum duration : 10 msecMaximum insertion frequency : 5 minsMaximum rated duration (single operation, system failure condition) : 1 secNominal temperature rise following 1 second insertion : 165 C. Typical thermal time constant : 5700 secondsTemperature coefficient of resistance : - 0.11 % / C Temperature Rise
Tel. +44 (0) 191 489 7771 http
Manufacturer's name : HVR International LtdSerial number : 13KX37Date of manufacture : 16/09/2013HVR Drawing Reference : AA / 1205
HVR INTERNATIONAL
A - B = 20 Ohms ± 2.5 %B - C = 30 Ohms ± 2.5 %C - A = 50 Ohms ± 2.5 %
A - B = 40 Ohms ± 2.5 %B - C = 50 Ohms ± 2.5 %C - A = 50 Ohms ± 2.5 %
RATING PLATE :
MATERIAL : STAINLESS STEEL - 1.2mm THICK
://www.hvrint.com
HOLE (x4)5mm CLEAR
200
200
10 190
10
190
HVR INTERNATIONAL LTDBede Industrial EstateJarrowTyne & WearNE32 3EN
DRAWN BY : CHECKED BY :DATE:
16/07/14DIMENSIONSIN mm SHEET 3 OF 5John Orr Martin Williams
SCALE:1:6
WESTERN POWER DISTRIBUTION
RATING PLATE
SK / 2275
10
10
200 10
10
150
CIRCUIT PLATE :
HOLES (X4)M6 CLEAR
INTER
PHA
SE R
ESISTAN
CE VA
LUES* :
* with shorting bar in circuit.
A - B
= 20 Ohm
sB
- C = 30 O
hms
C - A
= 50 Ohm
s
* with shorting bar rem
oved.
A - B
= 40 Ohm
s B
- C = 50 O
hms
C - A
= 50 Ohm
s
SHORTING BAR(REMOVABLE)
30 20 20
12 kV / 50Hz3 PHASE
240 V / 50HzMAINS SUPPLY
N L
2A MCB1A MCB
HIGH VOLTAGE
LOW VOLTAGE
LIGHTSW
ITCH
BC A
FLUORESCENTTUBE
3 x 100 WAnti-CondensationHeaters
MATERIAL :STAINLESS STEEL - 1.2mm THICK
10
10
200 10
10
150
SHEET 4 O
F 5
Bede Industrial Estate
JarrowTyne &
Wear
NE32 3EN
Tel : +44 (0) 191 489 7771Fax : +44 (0) 191 483 9501
Website : http://w
ww
.hvrint.com
E-mail : applications@
hvrint.com
DR
AW
N
CH
ECK
EDD
ATE
ISSUE
THR
EED
IMEN
SION
SIN
mm
SK / 2275
WESTER
N PO
WER
DISTR
IBU
TION
John Orr
CIR
CU
IT PLATE
Martin W
illiams
16/07/14
SCALE:1:10

IMPLEMENTATION OF AN ACTIVE FAULT LEVEL MANAGEMENT SCHEME CLOSEDOWN REPORT
Appendix E – SYSTEM ARCHITECTURE DIAGRAM


IMPLEMENTATION OF AN ACTIVE FAULT LEVEL MANAGEMENT SCHEME CLOSEDOWN REPORT
Appendix F – SITE DESIGN
Notes
1E
nvoy-M
ountedon
wallbetw
eenentrance
dooranddoorinto
11kVsw
itchroom.
2P
M7000
FLM-Placed
insideC
B3
AFLMS
switchgearpanel.See
Draw
ingBS
26-272-001forw
iringschem
aticand
details
3P
M7000
Circulating
Current-Placed
onfloorinside
GT2A
metering
panel.
4Fibre
Optic
Cable
-Xm
mØ
holeto
bedrilled
throughfloorbelow
Envoy
forfibreoptic
cableto
accessbasem
ent.Frombasem
entcablew
illfollowroute
of11kVpow
ercableto
IntelliRupter.
5U
SB/C
at5data
cable-C
ableto
followexisting
cablew
aysthrough
switchgearpanels
andthen
followexisting
mutlicore
routesto
multicore
riser.Cable
tothen
runthrough
newplastic
conduitfromm
ulticoreriserto
Envoy
USB
/Cat5
cablehybrid
FibreO
pticcable

3500
1215
1125 1150
875
1580
1220
CABLE TRENCH
EX
IST
ING
CO
NC
RE
TE
FO
UN
DA
TIO
N
SA
W C
UT
AN
D B
RE
AK
OU
T E
XIS
TIN
G C
ON
CR
ET
E F
OU
ND
AT
ION
BR
EA
K O
UT
DIM
EN
SIO
NS
: 875
mm
(L) X
11
50
mm
(W)
DE
PT
H T
O M
AT
CH
AD
JA
CE
NT
CA
BLE
TR
EN
CH
CU
T O
UT
TO
BE
BA
CK
FIL
LE
D W
ITH
SA
ND
AN
D
CO
VE
RE
D W
ITH
3m
m M
ILD
ST
EE
L C
HE
CK
ER
PLA
TE
RE
SIN
FIX
ED
INT
O T
HE
CO
NC
RE
TE
FO
UN
DA
TIO
N
WIT
H 4
No. M
8 F
IXIN
GS
(MIN
IMU
M E
MB
ED
ME
NT
80m
m)
SA
W C
UT
AN
D B
RE
AK
OU
T E
XIS
TIN
G C
ON
CR
ET
E F
OU
ND
AT
ION
BR
EA
K O
UT
DIM
EN
SIO
NS
: 121
5m
m(L
) X 1
12
5m
m(W
)
DE
PT
H T
O M
AT
CH
AD
JA
CE
NT
CA
BLE
TR
EN
CH
CU
T O
UT
TO
BE
BA
CK
FIL
LE
D W
ITH
SA
ND
AN
D
CO
VE
RE
D W
ITH
3m
m M
ILD
ST
EE
L C
HE
CK
ER
PLA
TE
RE
SIN
FIX
ED
INT
O T
HE
CO
NC
RE
TE
FO
UN
DA
TIO
N
WIT
H 4
No. M
8 F
IXIN
GS
(MIN
IMU
M E
MB
ED
ME
NT
80m
m)
4N
o. A
NC
HO
R B
OL
TS
M16
HIT
V R
OD
GR
AD
E 8
.8
RE
SIN
FIX
ED
WIT
H H
ILT
I HIT
HY
200R
MIN
IMU
M E
MB
ED
ME
NT
- 125m
m
MIN
IMU
M P
RO
JE
CT
ION
- 40m
m
563561
898
747
658657
INT
EL
LIR
UP
TE
R
PU
LS
EC
LO
SE
R
EA
RT
HIN
G R
ES
IST
OR

IMPLEMENTATION OF AN ACTIVE FAULT LEVEL MANAGEMENT SCHEME CLOSEDOWN REPORT
Appendix G – AFLM ACCESS SIGNAGE

Active
Fault Le
vel
Mo
nito
r
Re
stricted
Acce
ss to
this are
a
Acce
ss on
ly wh
en
FLM 1
1kV
C
ircuit B
reake
r is op
en
, isolate
d
and
close
d to
earth

FLM Compound Access Key
IMPORTANT Access to the fenced area
containing the Active Fault Level Monitor is restricted.
Prior to gaining access the FLM 11kV Circuit Breaker
must be Open, Isolated and Closed to Earth.
