implementation of an optimized virtual traffic light
TRANSCRIPT

International Journal of
Advances in Scientific Research and Engineering (ijasre)
E-ISSN : 2454-8006
DOI: 10.31695/IJASRE.2019.33559
Volume 5, Issue 10
October - 2019
www.ijasre.net Page 171
Licensed Under Creative Commons Attribution CC BY-NC
Implementation of an Optimized Virtual Traffic Light
Algorithm in SUMO
Tin Maung Wynn1, Than Than Yu
2 and May Zin Oo
3
Research Scholar 1-2
and Professor3
Department of Computer Engineering and Information Technology
Mandalay Technological University
Patheingyi, Mandalay
Myanmar
______________________________________________________________________________________
Abstract In the future, when all the vehicles will be smart vehicles (SVs) and the Intelligent Transportation System (ITS) become mature,
the virtual traffic lights system will be more cost-effective than physical traffic lights system. The Virtual Traffic Light (VTL) is a
self-organizing traffic control system without requiring road infrastructures. However, the major weakness of the existing VTL
algorithm allows only one vehicle crossing the intersection at a time and considers only the straight forward direction of vehicles.
This paper implements an optimized VTL algorithm (O-VTL) for road intersections on the Simulation of Urban Mobility (SUMO)
that allows more vehicles to cross the intersection without collision and considers various directions of vehicles. For performance
evaluation, the travel time, CO2 emission, and fuel consumption of vehicles applying O-VTL are compared to that of the existing
VTL algorithm and physical traffic light system in SUMO. According to the comparison result, the average travel time and fuel
consumption of vehicles applying the O-VTL algorithm significantly decrease when compared to the existing VTL algorithm and
physical traffic lights.
Key Words: SUMO, Smart Vehicle (SV), Virtual Traffic Light (VTL), Travel Time, CO2 Emission, Fuel Consumption.
______________________________________________________________________________________________
1. INTRODUCTION
Nowadays, traffic management is major relevant subject in the context of Intelligent Transportation System (ITS). An important
issue with regard to traffic management is to control intersection efficiently [1]. Car-to-Car (C2C) or Vehicle-to-Vehicle (V2V)
communication in Vehicular Ad-hoc NETwork(VANET) is very important for efficient traffic management.
Traffic lights currently control only a limited number of intersections, and increasing the number of traffic lights is clearly
infeasible due to the high cost of deployment and maintenance [2]. To overcome this challenge, the first distributed VTL
algorithm for VANETs has been described in [3], where simulation results showed up to 60% increase in the average flow rate in
the reference city of Porto. The adopted algorithm is based on the definition of cluster of vehicles, cluster head, and VTL leader.
The vehicles on the same road form a cluster and the one which is nearest to the intersection is the cluster head. The cluster head
that is farther from the intersection is then elected as the VTL leader and is responsible for determining the priorities of vehicles
and broadcasting the virtual traffic light messages. Once the VTL leader leaves the intersection, a new VTL leader is elected.
The same algorithm has been in many subsequent studies. The distributed VTL algorithms introduced in [2, 4] exchange
information between Smart Vehicles (SVs) using both broadcast messages for signaling and unicast messages for precedence
definition and traffic light decisions. The algorithm has been implemented and tested through low cost IEEE (Institute of
Electrical and Electronics Engineers) 802.11p devices, using open source software. But, the distributed VTL algorithms in [2] and
[4] are designed with the assumption that they are not able to infer the future movements of each SV and only one SV can cross
the intersection at a time, even though there will be no possibility of collision between SVs. For example, two SVs approaching
the intersection from opposite directions with the intent to go straight would not need to stop at the intersection.

International Journal of Advances in Scientific Research and Engineering (ijasre), Vol 5 (10), October-2019
www.ijasre.net Page 172
DOI: 10.31695/IJASRE.2019.33559
Although some VTL algorithms were introduced for VANETs, they allow only one vehicle to cross the junction at a time. While a
vehicle from one road segment is crossing the junction, the vehicles from the other three road segments cannot cross the junction.
Moreover, the VTL algorithms consider only straightforward directions of vehicles.
In this paper, an optimized VTL algorithm (O-VTL) for road intersection is proposed. The proposed O-VTL algorithm enables
more than one vehicle crossing the intersection simultaneously without collision. The algorithm was implemented and tested in
SUMO. To evaluate the performance of the proposed O-VTL algorithm, the travel time, CO2 emission and fuel consumption of
vehicles are compared to that of the existing VTL algorithm and traffic light system in SUMO. The rest of this paper is organized
as follows. The proposed O-VTL algorithm is mentioned in detail in Section 2. In Section 3, the implementation of O-VTL
algorithm is described and the simulation result is shown in Section 4. Finally, the conclusion is drawn in Section 5.
2. THE OPTIMIZED VIRTUAL TRAFFIC LIGHT ALGORITHM
The O-VTL algorithm is based on the first coming, the first crossing principle for the initial coordination.
2.1 Assumptions of Original VTL algorithm The VTL algorithm knows the position of each vehicle from the SUMO’s built-in localization system. By using this information,
the VTL algorithm gets the updated positions of vehicles and is able to calculate the priority to cross the intersection.
The VTL algorithm is based on the following key concepts:
Each smart vehicle (SV) is assigned a priority in order to cross the intersection. The priority is calculated based on the
distance between SV and the intersection.
For each road segment, the SV that is closest to the intersection is denoted as leader and the others as followers. One of the
leaders is elected as the intersection leader and it has the priority to cross the intersection.
If the vehicles are driving in opposite directions or the same road segment with the intersection leader, these vehicles can
cross the intersection simultaneously.
If the vehicles with priorities to cross the intersection have passed the junction, the priority is granted to the vehicles from
another road segment.
The example of the virtual traffic light is shown in Figure 1, in which the intersection leader, leaders and follower can be
seen.
Figure 1. Virtual traffic light example scenario
2.2 Working Procedure of the proposed VTL Algorithm
In order to implement the proposed VTL algorithm in real world, each smart vehicle must be equipped with a global navigation
satellite system such as Global Positioning System (GPS) and short range wireless communication system based on IEEE 802.11p
technology. Each SV knows its own position using GPS and broadcasts to neighbour vehicles via short range wireless
communication system.
The proposed VTL algorithm starts when the vehicles enter the VTL area. In this study, the VTL area’s threshold value is denoted
as eighty meters (VTL area’s diameter of 160 meters) from the junction because the packet loss rate using IEEE 802.11p remains
lower at distances up to 200 meters when SVs communicate each other. For longer distances, packet loss rate increases. The
algorithm executes the following steps.
Step 1) Update the positions of vehicles and calculate the distance from the vehicles to the junction.
Leader
Intersection
Leader
Follower
Leader
Leader

International Journal of Advances in Scientific Research and Engineering (ijasre), Vol 5 (10), October-2019
www.ijasre.net Page 173
DOI: 10.31695/IJASRE.2019.33559
Step 2) If the vehicle’s distance to the junction is less than eighty meter, set the vehicle’s VTL as Orange (Orange VTL)
and move to Step 3. Otherwise, return to Step 1.
Step 3) Separate the vehicles based on road segment ID. (There can be at most four vehicles group for a junction.)
Step 4) Sort vehicles on each road segment (N-North, S-South, W-West and E-East) according to their distance from the
junction. Assign the vehicle that is closest to the junction as the leader and the others as followers.
Step 5) Define two priority zones NS (vehicles from N and S road segments) and WE (vehicles from W and E road
segments).
Step 6) Get leader from each road segment and form a leaders set.
Step 7) Sort the vehicles from the leaders set based on their distance from the junction. Set the first vehicle from the sorted
leaders set as the intersection leader. (If all the leaders are equal distances from the junction, the intersection leader
is elected based on road segments.)
Step 8) If a vehicle is intersection leader, set the vehicle’s VTL as Green (Green VTL) and move to Step 10. Otherwise,
move to Step 9.
Step 9) Set the vehicle’s VTL as Red (Red VTL) and slow down the vehicle.
Step 10) If the intersection leader is in NS zone, set the vehicles’ VTLs in NS as Green (Green VTLs) and define VTL
priority as ‘ns‟, then move to Step 14. Otherwise, move to Step 11.
Step 11) Set the vehicles’ VTLs in WE as Green (Green VTLs) and define VTL priority as ‘we‟. Move to Step 14.
Step 12) If the VTL priority is ‘ns’ and there is no vehicle in NS zone, set the vehicles’ VTLs in WE as Green (Green VTLs)
and move to Step 14. Otherwise, move to Step 13.
Step 13) If there is no vehicle in WE zone, set the vehicles’ VTLs in NS as Green (Green VTLs) and move to Step 14.
Step 14) Calculate the priorities of the two vehicles attempting to cross the junction from the opposite directions. (The
working procedure to calculate the priority is described in the following).
In order to calculate the priorities, the two conditions, non-collision condition and possible collision condition of two opposite
vehicles (SV1 and SV2) are defined as shown in Figure 2 and Figure 3.
Figure 2. Non-collision condition of two opposite vehicles
Figure 3. Possible collision condition of two opposite vehicles
Calculation of the priorities of the two vehicles attempting to cross the junction from the opposite directions includes the
following steps.
Step 1) Get the two vehicles’ signals for directions (Straight, Turn-Left, Turn-Right).
Step 2) If the two vehicles are in the non-collision condition, they can cross the junction simultaneously. Otherwise, move
to Step 3.
Step 3) Calculate the distance of the two vehicles to the junction.
Step 4) If one vehicle whose distance to junction is lower than the other, move to Step 5. Otherwise, move to Step 6.

International Journal of Advances in Scientific Research and Engineering (ijasre), Vol 5 (10), October-2019
www.ijasre.net Page 174
DOI: 10.31695/IJASRE.2019.33559
Step 5) Give the priority to the nearest vehicle to the junction and the other vehicle needs to slow down until the
prioritized vehicle passes the junction.
Step 6) If the two vehicles are in the same distance to junction and in one of the possible collision conditions, follow the
right-of-way rules.
3. IMPLEMENTATION
The proposed VTL algorithm was developed using Matlab, SUMO traffic simulator and Traffic Control Interface for Matlab
(TraCI4Matlab).
To implement the proposed VTL algorithm in SUMO, the scenario road network file is created using NETEDIT (NETwork
EDITor) application. In this simulation, a road network with a junction that contains four road segments is created. Then, the route
file is created to add vehicles and to define their routes. In this scenario, the proposed VTL algorithm is tested with twelve smart
vehicles with their respective directions as in Figure 4, and the proposed VTL is represented with vehicle’s colour as shown in
Figure 5.
Figure 4. Simulation of the proposed VTL with 12 SVs
Figure 5. Definition of vehicle’s colour in the proposed VTL
When the simulation starts, the vehicle’s colour is set to blue. When a vehicle enters the VTL area, the vehicle’s colour is changed
from blue to orange (Orange VTL), and then green (Green VTL) or red (Red VTL).
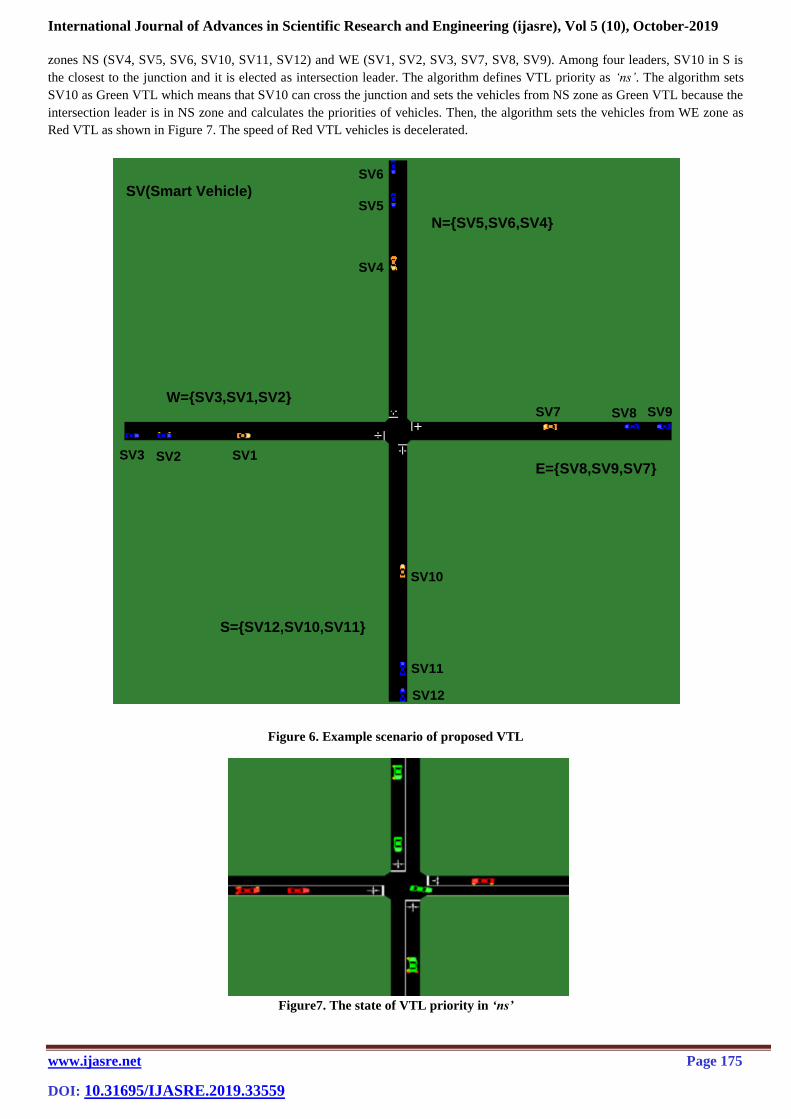
In Figure 6, twelve SVs are approaching the junction from four different road segments (N, S, W and E). SV1, SV4, SV7 and
SV10 are leaders of four different road segments and the other eight vehicles will be followers when they enter the VTL area.
Then the SVs are sorted on each road segment according to their distance to the junction and the algorithm defines two priority
International Journal of Advances in Scientific Research and Engineering (ijasre), Vol 5 (10), October-2019
www.ijasre.net Page 175
DOI: 10.31695/IJASRE.2019.33559
zones NS (SV4, SV5, SV6, SV10, SV11, SV12) and WE (SV1, SV2, SV3, SV7, SV8, SV9). Among four leaders, SV10 in S is
the closest to the junction and it is elected as intersection leader. The algorithm defines VTL priority as „ns‟. The algorithm sets
SV10 as Green VTL which means that SV10 can cross the junction and sets the vehicles from NS zone as Green VTL because the
intersection leader is in NS zone and calculates the priorities of vehicles. Then, the algorithm sets the vehicles from WE zone as
Red VTL as shown in Figure 7. The speed of Red VTL vehicles is decelerated.
Figure 6. Example scenario of proposed VTL
Figure7. The state of VTL priority in ‘ns’
SV(Smart Vehicle)
SV1 SV3 SV2
SV7
SV6
SV5
SV4
SV8 SV9
SV10
SV11
SV12
N={SV5,SV6,SV4}
S={SV12,SV10,SV11}
W={SV3,SV1,SV2}
E={SV8,SV9,SV7}

International Journal of Advances in Scientific Research and Engineering (ijasre), Vol 5 (10), October-2019
www.ijasre.net Page 176
DOI: 10.31695/IJASRE.2019.33559
If the VTL priority is ‘ns’ and there is no vehicle in NS zone, the algorithm sets the vehicles from WE zone as Green VTL as
shown in Figure 8, defines VTL priority as „we‟ and calculates the priorities of vehicles.
Figure 8 The state of VTL priority in ‘we’
4. RESULTS AND DISCUSSIONS
To evaluate the proposed VTL algorithm compared with the existing VTL algorithm and the physical traffic light system in
SUMO, the existing VTL algorithm and another simulation with twelve vehicles using SUMO’s traffic lights (TLS) is
implemented and tested as shown in Figure 11. The default green phase length of 33 seconds is used in TLS in SUMO.
Figure 9 Traffic light system in SUMO with twelve SVs
In order to compare the proposed VTL algorithm with existing VTL algorithm and physical traffic light system in SUMO, the
travel time, CO2 emission, and fuel consumption of each vehicle is obtained from the simulations. Travel time is the time taken for
a vehicle to travel from a starting place to a target place. The starting and target places of vehicles are predefined for the
simulation.
When the travel time of each vehicle and their average travel time were examined, all vehicles (except SV6) using proposed VTL
are shorter than existing VTL algorithm and physical traffic light system as shown in Figure 10. However, the travel time of each
Real Traffic Light
System at Junction

International Journal of Advances in Scientific Research and Engineering (ijasre), Vol 5 (10), October-2019
www.ijasre.net Page 177
DOI: 10.31695/IJASRE.2019.33559
vehicle is significantly lower apart from SV4, SV6, SV7, and SV8. On average, the travel time of all vehicles using proposed VTL
algorithm is 26.92 seconds, 35.5 seconds in existing VTL algorithm and 40 seconds in physical traffic light system. Thus, the
proposed VTL algorithm decreases travel time almost 28% when compared to existing VTL algorithm and 39% when compared
to physical traffic light system in SUMO as shown in Figure 13. The proposed VTL algorithm saves time, in relation to existing
VTL algorithm and real traffic light system due to the effectiveness of the algorithm and reduces time wasting at the junction.
Figure 10. Travel time of all vehicles
Figure 11. CO2 emissions of all vehicles
The CO2 emissions of all vehicles applying existing VTL algorithm, traffic light system in SUMO and the proposed VTL
algorithm are shown in Figure 11. The fuel consumption of all vehicles is shown in Figure 12. According to the simulation results,
when the average CO2 emissions and fuel consumption are examined, the average CO2emissions and fuel consumption of
proposed VTL algorithm do not significantly differ from the average of the existing VTL algorithm. However, the proposed VTL
algorithm reduces 7% of CO2 emissions and fuel consumption than traffic light system in SUMO as shown in Figure 13.
CO
2 e
mis
sio
n in
mill
igra
m(m
g)
Vehicle

International Journal of Advances in Scientific Research and Engineering (ijasre), Vol 5 (10), October-2019
www.ijasre.net Page 178
DOI: 10.31695/IJASRE.2019.33559
Figure 12. Fuel consumption of all vehicles
There is no risk yet in the current simulations although the proposed VTL considers not only the vehicles’ straight forward
directions but also turn left and turn right directions. One of the most significant findings is that the proposed VTL algorithm
enables more vehicles to cross the intersection at the same time without collisions.
Figure 13. Performance improvement of proposed VTL algorithm
5. CONCLUSIONS
Fu
el con
su
mp
tio
n in
mill
ilite
r(m
l)
Vehicle

International Journal of Advances in Scientific Research and Engineering (ijasre), Vol 5 (10), October-2019
www.ijasre.net Page 179
DOI: 10.31695/IJASRE.2019.33559
In this study, a VTL algorithm for road intersection was presented. The algorithm is intended for intersections where the
deployment of real traffic lights is not cost-effective. In order to implement the proposed VTL algorithm in real world, each smart
vehicle must be equipped with a global navigation satellite system such as Global Positioning System (GPS) and short range
wireless communication system based on IEEE 802.11p technology. The proposed VTL algorithm allows more than one vehicle
to cross the intersection at the same time without collision by considering various vehicles’ directions. The average travel time,
CO2 emission, and fuel consumption using proposed VTL algorithm were compared to that of existing VTL algorithm and
physical traffic light system in SUMO. The algorithm’s effectiveness was validated through the implementation of physical traffic
light system and virtual traffic light system in SUMO. The simulation results also proved the system’s efficiency.
ACKNOWLEDGMENT
The authors would like to thank to all Teaching Faculties from Department of Computer Engineering and Information
Technology, Mandalay Technological University.
REFERENCES
1. Chen, L., Englund, C.: ‘Cooperative intersection management: a survey’,IEEE Trans. Intell. Transp. Syst., 2015, PP,
(99), pp. 1–17.
2. A. Bazzi, A. Zanella, and B. M. Masini, “A distributed virtual traffic light algorithm exploiting short range V2V
communications,”Ad Hoc Networks, vol. 49, p. 42–57, 2016.
3. M. Ferreira, R. Fernandes, H. Conceição, W. Viriyasitavat, O.K. Tonguz, “Self- organized traffic control,”7th ACM
International Workshop on Vehicular InterNETworking, in: VANET ’10, ACM, New York, NY, USA, 2010, p. 85–90.
4. A .Bazzi, A .Zanella, B. Masini, G. Pasolini, “A distributed algorithm for virtual traffic lights with IEEE
802.11p,”Networks and Communications (EuCNC), 2014 European Conference on, 2014, p. 1–5.