implementation of discovery projects in statistics of discovery projects in statistics brad bailey...
TRANSCRIPT
Journal of Statistics Education, Volume 21, Number 3 (2013)
1
Implementation of Discovery Projects in Statistics Brad Bailey Dianna J. Spence Robb Sinn University of North Georgia Journal of Statistics Education Volume 21, Number 3 (2013), www.amstat.org/publications/jse/v21n3/bailey.pdf Copyright © 2013 by Brad Bailey, Dianna J. Spence, and Robb Sinn all rights reserved. This text may be freely shared among individuals, but it may not be republished in any medium without express written consent from the authors and advance notification of the editor. Key Words: Student-centered; Experiential learning; t-test; Linear regression; Research into practice Abstract Researchers and statistics educators consistently suggest that students will learn statistics more effectively by conducting projects through which they actively engage in a broad spectrum of tasks integral to statistical inquiry, in the authentic context of a real-world application. In keeping with these findings, we share an implementation of discovery projects for students in elementary statistics classes. We delineate the purpose and scope of two types of projects— one covering linear regression analysis and the other covering comparisons with basic t-tests (matched pairs or two independent samples). We describe a set of curriculum materials developed to help instructors facilitate such projects and share access to these materials. We give examples of how the curriculum materials guide each stage of project implementation. We detail the requirements and student activities during each phase of the student-directed projects: Students select their own research topic, define their own variables, and devise and carry out their own data collection plan before analyzing and interpreting their data. Students then articulate their results, both in a written report and in a brief formal presentation delivered to the class. We give examples of specific projects that students have conducted. Finally, we discuss the potential benefits of such projects, including possible factors mediating those benefits. 1. Introduction We describe two types of discovery-based student projects designed for use in non-calculus introductory undergraduate statistics courses for non-majors of mathematics or statistics. We

Journal of Statistics Education, Volume 21, Number 3 (2013)
2
focus primarily on the specific details of implementing these projects and on the curriculum materials developed to assist instructors in facilitating them. 1.1 Rationale Before we proceed, we pause to discuss the rationale for using these projects. First, statistics educators have long suggested implementing teaching methods with a focus on the scientific method and incorporating authentic statistical experiences (Bryce 2005). Researchers found that students’ attitudes toward statistics were improved in courses that included constructivist elements and that personal relevance enhanced student learning (Mvududu 2003). In particular, students are found to benefit more substantially from analyzing data they have collected themselves, rather than data provided to them (Hogg 1991). Indeed, many researchers suggest that statistics education should be student-centered (e.g., Roseth, Garfield and Ben-Zvi 2008). Despite these trends in the literature, research indicates that instructors often choose not to incorporate fully student-centered projects involving the types of authentic inquiry described above into statistics classes (Landrum and Smith 2007). This finding is consistent with our observations of statistics instructors from a variety of institutions with whom we have worked. When surveying both workshop participants and potential pilot instructors for curriculum materials, we have asked statistics instructors about their experience using projects as part of their instruction. Almost half indicated they do not use projects of any kind, citing such reasons as tight schedules, limited resources, lack of experience, and lack of confidence in their ability to manage the details of a student project effectively. Of the remaining instructors who professed to use projects, the majority of these described extended assignments that were not fully student-centered, in that the instructor (rather than the student) provided one or more of the following: the research topic, the variables, the data collection plan, or the data set itself. The evident dearth of true student-centered projects prompted a curriculum development effort that was supported by two National Science Foundation grants. These grants funded the creation of materials to aid instructors in facilitating these projects and students in carrying them out. These grants also sponsored the development of instruments and their use in subsequent research to measure the effects of using these projects on three outcomes of interest: student content knowledge, students’ perceptions of the usefulness of statistics, and students’ self-beliefs in their ability to use and interpret statistics. It should be acknowledged that there is a substantial body of literature on the use of projects in statistics courses; however, none of that literature appears comparable to the current report. Specifically, the findings published to date are situated in different settings, and/or they do not speak to the main focal points addressed in this paper, which include the specific student-centered facets of the projects we describe, a thorough description of the project phases and implementation details, and an overview of the materials developed to facilitate such projects. For example, Love (2000) details a method of assessing statistical analysis projects for students completing an MBA program. The graduate setting, the specific context of business school, and the article’s focus on assessment and collaborative team learning are all distinct from the context and focus of the present paper. Likewise, Yesilcay (2000) describes projects that are not part of an introductory level course for non-mathematics/statistics majors; rather, the projects are for
Journal of Statistics Education, Volume 21, Number 3 (2013)
3
statistics majors typically within three semesters of graduation and comprise a two-semester endeavor for which the student earns nine credit hours. Further, the students select their research topic from a list of project topics provided by the institution. Similarly, although Carnell (2008) analyzed the effect of student-designed projects on attitudes toward statistics, the report focused neither on the details of project implementation nor on content knowledge outcomes. Fillebrown (1994) describes the implementation of semester-long projects for an introductory statistics course, but the course curriculum described does not appear to cover inferential statistics. The projects described are unclear as to the extent of analysis conducted: Although comparisons are cited in some project descriptions, the curriculum described includes only descriptive statistics and linear regression. Moreover, Fillebrown’s only measure of project success was students’ self-reported claims that the projects helped them learn statistics. By contrast, one of the projects described in the present paper deals with hypothesis testing using t-tests, and the impact of the projects has been measured with objective quantitative instruments. 1.2 Scope and Context We first describe the scope and setting of the courses in which these projects are implemented. We then describe the scope and context of the projects themselves. 1.2.1 Scope and Setting of Courses The course in which these projects were initially implemented is titled “Elementary Statistics” and is a non-calculus statistics courses taught at the undergraduate level for non-majors of mathematics or statistics. It is listed as a 2000 level course, implying a class for second year undergraduate students, with the only prerequisite being 3 credit hours of any college level mathematics (excluding remedial courses). The core content of the course includes descriptive statistics, basic statistical summaries, and graphs; elementary probability; normal distributions; sampling and sampling strategies; sampling distributions and the Central Limit Theorem; two-way tables and conditional distributions; correlation and linear regression; confidence intervals; and hypothesis testing with z-tests for population mean, t-tests (one sample, matched pairs and two independent samples), and χ2 test for independence. Even within our department, other topics covered in this course vary by instructor. For instance, some instructors cover ANOVA, whereas others do not; some instructors place more emphasis than do others on Type I and Type II Error, power of a test, effect size, and similar topics; and so on. The order in which topics are covered also varies by instructor; some instructors cover statistical inference very early in the course, whereas others introduce inference close to the end. Further, teaching strategies vary greatly among instructors; for instance, some instructors rely more heavily on a simulation-based pedagogical approach. Our institution is a public comprehensive university with a history as a small liberal arts college; our campus currently has approximately 6000 undergraduate students. However, after the projects and supporting materials were developed in our department, they were shared and pilot tested in similar courses at other institutions, both locally and nationally. These institutions include public and private universities, colleges, and 2-year colleges of varying size, as well as some high schools offering Advanced Placement (AP) statistics courses. Although the course
Journal of Statistics Education, Volume 21, Number 3 (2013)
4
topics in these settings do overlap substantially with our original course, the scope of their elementary statistics courses is likely to have some differences from ours. 1.2.2 Scope and Context of Projects The projects were initially developed to help students both to become acquainted with the process and to understand the meaning of two types of statistical analysis in particular: linear regression and comparison of means using t-tests. The projects are assigned one at a time, in an order appropriate to the order of topics addressed in the course. It is important to note that the projects were intended to be the primary vehicle through which these topics were taught, rather than a mechanism to synthesize the topics after they had already been covered. As such, it was not deemed appropriate to make the students responsible for selecting the type of analysis needed for a given project. Rather, to introduce and explore a given type of analysis (e.g., linear regression) in the course, the project became the journey through which the details of that type of analysis were addressed. As the projects were adopted by other instructors, this intent was not always fully retained: Some instructors still preferred to teach (and even practice) the content first, and then assign the project(s) as a culminating experience. Although the intended benefit of the projects was shifted for these instructors, it was not necessarily lost. However, if such a project is a culmination or application of content already taught, it would certainly be appropriate to make the student responsible for identifying what type of analysis should be used to investigate a particular research question. Finally, to explain what these student projects are, we often find it helpful to contrast them with other types of assignments by stating what these projects are NOT. The students are not given a ready-made or canned data set to analyze; the students are not provided with surveys to distribute or a fixed data source to mine; and the students are not made to choose from an instructor-provided list of projects. The students choose their own research questions, identify the variables needed to address their research question, gather the necessary data, organize and analyze these data, and summarize the results in both a written report and an in-class presentation. By giving the students the latitude to select their own research topic and the responsibility for collecting the data, we aim to increase their interest in the research itself and thereby promote their intrinsic motivation while providing a context for more meaningful learning. 2. Curriculum Materials As we describe how the projects are implemented, we refer to resources that may help to facilitate each phase of the project. These resources are shared in the curriculum materials that we have developed; these include the Instructor Guide, Student Guide, Technology Guide, and several supporting appendices, all of which are freely available on our website at:
http://faculty.ung.edu/DJSpence/NSF/materials.html We encourage the reader to access the materials on the website as they read this paper.
Journal of Statistics Education, Volume 21, Number 3 (2013)
5
The Instructor Guide supplies a detailed explanation of the phases of each project, with suggestions designed to make each phase manageable and productive. Also provided are an overview of student and instructor roles and tasks, a selection of different project timelines, a discussion of common issues encountered when facilitating projects, and a more extensive rationale for conducting these kinds of projects. The supporting appendices for instructors contain project assignment handouts and planning forms, a variety of scoring rubrics that may be used to evaluate student projects, and sample forms for permissions and/or Institutional Review Board (IRB) approval if needed. For instructors who don’t feel they can support the more open-ended discovery that fully student-defined projects can entail, Appendix E also offers a selection of guided projects, in which the project topic and design are defined, but the student is still responsible for collecting, organizing, and analyzing the data. The Student Guide describes the tasks students need to complete when carrying out each project. Several sections are dedicated to guiding the student through key processes fundamental to getting the project started, such as articulating appropriate research questions, defining variables, creating constructs, identifying the target population, etc. Additional sections outline steps and/or options for collecting, organizing, analyzing, and reporting data. Supporting appendices provide such resources as reliable Internet sites; samples of projects carried out by other students; and a collection of variables, constructs, and surveys, which can be used as-is, or can be models for students who wish to craft their own research constructs. Finally, the Technology Guide gives step-by-step instructions, supported with screen shots, to perform both t-tests and linear regression using two basic forms of technology: the TI-83/84 family of calculators and Microsoft Excel. Many instructors allow students to use other technologies, and some instructors (both at our institution and elsewhere) spend some portion of class time teaching a more robust statistical package such as R, SAS, or SPSS. However, the guide was developed to address the most universally available and widely used technologies in lower level statistics classes for non-majors of mathematics or statistics. 3. The Projects We discuss both types of projects, linear regression and comparison of means using t-tests. Throughout this paper, we describe linear regression first, but this choice of order may be viewed as arbitrary. The projects can be assigned in either order, and should be assigned according to the order that the corresponding material is covered in the course. The projects are assigned as team endeavors; students most typically work in groups of 2 or 3, though some instructors will occasionally allow individuals to work alone or groups of 4 students to work together. We begin with a broad overview of the type of analysis required for each project. The linear regression project requires students to construct a scatter plot, compute the correlation coefficient, determine the linear regression equation, compute the coefficient of determination, and interpret each of these. Depending on the course curriculum and on when the project is conducted, students may also be required to determine the significance of the correlation. For the comparison project, students perform a t-test and may choose between a matched pairs and a 2 independent samples design. In some cases, individual students have been allowed to conduct a project using a 1-sample t-test if a reasonable research question warrants such a test.

Journal of Statistics Education, Volume 21, Number 3 (2013)
6
On occasion, groups wish to compare more than 2 groups; if the instructor is prepared to support this kind of project, the students are directed to proceed with an ANOVA analysis, which they must follow up with post-hoc t-tests in the event the result of the ANOVA is significant. For each project, the phases, as documented in the Instructor Guide, include project planning, data collection, analysis, and reporting. Each of these phases is discussed in detail below. 3.1 Planning During the planning phase, student teams are formed and each group determines what research question they will attempt to answer and how they will gather the data. This phase entails brainstorming a topic, identifying variables appropriate to the type of project assigned, articulating a research question about those variables, and determining where and how data of interest can be collected. This phase is the most daunting for many students, and a large portion of the Student Guide is devoted to helping them think productively about this process. For instance, one of the early sections of the Student Guide is titled “Translating Informal Ideas into Formal Research Plans.” For each project type, this section gives an example of how a research idea can be sufficiently refined, including how variables, population, and data sources can be identified as part of the project plan. The ultimate goal of the planning phase is for each group to produce a written plan describing the details of their intended project. The instructor may require the students to author a formal proposal or to complete a supplied project plan form. In either case students must describe their proposed project, including at a minimum their research question, definition of variables, data collection plan, expected results (e.g., positive or negative correlation), and relevant details of the planned analysis (e.g., matched pairs or independent samples design). Instructor’s Appendix T-1 contains handouts with instructions for a formal project proposal, as well as multiple versions of less formal project plan forms, ranging from brief to detailed. One key component that students must address in their proposal is a specific plan for collecting data. Often the research question a group decides to pursue will be closely tied to the data collection method they choose to use. When the projects are introduced, students are provided with three data collection methods (as discussed in the next section). Appendix E of the Student Guide also gives several examples of previously completed student projects, much like those examples found in this article. These examples are meant to help students brainstorm, but not to prescribe a project they should undertake. In fact, to encourage students not to replicate one of the example projects, instructors may use one of the scoring rubrics provided in Appendix T-3 that offers points for “originality,” comprising 5% of the grade on the final project report. We find that most students are sufficiently motivated by this to strive for a new and innovative topic. Students can also easily check with the instructor as to whether a project idea is considered “original,” which may be subjective and dependent on the instructor. To launch the planning phase of these projects, instructors are advised to give students 15-20 minutes at the end of a class to form teams and brainstorm about project ideas. The instructor then circulates and talks to each group about the research questions they are interested in pursuing. One way that instructors can help students during this brainstorming session is to ask
Journal of Statistics Education, Volume 21, Number 3 (2013)
7
questions that focus the students’ attention on practical, concrete aspects of their envisioned project, such as how their variables of interest should be defined or where data for their project could be obtained. On occasion, the research question proposed by a group might be vague or inappropriate. Rather than simply tell students not to pursue that question, the instructor can offer guidance on how to refine or improve the question. An example of the process described above, starting with the brainstorming session, is as follows. One team listed as possible topics of interest the subjects of autism, Down’s Syndrome, and similar conditions. The team members originally were interested in the occurrence of such conditions but were unclear as to how they might research these topics. The instructor pointed out that the occurrence of the condition itself can be thought of as a single variable; he then posed the question: what did the students want to know about such occurrences? He pointed out that another variable would be needed, and suggested trends over time as a possible option. The team was then able to articulate that one variable would be the year, and the other could be the number of new diagnoses of a particular condition in that year. Before students proceed with data collection and analysis, the instructor must approve the proposed project. The approval of the projects is often iterative; that is, students may need to revise their proposals based on suggestions from the instructor. In particular, students may need help articulating their research question or their hypothesis. They may even have chosen the wrong types of variables for the analysis called for in the assigned project. Students often need advice about how they will gather their data or about the specificity of their variables. The “Project Planning” section of the Instructor Guide provides a list of considerations for the instructor to keep in mind when helping students to define their projects. Once the students have a clear idea of what they are going to research and how they will obtain meaningful data, with the approval of their instructor, they may begin the data collection phase. 3.2 Data Collection There is interdependency between the data collection methods and techniques the students use and the research question they address. Students are given three methods for collecting the data they analyze: writing and administering surveys; recording data gathered through physical measurement and direct observation; and finding reliable data on the Internet. Each method is discussed in detail in the section titled “Where to Find Data” in the Student Guide. 3.2.1 Surveys If students choose to collect their data by distributing surveys, then their task includes constructing the survey and determining the means by which participants will be selected to complete the survey. Several resources are available in the Student Guide and supporting appendices to assist the students in writing their surveys. First, because some variables are best measured with a collection of questions that are combined to form a single numeric value, the notion of a “construct” is discussed in the Student Guide section on selecting variables. Appendix B contains many examples of variables, individual survey questions, and multi-question constructs. Appendix C contains several validated surveys that are public domain or are accessible online. Both appendices were compiled with the assistance of an interdisciplinary
Journal of Statistics Education, Volume 21, Number 3 (2013)
8
team of faculty representing such fields as Psychology, Sociology, Political Science, Criminal Justice, Nursing, Physical Therapy, Education, and Business. These faculty provided suggestions on authentic research topics in their respective disciplines, including variables of current interest and accepted instruments and practices for measuring those variables. The students are allowed to use any of the provided surveys, constructs or questions either in part or in their entirety. They may also use these items as templates for creating their own constructs and/or surveys. Indeed, this is often how the guide is used when students have selected a research topic that is not addressed in these appendices. For example, finding no constructs or surveys about a person’s level of acceptance of tattoos, one group used the constructs they did find as examples and wrote their own five-question construct to measure acceptance of tattoos. Because the projects are intended to give students great latitude to pick their own topic and write their own surveys, there is the danger that students may not be able to write a survey that is worded clearly enough and is sufficiently well-constructed to get meaningful results. Another potential pitfall is that students may write surveys that are overly invasive or offensive to the respondents. This is another area in which instructors need to provide support and guidance to students, taking care to discuss how survey items should be worded and what types of variables are likely to yield interesting results. The section titled “Writing Good Survey Questions” in the Student Guide is a valuable resource for this purpose. It is important to note that getting the survey approved by the instructor is part of the project planning phase. If a question is poorly worded or simply inappropriate, the instructor can require the students to remove it or reword it before distributing the survey; we discuss this issue further in section 4.4. If a project team intends to distribute a survey, they may also need to complete an Institutional Review Board (IRB) form or other permission form, depending on the requirements of the institution. We discuss this issue more fully in section 4.6. If they choose to distribute a survey without obtaining the appropriate approvals, then it will impact their grade. 3.2.2 Observation & Measurements Students may count, measure, or record a variety of phenomena to collect data for their projects. Several student groups have gathered information on prices, weight, and volumes of products in local grocery and department stores. One group of students ventured into the local national forest and measured the base circumferences of two species of trees for a two-sample t-test project. Another student team recorded behavior of pedestrians using cell phones by timing the number of seconds in an arbitrary 1-minute period that a pedestrian was looking directly at the screen of his or her phone. Some of the variables provided in Appendix B of the Student Guide were provided by physical therapy or nursing specialists; many of these constructs entail procedures for measuring and/or timing various types of flexibility, balance, stamina, and so on. If a project involves measurements or observations of people, there is potential for a valuable discussion about the pros and cons of different data collection strategies. For example, participants might be more willing to fill out a brief anonymous survey than to allow the researcher to weigh them or take the time to have their height measured. On the other hand, self-reported data might be less accurate, particularly for sensitive data. For information that
Journal of Statistics Education, Volume 21, Number 3 (2013)
9
participants can readily provide and have little reason to misrepresent (e.g., shoe size), students are likely to opt for a survey; for other types of information (e.g., number of seconds a person can balance on the ball of one foot), students must make the measurement themselves. When students are taking physical measurements, their project has the potential to be an experiment, in which they manipulate some parameter and take measurements under varying conditions. If the experiment involves human participants, the project may require approval by the Institutional Review Board (IRB) or equivalent body, depending on the school. At our university, such a study would be subject to a higher level of scrutiny by the IRB than would a purely survey-based non-experimental study. Because of this policy, the review cycle for such a proposal would exceed the allotted time that students have to complete the project. Therefore, very few projects reflect a truly experimental design, since students are most frequently interested in studying other people. However, such potential projects do provide teachable moments during the student brainstorming process, also creating good opportunities for rich classroom discussion as instructors cover general project ideas and potential constraints. In fact, one enterprising student who worked as a waitress initially proposed to record the percentage of the tips her customers left when she was wearing one of two different blouses. However, the student ultimately did not conduct this blind experiment as a formal project. (We say blind because her customers would have been unaware that their behavior was being studied or recorded.) 3.2.3 Internet Data When introducing these projects to students, instructors can show them a variety of Internet data sources. Appendix A of the Student Guide gives several examples of sites in each of four broad categories: government and community records, restaurant nutrition information, sports data, and consumer/retail information. The websites include official sites of several government agencies such as the Census Bureau and Department of Justice; nutritional catalogs for menus of several fast food and “sit-down” restaurants; sports statistics gateways and official league sites such as the NFL; and retail and consumer information sites such as Kelly Blue Book and J. D. Power consumer ratings. The list of sites is thorough, but not exhaustive; the examples can serve to give students a notion of what types of information are available via the Internet. Students are encouraged to locate Internet sites with information that interests them, whether or not they are represented in the list provided. Students have used different but similar websites to find individual statistics of professional athletes, government records, and so on. For the sake of obtaining reliable data, students are instructed to use reputable sites. As noted in the Student Guide in the section titled “Using Internet Data,” sites that are considered reputable include government sites, official sites that are affiliated with a sport (e.g., Major League Baseball), official sites representing a corporation (e.g., Wendy’s), and so on. Although it may seem that students who acquire data on the Internet have an easier task than those who use a survey or make physical measurements, it is probably more accurate to say these students encounter a different set of challenges unique to obtaining Internet data. Often, when students expect to find a particular set of data on one or more sites, they find that the specific information they are looking for is not as easy to locate as they expect. Students must sometimes
Journal of Statistics Education, Volume 21, Number 3 (2013)
10
contend with sites where, even though the data are available, they are not presented together or in summary form, thereby requiring the student to navigate multiple pages repeatedly— one set of pages for each individual in their sample. Students also frequently report encountering partial data sets, missing data, or inconsistent or mismatched data when they use different sites to locate values for multiple variables. For example, one student who studied the correlation between NBA players’ salaries and their points per game located these two variables on different websites. The student found some discrepancies in the list of players provided for a given season between the site listing players by salary and the site listing players by points per game, in spite of the fact that both sites indicated the full roster was represented. A similar issue is that of students discovering sites with data that is similar but not comparable when they wish to compare two populations. One student hoping to compare players of two non-professional sports teams found that although each team maintained a website with data on each of its players, each site focused on a different set of data for its players, so that a variable of interest might be available for one team, but not for the other. This limitation imposed unexpected constraints on what the student was able to compare. Finally, one of the most significant conceptual issues that students confront when pulling data from the Internet is that in many cases, the data set they find represents not a sample, but an entire population, which threatens to undermine the intended focus on inference as part of the assignment. Students must describe and distinguish between their population and their sample as part of this assignment. Therefore, they must address this issue, perhaps in a way that challenges their thinking more than would another type of project. The issue of distinguishing sample from population with Internet data is discussed in more detail in section 4.2. 3.3 Analysis The analyses stipulated by these projects can easily be done in Microsoft Excel or on a TI-83/84 series calculator; although students are allowed to use other technologies, the vast majority on our campus use these. As noted previously, the Technology Guide describes how to use these tools to complete the necessary parts of the project. The degree to which students need this guide likely depends on how much time the instructor spends demonstrating these technologies, providing opportunities for hands-on practice, and assisting students with them. It is likely that many students (on our campus and elsewhere) do not need this guide, though some students report that it’s comforting to know the resource is there, even if they seldom refer to it. As previously noted in section 1.2.2, the projects were designed to be the primary vehicle through which students were introduced to the components entailed in a given type of analysis. Therefore, the most fundamental analysis requirements are explicitly spelled out in the “Project Report Outline” section in the Student Guide. There is one such section for each project. Instructors are encouraged to customize project requirements to suit their own learning objectives. It should also be noted that although a checklist of requirements is provided, it merely details what the students are expected to report. The guide does not tell them how to organize their data to accomplish these tasks. Similarly, if the project is a more of a culminating assignment than an exploratory one, instructors may choose to be less prescriptive when giving the assignment, in which case part of the grade would be determined by the student’s thoroughness and acuity in selecting appropriate components to include in their analysis and report. Another way that some instructors have combined open-ended and prescriptive

Journal of Statistics Education, Volume 21, Number 3 (2013)
11
approaches is to itemize bare minimum requirements, but then add a category on the scoring rubric for additional analyses appropriate to the data set. One instructor called this scoring category “the extra mile.” Descriptive analyses are required for both projects. These include appropriate descriptive statistics and graphs, such as histograms and box plots, for each variable and each sample. For the linear regression project, the basic requirements are to create a scatter plot, compute the correlation coefficient r, calculate and graph the least squares regression line, and calculate r2, the coefficient of determination. In the formal project report, the team is required not only to show these items, but also to interpret and discuss them. Some instructors also require students to determine if the correlation coefficient for their sample is significant, depending on whether hypothesis testing and statistical significance have been covered when the linear regression project is carried out. Additional analyses not prescribed, but sometimes conducted by students when applicable, include splitting the analysis by a dichotomous categorical variable, exploring other non-linear regression models, and running regression analyses for multiple pairs of variables to compare strength of different associations. For the t-test comparison project, the basic requirements include identifying the appropriate t-test design (e.g., matched pairs, independent samples); identifying suitable null and alternative hypotheses; running the specified t-test correctly; and interpreting the results of the test. Instructors may impose additional requirements, such as considering Type I and Type II Errors and their ramifications and corresponding selection in advance of an appropriate significance level; exploring power of the test and determining a resulting recommended sample size; and addressing factors related to the assumptions for the test, such as randomness and normality, including how such factors can be checked, or to what extent they may be violated and how the outcome should be interpreted as a result. 3.4 Reporting Finally, the team prepares a written report of the project, in which they explain their research question and variables, data collection process, analysis, and findings. Instructors often also require the team to give an in-class presentation covering the same content, although if the instructor assigns both projects (linear regression and t-test comparison) during a semester, a presentation may only be required for one of the projects, in the interest of conserving class time. Students typically use Microsoft Word and PowerPoint for their written reports and in-class presentations. Although these software packages are not required, students are familiar with them and, if they are also using Excel, they find the ease of importing charts and tables from Excel particularly seamless. This is a consideration because the project reports and presentations are both expected to include relevant graphs, such as histograms for individual variables and scatter plots for the linear regression project. Nevertheless, an instructor could allow or encourage students to use any technology to report their results. On occasion, students composed their reports in other word processors and have used Adobe Acrobat or Prezi for their presentations.
Journal of Statistics Education, Volume 21, Number 3 (2013)
12
The Student Guide contains a separate “Project Report Outline” section for each of the two project types, though there is a fair amount of overlap in the two outlines. In a typical project assignment, the information below is required for both the written report and the presentation.
• Statement of the research question o Definition of the populations and variables of interest o For regression projects, a description of the expected association o For t-test projects, a statement of null and alternative hypotheses o Rationale: an explanation of why the variables may be associated, or why a mean
difference is expected • Explanation of data collection method
o For Internet data sources, websites should be named and URL identified o For surveys, a copy of the survey should be shown o For physical measurement/observations, the precise procedure for measuring,
observing, and recording should be explained o Description of sampling strategy and process
The issue of randomness should be addressed Where a truly random sample is not possible, an explanation should be
given of how the team endeavored to obtain a representative sample • Summary statistics for the sample data • Appropriate charts
o Histograms and/or box plots o Scatter plots (for regression)
• Summary of analysis, giving all pertinent statistics o Regression equation, correlation coefficient o t- and p-values for t-test projects
• Conclusion, stated in context, using the findings from the analysis • Discussion
o Practical implications of findings o Limitations of the project o Insights gained from the analysis
Some of the more detailed scoring rubrics in Appendix T-3 of the Instructors Guide include each required component of the project report. 4. Issues and Details of Implementation Instructors who facilitate projects of this nature will almost certainly encounter a variety of issues that can be challenging. In fact, some instructors cite these kinds of issues as the reason they don’t care to assign these types of projects. Our contention is that the benefits of the projects outweigh the pitfalls, especially if those pitfalls are anticipated and addressed. Hence, many such challenges and implementation details are addressed in the Instructor’s Guide. The most vital of these issues are described below.

Journal of Statistics Education, Volume 21, Number 3 (2013)
13
4.1 Randomness Students are instructed to obtain, at the very least, appropriate representative samples for their projects. In many cases, a random sample is feasible; in such cases, students are expected to devise and carry out a random sampling strategy. However, in some cases, students do not have the resources to conduct a truly random sample (for instance, in projects which rely on surveys). When truly random samples are not feasible, the students should acknowledge this limitation and address the extent to which their sample represents the population they claim to be studying. When students use surveys to gather data, in their report and presentation they should explain how they found their sample. For example, some groups find students to take their surveys by standing near an egress from a popular building on campus (e.g. library, dining hall) and employ a 1-in-k sampling strategy. Conscientious teams repeat this process in several different areas of campus, at varying times of the day. Other teams have distributed surveys in the dormitories after having randomly selected what dorm rooms they will visit. Of course, the latter is only a sample of residential students; this is acceptable when either a) the population they are studying is specifically residential students; or b) another sampling strategy is used to sample the commuter students. The distinction between various forms of sampling and the limitations associated with different sampling strategies are addressed in the course of implementing the projects. A portion of the project grade depends upon how appropriately the students’ sample was generated. An explanation of how the sample was obtained is a requirement in both the written report and the in-class presentation. This requirement is evident in the detailed scoring rubrics supplied in Appendix T-3 of the Instructor’s Guide. Nevertheless, if there is one aspect of these projects where instructors will likely need to allow their students great latitude, it is in the area of whether their sample is truly random. Because this is an introductory statistics course, the salient issue is that students understand that performing inferential statistical analysis requires a sample that is random. As long as students convince their instructor that they understand these issues and that they took reasonable measures to procure as random a sample as possible, the instructor may reasonably choose to award all or the majority of the points for this component of the project. 4.2 Populations vs. Samples When students find data over the Internet, often they are able to find data for an entire population (such as all pitchers in the National League). The project specifications dictate that the students frame their work as a sample from some population, and it is advisable for instructors to enforce this requirement. Some students choose to randomly select a sample from the population data available to them; others re-define the population from which they claim to be sampling, either by broadening their search and selecting randomly from a larger pool, and/or by interpreting their data set as a sample from all similar individuals from the past, present, and even a hypothetical future. For instance, in the case of the National League pitchers, some students devise and carry out a random selection process from the list of all currently active pitchers to obtain their sample. Other students expand their search to include all NL pitchers on record for a
Journal of Statistics Education, Volume 21, Number 3 (2013)
14
greater defined period of time (e.g., a given decade), then sample randomly from that larger group. Still others sample from all NL pitchers on record to represent all “possible” NL pitchers. Although abundant data are available regarding athletes, students may encounter a more restrictive scenario when dealing with restaurant menus. The population of all items served at a given restaurant is often relatively small. Students may deal with this restriction in a couple of ways. Some redefine their population to include a variety of similar restaurants (such as Ruby Tuesday’s, Chili’s, TGI Fridays, and so on), thereby providing a larger pool from which to select a true random sample. Others consider the current menu at a given restaurant to be a sample of all the entrees that the restaurant might hypothetically have. This latter strategy, while not ideal, allows more flexibility for students who wish to compare some nutritional aspect between two specific restaurants, and therefore cannot combine menus from multiple restaurants for their inquiry. Especially in this case, it is important that the project team effectively demonstrate their understanding of the distinction between their sample and the population when reporting their results. 4.3 Matching the Type of Analysis to the Data For each project, the type of analysis is stipulated in advance, and students are responsible for selecting a question that can be addressed appropriately with that analysis. Therefore, students do not encounter the issue of choosing the wrong type of analysis, but rather of proposing to collect the wrong type of data for the form of analysis required by the project. For example, students will occasionally begin the planning phase of a linear regression project by proposing a categorical variable and a quantitative variable, such as gender and average driving speed. One way to show the students their mistake is to challenge them to show what a scatter plot of their data might look like. This can be a valuable exchange between instructor and students and a critical point of learning, as it forces the students to experience the cognitive dissonance needed to help them recognize why gender can’t be a primary research variable for a linear regression analysis. When conducting the t-test comparison project, students are sometimes not certain whether they should use a matched-pairs design or 2-sample design. Such issues typically arise before the students have collected their data, because those issues are detected during the proposal and approval process. In such cases, a useful approach is for the instructor to ask the students questions that highlight key aspects of the proposed data that lend themselves more to one design than the other. For instance, if a project team proposes to collect data about the same individual or object at two different times or locations (e.g., the same product at two different stores), then that aspect of the design should be a focal point of the discussion, since it implies that a matched-pairs design is warranted. Readers may find it troublesome that the type of analysis is prescribed in advance, and then students must choose a research question for which such analysis would be appropriate. This observation begs the question: Why not let the students identify a question and then go about determining what type of analysis is best suited to answer it? The answer is twofold. First, as noted in the discussion of project scope, at the point when these projects are introduced, students
Journal of Statistics Education, Volume 21, Number 3 (2013)
15
do not yet have the knowledge base to choose from an array of possible analysis techniques. Rather, these projects are intended to help establish that very knowledge base by introducing the students experientially to each kind of analysis. Second, the scope of the target introductory statistics course is not broad enough to equip the student with many options for statistical analysis; the course on our campus and on many others covers descriptive statistics, probability, linear regression, and hypothesis testing about population means using t-tests. Many other types of analysis are not addressed, thus limiting the array of options from which the student could reasonably select. Therefore, the student is instead tasked with selecting appropriate variables and research question for the analysis under consideration. This task is an important cognitive step in these projects: Consider that if students are unable to select appropriate research question and variables for a particular type of analysis, this would be tantamount to their being unable to select the appropriate type of analysis for a given research question and corresponding data set. Thus, we maintain that this aspect of the project does ultimately help lead the student to recognize what type of analysis should be applied in a given scenario. Preliminary data analysis seems to support this contention, as discussed in section 6. 4.4 Choosing a Research Question and Getting “Good” Data Frequently the research topic may actually be determined in part by what data the students find readily available. This is especially true when students use Internet sources to collect their data. They may go looking for data that would be appropriate for their research question and not find the exact data they need. Instead, they find data of a similar sort (e.g. data by state or county, when they sought data by city). They can slightly alter their research question so that the data they do have is appropriate. A reader may object on the grounds that this may not be considered appropriate research protocol for a professional. However, the primary goal of the project is for the student to learn how to perform and interpret these analyses. The students in question are in an introductory statistics course and therefore do not have access to the same resources as a professional, particularly given the short timeframe in which the students have to work-- these projects take only a few weeks. Another important consideration here is that the students get some experience overcoming the hurdles that researchers often face when starting a project. Even when students plan to use surveys or physical measurements/observations to collect their data, the questions they initially suggest for their surveys or the measurements they intend to make may not be appropriate for their research question. For instance, survey questions could suffer from any number of limitations and issues, which is addressed at some length in the “Writing Good Survey Questions” section of the Student Guide. Students need to be steered away from questions that are too coarse; too vague; too lengthy or convoluted; poorly worded or formatted; or leading the respondent, such as “Do you support the obviously flawed plan of…” When students have questions that are coarse or vague, the results will likely not be meaningful because the responses will depend greatly upon the interpretation of each respondent. Examples of such questions are:
“On average, how much sleep do you get each night?” “How stressed are you?” “How much do you drink?”
Journal of Statistics Education, Volume 21, Number 3 (2013)
16
Instructors may need to intervene and point out how nebulous such questions are and suggest that students rewrite some (or all) of their survey. Many sample variables and constructs available in the student appendices can be valuable as models. For example, since the above question about stress is not likely to reap good data, it could be replaced with the multi-question Perceived Stress Scale available online and described in Appendix C of the Student Guide. For questions such as those above about hours of sleep or alcohol consumption, the guide suggests “snapshot” questions that cover a particular time period, such as “How many hours of sleep did you get last night?” or “How many alcoholic beverages have you consumed in the last three days?” The snapshots eliminate the need for respondents to estimate a trend or average; the result is a more specific and more easily identified concrete value, likely resulting in better data. Authoring of survey questions appears to be an area where students often need direction, as well as occasional hands-on assistance. This is one reason that the survey should be part of the initial project proposal and should be revised as many times as needed before approval is granted. When helping students rewrite the question, instructors may find it useful to ask questions like “What is it you really want to know?” or “What are you trying to get at here?” When presented with such a question, students have been known to think for a minute and then produce a very succinct and clearly worded question. With the instructor’s help, they come to realize they should be using the question they just stated instead of the poor one on the survey. Often the main shortcoming of a survey question is its format. The quintessential example of a question with an inappropriate format is “Which religion are you? (Circle one.);” then the survey provides a short list of common faiths. This question would be more appropriate as an open-ended question, meaning that instead of a potentially incomplete list of options, the item should have a line for the respondents to write their religion. Closed-ended questions can be appropriate for surveys, and especially for demographic variables where all the options can be covered by a short list (e.g. gender; smoker vs. non-smoker; or resident vs. commuter). Even with some questions that should elicit a numerical response, it may be appropriate to provide a short list of options, especially if the data should be ordinal (and not interval) and there are both minimum and maximum possible values. An instructor must use his or her own judgment when helping students construct their survey questions. When students choose to use surveys, there are many good reasons to insist that the surveys be anonymous. One valuable point of discussion is that participants are more likely to give honest responses to questions, especially sensitive questions, if they know the data can’t be traced back to them. Anonymous surveys may also be viewed more favorably by the IRB. To help ensure that the surveys are anonymous, the instructor should ensure that there is no place on the survey that asks for the respondent’s name before approving the survey. Further, instructors may suggest to students that respondents be guided to deposit their completed surveys directly into a shoe box or a large manila envelope. 4.5 Forming Groups and Grading Many instructors find that allowing the students to form their own groups is advantageous. If the students form their own groups, and there is a problem with the group dynamic, then the students are less likely to blame the professor for “making” them work together. If an instructor wants to
Journal of Statistics Education, Volume 21, Number 3 (2013)
17
assign the groups, there are many resources available that can guide an instructor on how to form the groups in a way that groups people with similar work ethics and interests (e.g., Hagelgans, Fenton, Baker and Hemenway 2001). To encourage students to share the work of completing these projects equally, some instructors assign specific roles and/or tasks to each team member. Other instructors include an individual effort component for the grade; this component is frequently the only part of the grade that varies among the students within a group and it is often based upon a rating of the student by the other members of the group. Although multiple project phases have been discussed in detail, it is the written report and the in-class presentation that are actually graded. As noted previously, Appendix T-3 of the Instructor’s Guide contains several sample scoring rubrics for each project; some are for the project report, some are for the presentation, and some are for those two deliverables combined. A few of these rubrics are quite detailed and explicitly name each required component of the report, whereas others are more holistic in nature. Any of the rubrics could be adapted to suit an instructor’s requirements. The rubrics help to ensure consistent and objective grading, as well as to establish clear evaluation criteria when provided to students in advance. 4.6 Institutional Review Board Approval Research involving human subjects may require approval by the Institutional Review Board (IRB) at the home institution. In particular, any project that includes surveys is considered to involve human subjects. Requirements vary at different institutions regarding use of IRB/permission for informal student research (i.e., research that is conducted to satisfy course requirements and that will not be published). Some institutions may require students to obtain approval directly from the IRB. Others may have policies in place by which students can submit forms only to their instructor. In these cases, the instructor may or may not be required to submit the full set of IRB forms obtained from the class to the IRB. Appendix T-2 of the Instructor’s Guide provides sample IRB and permission forms. Instructors should seek their institution’s guidelines on this matter. If an instructor finds that the IRB procedures at the institution are prohibitive, then (s)he could assign a project using only Internet data sources and physical measurements and observations as methods of data collection. 5. Further Examples of Completed Projects In this section we give examples of projects that students have actually completed. These examples are listed here because of the breadth of data collection methods and the variety or originality of the projects. 5.1 Linear Regression 5.1.1 Projects Using Surveys To complete their linear regression project, one team used anonymous surveys to collect data needed to compute the participants’ Body Mass Index (BMI). They also administered the Eating Attitudes Survey (provided in Appendix C of the Student Guide). Then they used linear
Journal of Statistics Education, Volume 21, Number 3 (2013)
18
regression to examine the relationship between the Eating Attitudes score and BMI. Another team used scales provided in the curriculum materials to measure drinking behaviors and religious beliefs, and then used linear regression to examine the relationship between the two. Another group used a survey to ask single college students how many children lived in their houses when they were children and how many children they intend to have when they become parents. In addition, these students split the data by the gender of the respondent, thereby allowing them to run three separate regression analyses. 5.1.2 Projects Using Internet Data Several groups of students used nutritional information found on various restaurant web pages to determine if there is a relationship between the calories in a meal and the fat content, sugar content or sodium content of these same meals. Some groups have used linear regression to explore the relationship between these latter variables as well. Groups have used linear regression to examine the relationship between the average points-per-game of professional basketball players and those players’ salaries. Another team used regression to explore the relationship of NFL quarterbacks’ passer ratings with their scores on the Wonderlic test of cognitive ability. Another team looked up the engine horsepower and the average miles per gallon of several vehicles and used linear regression to illustrate the negative relationship between the two. 5.1.3 Projects Using Measurement and Observation One student group visited the office doors of randomly selected professors to record the number of credit hours the faculty member taught that semester and the number of office hours the same faculty member held each week (instructors at our institution are required to post office hours, and it is common to list courses taught as well). The team then analyzed the relationship between these two variables with linear regression. 5.2 Matched Pairs and Independent Samples t-Tests 5.2.1 Projects Using Surveys One team used an independent samples t-test to compare the perfectionist tendencies between men and women, using a perfectionism scale provided in the curriculum materials. Another team used a matched pairs t-test to compare levels of student satisfaction with two different online course environments commonly used at their school. Another student group used a set of Likert-type questions to write a “religious-ness” construct and compared the “religious-ness” of single people to those in committed relationships using a 2-sample t-test. As mentioned previously, one team designed a construct to measure a person’s level of acceptance of tattoos. These students used this construct to compare males’ and females’ attitudes using a two-sample design. 5.2.2 Projects Using Internet Data One group used the nutritional information they found in various restaurants to compare the amount of fat, calories and sodium in the meals that are designated healthy or light to those
Journal of Statistics Education, Volume 21, Number 3 (2013)
19
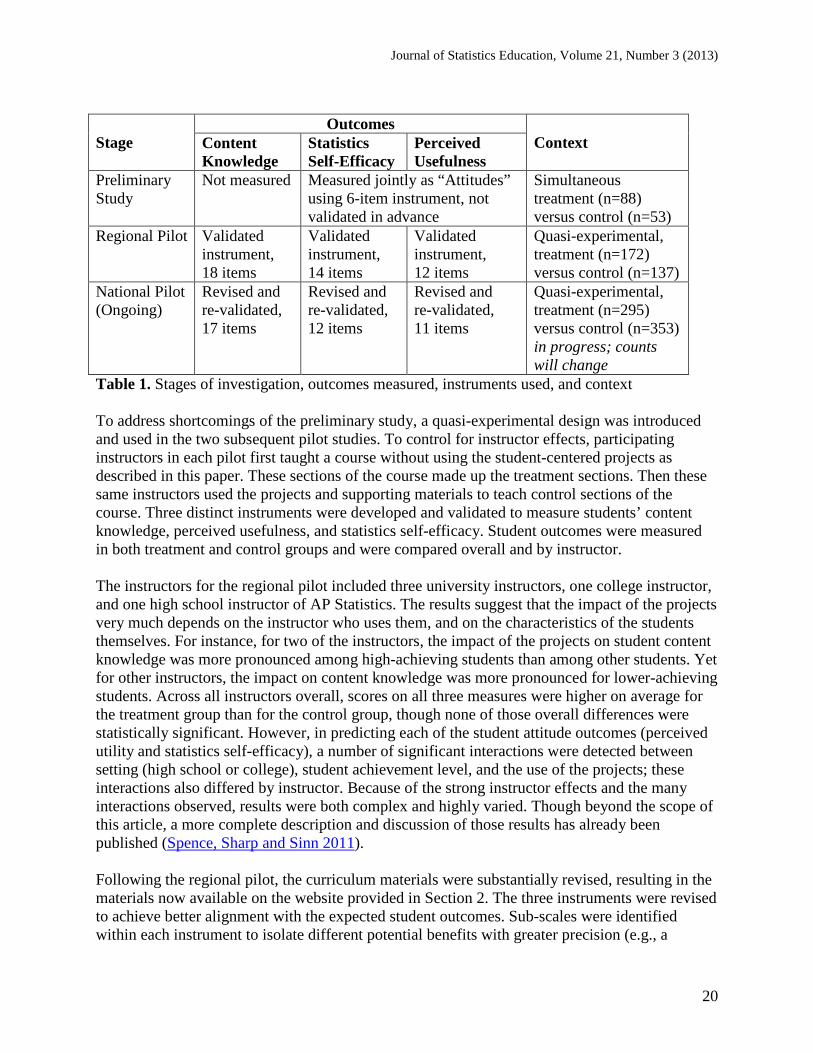
meals that do not have this designation. Other groups have used sports data available on the Internet to compare the salaries of professional athletes; some have compared players in different sports while others have compared athletes in different leagues in the same sport, or athletes who play different positions in the same sport. Another group visited www.ratemyprofessors.com, and gathered data to compare the ratings of math instructors and English instructors. 5.2.3 Projects Using Measurement and Observation More than one student group has collected data on price per unit of various products at two different stores. When they found the exact same products at both stores they performed a matched-pair t-test. When they only found similar products they performed the 2-samples t-test. Another student group measured the girth of two different breeds of trees in a state park and performed a 2-sample t-test. 6. Impact of Projects on Student Outcomes Although the primary intent of this paper is to share the available resources and to describe how these projects are implemented, we recognize that the reader may also be interested in what impact these projects may have on students of statistics. We briefly address this question below. Student outcomes have been measured, first in a preliminary study in our department, then in a regional pilot study, and finally in a nationwide pilot, which is still in progress. The student outcomes measured in all three settings were perceived usefulness of statistics and statistics self-efficacy, or the students’ self-beliefs in their ability to understand and use statistics. In the regional and national pilot, an instrument to measure content knowledge was added. Table 1 gives an overview of the three stages of the investigation, the outcomes that were measured, the instruments used to measure them, and the context of each investigation. The departmental preliminary inquiry was a very small proof-of-concept study that compared student outcomes between a treatment group (n = 88), in which instructors used the project methods described herein, and a control group (n = 53), in which instructors taught the class without these methods. A single instrument with 6 Likert-style items targeted students’ general attitudes toward statistics, including their perceptions of usefulness of statistics and their beliefs in their ability to understand statistics. Possible average scores on the instrument ranged from 0 to 6. On average, students in the treatment group (M = 4.38, s = 0.99) outperformed students in the control group (M = 4.13, s = 0.88), though by a small margin (t = 1.56, p = 0.06), yielding results that were only significant at the weakest level (α = 0.1). Given that a small effect size was anticipated and that the sample size was modest, researchers were not disappointed in these results. However, the primary flaw in this study was that the treatment and control groups were taught by different instructors. The treatment group instructors were also the authors of the original draft of supporting curriculum materials. Therefore, the effect of the discovery projects could not be separated from the effect of the treatment instructors themselves. The study also could not establish that the curriculum materials would have any value to instructors other than those who developed them.
Journal of Statistics Education, Volume 21, Number 3 (2013)
20
Stage Outcomes
Context Content Knowledge
Statistics Self-Efficacy
Perceived Usefulness
Preliminary Study
Not measured Measured jointly as “Attitudes” using 6-item instrument, not validated in advance
Simultaneous treatment (n=88) versus control (n=53)
Regional Pilot Validated instrument, 18 items
Validated instrument, 14 items
Validated instrument, 12 items
Quasi-experimental, treatment (n=172) versus control (n=137)
National Pilot (Ongoing)
Revised and re-validated, 17 items
Revised and re-validated, 12 items
Revised and re-validated, 11 items
Quasi-experimental, treatment (n=295) versus control (n=353) in progress; counts will change
Table 1. Stages of investigation, outcomes measured, instruments used, and context To address shortcomings of the preliminary study, a quasi-experimental design was introduced and used in the two subsequent pilot studies. To control for instructor effects, participating instructors in each pilot first taught a course without using the student-centered projects as described in this paper. These sections of the course made up the treatment sections. Then these same instructors used the projects and supporting materials to teach control sections of the course. Three distinct instruments were developed and validated to measure students’ content knowledge, perceived usefulness, and statistics self-efficacy. Student outcomes were measured in both treatment and control groups and were compared overall and by instructor. The instructors for the regional pilot included three university instructors, one college instructor, and one high school instructor of AP Statistics. The results suggest that the impact of the projects very much depends on the instructor who uses them, and on the characteristics of the students themselves. For instance, for two of the instructors, the impact of the projects on student content knowledge was more pronounced among high-achieving students than among other students. Yet for other instructors, the impact on content knowledge was more pronounced for lower-achieving students. Across all instructors overall, scores on all three measures were higher on average for the treatment group than for the control group, though none of those overall differences were statistically significant. However, in predicting each of the student attitude outcomes (perceived utility and statistics self-efficacy), a number of significant interactions were detected between setting (high school or college), student achievement level, and the use of the projects; these interactions also differed by instructor. Because of the strong instructor effects and the many interactions observed, results were both complex and highly varied. Though beyond the scope of this article, a more complete description and discussion of those results has already been published (Spence, Sharp and Sinn 2011). Following the regional pilot, the curriculum materials were substantially revised, resulting in the materials now available on the website provided in Section 2. The three instruments were revised to achieve better alignment with the expected student outcomes. Sub-scales were identified within each instrument to isolate different potential benefits with greater precision (e.g., a

Journal of Statistics Education, Volume 21, Number 3 (2013)
21
distinction was made between self-efficacy for linear regression, self-efficacy for hypothesis testing, self-efficacy for data collection, and self-efficacy for understanding statistics in general). These revised instruments were again validated prior to their use in the national pilot. The national pilot test phase has been launched with 8 instructors at colleges and universities across the U.S., using the same quasi-experimental design. Although this research is ongoing, preliminary results again suggest that different instructors realize different benefits from using the materials. For example, results for two individual instructors showed significantly higher scores among each of their treatment sections on student content knowledge about sampling. For three other instructors, a significant increase in student self-efficacy for hypothesis testing has been demonstrated in each of their treatment sections. In fact, for one of those same instructors, treatment sections demonstrated significant gains over control sections on all four statistics self-efficacy subscales (and, hence, on statistics self-efficacy overall as well). Further, for the results collected from the national pilot to date, two outcomes are significantly higher for treatment sections across the board. On average, students in all treatment sections combined (n = 295) have outperformed students in the corresponding control sections (n = 353) on two measures: self-efficacy for data collection (t646 = 2.594, p = .005, equal variances assumed); and content knowledge for identifying which statistical analysis is appropriate for a given scenario (t595 = 2.365, p = .009, equal variances NOT assumed). Thus, the findings to date, though incomplete, seem to suggest a number of potential positive effects, though many of these do vary by instructor. 7. Conclusion It comes as no surprise that the success of projects like these is highly dependent on how they are facilitated by the instructor. Students often need guidance and assistance while completing these projects; it stands to reason that the benefit they gain will be governed largely by the quality of the guidance the instructor is able to provide, while still creating an environment in which the students can construct meaningful understanding for themselves. In particular, students may need guidance and assistance selecting the variable(s) they will study, writing surveys, deciding how to obtain an appropriate sample, or conducting the very hypothesis tests and linear regression analyses that are at the heart of these projects. This guidance is typically provided through lectures, additional hands-on activities, and direct interactions with student teams or with individual students. Because the projects were conceived as a means to introduce the material to students through experience, lectures and activities that are used to cover this content may be held concurrent with the students’ project tasks. By covering the material simultaneously with the projects, instructors can give students an opportunity to see immediate application of the material discussed in class. The primary purpose of this article is to encourage other statistics instructors to consider implementing similar projects in their own courses. This is the reason we have made the supporting instructional materials available online at:
http://faculty.ung.edu/DJSpence/NSF/materials.html
Journal of Statistics Education, Volume 21, Number 3 (2013)
22
We sincerely invite the reader to use these materials as they are or to adapt them as needed. Instructors routinely report that according to their students, the research projects are interesting, and completing these projects deepens both their understanding of statistics and their appreciation for the complexity of research. This feedback, in conjunction with the most recent preliminary results cited above, suggests that these student-centered projects enhance statistics classes, probably because students become more fully invested in the material through application and personal experience. Acknowledgements This work is supported by NSF grant awards DUE-0633264 and DUE-1021584. Any findings or recommendations presented in this material are those of the authors and do not necessarily reflect the views of the National Science Foundation. References Bryce, G. R. (2005), “Developing Tomorrow's Statistician,” Journal of Statistics Education [online], 13(1). Available at www.amstat.org/publications/jse/v13n1/bryce.html Carnell, L. J. (2008), “The Effect of a Student-Designed Data Collection Project on Attitudes Toward Statistics,” Journal of Statistics Education [online], 16(1). Available at http://www.amstat.org/publications/jse/v16n1/carnell.html Fillebrown, S. (1994), “Using Projects in an Elementary Statistics Course for Non-Science Majors,” Journal of Statistics Education [online], 2(2). Available at http://www.amstat.org/publications/jse/v2n2/fillebrown.html Hagelgans, N. L., Fenton, W. E., Baker, B. M., and Hemenway, C. (2001), “Practical Implementation Issues within the Individual Classroom.” In Rogers, E.C., Reynolds, B.E., Davidson, N.A., and Thomas, A.D. (Eds.), Cooperative Learning in Undergraduate Mathematics: Issues that Matter and Strategies that Work (pp. 13-22). Washington, DC: Mathematical Association of America. Hogg, R. V. (1991), “Statistical Education: Improvements are Badly Needed,” The American Statistician, 45, 342-343. Landrum, R.E. and Smith, R.A. (2007), “Creating Syllabi for Statistics and Research Methods Courses.” In D. S. Dumm, R.A. Smith & B. C. Beins (Eds.), Best Practices for Teaching Statistics and Research Methods in the Behavioral Sciences (pp. 45-57). Mahwah, NJ; Lawrence Erlbaum.
Journal of Statistics Education, Volume 21, Number 3 (2013)
23
Love, T. E. (2000), “A Different Approach to Project Assessment,” Journal of Statistics Education [online], 8(1). Available at http://www.amstat.org/publications/jse/secure/v8n1/love.cfm Mvududu, N. (2003), “A Cross-cultural Study of the Connection Between Students' Attitudes Toward Statistics and the Use of Constructivist Strategies in the Course,” Journal of Statistics Education [online], 11(3). Available at www.amstat.org/publications/jse/v11n3/mvududu.html Roseth, C. J., Garfield, J. B., and Ben-Zvi, D. (2008), “Collaboration in Learning and Teaching Statistics,” Journal of Statistics Education [online], 16(1). Available at http://www.amstat.org/publications/jse/v16n1/roseth.html Spence, D. J., Sharp, J. L., and Sinn, R. (2011), “Investigation of Factors Mediating the Effectiveness of Authentic Projects in the Teaching of Elementary Statistics,” Journal of Mathematical Behavior, 30, 319-332. Yesilcay, Y. (2000), “Research Project in Statistics: Implications of a Case Study for the Undergraduate Statistics Curriculum,” Journal of Statistics Education [online], 8(2). Available at http://www.amstat.org/publications/jse/secure/v8n2/yesilcay.cfm Brad Bailey Department of Mathematics University of North Georgia 82 College Circle Dahlonega, GA 30597 Mailto: [email protected] Dianna Spence Department of Mathematics Department of Computer Science University of North Georgia 82 College Circle Dahlonega, GA 30597 Mailto: [email protected] Robb Sinn Department of Mathematics University of North Georgia 82 College Circle Dahlonega, GA 30597 mailto: [email protected]

Journal of Statistics Education, Volume 21, Number 3 (2013)
24
Volume 21 (2013) | Archive | Index | Data Archive | Resources | Editorial Board | Guidelines for Authors | Guidelines for Data Contributors | Guidelines for Readers/Data Users | Home Page |
Contact JSE | ASA Publications