implementation of high accuracy radar detectors …
TRANSCRIPT

CENTER FOR TRANSPORTATION STUDIESCENTER
IMPLEMENTIMPLEMENTAATION OF HIGH TION OF HIGH AACCURACCURACY RADCY RADAR AR DETECTDETECTORS FOR ORS FOR TRAFFIC SAFETY COUNTERMEASURE TRAFFIC SAFETY COUNTERMEASURE
EVEVALUALUAATIONTION
FINAL REPORFINAL REPORTT
GORDON PGORDON PARIKHARIKHJOHN HOURDOSJOHN HOURDOS
MINNESOMINNESOTTA A TRAFFIC TRAFFIC OBSEROBSERVVAATTORORYYUNIVERSITY OF MINNESOUNIVERSITY OF MINNESOTTAA
CTS 14-05CTS 14-05
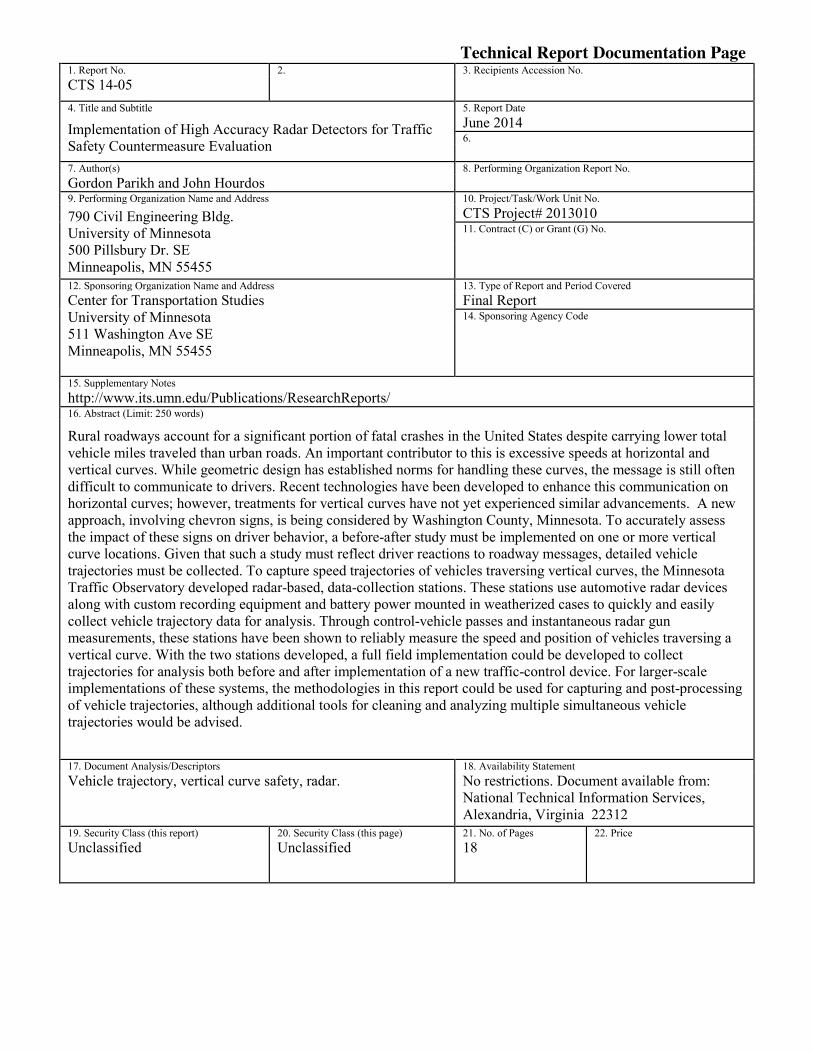
Technical Report Documentation Page 3. Recipients Accession No. 1. Report No. 2.
CTS 14-05 4. Title and Subtitle
Implementation of High Accuracy Radar Detectors for Traffic Safety Countermeasure Evaluation
5. Report Date June 2014 6.
7. Author(s) 8. Performing Organization Report No. Gordon Parikh and John Hourdos 9. Performing Organization Name and Address 10. Project/Task/Work Unit No. 790 Civil Engineering Bldg. University of Minnesota 500 Pillsbury Dr. SE Minneapolis, MN 55455
CTS Project# 2013010 11. Contract (C) or Grant (G) No.
12. Sponsoring Organization Name and Address 13. Type of Report and Period Covered Center for Transportation Studies University of Minnesota 511 Washington Ave SE Minneapolis, MN 55455
Final Report 14. Sponsoring Agency Code
15. Supplementary Notes http://www.its.umn.edu/Publications/ResearchReports/ 16. Abstract (Limit: 250 words) Rural roadways account for a significant portion of fatal crashes in the United States despite carrying lower total vehicle miles traveled than urban roads. An important contributor to this is excessive speeds at horizontal and vertical curves. While geometric design has established norms for handling these curves, the message is still often difficult to communicate to drivers. Recent technologies have been developed to enhance this communication on horizontal curves; however, treatments for vertical curves have not yet experienced similar advancements. A new approach, involving chevron signs, is being considered by Washington County, Minnesota. To accurately assess the impact of these signs on driver behavior, a before-after study must be implemented on one or more vertical curve locations. Given that such a study must reflect driver reactions to roadway messages, detailed vehicle trajectories must be collected. To capture speed trajectories of vehicles traversing vertical curves, the Minnesota Traffic Observatory developed radar-based, data-collection stations. These stations use automotive radar devices along with custom recording equipment and battery power mounted in weatherized cases to quickly and easily collect vehicle trajectory data for analysis. Through control-vehicle passes and instantaneous radar gun measurements, these stations have been shown to reliably measure the speed and position of vehicles traversing a vertical curve. With the two stations developed, a full field implementation could be developed to collect trajectories for analysis both before and after implementation of a new traffic-control device. For larger-scale implementations of these systems, the methodologies in this report could be used for capturing and post-processing of vehicle trajectories, although additional tools for cleaning and analyzing multiple simultaneous vehicle trajectories would be advised.
17. Document Analysis/Descriptors Vehicle trajectory, vertical curve safety, radar.
18. Availability Statement No restrictions. Document available from: National Technical Information Services, Alexandria, Virginia 22312
19. Security Class (this report) 20. Security Class (this page) 21. No. of Pages 22. Price Unclassified Unclassified 18

Implementation of High Accuracy Radar Detectors for Traffic Safety Countermeasure Evaluation
Final Report
Prepared by:
Gordon Parikh John Hourdos
Minnesota Traffic Observatory University of Minnesota
June 2014
Published by: Center for Transportation Studies
University of Minnesota 200 Transportation and Safety Building
511 Washington Ave. S.E. Minneapolis, MN 55455
This report represents the results of research conducted by the author and does not necessarily represent the views or policies of the University of Minnesota. This report does not contain a standard of specified technique.
The author and University of Minnesota do not endorse products or manufacturers. Any trade or manufacturers’ names that may appear herein do so solely because they are considered essential to this report.

Acknowledgements
We would like to thank the Center for Transportation Studies for the support of this project. This seed grand allowed the Minnesota Traffic Observatory (MTO) to develop new research capabilities that are now available to the local transportation community. We would also like to thank Mr. Joshua Gustafson, Washington Co. traffic engineer for his support of the MTO and his idea for improving the safety of rural road steep vertical curves.

Executive Summary
Rural roadways across the United States account for a significant portion of fatal crashes despite carrying lower total vehicle miles traveled than more densely populated urban roads. While this high risk can be related to several factors, one important component is excessive speed at horizontal and vertical curves. Although, geometric design has developed the norms for safely handling such curves the message seems to be difficult to communicate to all drivers. Recent technologies have been utilized in enhancing this communication on horizontal curves (LED flashing chevrons, weight-based curve warning signs, etc.), but vertical curves do not yet have such treatments. Even for rural highways with otherwise good visibility, vertical curves are difficult for drivers to accurately assess. Regions that are only safe at reduced speeds are often traversed at or above 55 mph. Several existing signage solutions (e.g. Blind Approach, Limited Sight Distance, etc.) have not had sufficient positive effects on safety. A new approach involving chevron signs is being considered by Washington County, Minnesota. To accurately determine the impact of the signs on driver behavior, a before-after study must be implemented on one or more vertical curve locations. Given that in such experiments the data must be able to reflect drivers’ reaction to the roadway messages, detailed vehicle trajectories are necessary.
To capture speed trajectories of vehicles traversing vertical curves, the Minnesota Traffic Observatory (MTO) developed radar-based, data-collection systems. These systems use automotive radar devices along with custom recording equipment and battery power, mounted within weatherized cases to quickly and easily collect vehicle trajectory data for analysis. For this particular project, two unique stations were developed: a primary station that contains the recording computer and a satellite station that sends data to the primary station for recording. Custom software capable of decoding data from the form used by the radar stations to a form readable by humans was developed. This process involves capturing the stream as it is broadcast from the sensor in real-time and decoding the data contained within that stream so that it can be formatted into a clear organizational structure. For the purposes of efficiency these two processes have been decoupled so that only stream-capturing occurs within the data-collection stations. Decoding is then performed after stations are returned to the lab.
A number of preliminary tests were performed at the MTO and at nearby sites to guarantee the reliability of the hardware as well as the validity of the data produced by the decoding routine. Further validation was performed at the intersection of Neal Ave N and 6th St N in West Lakeland, Washington County. This location is defined by a prominent vertical crest that limits visibility for southbound drivers, hiding a number of driveways as well as the intersection itself. Although advisory speed limits and hidden drive warnings have been posted and are clearly visible from vehicles, drivers have been observed to traverse this crest at unsafe speeds. Because of the reduced traffic on this road, sensors experienced less noise, offering an opportunity to validate the trajectories produced with greater confidence. A total of 26 vehicle passes were observed consisting of 10 northbound vehicles (moving away from the sensor) and 16

southbound vehicles (moving toward the sensor). Since two sensors were taking measurements during this time interval, a maximum of 52 separate vehicle trajectories should have been observed. For four of the trajectories, amounting to two vehicle passes, there were little to no signs of the vehicle visible in the data. In addition to these, six of the trajectories observed by one sensor (from six vehicle passes) contained insufficient measurements to be usable. These 10 trajectories were disregarded and the remaining 42 trajectories were used to help verify the data from the sensors.
The field test has shown that the Portable Vehicle Tracking station developed by the MTO is a viable tool for collecting vehicle trajectories across a vertical curve. With an active range between 700 and 1200 feet, the stations can cover the critical region of a dangerous vertical curve. Using control-vehicle passes, the trajectories that are collected have been shown to reliably measure the speed and position of vehicles along the vertical curve. To ensure proper functionality of the systems, the two stations should be placed at roughly 500-600 feet apart thereby minimizing interference effects where the sensors overlap.
With these two stations, a full field implementation could be developed to collect trajectories for analysis both before and after implementation of a new traffic control device. For a larger study, the same methodology outlined in this report could be used for capturing trajectory data and post-processing within a laboratory setting. Additional tools for cleaning and analyzing the trajectories from many vehicle passages would be advised for a full-scale implementation of the stations.

Table of Contents 1. Introduction ................................................................................................................................. 1
Need ............................................................................................................................................ 1
2. Portable Vehicle Tracking Stations ............................................................................................ 2
Hardware ..................................................................................................................................... 2
High Accuracy Radar Sensors ................................................................................................. 3
CAN Interface (CAN to Ethernet Server) ............................................................................... 5
Recording Computer................................................................................................................ 6
Software ...................................................................................................................................... 6
CAN Bus.................................................................................................................................. 6
Stream Capture Code ............................................................................................................... 7
3. Implementation ........................................................................................................................... 9
4. Results ....................................................................................................................................... 11
Data Post-Processing ................................................................................................................. 11
Delphi CAN Specification ..................................................................................................... 11
Parsing Code .......................................................................................................................... 12
Filtering Code ........................................................................................................................ 13
Trajectory Extraction ............................................................................................................. 13
Verification of Data ................................................................................................................... 13
5. Sensor Characteristics ............................................................................................................... 16
6. Conclusions ............................................................................................................................... 17
7. References ................................................................................................................................. 18

List of Tables
Table 1. Average and standard deviation for maximum and minimum ranges observed for varying directions of travel……………………………………………………………………....16
List of Figures
Figure 1. Picture of the two PVT stations. ...................................................................................... 2 Figure 2. The Delphi Electronically Scanning Radar. .................................................................... 4 Figure 3. NetBurner CB34 EX CAN to Ethernet Server. ............................................................... 5 Figure 4. Screenshot of the raw data collected from the ESR. ....................................................... 8 Figure 5. Plan View of the test site in Washington Co.. ............................................................... 10 Figure 6. Algorithm used to decode data from the raw format in Figure 4. ................................. 12 Figure 7. Sample of trajectory information from a vehicle passing the station. ........................... 14

1
1. Introduction This document presents the final findings of the seed fund project titled “Implementation of High Accuracy Radar Detectors for Traffic Safety Countermeasure Evaluation”. The objective of the project was to evaluate the feasibility of using high accuracy radar sensors for temporary, portable data collection for the evaluation of rural road traffic safety projects. The technology utilized in this project was not designed for this task but it offers a wealth of information unavailable through any other type of sensor or methodology. The challenge in this project was to implement these sensors in a self-sufficient, battery operated set of data-collection stations capable of independent, non-intrusive deployment in a rural road setting. The project offered a lot of challenges which we will try to elaborate on in this report. We believe the experience accumulated in this project will be of value on several future projects that require the collection of detailed vehicle trajectories in order to understand how the general driving public reacts to the various safety countermeasures deployed.
Need Rural roadways across the United States account for a significant portion of fatal crashes despite carrying lower total vehicle miles traveled than more densely populated urban roads. While this high risk can be related to several factors, one important component is excessive speed at horizontal and vertical curves. Although, geometric design has developed the norms for safely handling such curves the message seems to be difficult to communicate to all drivers. Recent technologies have been utilized in enhancing this communication on horizontal curves (LED flashing chevrons, weight-based curve warning signs, etc.), but vertical curves do not yet have such treatments. Even for rural highways with otherwise good visibility, vertical curves are difficult for drivers to accurately assess. Regions that are only safe at reduced speeds are often traversed at or above 55 mph. Several existing signage solutions (e.g. “Blind Approach”, “Limited Sight Distance”, etc.) have not had sufficient positive effects on safety. A new approach involving chevron signs is being considered by Washington County, Minnesota. To accurately determine the impact of the signs on driver behavior, a before-after study must be implemented on one or more vertical curve locations. Given that in such experiments the data must be able to reflect driver’s reaction to the roadway messages, detailed vehicle trajectories are necessary.
To capture speed trajectories of vehicles traversing vertical curves, the Minnesota Traffic Observatory (MTO) developed radar-based, data-collection systems. These systems use automotive radar devices along with custom recording equipment and battery power, mounted within weatherized cases to quickly and easily collect vehicle trajectory data for analysis.

2. Portable Vehicle Tracking Stations Automotive radar units are designed to be integrated into a vehicle’s Controller Area Network (CAN) bus to facilitate communication between the sensor and the vehicle. To use such devices for data collection, additional hardware and custom software are required to record the data that is broadcast from the sensor. To reduce the complications that could arise during data collection, stations based on previous MTO designs were assembled around automotive radar sensors to simplify the process of collecting vehicle trajectories. These stations, consisting of a radar sensor, a computer running custom recording software, an interface between the two, and battery power make the collection of vehicle trajectories a fully-automated process that can be initiated by the push of a button. For this particular project, two unique stations were developed: a primary station that contains the recording computer, and a satellite station that sends data to the primary station for recording. Diagrams of these two stations can be seen in Figure 1. Details of the components required for these stations and their role in the operation as a whole will be elaborated below.
Figure 1. Picture of the two PVT stations.
Hardware Automotive radar devices stream information to the host vehicle so that it can be used to assist on-the-fly decisions to make driving safer and easier for the driver and passengers. Collecting
2

3
data from these sensors therefore requires hardware and software to capture and save this information stream. Automotive radar sensors communicate with devices over the serial CAN interface. The CAN standard is based on the need for an established protocol for communication between microcontrollers in the absence of a host computer. However, since it is based on transmission of binary data any computer with the proper hardware is capable of receiving and processing this signal. Given the tremendous possibilities that this technology offers for the automotive market, devices that can bridge this gap between CAN bus and other communications standards such as USB and Ethernet are fairly commonplace. Ultimately, the stations assembled for this project operate by translating the CAN signal broadcast from the radar sensor to Ethernet, allowing for the expansion of a vehicle trajectory collection system from one sensor to multiple sensors using the same technology used to build most modern computer networks. Details of the hardware that makes this possible can be read in the following subsections.
High Accuracy Radar Sensors
Radar-based vehicle detection sensors operate by emitting radio waves, typically between 1 and 100 GHz, and measuring the frequency shift of the returning waves that have been reflected off moving objects. Vehicle detection radar can fall into one of two categories: roadside, designed to be a replacement for loop detectors, and vehicle-mounted, designed for the development of in-vehicle safety systems such as collision warning and avoidance (Gorjestani, 2010).
Developments over the past few decades in semiconductor microwave generators and the computing power of microcontrollers has made implementation of radar technology for automotive uses commercially feasible. Since being introduced into the automotive market in the 1990s, automotive radar systems have been installed in vehicles manufactured by BMW, Cadillac, Audi, Mercedes, Lexus, Honda, and many others. The increased usage of these devices coupled with modern supply chains has made them an accessible and affordable means of developing data collection systems (Schneider, 2005). However since they are intended to be integrated into a vehicle by the manufacturer, the development of a data collection system requires additional hardware to receive and record data that is transmitted by the radar.

4
Figure 2. The Delphi Electronically Scanning Radar (ESR).
While there are a number of commercially-available automotive radar sensors produced by several manufacturers, the Delphi Electronically Scanning Radar (ESR, Figure 2) was chosen for this project because it possesses a number of features that increase its functionality with regards to a general-purpose radar device. First, the ESR operates at the 76-77 GHz band of the radio spectrum, as opposed to the 24 GHz band that is used in some devices. While devices using either band have similar reliability, sensors using the 76-77 GHz band tend to be able to detect targets at a longer range than those using the 24 GHz band. In addition to this there are regulatory concerns that make the 76-77 GHz band a more reliable choice for the future of radar-based data collection systems. While the 24 GHz band is currently approved for use by automotive radar sensors, it is also used for telecommunications and radio astronomy purposes that take precedent (European Telecommunications Standards Institute, 2012). The 76-77 GHz band, on the other hand, has been specifically reserved by the Federal Communications Commission for use by automotive radar systems, including for the integration of such technology into fixed infrastructure systems (Federal Communications Commission, 2011).
Beyond this, the ESR is also advantageous in that it is a multimode sensor capable of simultaneously providing mid-range measurements with a wide field of view and long-range measurements with a single device. The ESR is capable of identifying up to 64 targets in the vehicle’s path, making it useful to automotive manufacturers for the implementation of various safety technologies including adaptive cruise control, forward collision warning, brake support, and headway alert. The general-purpose design of the ESR means that it can also be used to take continuous, high-accuracy measurements of range (position), range rate (speed), and acceleration for a variety of targets.
For this project, two ESR units were programmed to run in 64-Track mode, the device’s primary mode of operation, on receiving power. In this mode the ESR will attempt to identify and take measurements of 64 targets every 50 milliseconds, with targets belonging to either of two categories: long-range targets up to 175 m away within a 20° field of view, and mid-range targets

5
up to 60 m away within a 90° field of view. This data is then encoded using Delphi’s Private CAN Serial Communication Specification, which will be discussed in detail later in the report, and sent over the CAN bus to any receiving controllers. At this point in the message cycle the ESR has completed its job and additional hardware is relied upon to receive and store the data that was produced.
CAN Interface (CAN to Ethernet Server)
Since the ESR is designed to be integrated into a vehicle, accessing the data it produces requires hardware that can interface between the CAN bus standard it uses and the common interfaces used by modern computers. A common way of doing this is with a USB to CAN interface that allows data to be sent and received to and from a CAN device as if it were a common USB device. While this is a useful means of communicating with such a device, since the goal of this project is data collection the two-way communication a USB to CAN interface provides is not necessary. In addition to this, it was known from the beginning of the project that more than one ESR would be used to collect data, so a solution that allowed for multiple connections from the sensors to a computer was ideal. Because of this, a CAN/serial to Ethernet server was chosen as the interface between the ESR and the computer responsible for recording data.
The device chosen for this role is the NetBurner CB34 EX CAN to Ethernet server (Figure 3). This device is capable of receiving data from a CAN device and broadcasting it over a network, making expanding a system to include multiple sensors a simple task of adding routers or switches to the configuration. Beyond this, the NetBurner CB34 EX has a low power requirement with flexible voltage needs, making it easy to include as part of a battery-powered station. It is also capable of connecting to CAN devices using a detachable terminal block connector, which simplifies cable management, and is programmable to meet the specific needs of the user (NetBurner, 2013).
Figure 3. NetBurner CB34 EX CAN to Ethernet Server (NetBurner, 2013).

6
To assemble the data collection stations used for this project, two NetBurner servers were programmed to receive messages from the ESR and broadcast them as User Datagram Protocol (UDP) packets. The connection between the ESR and the NetBurner was facilitated using a custom cable created using Delphi’s proprietary connector plug and regular Ethernet cable.
Recording Computer
All data collected by the ESR is ultimately stored by a computer so that it can be decoded and used later. In the stations developed for this project, the computer used is a custom-built small form factor PC with a design that has been used for various purposes in previous projects. Fully assembled the PC measures approximately 12 in. on each side by 3 in. thick and is powered by an Intel Atom processor. The PC also contains a 500 GB hard disk drive and a PCIE analog video capture card for video recording. For this project, Ubuntu Desktop 12.04 was installed on the computer to serve as the operating system, and several adjustments were made to allow it to operate with minimal user interaction.
Once powered and turned on the operating system is set to unconditionally boot regardless of the cause of the previous shutdown. Without this setting, an improper shutdown such as disconnecting power would cause the computer to wait indefinitely for the user to choose between booting normally, booting into safe mode, and booting to command line. The operating system is also set to specify a static IP address so that data from the NetBurner servers can be properly received. After booting, the computer is set to login to the main user’s account at which point it runs two instances of a listening program that collects all data sent from the NetBurner servers, the details of which will be discussed in the Software section below. In addition to this, the computer captures and saves a video feed using the video capture card to facilitate data analysis.
Software Just as the repurposing of automotive radar sensors for general-purpose data collection requires additional hardware, it also requires custom software capable of decoding data from the form used within a controller area network to a form readable by humans. This process involves capturing the stream as it is broadcast from the sensor in real-time and decoding the data contained within that stream so that it can be formatted into a clear organizational structure. For the purposes of efficiency these two processes have been decoupled so that only stream-capturing occurs within the data collection stations. Decoding is then performed after stations are returned to the lab. This section contains a description of the software that saves raw data from the radar sensor, as well as an overview of the specifications that influenced its final form.
CAN Bus
The CAN bus standard allows for the transmission of messages between microcontrollers without the presence of a host computer. Therefore since there is no component within the

7
network that is capable of prioritizing the transmission or processing of this information, the CAN standard specifies a protocol through which electronic control units can define the necessary parameters to ensure that their message reaches the intended destination within sufficient time so as to ensure uninterrupted operation of the vehicle’s various control mechanisms. Once a controller has data that is ready to be sent to another controller it encodes destination information and message priority using the CAN specification. This information is then used to contain the data that is to be transmitted so that it can be safely sent over the bus. Each message transmitted in this way is referred to as a CAN frame, containing packaged within the message all data required to transmit and identify the message so that it can be decoded by the receiving controller. While the encoding of message target and priority information is standard across all manufacturers, the encoding of the actual data within the CAN frame varies. Since the radar sensor used for this project is manufactured by Delphi, their Private CAN Serial Communication Specification is used to decode all data obtained by the data collection stations (Farsi, 1999).
Stream Capture Code
Because of the way data is encoded under Delphi’s CAN specification, the data that is recorded from the ESR must be saved in a form so as to not affect the reliability of the data. Since this data is transmitted over a network connection, some issues relating to the way bytes are ordered in memory (or transmission) by different computers arise. To summarize the issue, because different computer architectures order bytes that correspond to a particular value differently, with either the most- or least-significant byte first, it was established that transmissions over networks would be ordered with the most-significant byte first. This means that data transmitted over a network is often rearranged several times by the time it reaches its destination. This is of little consequence when data is encoded in standard data types like a 32-bit unsigned integer. However when data is encoded in irregular formats, such as a CAN frame, that do not fit neatly into these standard data types, some unexpected loss of data can occur (Reynolds, 1994).
The way around this issue is basically to avoid the issue altogether. Since the problem arises from the ordering of bytes within a single value, byte ordering only matters if the value of interest is expressed in more than one byte. Correctly capturing this stream therefore requires that data be saved as an array of single-byte values, the contents of which will always be returned in the proper order. To achieve this in the stream capture program, data is received by the host computer as a single data buffer which is saved to a file byte-by-byte. The raw data is saved in a text file such that each line of the file is a message, with each message consisting of a series of single-byte integer values separated by commas. An example of this file can be seen in Figure 4. In addition to saving this raw data, the stream capture program also prepends a timestamp to the message data, since the ESR does not possess a real-time clock. Once saved into this format, the data can be translated by the parsing program into a human-readable form. A discussion of the parsing program will be provided in the following section.

8
Figure 4. Screenshot of the raw data collected from the ESR.

9
3. Implementation A number of preliminary tests were performed at the MTO and at nearby sites to guarantee the reliability of the hardware as well as the validity of the data produced by the decoding routine. Some initial tests consisted of an individual walking quickly in a straight trajectory (indoors) with range and speed verified by use of a radar gun. In these tests, data measured by the ESR matched the instantaneous data taken by the radar gun. Additional tests were performed by observing vehicles traveling on low-speed roads on the University of Minnesota campus. Since these tests were performed outside there was considerably more noise from extraneous motion near the radars (pedestrians, bicyclists, etc.). While this made the data more difficult to interpret, it still showed clear vehicle trajectories with ranges and speeds within the expected values for those roads.
Further validation was performed at the intersection of Neal Ave N and 6th St N in West Lakeland, Washington Co., MN. This location is defined by a prominent vertical crest that limits visibility for southbound drivers, hiding a number of driveways as well as the intersection itself. Although advisory speed limits and hidden drive warnings have been posted and are clearly visible from vehicles, drivers have been observed to traverse this crest at unsafe speeds. Because of the reduced traffic on this road, sensors experienced less noise, offering an opportunity to validate the trajectories produced with greater confidence.
Two ESR stations were placed at this location, one near the top of the crest within 50 feet of the intersection with 6th St N (sensor 1), and one approximately 90 feet north (sensor 2). A diagram of this site can be seen below (Figure 5). Both radars were positioned on the west side of the road with the devices pointed slightly toward the roadway so as to capture the trajectories of vehicles approaching the crest from this direction. Although the sensors have a range of approximately 700 feet, a setup involving a large overlap was chosen so that measurements could be checked against each other. This choice revealed some unexpected but useful information that will be elaborated in the Results section of this report. Data was then collected for approximately 30 minutes, during which 26 vehicle passes were observed. Six of these vehicle passes were by a vehicle with speed set by cruise control and were used to verify the data.

10
Figure 5. Plan View of the test site in Washington Co. The black rectangles correspond to the labeled ESR station, connected by a cable represented by the blue line. Yellow lines represent
the approximate direction of the sensor center-lines (Google Maps, 2013).

11
4. Results
Data Post-Processing Because of limitations on power and computational ability in the field, the decoding and analysis of data produced by the ESR is performed after equipment is returned to the lab. This post-processing involves three main tasks: decoding, cleaning, and trajectory extraction. Decoding and cleaning are performed by programs written for this project using information from Delphi’s Private CAN Serial Communication Specification. Trajectory extraction is currently a manual process which will be automated in the near future. Details of each of these steps are discussed below.
Delphi CAN Specification
The transmission of data by the ESR follows Delphi’s Private CAN Serial Communication Specification in its message timing and data encoding. Target data is processed by the ESR with a cycle time of 50 +/- 5 milliseconds. Once this processing is completed, the device transmits all messages, 83 in total, in one group, with each message identifiable by its 11-bit message ID. In each of these messages, all data is contained within a 64-bit data field, with the data encoding varying depending on the message but following the same general pattern. Since the type of data transmitted in each message is always the same, each individual field is set to a fixed length, the size of which is determined by the minimum number of bits required to store the largest magnitude value. Because of this encoding scheme, the data within each message spans byte borders and thus cannot be interpreted correctly by a computer without knowing the exact start and end of each field. In addition to requiring the location of each field, since some of the data being transmitted is intended to be expressed as a floating-point value, some fields must be scaled (multiplied) by a value that is also unique to each field (Johnson, 2010).
Messages sent by the ESR can be either status messages, containing information about the sensor’s current state of operation, or track messages, containing measurements of objects seen by the sensor. Since this project is concerned with the collection of vehicle trajectories the primary messages of interest are the track messages. Data from these messages, which are all identical in structure, consists of range, range rate (speed), acceleration, and angle values all compacted into the 64-bit data field. Since this data requires a high precision, values are scaled by factors ranging from 0.01 to 1. For instance, speed measurements range from -81.92 to 81.91 m/s and are represented by 13-bit values ranging from -8192 to 8191, with the required precision obtained by multiplying the integer value by the scaling factor 0.01. This encoding simplifies the task of representing high-precision numbers within a small container, but increases the work that is required to decode a message. Since all the information required to decode data from the ESR is contained within Delphi’s CAN specification however, writing a program to perform this decoding is a fairly straightforward process (Johnson, 2010).

12
Parsing Code
Files created by the stream capture code in the field are decoded with an automated program. The program first rebuilds each packet individually as a string of binary values by converting each comma-separated integer into its binary representation and concatenating them. This binary string is then split at the bit level into the corresponding fields, as outlined in the specification document. Values that require scaling are also multiplied by the corresponding scaling factor. Once the entire message has been parsed, data is written to two separate CSV files: a status file containing data from status messages and a track file containing data from target messages. A flow chart outlining the algorithm used by this program can be seen below (Figure 6). The files produced by this routine contain physically meaningful numbers and can therefore be used to extract trajectories. The addition of a cleaning step, however, makes this process considerably easier.
Figure 6. Algorithm used to decode data from the raw format in Figure 4 to meaningful data in a
spreadsheet.

13
Filtering Code
After the data has been processed into a readable format, it must be cleaned to remove noise and false targets. The routine for filtering out these targets performs two operations: removing any targets specified by the ESR in the “CAN_TX_TRACK_STATUS” field as “no target,” and removing any targets with a speed below or above a certain threshold. The majority of the noise generated consists of targets with speeds below 5 m/s (about 10 mph) and above 50 m/s (about 110 mph), the removal of which does not affect the viability of any sought-after data (in the 30-60 mph range). Depending on the activity of the test site, vehicle trajectories can be very visible in the data following this step. With increased activity, however, an additional routine for extracting trajectories, currently in progress, will be necessary.
Trajectory Extraction
Since there is little activity at the chosen test site in Washington County, the cleaning process is enough to produce reasonably clear trajectories. While there invariably is still some irrelevant data at this point, it is clear enough to be filtered out by hand so that trajectories can be visualized and analyzed. This process is very methodical but requires some judgment to make up for limitations of the sensor, namely the line-of-site requirement that causes targets that briefly disappear behind an object to be identified as new targets. The quantity of data produced, however, is such that a computer would be capable of making that judgment with minimal assumptions.
In the 30 minutes during which data was collected at the test site, a total of 26 vehicle passes were observed consisting of 10 northbound vehicles (moving away from the sensor) and 16 southbound vehicles (moving towards the sensor). Since two sensors were taking measurements during this time interval, a maximum of 52 separate vehicle trajectories should have been observed. For four of the trajectories, amounting to two vehicle passes, there were little to no signs of the vehicle visible in the data. In addition to these, six of the trajectories observed by one sensor (from six vehicle passes) contained insufficient measurements to be usable. These 10 trajectories were disregarded and the remaining 42 trajectories used to help verify the data from the sensors.
Verification of Data To verify the data collected two checks were performed: first the range, speed, and acceleration data were used to check that the expected physical relationships were visible; and second, the trajectories made by a vehicle with known speed were examined to verify that data was accurate. The first task was accomplished by taking the range and speed data from each trajectory, fitting a polynomial to the data, and differentiating with respect to time to obtain an approximation of speed and acceleration, respectively. The data was then plotted so that the desired relationships could be assessed visually. An example of this plot can be seen below (Figure 7). In each of these figures, the left-most plot shows the distance from the corresponding sensor, the middle

14
plot shows the speed, and the rightmost plot shows the acceleration. Black lines represent the measured data, blue lines the polynomial fit, and red lines the differential approximation. For each trajectory, data was plotted from each sensor individually as well as from both sensors combined. All of these plots are available in Appendix A of this report.
Figure 7. Sample of trajectory information from a vehicle passing the station.
While only 16 of the 42 usable trajectories displayed the desired relationships between range, speed, and acceleration, the remaining data sets still contained smooth measurements. This is likely due to the fact that variations in speed are highly dependent on driver behavior, making it difficult to approximate speed based on distance alone. In addition to this, a certain degree of interference between the two sensors was observed in the data that could have influenced the quantity and quality of the measurements taken. This is supported by the fact that more of the bad trajectories were produced by the southernmost sensor which, because of the way the stations were positioned, would have experienced more noise in the form of radio waves originating from the other sensor.
In addition to interference between the two sensors, there also seems to be an issue with error as a function of vehicle direction. The majority of the bad trajectories produced were of northbound vehicles moving away from the sensor, while all but one of the good trajectories were of southbound vehicles moving towards the sensor. This is likely related to the occurrence of angular error that is inherent to radar-based speed measurements. This error increases nonlinearly as the angle between the line of sight to the target and the axis of the antenna grows, so the highest error occurs when this angle is the largest. Since vehicles moving northbound would be first visible to the sensor when this angle is at its maximum value, measurements of these targets would be prone to high error that could influence the quality of the data produced. Further testing will be required to determine the true cause of this issue and any possible remedies.

15
Examining the data collected from the vehicle with known speed produced mixed results as well as possibilities for correction. Five of the six trial passes were visible in the data and displayed the smooth trajectories expected from a vehicle using cruise control. Measured speeds were also very close to the value that was set in the vehicle. Average speeds for the three southbound trajectories were within 2 mph of the speed set by the cruise control until the vehicle reached the vertical crest, at which point the speed reduced as would be expected. For the two available northbound trajectories, however, the measured speeds were well below the value set. Because of the direction of travel in these two trajectories, it is likely that this issue is related to the angular error of the sensor, however additional testing is required to verify this.
16
5. Sensor Characteristics As was observed from the data obtained in Washington County, measurements of vehicles moving towards the sensor is sufficiently accurate for the purposes of collecting research data. The error observed in measurements of vehicles moving away from the sensor, however, indicates that further testing is required to improve the quality of these measurements. The interference observed in the data also indicates that the separation between the two sensors must be increased to reduce the possibility of this interference affecting the quality of the data. Further testing is required to determine the minimum required separation, although preliminary estimates suggest that distances of 500-600 feet will be required. Increasing the separation, however, will produce longer trajectories which would be useful depending on the purpose of the data collection.
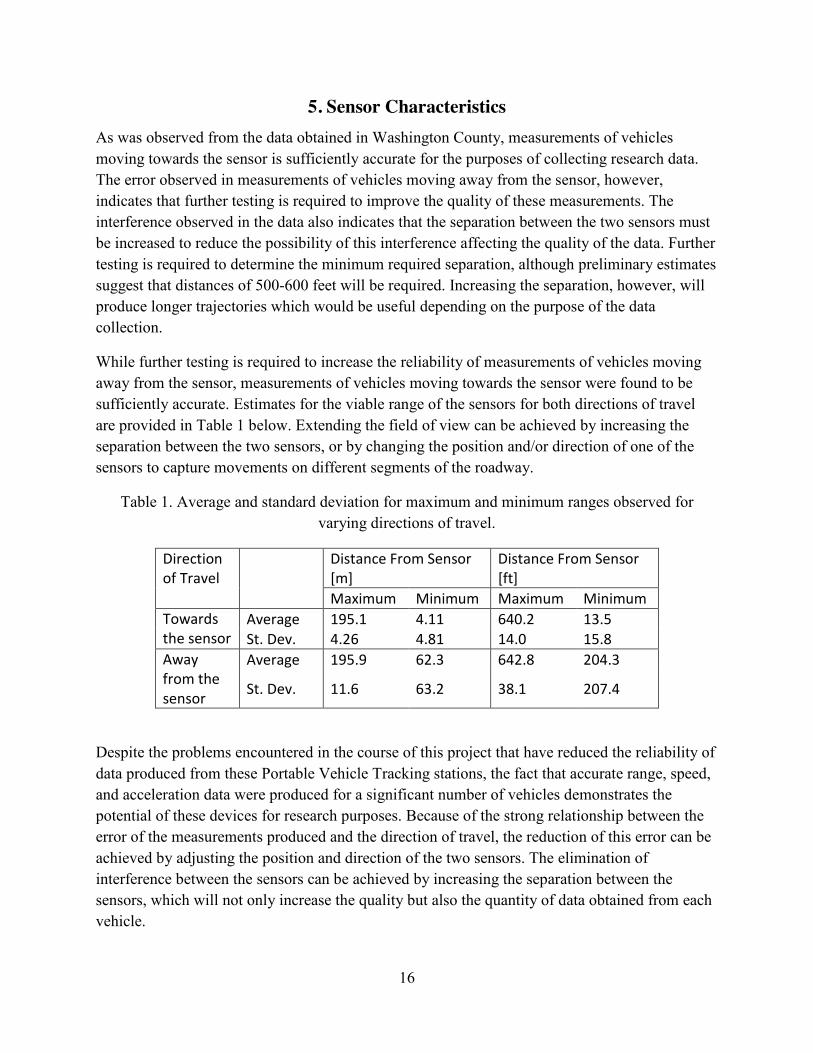
While further testing is required to increase the reliability of measurements of vehicles moving away from the sensor, measurements of vehicles moving towards the sensor were found to be sufficiently accurate. Estimates for the viable range of the sensors for both directions of travel are provided in Table 1 below. Extending the field of view can be achieved by increasing the separation between the two sensors, or by changing the position and/or direction of one of the sensors to capture movements on different segments of the roadway.
Table 1. Average and standard deviation for maximum and minimum ranges observed for varying directions of travel.
Direction Distance From Sensor Distance From Sensor of Travel [m] [ft]
Maximum Minimum Maximum Minimum Towards Average 195.1 4.11 640.2 13.5 the sensor St. Dev. 4.26 4.81 14.0 15.8 Away Average 195.9 62.3 642.8 204.3 from the St. Dev. 11.6 63.2 38.1 207.4 sensor
Despite the problems encountered in the course of this project that have reduced the reliability of data produced from these Portable Vehicle Tracking stations, the fact that accurate range, speed, and acceleration data were produced for a significant number of vehicles demonstrates the potential of these devices for research purposes. Because of the strong relationship between the error of the measurements produced and the direction of travel, the reduction of this error can be achieved by adjusting the position and direction of the two sensors. The elimination of interference between the sensors can be achieved by increasing the separation between the sensors, which will not only increase the quality but also the quantity of data obtained from each vehicle.

17
6. Conclusions The Portable Vehicle Tracking station developed by the MTO is a viable tool for collecting vehicle trajectories across a vertical curve. With an active range between 700 and 1200 feet, the stations can cover the critical region of a dangerous vertical curve. Using control-vehicle passes, the trajectories that are collected have been shown to reliably measure the speed and position of vehicles along the vertical curve. In order to ensure proper functionality of the systems, the two stations should be placed at roughly 500-600 feet apart thereby minimizing interference effects where the sensors overlap.
With these two stations, a full field implementation could be developed to collect trajectories for analysis both before and after implementation of a new traffic control device. For a larger study, the same methodology outlined in this report could be used for capturing trajectory data and post-processing within a laboratory setting. Additional tools for cleaning and analyzing the trajectories from many vehicle passages would be advised for a full-scale implementation of the stations.
18
7. References Delphi. “Delphi electronically scanning radar.” Retrieved June 20, 2013, from http://delphi.com/manufacturers/auto/safety/active/electronically-scanning-radar/
European Telecommunications Standards Institute. 2012. “Automotive radar.” Retrieved June 20, 2013, from http://www.etsi.org/technologies-clusters/technologies/intelligent-transport/automotive-radar
Farsi, M., K. Ratcliff, & M. Barbosa. 1999. “An overview of controller area network.” Computing & Control Engineering Journal, 10(3), 113-120.
Federal Communications Commission. 2011. Amendment of sections 15.35 and 15.253 of the Commission’s rules regarding operation of radar systems in the 76-77 GHz Band/Amendment of section 15.253 of the Commission’s rules to permit fixed use of radar in the 76-77 GHz band. Retrieved June 20, 2013, from http://hraunfoss.fcc.gov/edocs_public/attachmatch/FCC-11-79A1.pdf
Google Maps. 2013. “6th St N & Neal Ave N, West Lakeland, MN.” Google. Retrieved June 20, 2013, from https://maps.google.com/maps?ct=reset&tab=ll
Gorjestani, A., A. Menon, P. Cheng, C. Shankwitz, & M. Donath. 2010. “Determination of the alert and warning timing for the cooperative intersection collision avoidance System–Stop sign assist using macroscopic and microscopic data.” (CICAS-SSA report# 1). Intelligent Transportation Systems Institute Center for Transportation Studies, August. Retrieved June 20, 2013, from http://conservancy.umn.edu/bitstream/101435/1/CTS10-31.pdf.
Johnson, W., & E. Jun. 2010. Private CAN serial communication specification. (No. PDD-10017275-302.27). Delphi Automotive Systems, Kokomo, IN.
NetBurner. CB34 EX 2-port CAN to ethernet server. Retrieved June 20, 2013, from http://www.netburner.com/products/serial-to-ethernet/cb34-ex
Reynolds, J., & J. Postel. 1994. Assigned numbers. (No. RFC 1700).Internet Engineering Task Force. Retrieved June 20, 2013, from http://www.ietf.org/rfc/rfc1700.txt
Schneider, M. 2005, April 6. “Automotive radar–status and trends.” Paper presented at the German Microwave Conference, Ulm, Germany. University of Ulm, Ulm. Retrieved June 20, 2013, from http://duepublico.uni-duisburg-essen.de/servlets/DerivateServlet/Derivate-14581/Paper/5_3.pdf.