implementation of intellectual property laws and socio
TRANSCRIPT

58 Pakistan Journal of Social Issues Volume XI (2020)
Implementation of Intellectual Property Laws and Socio-Economic Growth:
Inferences from Selected Countries and the Case of Pakistan
Ghulam Murtiza*, Justice Ghous Muhammad**
Abstract
The weak implementation of intellectual property laws encourages the
counterfeiting and piracy and hence causes huge losses to socio-economic growth
of a country. The inference from twenty countries has been drawn and the results
reveal that IP laws implementation contributes considerably to socio-economic
growth and the influence is found to be more powerful in countries with strong
implementation of intellectual property laws. In Pakistan, the implementation
ability is unsatisfactory and accordingly socio-economic development is at lower
stage. The powerful implementation of IP laws in Pakistan is need of the hour.
Key Words: Intellectual property, Implementation, Piracy, counterfeiting, Socio-
economic growth.
Introduction
The various factors play their role in enhancing the socio-economic growth in a
specific country. IP is also considered in one of those factors. Whether it can be
called a factor which enhances the socio-economic growth in a specific country or
not? A lot has been written about IPRs protection and socio-economic growth. On
both sides, ample literature is available. A lot has been written also with regard to
one important component of IP protection that is implementation of IP. When we
talk about the calculation of preservation of IPRs, this component is of much
importance as without this component, the concept of IP protection is incomplete. In
this context, in assessing national performance in protecting IP, the measurement of
implementation segment is mandatory.
The inclination for this research comes from the fact that no work has been done so
far regarding this question that what level of implementation of IP laws is required
for socio-economic growth. Whether any interconnection exists between level of
implementation of IP laws and level of socio-economic growth? Whether IP laws
implementation standard affects the standard of socio-economic growth? Whether
volume of implementation determines the volume of socio-economic growth in a
specific country? Whether the strength of implementation of intellectual property
laws has any impact on strength of socio-economic growth?
_______________
*Assistant Professor, College of Law, Government College University, Faisalabad
E-Mail: [email protected]
**Dean, School of Law, University of Karachi E-Mail: [email protected]

59 Pakistan Journal of Social Issues Volume XI (2020)
Data Description and Methodology To draw the inference whether any link exists between level of implementation of
IP laws and level of socio-economic growth and Whether IP laws implementation
standard affects the standard of socio-economic growth, this study selects twenty
countries including Peru, Russia, Turkey, Argentina, Thailand, Malaysia, South
Africa, Colombia, South Korea, Brazil, Mexico, U.S, Singapore, Canada,
Switzerland, U.K, Japan, France, Australia and New Zealand. These countries have
been selected because these countries have experience of strengthening their IP
systems.
To gauge the level of implementation of IP laws in these selected countries, this
study employs U.S. Chamber of Commerce, Global Intellectual Property Center
International IP Index for the duration of 2014-2017. The reason to take this IPR
protection measure is that it is as per provisions of TRIPS and the reason for this
time period (2014-2017) is to take up to date data. There are many other IPR
protection measures including Rapp & Rozek Index (1990), Seyoum Index (1996),
Sherwood Index (1997), Ginarte and Park Index (1997), Property Rights Alliance’s
International Property Rights Indexes and Global IP Index by Taylor Wessing. Most
of them are outdated whereas others do not comprehensively cover the IP protection
standards as mandated by TRIPS.
First, overall IP protection level of selected countries would be observed and after
that level of implementation of IP laws in these countries will be judged.
The counterfeiting and piracy have result in decreased innovation, low level of
foreign direct investment, financial resources’ increased flow to criminal networks,
health and safety risks as well as negative environmental effects due to substandard
products, reduction in firm level investment, lower tax and related payments,
increased risk of going out of business, adverse implications for R&D and other
creative activities, higher rates of unemployment as well as poorer working
conditions, loss of trade revenues and overall slower socio-economic growth. Table
# 7 taken from Frontier Economics’ The Economic Impacts of Counterfeiting and
Piracy (2016) clearly elaborates this instance.
The social and economic growth of a country is badly damaged by counterfeiting
and piracy. In countries where counterfeiting and piracy are at lower level, socio-
economic growth in those countries is at higher level and in countries where
counterfeiting and piracy is at higher level, socio-economic growth in those
countries are at lower level.
What is the level of counterfeiting and piracy in selected countries? To observe the
counterfeiting volume, data has been taken from U.S. Chamber of Commerce,
Measuring the Magnitude of Global Counterfeiting (2016) and to detect the piracy
strength in those countries, data has been taken from BSA Global Software Survey
(2016).
To draw the inference whether level of implementation of IP laws affects the level
of socio-economic growth, we will compare the level of IP laws implementation
with the level of counterfeiting and piracy in selected economies.
60 Pakistan Journal of Social Issues Volume XI (2020)
What would be the result? In light of taken result, it will be observed whether in
Pakistan there should be strong IP laws implementation mechanism for better socio-
economic growth or not.
To observe the IP laws implementation level in Pakistan, U.S. Chamber of
Commerce, Global Intellectual Property Center International IP Index has been
utilized. To discover the level of counterfeiting in Pakistan, data has been achieved
from different well recognized studies. To inspect the volume with regard to piracy,
data has been taken from BSA Global Software Survey (2016).
The focus of this study is on the legal and socio-economic issues with regard to
world of IP. This paper therefore does not touch those matters that strictly fall
within the domain of elementary economics.
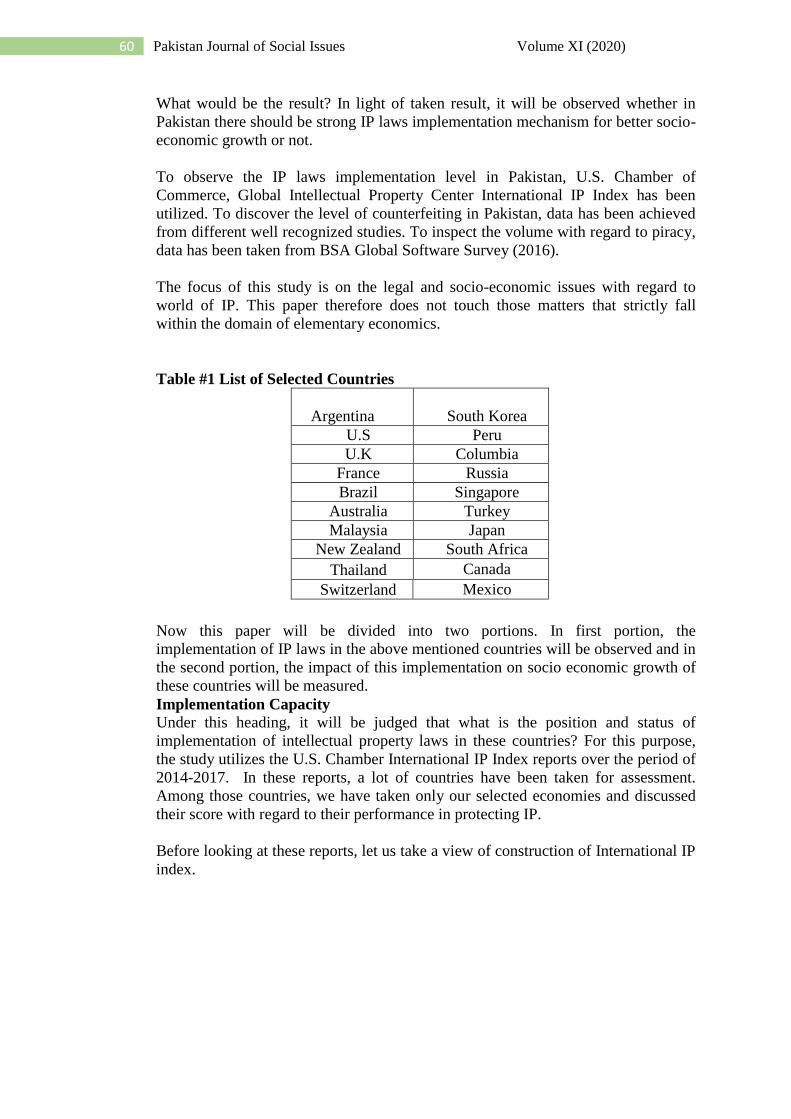
Table #1 List of Selected Countries
Argentina
South Korea
U.S Peru
U.K Columbia
France Russia
Brazil Singapore
Australia Turkey
Malaysia Japan
New Zealand South Africa
Thailand Canada
Switzerland Mexico
Now this paper will be divided into two portions. In first portion, the
implementation of IP laws in the above mentioned countries will be observed and in
the second portion, the impact of this implementation on socio economic growth of
these countries will be measured.
Implementation Capacity Under this heading, it will be judged that what is the position and status of
implementation of intellectual property laws in these countries? For this purpose,
the study utilizes the U.S. Chamber International IP Index reports over the period of
2014-2017. In these reports, a lot of countries have been taken for assessment.
Among those countries, we have taken only our selected economies and discussed
their score with regard to their performance in protecting IP.
Before looking at these reports, let us take a view of construction of International IP
index.

61 Pakistan Journal of Social Issues Volume XI (2020)
Table #2 Construction of International IP Index 1
1
2
3
4
5
6
7
8
Patents, Related Rights, and Limitations Category
Indicators
Patent protection term
Requirements of patentability
Computer-implemented inventions patentability
Enforcement and resolution mechanism of pharmaceutical-related
patent
Use of compulsory licensing of patented products and technologies
and legislative criteria
Patent term restoration for pharmaceutical products
Protection term of regulatory data
Patent opposition
Maximum
Score
1
1
1
1
1
1
1
1
Minimum
Score
0
0
0
0
0
0
0
0
Total
Score: 8
2
1
2
3
4
5
6
Copy Rights, Related Rights, and Limitations Category
Indicators
Copyrights and related rights protection term
Legal measures providing necessary exclusive rights that prevent
infringement of copyrights and related rights (including web
hosting, streaming, and linking)
Frameworks availability that promote cooperative action against
online piracy
Scope of limitations and exceptions to copyrights and related rights
Management legislation of digital rights
Clear implementation of policies and guidelines requiring
proprietary software used on Govt. ICT systems to be licensed
software
Maximum
Score
1
1
1
1
1
1
Minimum
Score
0
0
0
0
0
0
Total
Score: 6
3
1
2
3
4
5
6
7
Trademarks, Related Rights, and Limitations Category
Indicators
Trademarks protection term (renewal periods)
Non-discrimination/non-restrictions on the use of brands in
packaging of different products
Ability of trademark owner to protect their trademarks: requisites
for protection
Legal measures available that provide necessary exclusive rights to
redress unauthorized uses of trademarks
Availability of frameworks that promote action against online sale
of counterfeit goods
Industrial design protection term
Availability of legal measures that provide necessary exclusive
rights to redress unauthorized use of industrial design rights
Maximum
Score
1
1
1
1
1
1
1
Minimum
Score
0
0
0
0
0
0
0
Total
Score: 7

62 Pakistan Journal of Social Issues Volume XI (2020)
4
1
2
3
Trade Secrets and Market Access Category
Indicators
Trade secrets protection
Non-barriers to market access
Regulatory as well as administrative barriers to the
commercialization of IP assets
Maximum
Score
1
1
1
Minimum
Score
0
0
0
Total
Score: 3
5
1
2
3
4
5
6
7
Enforcement Category
Indicators
Physical counterfeiting rates
Software piracy rates
Civil as well as procedural remedies
Pre-established damages or mechanisms for determining the
amount of damages generated by infringement
Criminal standards including minimum imprisonment and
minimum fines
Effective border measures
Transparency and public reporting by custom authorities regarding
trade-related IP infringement
Maximum
Score
1
1
1
1
1
1
1
Minimum
Score
0
0
0
0
0
0
0
Total
Score: 7
6
1
2
3
4
Membership and Ratification of International Treaties
Category
Indicators
WIPO internet treaties
Singapore Treaty on the law of trademarks
Patent Law Treaty
At least one free trade agreement with substantive or specific
intellectual property provisions such as chapters on intellectual
property and separate provisions on IP rights provided it was
signed after WTO/TRIPS membership
Maximum
Score
1
1
1
1
Minimum
Score
0
0
0
0
Total
Score: 4
Source: Global Intellectual Property Centre [GIPC] Index: Categories and
Indicators (2017)
In international IP index, there are 6 categories and 35 indicators. Each of the
indicators has 1 score. 1 is maximum score whereas 0 is minimum score. In this sense
35 is total score. In 2017, 5 new indicators were included in the index namely patent
opposition in category 1, industrial design protection term and legal measures
available that provide necessary exclusive rights to redress unauthorized use of
industrial design rights in category 3, regulatory and administrative barriers to the
commercialization of IP assets in category 4 and transparency and public reports by
customs authorities of trade related IP infringement in category 5.
Now, first of all, overall IP score of the mentioned countries will be observed. It
would be helpful to judge the status of intellectual property in each country. After
then, the enforcement category score will be looked at to analyze the IP
enforcement condition in each economy.

63 Pakistan Journal of Social Issues Volume XI (2020)
Table #3 GIPC International IP Index 2014-2017 Overall Economy Score
Economy 2017
(Total Score 35)
2016
(Total Score 30)
2015
(Total Score 30)
2014
(Total Score 30)
Peru 14.3 12.30 12.68 ----------------
Russia 15.5 13.06 13.54 13.28
Turkey 15.8 11.87 11.9 12.38
Argentina 10.1 8.91 9.2 9.45
Thailand 9.5 7.40 7.1 7.34
Malaysia 17.2 14.78 14.62 14.36
South
Africa 12.7 11.74 11.86 11.6
Colombia 15.2 13.77 13.67 13.66
South
Korea 28.3 23.32 23.33 -------------------
Brazil 13.2 10.41 10.86 10.83
Mexico 16.9 13.83 14.55 14.27
U.S 32.6 28.61 28.53 28.52
Singapore 28.6 25.63 25.38 25.12
Canada 21.4 18.17 17.92 17.4
Switzerlan
d 29.9 24.90 24.76 --------------------
U.K 32.4 27.53 27.61 27.59
Japan 31.3 23.34 23.26 23.24
France 30.9 27.22 27.16 27.15
Australia 27.1 24.79 24.7 24.18
New
Zealand 24.1 21.38 21.34 21.32
Source: U.S. Chamber of Commerce, GIPC International IP Index 2014-20
Table #4 GIPC International IP Index 2014-2017 Enforcement Category Score
Economy
2017
(Total
Score 7)
2016
(Total Score
6)
2015
(Total Score
6)
2014
(Total Score
6)
Peru 2.7 1.81 1.94 ------------------
Russia 2.44 1.97 2.2 1.94
Turkey 2.71 1.78 1.81 1.79
Argentina 1.57 1.78 2.07 2.07
Thailand 2.35 1.12 1.07 1.06
Malaysia 2.66 2.5 2.34 2.33
South
Africa 2.92 2.96 3.08 3.07
Colombia 3.23 2.68 2.58 2.57
South
Korea 4.92 4.73 4.49 -------------------
Brazil 3.1 2.28 2.48 2.45
Mexico 3.48 3.29 3.51 3.23
U.S 6.27 5.36 5.28 5.27
Singapore 5.03 4.89 4.64 4.63
Canada 3.11 3.24 3.09 2.82
Switzerland 5.73 4.77 4.63 ------------------
U.K 6.51 5.65 5.48 5.46
Japan 6.16 5.26 5.18 5.16
France 6.38 5.48 5.42 5.41

64 Pakistan Journal of Social Issues Volume XI (2020)
Australia 5.29 4.66 4.57 4.3
New
Zealand 4.79 4.22 4.18 4.16
Source: U.S. Chamber of Commerce, GIPC International IP Index 2014-2017
Analyzing the overall score as well as enforcement category score, it can clearly and
easily be observed that in South Korea, U.S., Singapore, Canada, Switzerland, U.K,
Japan, France, Australia, New Zealand, IP implementation mechanism is strict as
compared to other countries including Peru, Russia, Turkey, Argentina, Thailand,
Malaysia, South Africa, Colombia, Brazil and Mexico.
Impact on Socio-Economic Growth If the implementation sector of intellectual property laws is weak in a specific
country, counterfeiting and piracy sector in that country would be at higher level.
Harms (2005) observes that although regarding illegal seizure of different forms of
IP, term of counterfeiting is used, but only that term is technically accurate in
trademark area. A trademark which is not dissimilar with respect to its features from
a registered trademark, that trademark is a counterfeit trademark because it violates
the rights of the owner. The word piracy is used with regard to copyright and related
rights. If there is infringement of sound recordings, computer software, printed and
audio-visual works, it is said that offence of piracy has been committed. Through
piracy, the rights of right holder are violated because no consent is taken from the
owner.
The counterfeiting and piracy badly damage the ratio of innovation, ratio of trade
wealth, ratio of employment and on the whole ratio of socio-economic growth. Let
us observe the impact of implementation of IP laws on socio-economic growth in
context of selected countries.
In U.S Chamber of Commerce, Measuring the Magnitude of Global Counterfeiting
(2016), a lot of countries have been taken and their share in Global physical
counterfeiting has been discussed. Among those countries, we have taken only our
selected economies and discussed their share and percentage in global physical
counterfeiting.

65 Pakistan Journal of Social Issues Volume XI (2020)
Table # 5 Selected Economies’ Share of Global physical counterfeiting
Global physical
counterfeiting
$461,000,000,000
Se
ri
al
N
o.
Econ
omy
Share
(in
USD)
of
global
physic
al
counte
rfeitin
g
Percen
tage of
the
sampl
ed
econo
mies’
share
of
global
physic
al
counte
rfeitin
g
Percen
tage of
total
global
physic
al
counte
rfeitin
g
figure
1 Peru
$
1,518,
685,75
6
7.30% 0.33%
2 Russi
a
$
1,727,
389,24
4
8.30% 0.37%
3 Turk
ey
$
1,720,
857,84
2
8.27% 0.37%
4 Arge
ntina
$
1,714,
143,66
5
8.24% 0.37%
5 Thail
and
$
1,679,
629,48
9
8.08% 0.36%
6 Mala
ysia
$
1,355,
385,03
5
6.52% 0.29%
7
Sout
h
Afric
a
$
1,299,
689,38
4
6.25% 0.28%
8 Colo
mbia
$
1,207,
409,36
1
5.80% 0.26%
9
Sout
h
Kore
a
$
1,151,
431,91
4
5.53% 0.25%
20 selected economies’
share
$ 20,787,118,930

66 Pakistan Journal of Social Issues Volume XI (2020)
10 Brazi
l
$
1,079,
153,78
1
5.19% 0.23%
11 Mexi
co
$
1,022,
712,62
3
4.91% 0.22%
12 U.S
$
871,69
7,061
4.19% 0.19%
13 Singa
pore
$
858,93
8,548
4.13% 0.19%
14 Cana
da
$
804,02
4,681
3.86% 0.17%
15
Switz
erlan
d
$
611,27
4,133
2.94% 0.13%
16 UK
$
510,42
9,274
2.45% 0.11%
17 Japan
$
494,80
2,934
2.38% 0.11%
18 Franc
e
$
416,06
2,532
2.00% 0.09%
19 Austr
alia
$
398,64
2,539
1.91% 0.09%
20
New
Zeala
nd
$
344,75
9,134
1.65% 0.07%
Source: U.S Chamber of Commerce, Measuring the Magnitude of Global
Counterfeiting

67 Pakistan Journal of Social Issues Volume XI (2020)
Table # 6 Rates and Commercial Values of Unlicensed PC Software
Installations
Rates Unlicensed
Software Installation
Commercial Value of
Unlicensed Software
Seri
al
No.
Econom
y
20
15
20
13
20
11
20
09
201
5
201
3
201
1
200
9
1 Peru 63
%
65
%
67
%
70
%
$
210
$
249
$
209
$
124
2 Russia 64
%
62
%
63
%
67
%
$13
41
$26
58
$32
27
$26
13
3 Turkey 58
%
60
%
62
%
63
%
$
291
$
504
$
526
$
415
4 Argentin
a
69
%
69
%
69
%
71
%
$
554
$
950
$
657
$
645
5 Thailand 69
%
71
%
72
%
75
%
$
738
$
869
$
852
$
694
6 Malaysia 53
%
54
%
55
%
58
%
$
456
$
616
$
657
$
453
7 South
Africa
33
%
34
%
35
%
35
%
$
274
$
385
$
564
$
324
8 Colombi
a
50
%
52
%
53
%
55
%
$
281
$
396
$
295
$
244
9 South
Korea
35
%
38
%
40
%
41
%
$
657
$
712
$
815
$
575
10 Brazil 47
%
50
%
53
%
56
%
$17
70
$28
51
$28
48
$22
54
11 Mexico 52
%
54
%
57
%
60
%
$98
0
$12
11
$12
49
$10
56
12 U.S 17
%
18
%
19
%
20
%
$90
95
$97
37
$97
73
$83
90
13 Singapor
e
30
%
32
%
33
%
35
%
$29
0
$34
4
$25
5
$19
7
14 Canada 24
%
25
%
27
%
29
%
$89
3
$10
89
$11
41
$94
3
15 Switzerl
and
23
%
24
%
25
%
25
%
$
448
$46
9
$51
4
$34
4
16 U.K 22
%
24
%
26
%
27
%
$19
35
$20
19
$19
43
$15
81
17 Japan 18
%
19
%
21
%
21
%
$99
4
$13
49
$18
75
$18
38
18 France 34
%
36
%
37
%
40
%
$21
01
$26
85
$27
54
$25
44
19 Australia 20
%
21
%
23
%
25
%
$57
9
$74
3
$76
3
$55
0
20 New
Zealand
18
%
20
%
22
%
22
% $ 66 $78 $99 $63
Source: Business Software Alliance [BSA] Global Software Survey 2016

68 Pakistan Journal of Social Issues Volume XI (2020)
The ratio of installation of unlicensed software and their commercial value has been
discussed.
Table #7 Estimates of Counterfeiting and Piracy in the World Serial
No. Estimate 2013 2022 (forecast)
1
Total international trade in counterfeit and
pirated goods
$461 Billion $ 991 Billion
2
Total domestic production and consumption of
counterfeit pirated goods
$249-$456
Billion
$ 524-$ 959
Billion
3
Digital piracy in movies, music and software
- Digital piracy in film
- Digital piracy in music
- Digital piracy in software
Total value of counterfeit and pirated goods
$213 Billion
$ 160 Billion
$ 29 Billion
$ 24 Billion
$ 923 Billion-
1.13 Trillion
$384-$856
Billion
$ 289-$ 644
Billion
$ 53-$ 117
Billion
$ 42-$95 Billion
$1.90-$2.81
Trillion
4
Wider economic and social costs
- Displacement of legitimate economic
activity
- Estimated reduction in FDI
- Estimated fiscal losses
- Estimated costs of crime
Total wider economic and social costs
$470-$597
Billion
$ 111 Billion
$ 96-$ 130
Billion
$ 60 Billion
$ 737-898
Billion
$980-$ 1244
Billion
$231 Billion
$ 199-$ 270
Billion
$ 125 Billion
$1.54-$1.87
Trillion
5 Estimated employment losses 2-2.6 Million 4.2-5.4 Million
6 Foregone economic growth in OECD region
2017 $ 30 Billion-$54 Billion
Source: Frontier Economics, The Economic Impacts of Counterfeiting and piracy
An overall estimate of counterfeiting and piracy in the world has been taken.
It is important to note that the counterfeiting data in Table 5 indicates only global
distribution of counterfeit goods. It does not mention the counterfeit products which
are produced and consumed at local level. It can clearly be analyzed that in South
Korea, U.S., Singapore, Canada, Switzerland, U.K, Japan, France, Australia, New
Zealand, the implementation is strict and the counterfeiting and piracy are at lower
level whereas in Peru, Russia, Turkey, Argentina, Thailand, Malaysia, South Africa,
Colombia, Brazil and Mexico, the implementation of IP laws is weak and in this
sense, the piracy and counterfeiting are at higher level. The counterfeiting and
piracy badly damage the social and economic growth of a country.

69 Pakistan Journal of Social Issues Volume XI (2020)
The Case of Pakistan
Implementation Capacity
Under this heading, it will be judged that what is the position and status of
implementation of intellectual property laws in Pakistan? For this purpose, the study
utilizes the U.S Chamber International IP Index for the period of 2017 because
Pakistan was assessed only in 2017 report. For the construction of International IP
Index, Please see Table 2.
According to U.S. Chamber of Commerce, GIPC International IP index 2017,
overall IP score in Pakistan is 8.4 whereas the enforcement category score is 1.09.
Analyzing the overall score as well as enforcement category score, implementation
condition of IP in Pakistan can well be judged.
Impact on Socio-Economic Growth
If the implementation sector of intellectual property laws is weak in Pakistan,
obviously the counterfeiting and piracy sector in that country would be at higher
level. Counterfeiting and piracy play a great role in high rates of unemployment,
loss of trade revenues, decreased innovation and overall slower social and economic
growth.
As “Counterfeit Goods Become Serious Problem” (2014) stated that regarding size
of counterfeit drug market in Pakistan, there is no formal research or study present.
No one can say how large and big this market is. It is believed that counterfeiting
costs government over Rs.12 billion a year.
As a result of counterfeiting and trademark violation, IPRs infringement leads to
damage worth Rs.10 billion per annum in terms of direct and indirect profit (“IPR
Violation”, 2009).
Overseas Investors Chamber of Commerce & Industry (2012) observed that it is
estimated that over Rs. 21 billion is lost in Pakistan each year because of
counterfeiting, plagiarism and IP theft (Seminar on Intellectual property Rights and
Counterfeiting).
Due to counterfeit cigarette manufacturing, Pakistan suffers an annual loss of Rs. 10
billion (Counterfeit Cigarette, 2008).
Table #8 Rates and Commercial Value of Unlicensed PC Software Installations
in Pakistan
Rates Unlicensed Software
Installation
Commercial Value of Unlicensed
Software
2015 2013 2011 2009 2015 2013 2011 2009
84% 85% 86% 84% $276 $344 $278 $166
Source: BSA Global Software Survey 2016

70 Pakistan Journal of Social Issues Volume XI (2020)
It can clearly be analyzed that in Pakistan, implementation of IP laws is weak and in
this sense, the piracy and counterfeiting are at higher level. The social and economic
growth of a country is badly damaged by counterfeiting and piracy. A strong
relationship exists between implementation of IP laws and socio-economic growth.
Conclusion
Concluding the discussion, it can rightly be said that the level of implementation of
IP laws determines the level of socio-economic growth in a specific country. The
weak implementation of intellectual property laws encourages the counterfeiting
and piracy and hence causes huge losses to economic sector as well as social sector
of a country. The inference from twenty countries has been drawn and the results
reveal that IP laws implementation contributes considerably to socio-economic
growth and the influence is found to be more powerful in countries with strong
implementation of intellectual property laws. In Pakistan, the implementation ability
is unsatisfactory and accordingly socio-economic growth is at lower stage. The
powerful implementation of IP laws in Pakistan is need of the hour.
References Business Software Alliance (2016). Seizing Opportunity through License Compliance:
BSA Global Software Survey May 2016.
Counterfeit Cigarette Manufacturing: Pakistan Suffers Rs.10 Billion Loss Annually
(2008).Retrieved on 28-09-2017
fromhttp://www.pakissan.com/english/news/newsDetail.php?newsid=17361
Counterfeit Goods Become Serious Problem, 65% Consumer Products Sold in Pakistan
are Fake. (2014, September 2). Tribune International (Australia) Retrieved on 28-09-2017
from http://tribune-intl.com/65-consumer-products-sold-in-pakistan-are-fake/.
Frontier Economics (2016). The Economic Impacts of Counterfeiting and Piracy: Report
Prepared for BASCAP and INTA. Retrieved on 22-08-2017 from
https://www.inta.org/Communications/Documents/2017_Frontier_Report.pdf
Global Intellectual Property Centre Index (2017). Categories and Indicators.
Harms, L. T. (2005). The Enforcement of Intellectual Property Rights: A Case Book: World
Intellectual Property.
IPR Violation causes Loss of Billion to Government. (2009, January 14). The News.
Retrieved on 28-09-2017 from https://www.thenews.com.pk/archive/print/155695-ipr-
violation-causes-loss-of-billions-to-government.
Overseas Investors Chamber of Commerce & Industry (2012). Seminar on Intellectual
Property Rights and
Counterfeiting. Retrieved on 28-09-2017 from http://oicci.org/index.php/news/seminar-on-
intellectual-property-rights-and-counterfeiting/.
U.S. Chamber of Commerce Global Intellectual property Center (2016). Measuring the
Magnitude of Global Counterfeiting: Creation of a Contemporary Global
Measure of Physical Counterfeiting. Retrieved on 24-08-2017 from
http://www.theglobalipcenter.com/wp-content/themes/gipc/map-
index/assets/pdf/2016/GlobalCounterfeiting_Report.pdf
71 Pakistan Journal of Social Issues Volume XI (2020)
U.S. Chamber of Commerce Global Intellectual Property Center (2014). Charting the
Course, GIPC International IP Index, 2nd
Edition.
U.S. Chamber of Commerce Global Intellectual Property Center (2015). UP: Unlimited
Potential, GIPC International IP Index, 3nd
Edition.
U.S. Chamber of Commerce Global Intellectual Property Center (2016). Infinite
Possibilities, GIPC International IP Index, 4nd
Edition.
U.S. Chamber of Commerce Global Intellectual Property Center (2017). The Roots of
Innovation, GIPC International IP Index, 5nd
Edition.