implementation of six sigma program for lean manufacturing ... · pdf fileimplementation of...
TRANSCRIPT
______________________________________________________________________________________________________________
International Journal of Mechanical and Industrial Engineering (IJMIE), ISSN No. 2231 –6477, Volume-1, Issue-3, 2012
6
Implementation of Six Sigma Program for Lean Manufacturing “To reduce the rework waste in Transformer manufacturing unit by eliminating
defect of leakage from bushings in oil filled transformers”
1Anand Bhanpurkar, 2Ajay Bangar, 3Sanchay Goyal, 4Pavan Agrawal
1,2,3Maharana Pratap College of Technology, Gwalior, Madhya Pradesh, India. 4V.I.T.M. Gwalior
E-mail: [email protected] , [email protected], [email protected] , [email protected]
__________________________________________________________________________________________________
Abstract— Transformer can be said to be the power source and an important electrical device of power sector which is used to step up or step down the voltages according to the need of user. It works on the phenomenon of Mutual Induction. Oil filled Transformers get the insulation and heat transfer properties form the oil. But ironically the same oil causes one of the major defects of the transformer i.e leakage. Leakages are as old as transformers and have been a challenge to all the manufacturers. It is a highly time consuming and expensive task to arrest the leakages once occurred at the shop flor or at the site. The location for this leakage has been in most cases from the bushings where the cables or busbars are connected to draw or inject power during its use. These bushings are of different types such as porcelain or epoxy cast. This leakage is normally sealed by use of gasket material and tightening of the bushings to block the path of oil from the inside of the transformer to outside. There have been many delays in production lines due to these leakages and the resulting rework and have also caused complaints from site wherein the customer’s plant had interruption of power during the period of rectification. We have selected this problem as a project and solve it by six sigma methodology to achieve first time right sealing of bushing leakage which will eliminate production of defective parts and be a step towards Lean manufacturing in Transformers. Keywords— Six Sigma, Leakage, Bushings, Defect, Lean ___________________________________________________________________________________________________ Introduction
Subject project was undertaken at the Transformer manufacturing unit of Crompton Greaves Limited, a reputed name in Power Sector located at Malanpur Distt. Bhind, Project selection has been based on the process defects and field performance data over a period of six months. Six sigma methodology is highly effective in eliminating the root cause of a problem and bringing a breakthrough change. Six sigma method has five phases namely DMAIC. On analysis of the data using the Pareto chart, it was found that one of the major area of concern was the leakages at the shopfloor as well as at the site. To find the solution to this problem, the six sigma (DMAIC) methodology was used. A second level Pareto chart of process defects was prepared for this particular issue and various locations, components were found out. Using this information we moved to next phase of this methodology i.e. Measure, where using various tools such as Process Mapping, Cause and Effect Diagram (CED) and FMEA (Failure Mode Effect and Analysis) the probable reasons of the problem were identified. The probable reasons identified through FMEA were then funnelled using various tools of Analyse Phase such as Capability Analysis to get the critical reasons. These reasons were then worked on in Improve Phase and by continuously monitoring result when we got the solution i.e. the arrangement which would ensure first time right performance
for leakages and remove waste of rework to arrest the leakages and stoppages of production, allowing the lean manufacturing approach in transformer manufacturing. Finally, a control plan was evolved to ensure sustenance of the solution in future.
Literature Review Six Sigma has been the subject of interest to many researchers over the years. Many researchers have studied Six Sigma programs and identified many critical dimensions of six sigma programs. For example, Brue Greg; “Six Sigma For Managers, McAdam and Evans (2004) [2] for Challenge to Six Sigma in a high technology mass-manufacturing of transformers, Savolainen and Haikonen (2007) [3] for dynamics of organizational learning and continuous improvement in Six Sigma implementation. research of Antony and Banuelas (2002)[4] Key ingredients for the effective implementation of Six Sigma program., Coronado and Antony (2002)[5] for Critical success factors for the successful implementation of Six Sigma projects in organizations , Gitlow and Levine, 2005[6] for Six Sigma for Green Belts and Champions: Foundations, DMAIC, Tools, Cases, Keller (2005) [7] points out, Six Sigma programs have performance metrics and measurements based on cost, quality, and schedules ,Davison and Al-Shaghana (2007)[8] for the
Implementation of Six Sigma Program for Lean Manufacturing “To reduce the rework waste in Transformer manufacturing unit by eliminating defect of leakage from bushings in oil filled transformers”
__________________________________________________________________________________________________________________
__________________________________________________________________________________________________________________
International Journal of Mechanical and Industrial Engineering (IJMIE), ISSN No. 2231 –6477, Volume-1, Issue-3, 2012
7
link between Six Sigma and quality culture—an empirical study, Minitab software [9] for various statistical tools
Case Study This case study is undertaken at one of the leading transformer manufacturing company named CROMPTON GREAVES LTD in India. The unit produces distribution transformers ranging from 315 KVA to 40000 KVA and voltage class upto 145kV. Transformer manufacturing is an engineering industry with lot of assembly operations categorized in various sections such as winding, assembly & tanking. Our area of work is in the tanking section of transformer manufacturing. The company had a challenge to produce the transformer free from leakages at the shop floor and as well as at the site. Any leakage whether at the shopfloor or at site would pose lot of rework and interruption to the production process or to the user. For our point of view, the target of first timer right is not achieved due to such defects and the concept of Lean manufacturing to transformers cannot be applied. The company is also increasing its global footprint and needs to be cost competitive to lead the market. The increased application of Lean manufacturing can definitely help the company towards its goal. Data Collection Data is the backbone of all Six Sigma projects. We employed this concept in our study. Data of qualitative nature was collected through various documents available in form of minutes of meeting, letters, e mails, reports and studies etc. Quantitative data were collected in the form of customer complaint reports, manufacturing plans and schedules, archival records of financial data, quality performance reports, purchase orders, operational data (such as category of products produced), performance measurements (such as annual sales and responsiveness). Additional qualitative data were collected through interactions and open information exchange sessions with various interested parties such as managers, engineers, technicians and other employees. The free and fairness of our sessions enabled the capturing of the micro level details of the process and product issues related to our project. Further qualitative data were collected by observation and taking the data based decisions during the implementation. Also qualitative data were collected for the components, vendor source, process parameters, detection results, long rework hours, wastage of material, time etc. These indicated the need for further study of the process to reach to the vital few Xs affecting the Y of our project that is the issue of leakages. During the study the researcher kept a research log that documented each problem encountered during the implementation, in addition to the thoughts and insights gained during the process. We have included both porcelain type bushings to IS3347 and epoxy cast type bushings to IS2099 in our study.
Data collected is in Metric units i.e ppm (parts per million) with Base ppm of our case as 12987 and target as 5000 ppm after completion of the project. Data Analysis The researchers with their experience on the Six Sigma methodology maintained the rigour throughout the progress of their study. The preliminary data analysis in case study is the reflection by the researcher on their own experience. The researchers identified common threads by grouping and analyzing the experiences of themselves and other contributing participants. Data analysis however was the base for identifying probable root causes and prioritizing alternative solutions. In spirit, data analyses is the collection of all the relevant data in variable or attribute form, applying analysis tools and deriving meaningful information for decision making. In this study, the unit of analysis was the operational/department level where the data was generated. To understand the process and examine the flow of information through the system; we employed process mapping. Each activity in the manufacturing process is represented on a two-dimensional scale. The process steps are then connected with arrows showing the direction of service flows. These maps helped identify where process stoppages occurred, major rework areas, decision/inspection points, defect levels at intermediate stages. The researchers maintained the flavour of six sigma methodology on daily basis. They spent several hours on sharing the study objective methodology with the interested parties. They worked based on the project gantt chart and kept a close eye on the target completion of stages and milestones. All the information gathered from the experience of the experts and operational level personnel were verified against the data and only data supported ideas were taken further for implementation. Results of the ideas implemented during the current day were reviewed for performance. The results were taken through the further steps of six sigma methodology to reach the goal. The production process progressed in steps and the researchers were involved throughout the steps to capture the significant results and conclusions. Refer Process Map showing typical process mapping for production of process. Implementation of Six Sigma Methodology Our project is based on six sigma methodology which is often called as DMAIC process. This is advanced breakthrough method of identifying and resolving issues permanently and taking the processes to the next level. The improvements are not incremental in nature but are massive taking the performance levels to exponential rise. There are five phases of solving problem by DMAIC methodology as name suggests: Define phase, Measure Phase, Analysis Phase,
Implementation of Six Sigma Program for Lean Manufacturing “To reduce the rework waste in Transformer manufacturing unit by eliminating defect of leakage from bushings in oil filled transformers”
__________________________________________________________________________________________________________________
__________________________________________________________________________________________________________________
International Journal of Mechanical and Industrial Engineering (IJMIE), ISSN No. 2231 –6477, Volume-1, Issue-3, 2012
8
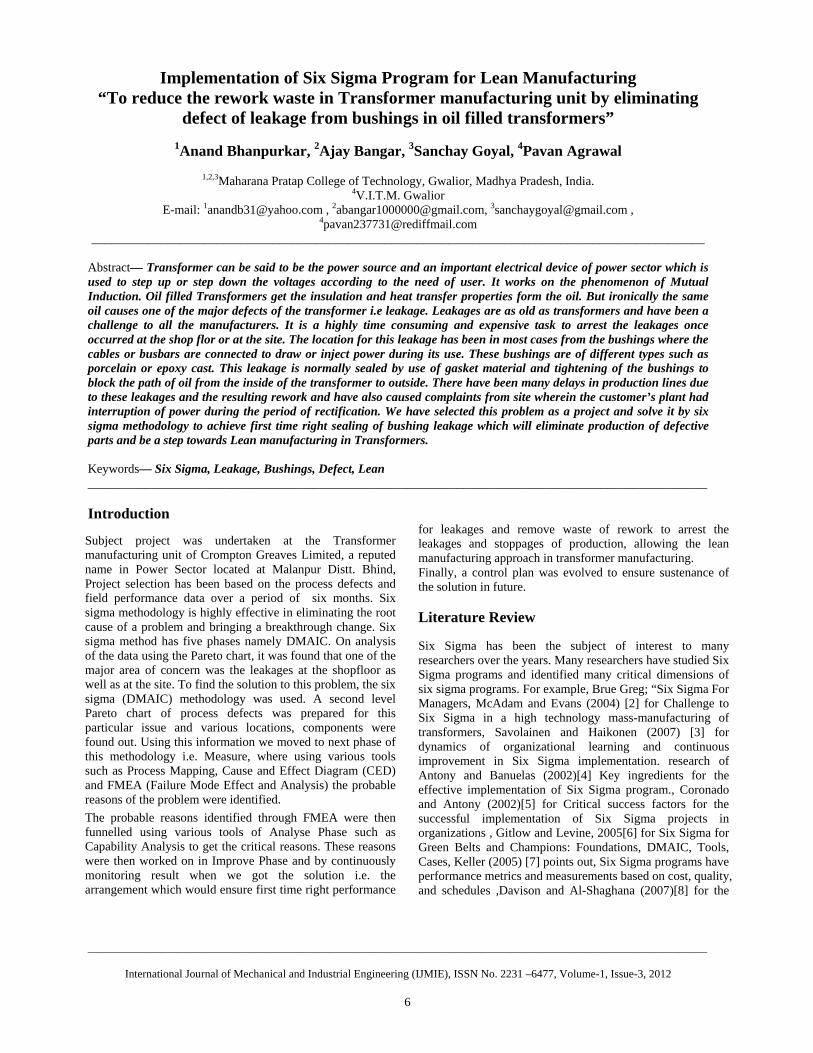
Improve phase & control phase. We will discuss each phase in relevance to our project progress. Define Phase In this phase we define problem in measurable form i.e. Leakages in transformers manufactured with base data 12987 ppm and target ppm 5000 after completing the project. For defining the problem we have collected data form customer complaints, MOM, our and vendor in-process checks etc. as mentioned in Data collection method. We prepared Pareto charts using Mintab software to define our problem. As mentioned in Graphs A, B & C below
Count 16 7 6 5 5 4 4 3Percent 32.0 14.0 12.0 10.0 10.0 8.0 8.0 6.0Cum % 32.0 46.0 58.0 68.0 78.0 86.0 94.0 100.0
Test
Vecto
r grou
p
Resis
tance
Ratio
Mismatc
h
Hardware
Al ign
ment
MBT
Leak
age
50
40
30
20
10
0
100
80
60
40
20
0
Coun
t
Perc
ent
Process Defects 2010-2011
Graph A Process Defects
C5 10 2 2 1 1Percent 62.5 12.5 12.5 6.3 6.3Cum % 62.5 75.0 87.5 93.8 100.0
Cause PRDCoverTS HandleOil gaugeBushing
18
16
14
12
10
8
6
4
2
0
100
80
60
40
20
0
Coun
t
Perc
ent
Defect Location
Graph B Location of defects
C8 8 2Percent 80.0 20.0Cum % 80.0 100.0
Type EpoxyPorcelain
10
8
6
4
2
0
100
80
60
40
20
0
Coun
t
Perc
ent
Defects by Bushing Type
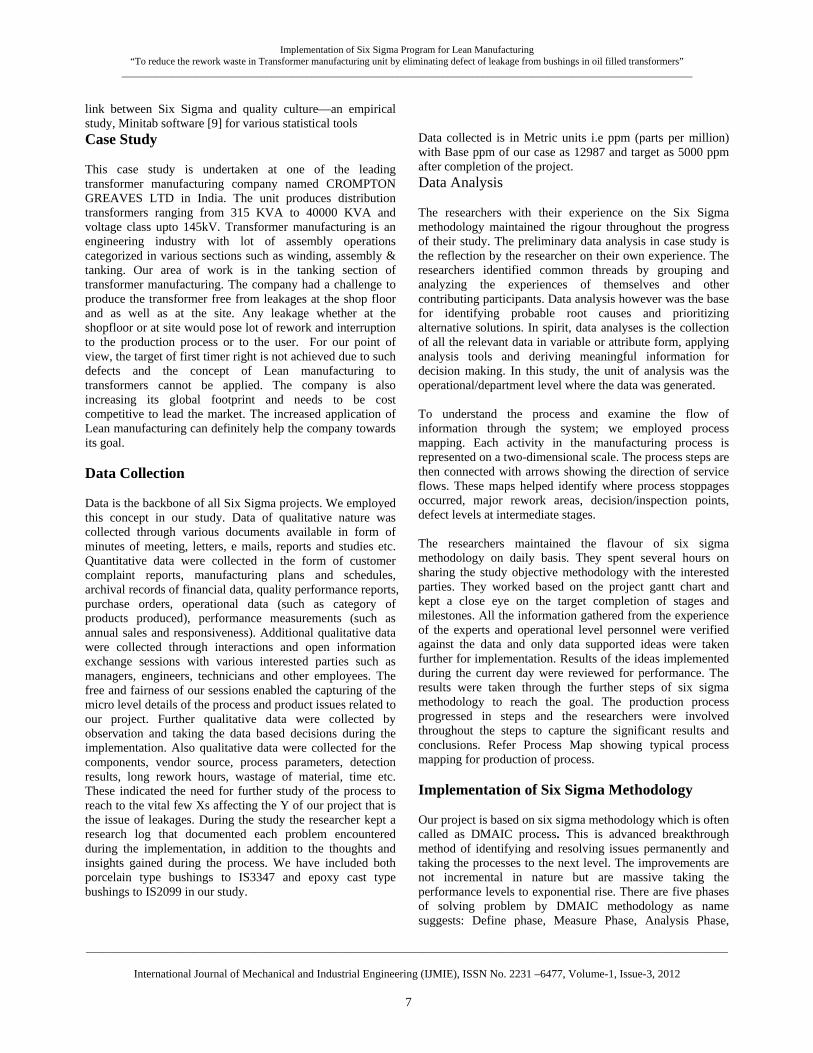
Graph C shows defects by type of bushings Measure Phase Under Measure phase, we establish the base levels of the probable many Xs contributing to the problem at the place of project. It is based on mathematical equation Y=ƒ(X). It means ‘Y’ is the function of ‘X’. i.e, Y is the desired result or may be the undesired result or problem as we see in our study in form of leakage and is dependent on various Xs means causes for leakage at various stages of the product. The causes or Xs were gathered from the inputs of cross functional team. In our case study, team members form production, quality, material department heads, executives and technicians, under guidance of Guide. Thereafter we used various six sigma tools to find the vital few causes as follows: Process Map A process map is graphic representation of a process, showing the sequence of tasks using a modified version of standard flow charting symbols. The map of a work process is a picture of how people do their work .Work process maps are similar to road maps in that there are many alternative routes that will accomplish the objective. In any given circumstance, one route may be better than others. By creating a process map, the various alternatives are displayed and effective planning [to improve the process] is facilitated. Refer Process Map which shows typical process mapping of tanking area for production of transformers.
Implementation of Six Sigma Program for Lean Manufacturing “To reduce the rework waste in Transformer manufacturing unit by eliminating defect of leakage from bushings in oil filled transformers”
__________________________________________________________________________________________________________________
__________________________________________________________________________________________________________________
International Journal of Mechanical and Industrial Engineering (IJMIE), ISSN No. 2231 –6477, Volume-1, Issue-3, 2012
9
Check Pressure drop in the gauge
Visual Check for leakage points/use
chalk powder
Shift the job to testing
Shift job to PDI
Tested OK
Yes
To production for rework
No
Inspect the job
Welding/Gasket
leak Leakage
Repair as per the procedure
Transport the job to site
Job ready for dispatch
Retighten the gasket joint and continue oil leakage test
Leakage
Shift job to PDI
Yes
No
Gasket leak
Weld leak
OUTPUTS
Job at WIP in Leak test
INPUTS SRBC Cut Gasket
Nitrile cord 8mm and 10mm
Loctite 407
Tool kit
Nitrile gasket
Oil leakage test procedure
NVA
NVA
NVA
NVA
NVA
NVA
NVA
NVA
NVA
VA
VA
Process Map Cause & Effect Diagram
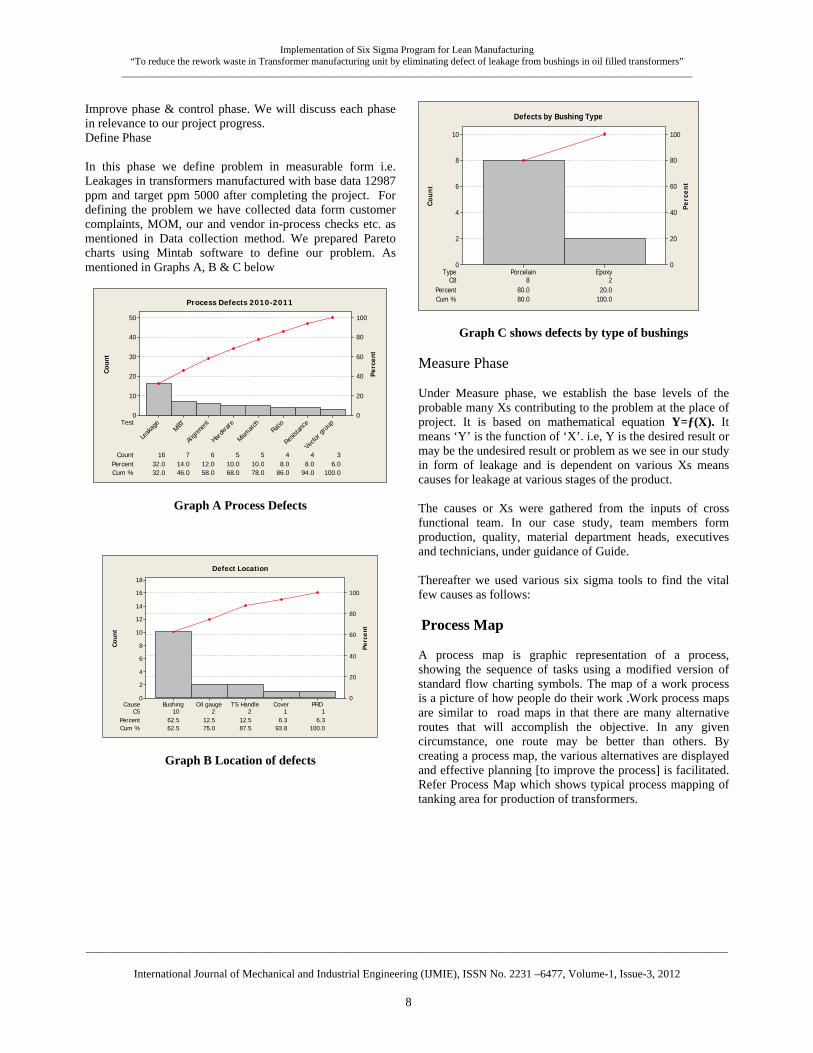
The Cause & Effect Diagram (CED), also sometimes called the ‘fishbone’ diagram, is a tool for discovering all the possible causes for a particular effect. The major purpose of the CE Diagram is to act as a first step in problem solving by generating a comprehensive list of possible causes. It can lead to immediate identification of major causes and point to the potential remedial actions or, failing this, it may indicate the best potential areas for further exploration and analysis. CE Diagrams are also often called Ishikawa Diagrams, after their inventor. By a brainstorming session various causes were gathered and placed into the relevant branch. Refer Graph D.
leakagesGasket
Method
Material
Man
Old gasket used
Not tightened the hardware
Leak test not performed
Damaged material used
Not aware of material to be used
Wrong ARP gasket dimension
Uneven surface
Wrong pressure setting of PRD
Wrong stopper rod dimension
Wrong groove dimension
Improper size of gasket
Poor bonding strength at joint
Sealing material compressibility
Sealing material hardness
Item directly mounted at site
Item not inspected
Uneven tightening
No provision for PRD locking during transit
Leakage due to cantilever loading
Gasket cut due to overtightening
Gasket cut due to threads on stem
Radiator ARP not tightened
Item not tested for leakages
Space constraint for leakage testing
Gasket joint misaligned
Cause & effect for Gasket leakages
Graph D CED for Gasket Leakages
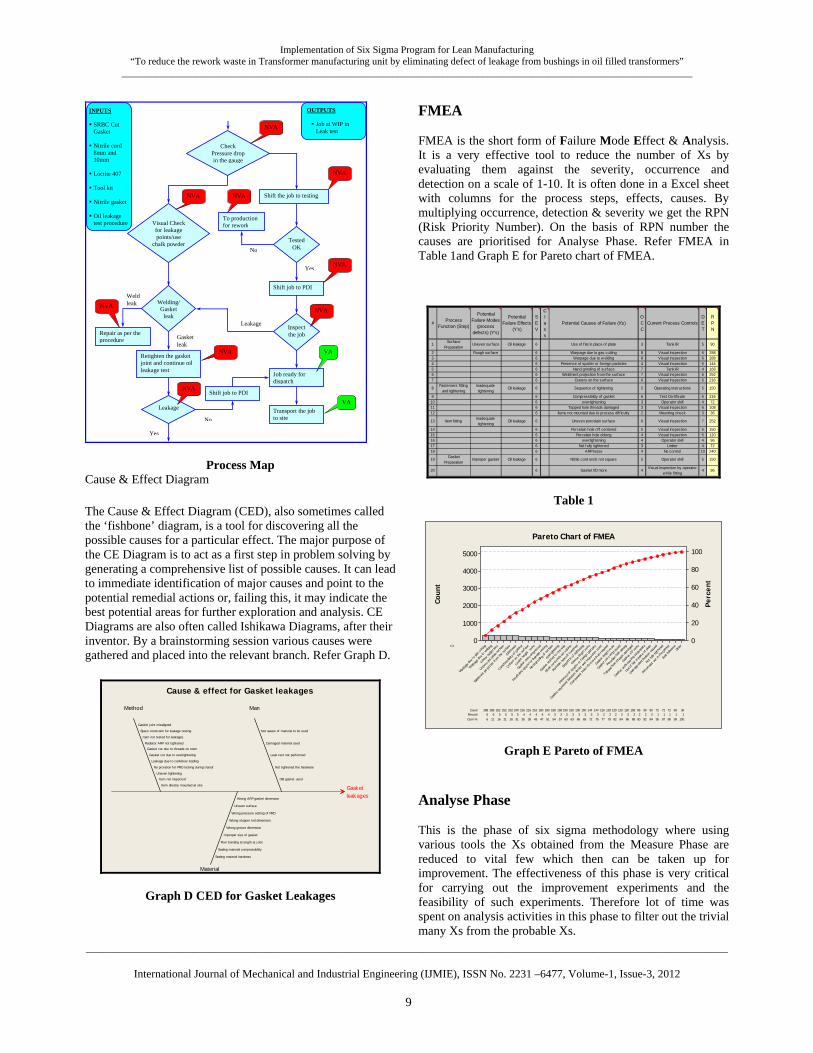
FMEA FMEA is the short form of Failure Mode Effect & Analysis. It is a very effective tool to reduce the number of Xs by evaluating them against the severity, occurrence and detection on a scale of 1-10. It is often done in a Excel sheet with columns for the process steps, effects, causes. By multiplying occurrence, detection & severity we get the RPN (Risk Priority Number). On the basis of RPN number the causes are prioritised for Analyse Phase. Refer FMEA in Table 1and Graph E for Pareto chart of FMEA.
# Process Function (Step)
Potential Failure Modes
(process defects) (Y's)
Potential Failure Effects
(Y's)
SEV
Class
Potential Causes of Failure (X's)OCC
Current Process ControlsDET
RPN
1 Surface Preparation
Uneven surface Oil leakage 6 Use of f lat in place of plate 3 Tank IR 5 90
2 Rough surface 6 Warpage due to gas cutting 8 Visual inspection 6 2883 6 Warpage due to w elding 8 Visual inspection 6 2884 6 Presence of spatter or foreign particles 4 Visual inspection 6 1445 6 Hand grinding of surface 7 Tank IR 4 1686 6 Weldment projection from the surface 7 Visual inspection 6 2527 6 Craters on the surface 6 Visual inspection 6 216
8 Fasterners fitting and tightening
Inadequate tightening
Oil leakage 6 Sequence of tightening 5 Operating instructions 5 150
9 6 Compressibility of gasket 6 Test Ceritf icate 6 21610 6 overtightening 3 Operator skill 4 7211 6 Tapped hole threads damaged 3 Visual inspection 6 10812 6 Items not mounted due to process dif ficulty 2 Mounting check 3 36
13 Item fitting Inadequate tightening
Oil leakage 6 Uneven porcelain surface 6 Visual inspection 7 252
14 6 Porcelain hole off centered 5 Visual inspection 5 15015 6 Porcelain hole oblong 4 Visual inspection 5 12016 6 overtightening 4 Operator skill 4 9617 6 Not fully tightened 3 Limiter 4 7218 6 ARP loose 4 No control 10 240
19 Gasket Preparation
Improper gasket Oil leakage 6 Nitrile cord ends not square 5 Operator skill 5 150
20 6 Gasket I/D more 4 Visual inspection by operator w hile fitting
4 96
Table 1
Count 216 180 180 168 168 150 150 150 150 144288 144 126 120 120 120 120 108 96 90 90288 72 72 72 60 36252 252 252 240 216 216Percent 4 4 4 3 3 3 3 3 3 36 3 2 2 2 2 2 2 2 2 26 1 1 1 1 15 5 5 5 4 4Cum % 43 47 51 54 57 60 63 66 69 726 75 77 79 82 84 86 88 90 92 9411 95 97 98 99 10016 21 26 31 35 39
Coun
t
Perc
ent
C1Oth
er
Bad ad
hesiv
e
Perm
enant se
t in t
he gas
ket
Not ful
ly tight
ened
Leak
age i
dent
ificati
on m
issed
Use o
f flat in
p lac
e of
plate
Gask
et en
ds pa
sting
inad
equa
te
Gask
et I/
D more
Tappe
d ho
le threa
ds da
mage
d
Porce
lain hole
oblon
g
Gaske
t not
compr
esse
d
Gask
et le
ngth
more
Com
pone
nt Hole
I/D m
ore t
han r
equired
Gaske
t squ
eeze
d be
twee
n lim
iter a
nd In
spec
tion
cove
r
Pres
e nce o
f spat
te r or f
oreign
part
icles
Groo
ve de pt
h more
Sequ
ence
of t
ighten
ing
Porce lain
hole
off c
entered
Nitrile
cord
end
s not
squa re
Gask
et sh
ifted
to o
ne si
de
overt
ighten
ing
Hand
grind
ing of
surfa
ce
Insuffc ien
t spa
ce fo
r leak
age t
est in
g
Gasket o
verc
ompres
s ed
Limite
r he igh
t more
Crate
rs on
the
surf a
ce
Compre
ssibil
ity of g
ask et
ARP l
oose
Weldm
ent p
rojec
t ion
from th
e su
rface
Uneve
n po
rcela
in su
rface
Limite
r heig
ht le
s s
Warp
age du
e to
weldin
g
Warpa
ge due
to gas
cut t
ing
5000
4000
3000
2000
1000
0
100
80
60
40
20
0
Pareto Chart of FMEA
Graph E Pareto of FMEA
Analyse Phase This is the phase of six sigma methodology where using various tools the Xs obtained from the Measure Phase are reduced to vital few which then can be taken up for improvement. The effectiveness of this phase is very critical for carrying out the improvement experiments and the feasibility of such experiments. Therefore lot of time was spent on analysis activities in this phase to filter out the trivial many Xs from the probable Xs.
Implementation of Six Sigma Program for Lean Manufacturing “To reduce the rework waste in Transformer manufacturing unit by eliminating defect of leakage from bushings in oil filled transformers”
__________________________________________________________________________________________________________________
__________________________________________________________________________________________________________________
International Journal of Mechanical and Industrial Engineering (IJMIE), ISSN No. 2231 –6477, Volume-1, Issue-3, 2012
10
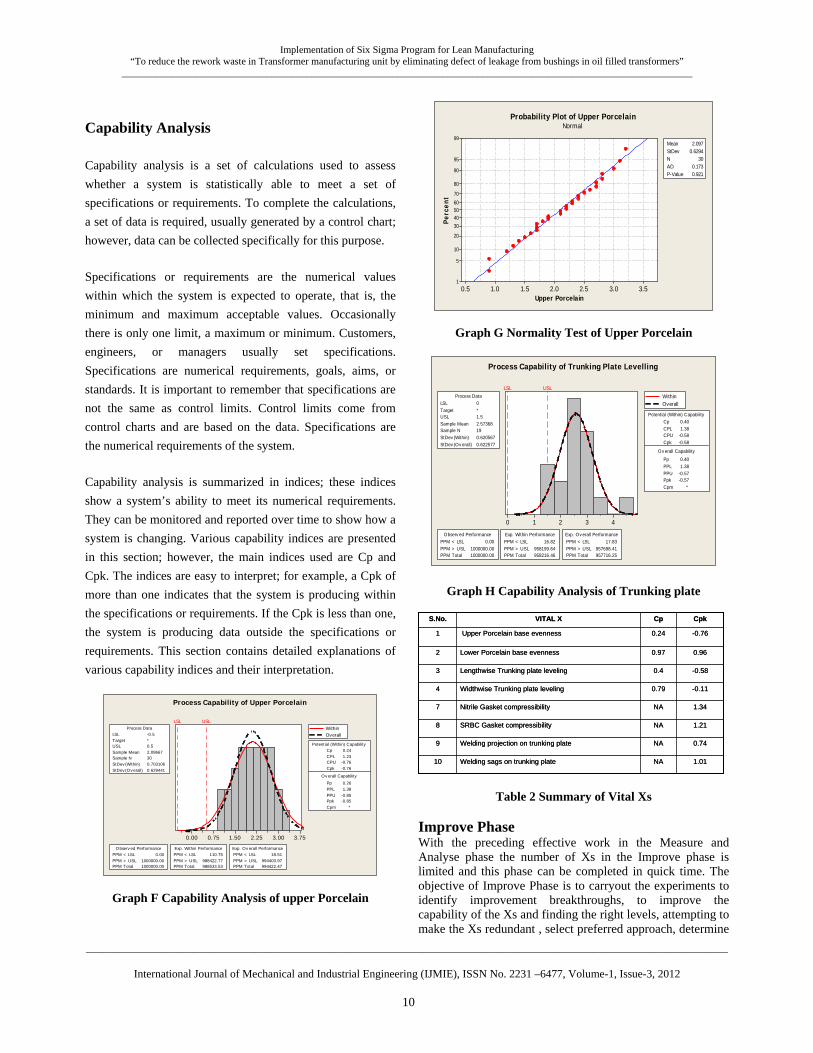
Capability Analysis
Capability analysis is a set of calculations used to assess whether a system is statistically able to meet a set of specifications or requirements. To complete the calculations, a set of data is required, usually generated by a control chart; however, data can be collected specifically for this purpose.
Specifications or requirements are the numerical values within which the system is expected to operate, that is, the minimum and maximum acceptable values. Occasionally there is only one limit, a maximum or minimum. Customers, engineers, or managers usually set specifications. Specifications are numerical requirements, goals, aims, or standards. It is important to remember that specifications are not the same as control limits. Control limits come from control charts and are based on the data. Specifications are the numerical requirements of the system.
Capability analysis is summarized in indices; these indices show a system’s ability to meet its numerical requirements. They can be monitored and reported over time to show how a system is changing. Various capability indices are presented in this section; however, the main indices used are Cp and Cpk. The indices are easy to interpret; for example, a Cpk of more than one indicates that the system is producing within the specifications or requirements. If the Cpk is less than one, the system is producing data outside the specifications or requirements. This section contains detailed explanations of various capability indices and their interpretation.
3.753.002.251.500.750.00
LSL USL
LSL -0.5Target *USL 0.5Sample Mean 2.09667Sample N 30StDev (Within) 0.703106StDev (O v erall) 0.629441
Process Data
C p 0.24C PL 1.23C PU -0.76C pk -0.76
Pp 0.26PPL 1.38PPU -0.85Ppk -0.85C pm *
O v erall C apability
Potential (Within) C apability
PPM < LSL 0.00PPM > USL 1000000.00PPM Total 1000000.00
O bserv ed PerformancePPM < LSL 110.75PPM > USL 988422.77PPM Total 988533.53
Exp. Within PerformancePPM < LSL 18.51PPM > USL 994403.97PPM Total 994422.47
Exp. O v erall Performance
WithinOverall
Process Capability of Upper Porcelain
Graph F Capability Analysis of upper Porcelain
3.53.02.52.01.51.00.5
99
95
90
80
70
60504030
20
10
5
1
Upper Porcelain
Perc
ent
Mean 2.097StDev 0.6294N 30AD 0.173P-Value 0.921
Probability Plot of Upper PorcelainNormal
Graph G Normality Test of Upper Porcelain
43210
LSL USL
LSL 0Target *USL 1.5Sample Mean 2.57368Sample N 19StDev (Within) 0.620567StDev (O v erall) 0.622577
Process Data
C p 0.40C PL 1.38C PU -0.58C pk -0.58
Pp 0.40PPL 1.38PPU -0.57Ppk -0.57C pm *
O v erall C apability
Potential (Within) C apability
PPM < LSL 0.00PPM > USL 1000000.00PPM Total 1000000.00
O bserv ed PerformancePPM < LSL 16.82PPM > USL 958199.64PPM Total 958216.46
Exp. Within PerformancePPM < LSL 17.83PPM > USL 957698.41PPM Total 957716.25
Exp. O v erall Performance
WithinOverall
Process Capability of Trunking Plate Levelling
Graph H Capability Analysis of Trunking plate
1.01NAWelding sags on trunking plate10
0.74NAWelding projection on trunking plate9
1.21NASRBC Gasket compressibility8
7
4
3
2
1
S.No.
1.34NANitrile Gasket compressibility
-0.110.79Widthwise Trunking plate leveling
-0.580.4Lengthwise Trunking plate leveling
0.960.97Lower Porcelain base evenness
-0.760.24Upper Porcelain base evenness
CpkCpVITAL X
Table 2 Summary of Vital Xs
Improve Phase With the preceding effective work in the Measure and Analyse phase the number of Xs in the Improve phase is limited and this phase can be completed in quick time. The objective of Improve Phase is to carryout the experiments to identify improvement breakthroughs, to improve the capability of the Xs and finding the right levels, attempting to make the Xs redundant , select preferred approach, determine
Implementation of Six Sigma Program for Lean Manufacturing “To reduce the rework waste in Transformer manufacturing unit by eliminating defect of leakage from bushings in oil filled transformers”
__________________________________________________________________________________________________________________
__________________________________________________________________________________________________________________
International Journal of Mechanical and Industrial Engineering (IJMIE), ISSN No. 2231 –6477, Volume-1, Issue-3, 2012
11
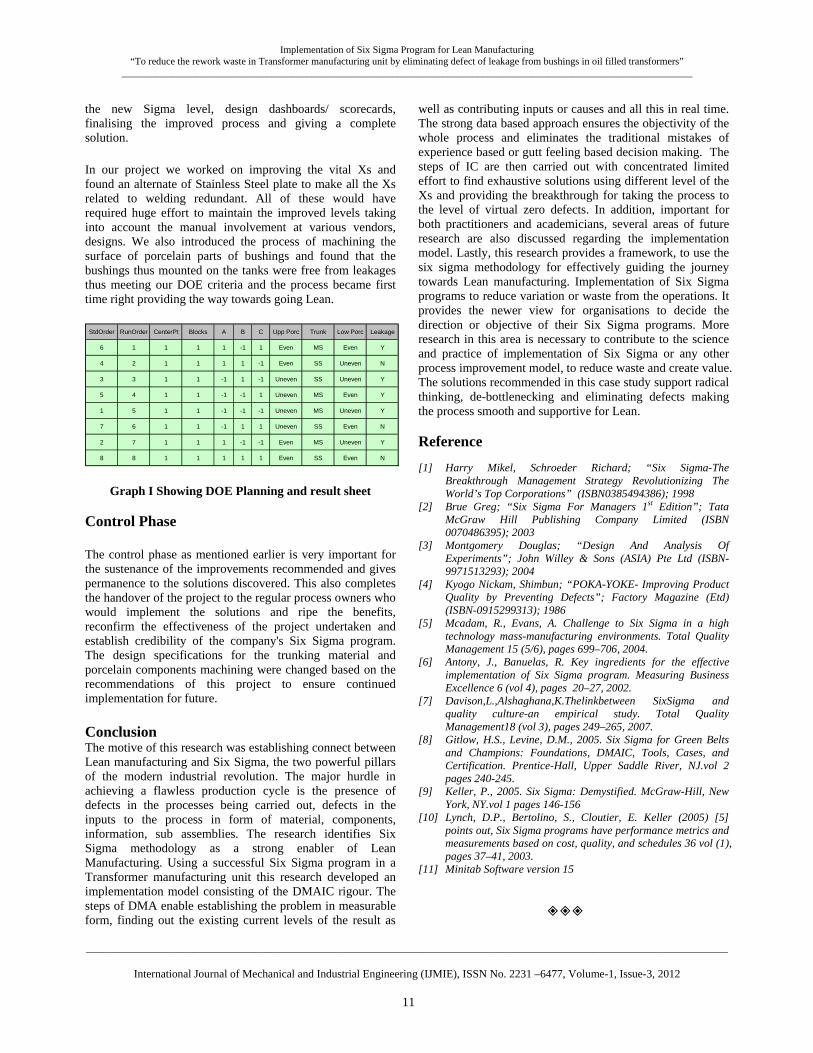
the new Sigma level, design dashboards/ scorecards, finalising the improved process and giving a complete solution.
In our project we worked on improving the vital Xs and found an alternate of Stainless Steel plate to make all the Xs related to welding redundant. All of these would have required huge effort to maintain the improved levels taking into account the manual involvement at various vendors, designs. We also introduced the process of machining the surface of porcelain parts of bushings and found that the bushings thus mounted on the tanks were free from leakages thus meeting our DOE criteria and the process became first time right providing the way towards going Lean.
StdOrder RunOrder CenterPt Blocks A B C Upp Porc Trunk Low Porc Leakage
6 1 1 1 1 -1 1 Even MS Even Y
4 2 1 1 1 1 -1 Even SS Uneven N
3 3 1 1 -1 1 -1 Uneven SS Uneven Y
5 4 1 1 -1 -1 1 Uneven MS Even Y
1 5 1 1 -1 -1 -1 Uneven MS Uneven Y
7 6 1 1 -1 1 1 Uneven SS Even N
2 7 1 1 1 -1 -1 Even MS Uneven Y
8 8 1 1 1 1 1 Even SS Even N
Graph I Showing DOE Planning and result sheet Control Phase
The control phase as mentioned earlier is very important for the sustenance of the improvements recommended and gives permanence to the solutions discovered. This also completes the handover of the project to the regular process owners who would implement the solutions and ripe the benefits, reconfirm the effectiveness of the project undertaken and establish credibility of the company's Six Sigma program. The design specifications for the trunking material and porcelain components machining were changed based on the recommendations of this project to ensure continued implementation for future.
Conclusion The motive of this research was establishing connect between Lean manufacturing and Six Sigma, the two powerful pillars of the modern industrial revolution. The major hurdle in achieving a flawless production cycle is the presence of defects in the processes being carried out, defects in the inputs to the process in form of material, components, information, sub assemblies. The research identifies Six Sigma methodology as a strong enabler of Lean Manufacturing. Using a successful Six Sigma program in a Transformer manufacturing unit this research developed an implementation model consisting of the DMAIC rigour. The steps of DMA enable establishing the problem in measurable form, finding out the existing current levels of the result as
well as contributing inputs or causes and all this in real time. The strong data based approach ensures the objectivity of the whole process and eliminates the traditional mistakes of experience based or gutt feeling based decision making. The steps of IC are then carried out with concentrated limited effort to find exhaustive solutions using different level of the Xs and providing the breakthrough for taking the process to the level of virtual zero defects. In addition, important for both practitioners and academicians, several areas of future research are also discussed regarding the implementation model. Lastly, this research provides a framework, to use the six sigma methodology for effectively guiding the journey towards Lean manufacturing. Implementation of Six Sigma programs to reduce variation or waste from the operations. It provides the newer view for organisations to decide the direction or objective of their Six Sigma programs. More research in this area is necessary to contribute to the science and practice of implementation of Six Sigma or any other process improvement model, to reduce waste and create value. The solutions recommended in this case study support radical thinking, de-bottlenecking and eliminating defects making the process smooth and supportive for Lean. Reference
[1] Harry Mikel, Schroeder Richard; “Six Sigma-The
Breakthrough Management Strategy Revolutionizing The World’s Top Corporations” (ISBN0385494386); 1998
[2] Brue Greg; “Six Sigma For Managers 1st Edition”; Tata McGraw Hill Publishing Company Limited (ISBN 0070486395); 2003
[3] Montgomery Douglas; “Design And Analysis Of Experiments”; John Willey & Sons (ASIA) Pte Ltd (ISBN-9971513293); 2004
[4] Kyogo Nickam, Shimbun; “POKA-YOKE- Improving Product Quality by Preventing Defects”; Factory Magazine (Etd) (ISBN-0915299313); 1986
[5] Mcadam, R., Evans, A. Challenge to Six Sigma in a high technology mass-manufacturing environments. Total Quality Management 15 (5/6), pages 699–706, 2004.
[6] Antony, J., Banuelas, R. Key ingredients for the effective implementation of Six Sigma program. Measuring Business Excellence 6 (vol 4), pages 20–27, 2002.
[7] Davison,L.,Alshaghana,K.Thelinkbetween SixSigma and quality culture-an empirical study. Total Quality Management18 (vol 3), pages 249–265, 2007.
[8] Gitlow, H.S., Levine, D.M., 2005. Six Sigma for Green Belts and Champions: Foundations, DMAIC, Tools, Cases, and Certification. Prentice-Hall, Upper Saddle River, NJ.vol 2 pages 240-245.
[9] Keller, P., 2005. Six Sigma: Demystified. McGraw-Hill, New York, NY.vol 1 pages 146-156
[10] Lynch, D.P., Bertolino, S., Cloutier, E. Keller (2005) [5] points out, Six Sigma programs have performance metrics and measurements based on cost, quality, and schedules 36 vol (1), pages 37–41, 2003.
[11] Minitab Software version 15