implementation of the new noaa precipitation-frequency ... · implementation of the new noaa...
TRANSCRIPT

Serving the Counties of Kenosha, Milwaukee, Ozaukee, Racine, Walworth, Washington, and Waukesha
Implementation of the New NOAA
Precipitation-Frequency Atlas for Wisconsin
1
Annette A. Humpal, P.E.
USDA – NRCS Wisconsin
Hydraulic Engineer
Michael G. Hahn, P.E., P.H.
SEWRPC Deputy Director
#223619

Serving the Counties of Kenosha, Milwaukee, Ozaukee, Racine, Walworth, Washington, and Waukesha
Overview
Review past precipitation frequency studies
Introduce NOAA Atlas 14, Precipitation-Frequency Atlas of the
United States, Volume 8, Version 2.0: Midwestern States
• Precipitation frequency information
• Temporal storm distributions
Compare precipitation frequency and temporal distribution
information from various commonly-used sources with Atlas
14
Proposed USDA Natural Resources Conservation Service
approach to applying Atlas 14
Status regarding use of Atlas 14 for regulatory projects in
Wisconsin
2

Serving the Counties of Kenosha, Milwaukee, Ozaukee, Racine, Walworth, Washington, and Waukesha
What Is a Design Storm ?
Design storm is a hypothetical distribution of rainfall over time
Individual design storms are developed for a given rainfall frequency and duration
• Storm depth for a given frequency and duration is distributed over time
Design storm is applied in a hydrologic model to estimate rates and volumes of runoff
• Generally analyze storms of several durations for a given frequency
• Results in “critical” (maximum) flow
Hydrologic model results are used to size stormwater and floodlandmanagement facilities and for determining flood hazard areas
Rainfall Distributions For Selected Storms
0
10
20
30
40
50
60
70
80
90
100
0.00 25.00 50.00 75.00 100.00
Percent of Total Storm Time (t)
Cu
mu
lati
ve P
erc
en
t o
f T
ota
l
Sto
rm R
ain
(r)
SEWRPC Intense period study (all
storms)
SEWRPC Intense Period Study (24-hour
storms or less)
Serving the Counties of Kenosha, Milwaukee, Ozaukee, Racine, Walworth, Washington, and Waukesha
Sources of Design Rainfall Estimates
1961: U.S. Weather Bureau TP-40
1990: SEWRPC
1992: Illinois State Water Survey Bulletin 71
2000: SEWRPC
2013: NOAA Atlas 14 for Midwestern States

Serving the Counties of Kenosha, Milwaukee, Ozaukee, Racine, Walworth, Washington, and Waukesha
Sources of Design Rainfall Estimates
U.S. Weather Bureau Technical Paper No. 40 (TP-40), Rainfall Frequency Atlas of the United States for Durations from 30 Minutes to 24 Hours and Return Periods from 1 to 100 Years
• Published in 1961by U.S. Weather Bureau for the continental US
• In Wisconsin, these rainfall depths were often applied with the SCS Type II time distribution

Serving the Counties of Kenosha, Milwaukee, Ozaukee, Racine, Walworth, Washington, and Waukesha
Sources of Design Rainfall Estimates
Illinois State Water Survey Bulletin 71, Rainfall
Frequency Atlas of the Midwest
• Published in 1992
• Developed for Illinois, Indiana, Iowa, Kentucky,
Michigan, Minnesota, Missouri, Ohio, and
Wisconsin
• These rainfall depths are applied with a Huff time
distribution

Serving the Counties of Kenosha, Milwaukee, Ozaukee, Racine, Walworth, Washington, and Waukesha
Sources of Design Rainfall Estimates
SEWRPC 1990
• Originally developed in 1969
• Updated in 1990 (Data from 1903-1986)
• Developed for Kenosha, Milwaukee, Ozaukee, Racine,
Walworth, Washington, and Waukesha Counties
• Design storms were developed with either the SCS
Type II or Huff distributions

Serving the Counties of Kenosha, Milwaukee, Ozaukee, Racine, Walworth, Washington, and Waukesha
Sources of Design Rainfall Estimates
SEWRPC 2000
• Developed for seven-county Southeastern Wisconsin Region using data from 1891-1998
• Rainfall depths are applied with a new time distribution for the Region
SEWRPC Technical Report No. 40, Rainfall Frequency in Southeastern Wisconsin, 2000
• Camp, Dresser & McKee Engineers
• University of Wisconsin-Madison
• SEWRPC staff
Developed rainfall depths for recurrence intervals
of 2, 5, 10, 25, 50, and 100 years
Durations of 5 minutes through 10 days

Serving the Counties of Kenosha, Milwaukee, Ozaukee, Racine, Walworth, Washington, and Waukesha
Sources of Design Rainfall Estimates
• NOAA Atlas 14, Precipitation-Frequency Atlas of the United States, Volume 8, Version 2.0: Midwestern States
• NWS is currently revising throughout the country, applying a region-by-region approach
• WDNR, WisDOT, and SEWRPCjointly funded the Wisconsin portion of the project
• Completed in 2013
9

Serving the Counties of Kenosha, Milwaukee, Ozaukee, Racine, Walworth, Washington, and Waukesha
NOAA Atlas 14
2013 NOAA Atlas 14 supersedes:
• 1961 U.S. Weather Bureau TP No. 40, 30 minutes
to 24 hour durations and RI from 1 to 100 years
• 1964 U.S. W.B. TP No. 49, Two- to 10-day durations
and RI from 2 to 100 years
• 1977 National Weather Service Hydro 35, five- to
60-minute durations
10

Serving the Counties of Kenosha, Milwaukee, Ozaukee, Racine, Walworth, Washington, and Waukesha
NOAA Atlas 14
Analyzed data from 16,227 U.S. Federal,
Environment Canada, state, and local stations
• One-day: 11,918
• One-hour: 2,657
• 15-minutes, or variable: 1,652
• In general, only stations with >= 30 years of data
were considered, but for hourly stations >= 20
years
11

Serving the Counties of Kenosha, Milwaukee, Ozaukee, Racine, Walworth, Washington, and Waukesha
NOAA Atlas 14
Low outliers were typically removed
High outliers: Compared with nearby concurrent depths, and
also reviewed observation forms, monthly reports, and
historical publications
12

Serving the Counties of Kenosha, Milwaukee, Ozaukee, Racine, Walworth, Washington, and Waukesha
NOAA Atlas 14
Parametric and non-parametric statistical tests were
made on annual mean series to evaluate climate
stationarity (Appendix 2)
Conclusion: Accepted assumption of stationarity
Research being conducted to represent IDF
relationships under non-stationary climate (ASCE
Journal of Hydrologic Engineering, October 2013)
FHWA asked NOAA to evaluate precipitation
frequency relationships applying a non-stationary
analysis method. Investigating non-stationary models.
13
Serving the Counties of Kenosha, Milwaukee, Ozaukee, Racine, Walworth, Washington, and Waukesha
NOAA Atlas 14
Precipitation frequency relationships
developed using annual maximum series
Smoothed precipitation-frequency across
durations
Converted annual maximum series to partial
duration series
14
Serving the Counties of Kenosha, Milwaukee, Ozaukee, Racine, Walworth, Washington, and Waukesha
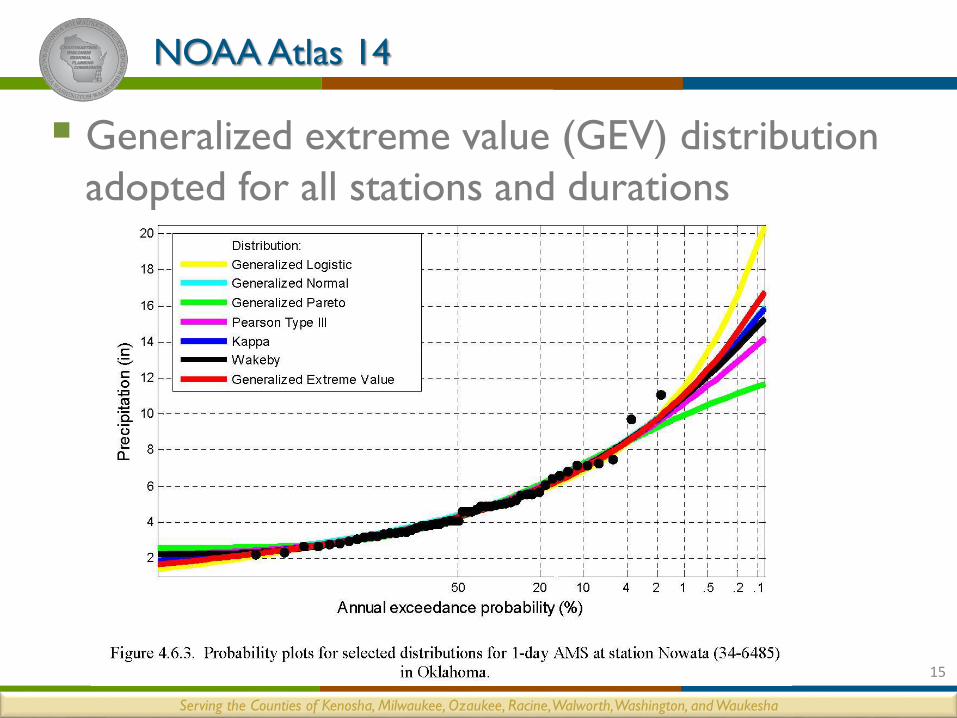
NOAA Atlas 14
Generalized extreme value (GEV) distribution
adopted for all stations and durations
15
Serving the Counties of Kenosha, Milwaukee, Ozaukee, Racine, Walworth, Washington, and Waukesha
NOAA Atlas 14: Gridded Precipitation-Frequency
Developed gridded precipitation-frequency
estimates at 30 arc-seconds resolution
Station mean annual maximum (MAM)
precipitation for 17 durations from 15 minutes
through 60 days was interpolated to produce
grid
16

Serving the Counties of Kenosha, Milwaukee, Ozaukee, Racine, Walworth, Washington, and Waukesha
NOAA Atlas 14: Gridded Precipitation-Frequency
Strong linear relationships between:
• MAM and two-year precip and
• Precip-freq relationships for consecutive frequencies
17
100-Year, 24-Hour
50-Year, 24-Hour

Serving the Counties of Kenosha, Milwaukee, Ozaukee, Racine, Walworth, Washington, and Waukesha
NOAA Atlas 14: Rain vs. Total Precipitation
Precipitation-frequency relationships were developed using both
liquid and frozen precipitation (liquid equivalent)
Trivial difference between using rain and using total precipitation
except at high altitudes in Colorado and South Dakota
18

Serving the Counties of Kenosha, Milwaukee, Ozaukee, Racine, Walworth, Washington, and Waukesha
19
Depth-duration frequency curves: Milwaukee, WI
firstgovGosubmitSubmit
Serving the Counties of Kenosha, Milwaukee, Ozaukee, Racine, Walworth, Washington, and Waukesha
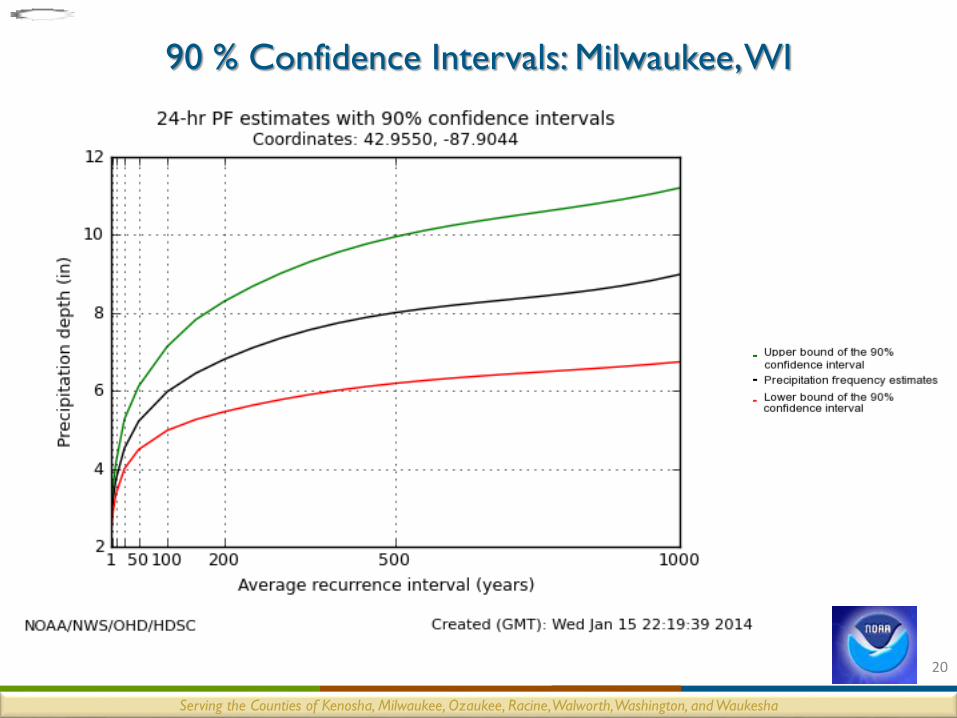
90 % Confidence Intervals: Milwaukee, WI
20
firstgovGosubmitSubmit
Serving the Counties of Kenosha, Milwaukee, Ozaukee, Racine, Walworth, Washington, and Waukesha
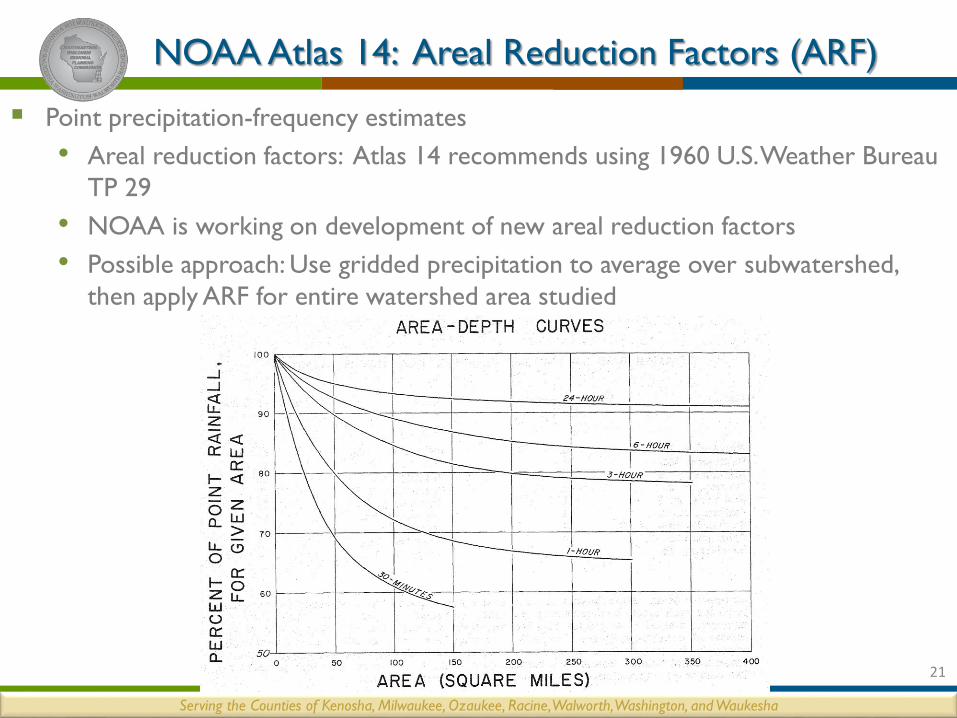
NOAA Atlas 14: Areal Reduction Factors (ARF)
Point precipitation-frequency estimates
• Areal reduction factors: Atlas 14 recommends using 1960 U.S. Weather Bureau
TP 29
• NOAA is working on development of new areal reduction factors
• Possible approach: Use gridded precipitation to average over subwatershed,
then apply ARF for entire watershed area studied
21

Serving the Counties of Kenosha, Milwaukee, Ozaukee, Racine, Walworth, Washington, and Waukesha
Rainfall Depths for Southeastern Wisconsin
Comparison of 100-year, 24-hour rain depths:• Weather Bureau TP-40: 5.44 inches
• ISWS Bulletin 71: 6.24 inches
• SEWRPC 1990: 5.50 inches
• SEWRPC 2000: 5.88 inches
• NOAA Atlas 14: ~5.8 to 6.4 inches
5 to 6 inches
6 to 7 inches
7 to 8 inches

Serving the Counties of Kenosha, Milwaukee, Ozaukee, Racine, Walworth, Washington, and Waukesha
Rainfall Depths for MMSD Planning Area
Comparison of two-year, 24-hour rain depths:• Weather Bureau TP-40: 2.6 inches
• ISWS Bulletin 71: 2.70 inches
• SEWRPC 1990: 2.4 inches
• SEWRPC 2000: 2.57 inches
• NOAA Atlas 14: 2.65 inches
2.26 to 2.50 inches
2.76 to 3.00 inches
3.01 to 3.25 inches
2.51 to 2.75 inches
Serving the Counties of Kenosha, Milwaukee, Ozaukee, Racine, Walworth, Washington, and Waukesha
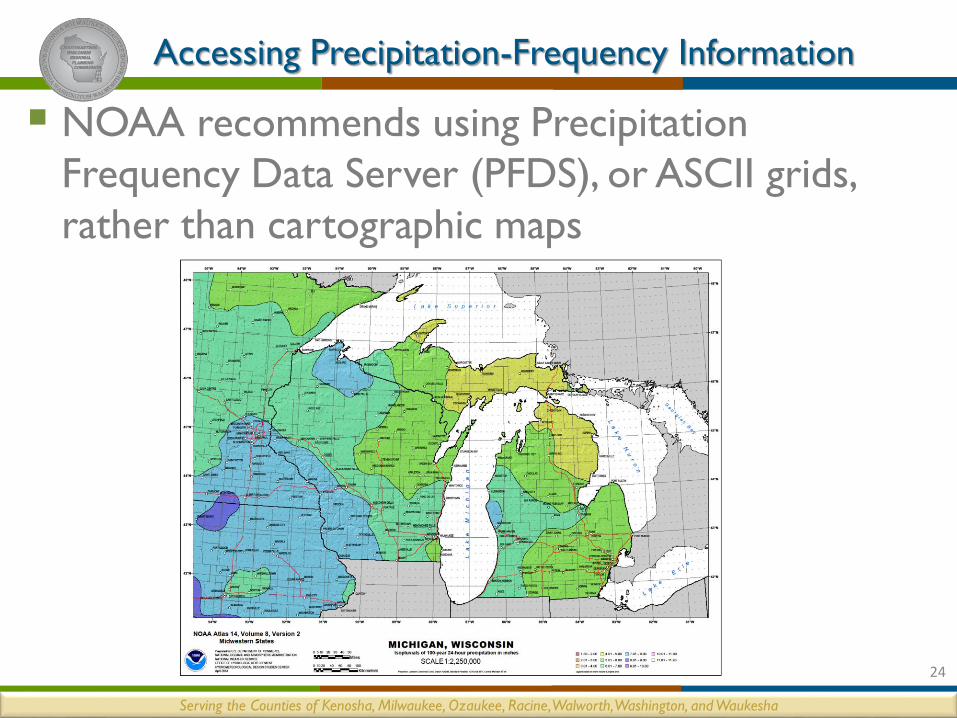
Accessing Precipitation-Frequency Information
NOAA recommends using Precipitation
Frequency Data Server (PFDS), or ASCII grids,
rather than cartographic maps
24
Serving the Counties of Kenosha, Milwaukee, Ozaukee, Racine, Walworth, Washington, and Waukesha
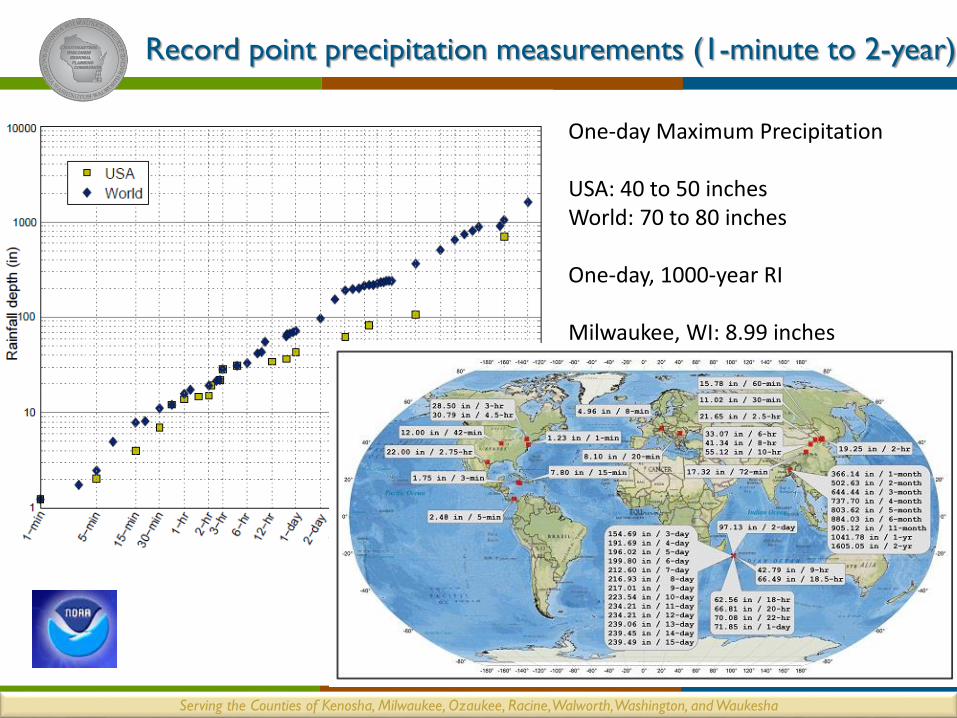
Record point precipitation measurements (1-minute to 2-year)
25
One-day Maximum Precipitation
USA: 40 to 50 inchesWorld: 70 to 80 inches
One-day, 1000-year RI
Milwaukee, WI: 8.99 inches

Serving the Counties of Kenosha, Milwaukee, Ozaukee, Racine, Walworth, Washington, and Waukesha
NOAA Atlas 14
used to estimate
probabilities of
September 2013
Colorado rainfalls1000-year, 4-day rain is
about 8 inches. Observed
4-day rain (13” to14”) is
at upper bound of 90%
confidence interval
for 1000-year R. I. 26

Serving the Counties of Kenosha, Milwaukee, Ozaukee, Racine, Walworth, Washington, and Waukesha
USDA - NRCS Implementation of NOAA Atlas 14 in Wisconsin
Annette Humpal, P.E.USDA – NRCSHydraulic EngineerAn Equal Opportunity
Provider and Employer
Serving the Counties of Kenosha, Milwaukee, Ozaukee, Racine, Walworth, Washington, and Waukesha
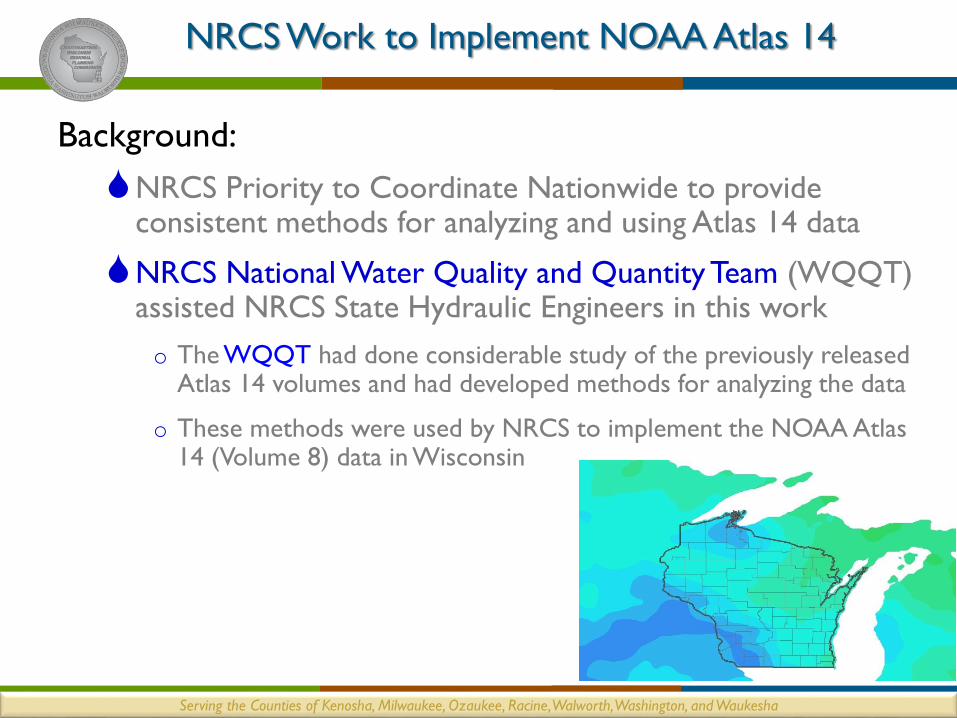
Background:
NRCS Priority to Coordinate Nationwide to provide consistent methods for analyzing and using Atlas 14 data
NRCS National Water Quality and Quantity Team (WQQT) assisted NRCS State Hydraulic Engineers in this work
o The WQQT had done considerable study of the previously released Atlas 14 volumes and had developed methods for analyzing the data
o These methods were used by NRCS to implement the NOAA Atlas 14 (Volume 8) data in Wisconsin
NRCS Work to Implement NOAA Atlas 14

Serving the Counties of Kenosha, Milwaukee, Ozaukee, Racine, Walworth, Washington, and Waukesha
NRCS Atlas 14 Work at a National and State Level:
Analyzed the Atlas 14 data using GIS
o Developed Generalized Precipitation Depths by County and Storm Frequency
o Developed NRCS Temporal Storm Distributions
Developed precipitation databases (of depths and temporal storm distributions) by County for use in the NRCS hydrology computer programs
NRCS Work to Implement NOAA Atlas 14

Serving the Counties of Kenosha, Milwaukee, Ozaukee, Racine, Walworth, Washington, and Waukesha
NRCS Analyzed the NOAA Atlas 14 data :
• Used GIS to analyze the Atlas 14 grid data and develop mean precipitation depths by County and storm frequency (1-yr through 500-yr) for the 24-hr duration
• Representative Locations were selected for each WI County from the Atlas 14 grid data. The Atlas 14 precipitation depths at each selected County representative (point) location are:
− Equal to the County Mean for the 100-year, 24-hour Event
−Within -1.0% and +1.9% (within 1 standard deviation) of the County Means for the 1-year through 50-year, 24 hour events
• Precipitation Depths for representative County locations were used in NRCS Hydrology Program Databases
• The intent of the “representative locations” is to prepare for future GIS capability of NRCS Hydrology programs
NRCS Development of Precipitation Depths by County

Serving the Counties of Kenosha, Milwaukee, Ozaukee, Racine, Walworth, Washington, and Waukesha
Change in Precipitation Depth From TP40 to NOAA Atlas 14 (Rep. Loc.)
10-Year, 24-hour (Percent)
-8.5 to -7.5-7.5 to -5.0-5.0 to -2.5-2.5 to -0.010.00.01 to 2.52.5 to 5.05.0 to 7.5
Waupaca County:TP40: 3.90”
Atlas 14 (Mean): 3.57”Atlas 14 (Rep. Loc.): 3.60”
Decrease (at Rep. Loc.): 7.7%
Iron County:TP40: 3.80”
Atlas 14 (Mean): 4.03”Atlas 14 (Rep. Loc.): 4.05” Increase (Rep. Loc.): 6.6%
TP40 Versus NOAA Atlas 14 Precipitation Depths
10-Yr, 24-Hr Precipitation Depths
Percent Change From TP40 to NOAA Atlas 14 (Representative Location)

Serving the Counties of Kenosha, Milwaukee, Ozaukee, Racine, Walworth, Washington, and Waukesha
TP40 Versus NOAA Atlas 14 Precipitation Depths
00.01 - 5
5 – 1010 – 1515 – 2020 – 2525 – 3030 – 3535 – 40
100-Yr, 24-Hr Precipitation Depths
Percent Change From TP40 to NOAA Atlas 14 (Representative Location)
Shawano County:TP40: 5.40”
Atlas 14 (Rep. Loc. = Mean): 5.40”No Change
Ashland County:TP40: 5.40”
Atlas 14 (Rep. Loc. = Mean): 7.37”Increase 36.5%
Change in Precipitation Depth From TP40 to NOAA Atlas 14 (Rep. Loc.)
100-Year, 24-hour (Percent)
Grant County:TP40: 6.20”
NOAA Atlas 14: 7.69”Increase 24.0%

Serving the Counties of Kenosha, Milwaukee, Ozaukee, Racine, Walworth, Washington, and Waukesha
TP40 Versus NOAA Atlas 14 Precipitation Depths
100-Yr, 24-Hr Precipitation Depths
Percent Change From TP40 to NOAA Atlas 14 (Representative Location)
Shawano County:TP40: 5.40”
Atlas 14 (Rep. Loc. = Mean): 5.40”No Change
Ashland County:TP40: 5.40”
Atlas 14 (Rep. Loc. = Mean): 7.37”Increase 36.5%
Grant County:TP40: 6.20”
NOAA Atlas 14: 7.69”Increase 24.0%
Ozaukee County:TP40: 5.40”
NOAA Atlas 14: 6.38”Increase 18.1%

Serving the Counties of Kenosha, Milwaukee, Ozaukee, Racine, Walworth, Washington, and Waukesha
From their analysis of the previously completed NOAA Atlas 14, Volumes,
the NRCS WQQT concluded …
The NRCS Type II Storm distribution should not be used with NOAA Atlas 14
precipitation depths.
The use of rainfall distributions that cover large geographic regions (such as Type II),
could lead to over- or under-estimation of peak discharge
Development of NRCS Temporal Distributions

Serving the Counties of Kenosha, Milwaukee, Ozaukee, Racine, Walworth, Washington, and Waukesha
The NRCS WQQT developed a procedure Using ArcGIS 10.0 for deriving temporal storm distributions for a wide range of climate conditions (tropical to arctic) which occur in the US.
Development of NRCS Temporal Distributions
Developed temporal storm distribution
Regions for MW and SE US (Atlas 14
Volumes 7 and 8)
The distribution Regions were
titled MSE (e.g. MSE1 to MSE6),
since they were developed for
the MW and the SE US
Based on ratios of the Atlas 14
(25-yr, 1-hr)/(25-yr, 24-hr)
precipitation depths
MSE6
MSE5
MSE4
MSE3
MSE2
MSE1

Serving the Counties of Kenosha, Milwaukee, Ozaukee, Racine, Walworth, Washington, and Waukesha
Tentative Storm Distribution Regions
Less Intense
More Intense
~Type II
5
4
4
3
3
2
3
4
3
NRCS WQQT Storm Distribution Regions - WI
Simplifying to follow County
Boundaries for use in NRCS
Hydrology Computer Programs…
MSE5
MSE4
MSE3
MSE2
Serving the Counties of Kenosha, Milwaukee, Ozaukee, Racine, Walworth, Washington, and Waukesha
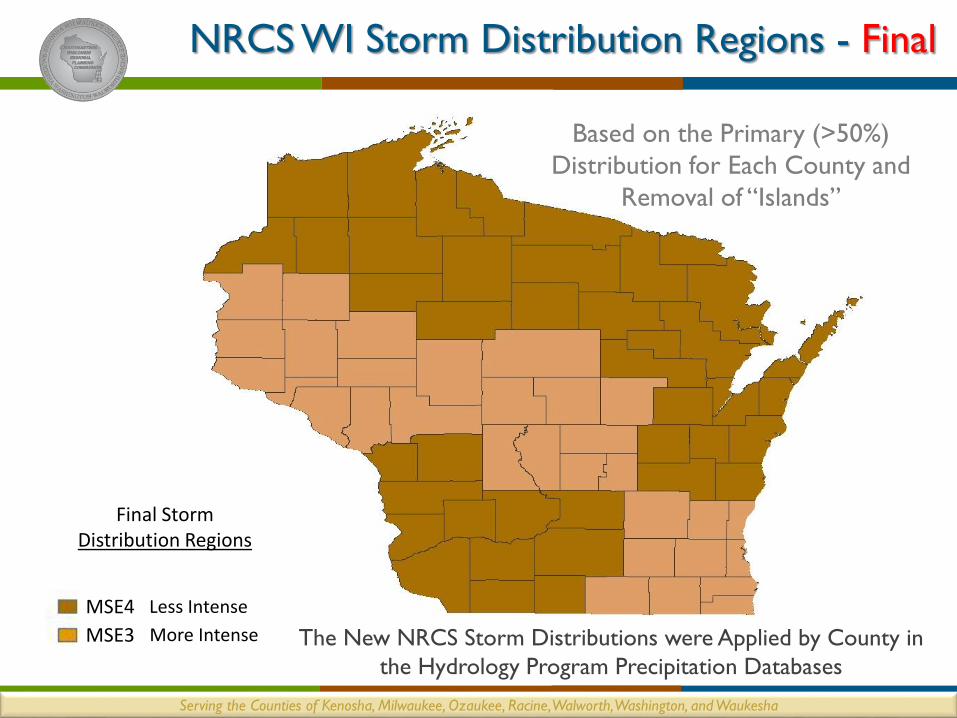
NRCS WI Storm Distribution Regions - Final
Based on the Primary (>50%)
Distribution for Each County and
Removal of “Islands”
Less Intense
More Intense
Final Storm Distribution Regions
The New NRCS Storm Distributions were Applied by County in
the Hydrology Program Precipitation Databases
MSE4
MSE3

Serving the Counties of Kenosha, Milwaukee, Ozaukee, Racine, Walworth, Washington, and Waukesha
NRCS Temporal Distributions are:
• Usually 24-hours in Duration – applicable to Watersheds with Tc < 24 hours
• Developed by nesting precipitation depths for all durations (5-min through 24-hr)
• Most intense (5 min) is centered at 12 hrs
• Intended to be conservative for design purposes
• Not intended to duplicate actual storm distributions

Serving the Counties of Kenosha, Milwaukee, Ozaukee, Racine, Walworth, Washington, and Waukesha

Serving the Counties of Kenosha, Milwaukee, Ozaukee, Racine, Walworth, Washington, and Waukesha
How will the New NRCS Storm Distributions Impact
Computed Peak Discharge Values?
NRCS WQQT New Storm Distributions

Serving the Counties of Kenosha, Milwaukee, Ozaukee, Racine, Walworth, Washington, and Waukesha
4
4
3
4
3
NRCS WQQT New Storm Distributions
Impact on Peak Discharge – Initial findings
NRCS Distribution
Change in Peak Discharge Versus for Type II Distribution
MSE3MSE4
~12% Increase~2% Increase
Less Intense
More Intense
Final Storm Distribution Regions
4

Serving the Counties of Kenosha, Milwaukee, Ozaukee, Racine, Walworth, Washington, and Waukesha
NRCS Plans in Neighboring States?
Tentative Storm Distribution Regions
~Type II
Minnesota tentatively plans to have All MSE3
Iowa – Currently on Hold, but eventually plans to have 2 Regions (MSE3 and MSE4)
Michigan – No current plans
Illinois – Type II (With Bulletin 71 Precipitation Depths)
(More Intense)
(Less Intense)
Proposed Temporal Storm Distributions
MSE3
MSE4
MSE5
Serving the Counties of Kenosha, Milwaukee, Ozaukee, Racine, Walworth, Washington, and Waukesha
Transitioning to Atlas 14 Data Use
As of January 2015 NRCS WI Engineers are using NOAA Atlas 14
precipitation data for all new projects.
NRCS Wisconsin Atlas 14 Data is available Online on the NRCS
WI Hydrology Hydraulics Webpage:
Google “NRCS Wisconsin Hydrology Hydraulics”
Or http://www.nrcs.usda.gov/wps/portal/nrcs/main/wi/technical/engineering/
Serving the Counties of Kenosha, Milwaukee, Ozaukee, Racine, Walworth, Washington, and Waukesha
Transitioning to Atlas 14 Data Use
The Following updates are available on the NRCS WI Hydrology
Hydraulics Webpage:
• Updated NRCS WI Hydrology (EFH2 and TR55) spreadsheets
• WI Supplement to the NEH Part 650, Chapter 2 - information about the
precipitation updates
• New NRCS storm distribution data non-dimensional form (in spreadsheet)
including applicable storm distribution to use by WI County
• Additional NRCS WI Spreadsheets with updated precipitation data

Serving the Counties of Kenosha, Milwaukee, Ozaukee, Racine, Walworth, Washington, and Waukesha
Transitioning to Atlas 14 Data Use
The Following updates are available on the NRCS WI Hydrology
Hydraulics Webpage (Continued):
• Wisconsin Precipitation and Soils Data files for the EFH2 (National NRCS
Hydrology Program)
• Coming Soon - Links to the National NRCS Hydrology Programs (EFH2,
WinTR-55, WinTR-20?) with updated precipitation databases - When
available, “New” will be included next to the link from the WI webpage

Serving the Counties of Kenosha, Milwaukee, Ozaukee, Racine, Walworth, Washington, and Waukesha
Temporal Distributions
For studies to delineate regulatory floodplain limits, WDNR
will accept peak flow determinations applying 1) the new
NRCS distributions with Atlas 14 precipitation, or 2) critical
duration analyses with Atlas 14 precipitation and:
• The WDNR State distribution or
• The SEWRPC 2005 distribution for the Southeastern Wisconsin
Region
WDNR will not accept Atlas 14 precipitation with the NRCS
Type II distribution
WDNR will no longer accept TP 40/NRCS Type II for studies
initiated on March 1, 2015, or later, but they will accept that
methodology for studies initiated before March 1, or study
proposals submitted before March 1 46