implementation of water safety plan for a large-piped water supply system
TRANSCRIPT

Implementation of water safety plan for a large-piped watersupply system
Anisha Nijhawan & Priyanka Jain &
Aabha Sargaonkar & Pawan Kumar Labhasetwar
Received: 31 August 2013 /Accepted: 30 April 2014# Springer International Publishing Switzerland 2014
Abstract Awater safety plan for the city of Nagpur wasdeveloped by the National Environmental EngineeringResearch Institute (NEERI) and Nagpur MunicipalCorporation (NMC). Possible hazards were identifiedthrough field visits. Based on this, an improvement planwas drawn up to suggest corrective actions and a timeframe for implementation. The findings of this study arebeing used to modify or repair components of the watersupply system and upgrade management procedures.This paper highlights the lessons learnt during imple-mentation of the WSP and the key challenges faced.
Keywords Contamination . Drinking water .
Intermittentwater supply .Risk assessment .Water safety
AbbreviationsCFU Colony-forming unitESR Elevated service reservoir
GI Galvanized ironGIS Geographic Information SystemsGSR Ground level service reservoirHACCP Hazard analysis critical control pointHDPE High-density polyethyleneMBR Master balancing reservoirMDPE Medium-density poly ethyleneMLD Million liters per dayMPN Most probable numberNEERI National Environmental Engineering
Research InstituteNGO Non-government organizationNMC Nagpur Municipal CorporationNRW Non-revenue waterSOP Standard operating procedureTDS Total dissolved solidsWHO-SEARO World Health Organization South
East Asia Regional OfficeWSP Water safety planWTP Water treatment plant
Introduction
The World Health Organization (WHO) Guidelines forDrinking Water Quality (Third Edition) describe watersafety plans (WSPs) as the most effective means ofensuring the safety of a drinking water supply (WHO2004). This concept draws from traditional multiple-barrier risk management techniques and the hazard anal-ysis critical control point (HACCP) approach, which has
Environ Monit AssessDOI 10.1007/s10661-014-3802-x
A. Nijhawan : P. Jain : P. K. Labhasetwar (*)Water Technology & Management Division, NationalEnvironmental Engineering Research Institute,Nagpur, Indiae-mail: [email protected]
A. Nijhawane-mail: [email protected]
P. Jaine-mail: [email protected]
A. SargaonkarEnvironmental Systems Design & Modelling Division,National Environmental Engineering Research Institute,Nagpur, Indiae-mail: [email protected]

been applied in the food manufacturing industry forseveral decades (Davison et al. 2005). Havelaar (1994)proposed that the HACCP approach could be applied todrinking water systems. Since then, it has been used bywater utilities in the USA (Barry et al. 1998), Australia(Deere and Davison 1998), Iceland (Gunnarsdóttir andGissurarson 2008) and Switzerland (SWGIA 2003). Casestudies document increased compliance with drinkingwater quality regulations (Gunnarsdóttir andGissurarson 2006) and reduced cost of operation(Davison et al. 2005) as a result of implementingHACCP. The WSP approach has been developed basedon these experiences.
Developing a WSP involves undertaking risk assess-ment and identifying hazards at each step of the drinkingwater supply from catchment to consumer (WHO2004). Over the last decade, WSPs have gained accep-tance as an important framework for achieving waterquality and health-based targets. WSPs can be devel-oped for any type of water supply system, piped- orcommunity-based. Public water utilities in Australia,UK, Latin America and the Caribbean (Bartram et al.2009), Bangladesh (Mahmud et al. 2007) and Uganda(Howard et al. 2005) have successfully developed andimplemented WSPs for their water supply systems.
Until now the experience with WSPs in developingcountries is limited to small systems serving less than amillion people (Howard et al. 2005; Mahmud et al.2007). Davison et al. (2005) suggested a set of ‘modelwater safety plans’ for common water supplytechnologies used in small systems in developingcountries. Godfrey and Howard (2004) documentedthe WSP approach with certain alterations to overcomethe challenges likely to be faced in developing countries.
In this paper, a case study of implementing aWSP fora large piped-water supply in a developing country ispresented. Urban water supply in India is characterizedby intermittent supply, high rates of non-revenue water(NRW) and poor maintenance. Due to ageing infrastruc-ture and inefficient operation of the water supply sys-tem, municipal water works’ departments in cities arenot able to prevent water losses, especially within thedistribution network. This causes an imbalance betweenthe supply and demand of water, thus leading to inter-mittent supply hours. Past research has shown that watersupply coverage in 28 cities ranged from 9.3 to 99.5 %;NRW was from 6 to 72.9 % and continuity of supplyvaried from 0.5 to 18 h a day (MoUD 2009). Watersamples from only 39 out of 423 cities qualified all three
tests conducted to check water quality in the household:turbidity, residual chlorine and thermo-tolerant coli-forms (MoSPI 2010).
Methodology
Study area
Nagpur is the largest city in Central India (Fig. 1a), witha population of about 2.5 million (Ministry of HomeAffairs 2011). Nagpur serves as an example for under-standing the challenges in implementing the WSP in acomplex water distribution system with an intermittentwater supply. There are a large number of unregisteredconnections and low cost recovery. The drinking watersupply system in Nagpur City is managed by the WaterWorks Department of Nagpur Municipal Corporation(NMC). It is responsible for operating water treatmentplants and the storage and distribution of drinking water.
The city is divided into ten administrative zones forease of operation and maintenance of infrastructurefacilities such as water supply and waste collection aswell as for the purpose of local governance. Two zones,zone 2 (Laxminagar) and zone 4 (Dhantoli), were se-lected for this study (Fig. 1b). These zones have a wideeconomic parity within the community from high- tolow-income households.
Development plan
The approach for developing the WSP was based on theguidance of WHO experts and the Water Safety PlanManual (Bartram et al. 2009). The approach was modi-fied to deal with specific problems found in the Nagpurdrinking water supply system such as intermittent supply,limited data availability, unplanned development andlack of consumer awareness. The present study attemptsto develop a WSP that addresses these challenges bymodifying certain steps and putting increased focus onsupporting programmes and the role of NGOs. However,these issues are common to several developing countries.Therefore, the information presented in this paper couldprove useful to practitioners facing similar challenges.
Formation of the WSP team
The WSP team consisted of officials from a researchagency (NEERI), the local municipal authority (NMC)
Environ Monit Assess

a
b
Fig. 1 a Location of Nagpur City. b Water supply zones of Nagpur City (source: NMC Water Works Department)
Environ Monit Assess

and an NGO. The support of local authorities was re-quired for collection of baseline water quality data,maintenance of water distribution network and impro-visation to the existing systems.
System assessment
Figure 2 shows the schematic of Nagpur water supplywhich includes three raw water sources, five watertreatment plants (WTPs), three master balancing reser-voirs (MBRs) and forty-three service reservoirs—ele-vated (ESRs) and ground level (GSRs). In all, theWTPssupply 513 MLD water through 2,100 km of pipeline to225,000 metered connections.
The study area (zones 2 and 4) receives treated waterfrom each of the fiveWTPs through twoMBRs and fiveESRs. Baseline assessment of water quality data wascarried out in March 2011 by collecting samples fromraw water sources, WTP intake points, WTP outlets,
MBRs and ESRs. Sample collection methods given inBIS (1991) were followed. Samples were tested andanalysed for pH, TDS, hardness and faecal coliformsaccording to standard methods (APHA et al. 2005).Water quality data records for the previous 3 years werealso analysed.
Additionally, a household sanitary survey was con-ducted in 97 randomly selected households in fourlocalities in the study area. The survey locations aredescribed in Table 1. The survey study was designedbased on the criteria for safe storage given by the Centrefor Disease Control and Prevention (CDC) and theInternational Scientific Forum on Home Hygiene(IFH) (CDC 2003; Nath et al. 2006).
Hazard identification
Hazard identificationwas done for the catchment area, rawwater sources, water treatment plant and distribution
Fig. 2 Schematic of Nagpur water supply system
Environ Monit Assess

network to household storage conditions. Hazard identifi-cation for the catchment, raw water sources and treatmentplants can be elucidated easily; however, hazard identifi-cation in the distribution network and household is morecomplex. Hazards within the catchment area were identi-fied based on the visits by theWSP team to each rawwatersource, land use patterns and satellite images. Hazardswithin the treatment plant were identified with the helpof treatment plant operators and NMC officials.Likelihood and consequences for each identified hazardwere determined based on the visits, prior experience andprevious available data.
Within the distribution network, hazards were iden-tified by reviewing the condition of pipes, MBRs andESRs, maintenance schedules and experiences of thefield engineers and maintenance personnel. The com-plete distribution network was mapped using GIS. Zone2 has been represented in two maps owing to its size(Fig. 3a, b), while zone 4 is represented in Fig. 3c. Paststudies have stressed the importance of risk mapping inassessing variability in the nature of hazards within thedistribution network (Howard et al. 2005). These mapshelped to identify ‘high risk’ points where contamina-tion may occur due to crisscrossing of water pipes withsewer lines or open drains due to improper layout.
A household sanitary survey was also carried out todetermine common water handling practices and whateffect these have, if any, on water quality post-collection. Information about occurrence of water-borne diseases was also collected. Tap and stored watersamples were collected to monitor residual chlorinelevels and identify risk of microbial contamination inthe household. Presence of faecal coliform was deter-mined by membrane filtration test using m-FC agar. Thehousehold samples were analysed for physico-chemicalparameters using standard methods (APHA et al. 2005).
Risk assessment
A risk matrix was developed based on the semi-quantitative risk prioritization approach (Deere et al.
2001). The likelihood and consequence of each hazardwas identified based on field visits, expert opinion, pub-lished records and experience of the field engineers andoperators. Each hazard was scored according to the like-lihood of occurrence and consequence in terms of health-based targets and compliance with regulations as de-scribed in Table 2. Residual risk score was generatedbased on individual scores and existing control measures.
Identification and validation of control measures
Control measures are steps taken to ensure that thequality of water in the distribution system consistentlymeets targets (WHO 2004). Site visits were conductedto identify existing control measures and to assess theeffectiveness of the implemented control measures ofthe water supply system. The validation of the controlmeasures was done by reviewing the maintenance andmonitoring records and field inspections. Water sampleswere also analysed to determine the effectiveness of theimplemented control measures. Samples were collectedfrom the inlet and outlet of each water treatment plant,outlet of each MBR and ESR and randomly selectedhouseholds from each zone. The parameters tested werepH, TDS, hardness and faecal coliform count (Table 3).
The residual risk score was calculated based on thefindings from the validation of control measures. In thefinal risk assessment matrix, risks were categorized interms of their potential impact on the performance of thewater supply system and its capacity to deliver safedrinking water.
Improvement plan
An improvement plan was drawn up to address residualrisks. The plan included risks that scored extreme (score>20), very high (score 15–20) and high (score 10–15)on the risk band. The less significant risks (medium andlow risk) were not specifically addressed in the plan asthese would be eliminated once the control measures formore significant risks are implemented.
Table 1 Locations of householdsampling and sanitary survey Location Water supply zone Samples collected Socio-economic status
Gopal Nagar Zone 2 25 Low- to middle-income area
Rahul Nagar Zone 2 28 Low-income area
Rambagh Zone 4 24 Slum area
Reshimbagh Zone 4 20 Low- to middle-income area
Environ Monit Assess

a
b
Fig. 3 a High-risk points in northern part of zone 2. b High-risk points in southern part of zone 2. c High-risk points in zone 4
Environ Monit Assess

Results and discussion
Hazard identification and risk assessment
Hazards identification and risk assessment was done foreach component within the water supply system and iselucidated in the following section.
Catchment area and raw water source
Table 4 shows the list of potential hazards in the catch-ment area of the source water. These hazards includeexisting as well as potential hazards based on futuregrowth and development of the areas in and aroundthe raw water source. These hazards exist due to pre-vailing anthropogenic activities around the vicinity ofthe raw water source. Rainfall runoff is contaminateddue to these activities, resulting in the potential contam-ination of the source water.
Other anthropogenic sources include discharge ofwastewater from human habitations and overflow ofash pond from a thermal power plant into KanhanRiver which is a major raw water source. This is a result
of inadequate planning during the city’s development andunauthorised construction within the catchment area.
The challenge in controlling contamination of rawwater sources is enhanced due to social, cultural andreligious aspects prevalent in the region. Use of waterbodies for religious activities like idol immersions iscommon in Nagpur City. Enforcing control measuresor corrective actions to restrict the use of water bodiesfor such activities is a challenge and would be unaccept-able to consumers. Implementing any such measurewithout involving the local community in the completedecision process would be ineffective.
The potential change in the risk due to implemen-tation of corrective action for each hazard is alsolisted in Table 4.
Water treatment plants
In Table 5, selected hazards identified in the watertreatment plants by the WSP team are described. TheWSP team reviewed the procedures followed at all thefive treatment plants. Kanhan treatment plant andPench— I & III treatment plants were found to be
c
Fig. 3 (continued)
Environ Monit Assess

operating as per standard operating procedure (SOP)and no major risks were identified. However, onlinemonitoring system was not operational at Kanhan treat-ment plant. This increases the risk of not identifyingchanges in the quality of water being supplied to thecommunity.
The maintenance of older water treatment plantsposes a key challenge. This was observed at Pench—IIand Old Gorewada treatment plants where, due to lackof maintenance, all the processes were severely ham-pered. This also leads to lack of proper monitoring of thewater quality being supplied. The lack of attention bythe local authorities and improper maintenance by thecontractors responsible for the maintaining the treatmentplant pose an extremely high physical, chemical andmicrobiological risk.
Distribution network
The highest number of uncontrolled risks was identifiedin the distribution network as shown in Table 6. Priorstudies have shown deterioration in water quality in theNagpur distribution network with an increase in thermo-
tolerant coliform colony forming units (CFU) fromWTPs to consumer (Elala et al. 2011). The present studyalso identified risks due to post-treatment contamina-tion. A number of hazardous events were found to occurdue to low pressure created in the pipes as a result ofintermittent supply. Extreme risk was identified in thedistribution network because of cross contamination dueto the presence of sewer lines in the vicinity of thedrinking water pipeline. Rapid and unplanned develop-ment of the city has resulted in the construction of thedrinking water distribution network without conformingto planning regulations. The WSP team observed manyevents where the water quality had degraded due to thepresence of broken sewer lines. Another event that posesa high risk to water quality is the ingress of foreignmatter due to bursting and corrosion of pipes. Thesehazards are a source of physical, chemical and microbialcontamination of drinking water.
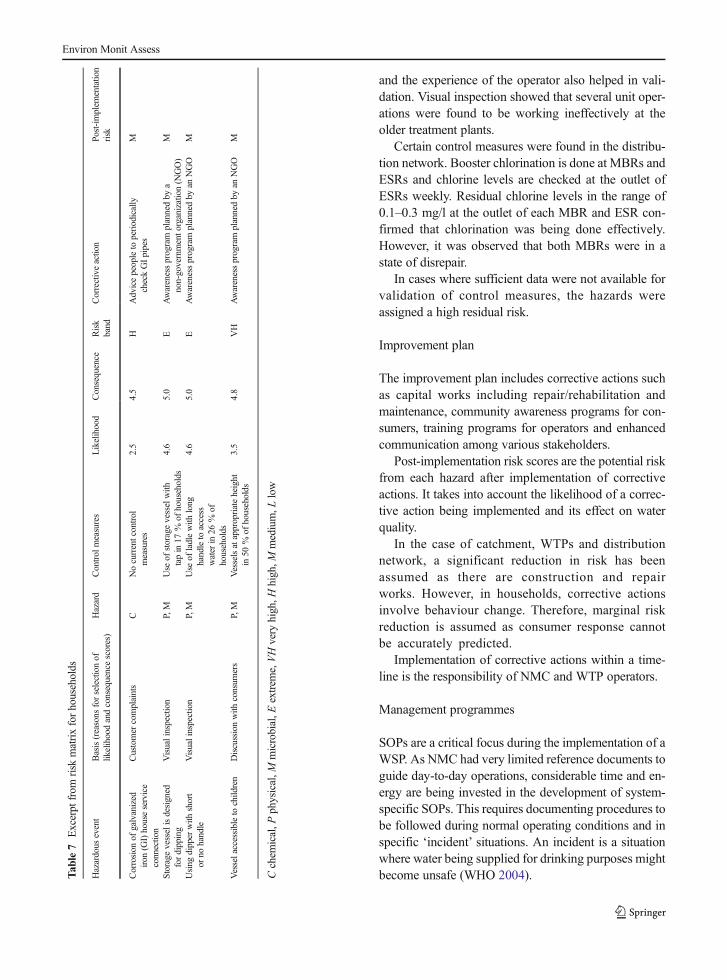
Households
Findings of the household sanitary survey are shown inTable 7. Storage vessels designed for dipping, use ofshort/no handle for extraction (locally called lota), use ofstorage vessels made of non-durable material and lack ofpoint-of-use treatment were among the significant risks.The most common risk of recontamination comes fromthe water handling and storage practices of the usersthemselves. Even if the tap water supplied by the author-ities is free from contamination, it gets recontaminated asa result of people dipping their hands into the storedwater,lack of hygiene in the household and the storage containerbeing accessible to children.
Table 3 Bureau of Indian Standards specifications for drinkingwater for pH, TDS and hardness (as CaCO3)
Parameter Desirablelimit
Permissible limit(in the absence ofalternate source)
pH 6.5–8.5 6.5–8.5
TDS (mg/l) 500 2,000
Hardness (mg/l, as CaCO3) 300 600
Table 2 Semi-quantitative risk matrix approach (Deere et al. 2001)
Severity or consequence
Insignificant or noimpact—rating: 1
Minor complianceimpact—rating: 2
Moderate aestheticimpact—rating: 3
Major regulatoryimpact—rating: 4
Catastrophic publichealth impact—rating: 5
Likelihood orfrequency
Almost certain—rating: 5
5 10 15 20 25
Likely—rating: 4 4 8 12 16 20
Moderate—rating: 3 3 6 9 12 15
Unlikely—rating: 4 2 4 6 8 10
Rare—rating: 5 1 2 3 4 5
Risk score < 6 6–9 10–15 >15
Risk rating Low Medium High Very high
Environ Monit Assess

Tab
le5
Excerpt
from
risk
matrixforWTPs
Hazardous
event
Basis(reasons
forselectionof
likelihoodandconsequencescores)
Hazard
Control
measures
Likelihood
Consequence
Riskband
Correctiveactio
nPo
st-implem
entatio
nrisk
Onlinemonito
ring
system
notfunctioning
properly
atKanhanWTP
Visualinspection
C,P,M
Nocontrolm
easures
5.0
3.5
VH
Repairandmaintenance
ofonlin
emonito
ring
system
L
Pench-IIWTPin
aseverely
degraded
condition
Visualinspection
C,P,M
Nocontrolm
easures
5.0
4.5
EMajor
repairsto
beundertaken
L
Old
Gorew
adain
aseverely
degraded
condition
Visualinspection
C,P,M
Nocontrolm
easures
5.0
4.5
EMajor
repairsto
beundertaken
L
Electricfailu
rePlantrecords
C,P
Nocontrolm
easures
3.0
3.5
HDedicated
power
lineto
besuppliedto
each
WTP
L
Cchem
ical,P
physical,M
microbial,E
extrem
e,VHvery
high,H
high,M
medium,L
low
Tab
le4
Excerpt
from
risk
matrixforcatchm
ent
Hazardous
event
Basisof
likelihoodand
consequencescores
Hazard
Control
measures
Likelihood
Consequence
Riskband
Correctiveaction
Post-im
plem
entation
risk
Sewageoverflow
sfrom
human
habitationduring
monsoon
period
Hum
ansettlem
entp
resent
near
KanhanRiver
MSeptictanksarein
place
3.5
4.5
VH
Constructionof
closed
conduitfor
rawwater
transm
ission
No
approvalto
develophabitation
withoutp
ropersewage
managem
entsystem
L
Overflowfrom
ashpond
during
monsoon
period
Due
tooverflow
inrainyseason
C,P
Settlingof
ashparticlesis
done
inashpond
2.7
4.1
HCareful
monitoring
ofsupernatant
from
ashpond
M
Idol
immersion,religious
activ
ities
There
isno
fencingaround
Gorew
adareservoirand
thereisatempleclosetothe
reservoir
C,P,M
Nocontrolm
easures
3.5
4.2
HProhibitidolimmersion
andother
religious
activities
atrawwater
sourcesProvideseparatepond
for
idol
immersion
L
Hum
anwastefrom
proposed
Gorew
adaZoo
project
Daily
activities
ofvisitors
atzoo
C,P,M
Sewagetreatm
entp
lant
isplannedin
proposed
project
3.4
5.0
VH
Sufficientb
arrier
hasbeen
putu
pbetweenrecreationalareaand
reservoirGuesthouses
tobe
locatedoutsidethecatchm
ent
L
Cchem
ical,P
physical,M
microbial,E
extrem
e,VHvery
high,H
high,M
medium,L
low
Environ Monit Assess

The other prominent risk is the corrosion of pipeswithin the household. It was observed that pipes arerarely checked for leaks or corrosion. Hazards withinthe households completely depend on the users, aware-ness within the community regarding these hazards andwillingness to adopt safe sanitary practices.
Water quality monitoring
Water quality monitoring was done at all levels of thesupply including raw water sources, water treatmentplants, distribution network and households. Figure 4presents the result of microbial contamination in termsof CFU per 100 ml at different points in the water supplysystem. The maximum concentration of faecal coliforms(85 CFU/100 ml) was found at the source. No microbialcontamination was observed at the outlet of the watertreatment plant and MBRs. Recontamination was ob-served within the distribution network at ESRs.However, microbial contamination within the householdranged widely from 1 to 72 CFU/100 ml, indicating thatrecontamination in the household is strongly dependenton the practices of individual users. Residual chlorine wasless than the required 0.2 mg/l (BIS 1991) in 100% of thesamples collected from household taps. Increase in faecalcoliforms from treated water to point-of-use confirms therecontamination of drinking water in the distribution net-work and during storage and handling. These resultssignify the importance of repair and maintenance of dis-tribution network along with creating awareness aboutsafe storage and handling practices at the household.The absence of residual chlorine in household watersamples also indicates the need to re-evaluate chlorinedosing at the water treatment plants in order to achieve therequired minimum residual concentration of 0.2 mg/l atthe consumer end. pH (7.14+0.22), TDS (302+4.18 mg/l) and hardness (121.3+5.77mg/l as CaCO3) values at thehousehold water samples were not found to exceed drink-ing water limits set by the Bureau of Indian Standards(BIS) given in Table 3.
Control measures
No control measures were present within the catchment.Although the catchment is a protected zone and is underforest cover, certain anthropogenic activities were foundto exist.
Water samples were analysed to validate controls atWTPs. Studying water quality records, visual inspectionT
able6
Excerpt
from
risk
matrixfordistributio
nsystem
Hazardous
event
Basisof
likelihoodand
consequencescores
Hazard
Control
measures
Likelihood
Consequence
Risk
band
Correctiveactio
nPost-im
plem
entatio
nrisk
Cross
contam
ination
with
sewer
lines
Customer
complaintsandvisual
inspectio
nP,M
Nocurrentcontrol
measures
4.0
5.0
ELayingnewpipe
networkas
per
norm
sL
Biofilm
form
ationdue
tolack
ofchlorine
Nodataareavailable
P,M
Chlorinelevelsare
kept
incheck
3.0
4.5
HScheduleformonitoring
ofchlorine
levelsatspecified
pointsinthedistributionsystem
L
Contaminationdueto
ingressof
foreign
matterduring
pipe
bursts
Publicworks
departmentrecords
C,P,M
Flow
isregulatedto
preventb
ursts,visual
inspectio
nandleak
repairprogram
2.2
5.0
HLayinghigh-density
polyethylene
(HDPE
)andmedium-density
polyethylene
(MDPE
)pipes
Standard
operatingprocedure
(SOP)
forlaying
pipes
M
Contaminationdueto
ingressof
foreign
matterfrom
perforations
incorroded
pipes
Publicworks
departmentrecords
C,P,M
Manualinspection,repair
andmaintenance
program
2.0
5.0
HLayingnon-corrosivepipessuch
asHDPE
andMDPE
pipes
L
Cchem
ical,P
physical,M
microbial,E
extrem
e,VHvery
high,H
high,M
medium,L
low
Environ Monit Assess
and the experience of the operator also helped in vali-dation. Visual inspection showed that several unit oper-ations were found to be working ineffectively at theolder treatment plants.
Certain control measures were found in the distribu-tion network. Booster chlorination is done at MBRs andESRs and chlorine levels are checked at the outlet ofESRs weekly. Residual chlorine levels in the range of0.1–0.3 mg/l at the outlet of each MBR and ESR con-firmed that chlorination was being done effectively.However, it was observed that both MBRs were in astate of disrepair.
In cases where sufficient data were not available forvalidation of control measures, the hazards wereassigned a high residual risk.
Improvement plan
The improvement plan includes corrective actions suchas capital works including repair/rehabilitation andmaintenance, community awareness programs for con-sumers, training programs for operators and enhancedcommunication among various stakeholders.
Post-implementation risk scores are the potential riskfrom each hazard after implementation of correctiveactions. It takes into account the likelihood of a correc-tive action being implemented and its effect on waterquality.
In the case of catchment, WTPs and distributionnetwork, a significant reduction in risk has beenassumed as there are construction and repairworks. However, in households, corrective actionsinvolve behaviour change. Therefore, marginal riskreduction is assumed as consumer response cannotbe accurately predicted.
Implementation of corrective actions within a time-line is the responsibility of NMC and WTP operators.
Management programmes
SOPs are a critical focus during the implementation of aWSP. As NMC had very limited reference documents toguide day-to-day operations, considerable time and en-ergy are being invested in the development of system-specific SOPs. This requires documenting procedures tobe followed during normal operating conditions and inspecific ‘incident’ situations. An incident is a situationwhere water being supplied for drinking purposes mightbecome unsafe (WHO 2004).T
able7
Excerpt
from
risk
matrixforhouseholds
Hazardous
event
Basis(reasons
forselectionof
likelihoodandconsequencescores)
Hazard
Control
measures
Likelihood
Consequence
Risk
band
Correctiveaction
Post-implem
entatio
nrisk
Corrosion
ofgalvanized
iron
(GI)houseservice
connectio
n
Customer
complaints
CNocurrentcontrol
measures
2.5
4.5
HAdvicepeopleto
periodically
checkGIpipes
M
Storage
vesselisdesigned
fordipping
Visualinspection
P,M
Use
ofstoragevesselwith
tapin
17%
ofhouseholds
4.6
5.0
EAwarenessprogram
plannedby
anon-governmento
rganization(N
GO)
M
Using
dipper
with
short
orno
handle
Visualinspection
P,M
Use
ofladlewith
long
handleto
access
water
in26
%of
households
4.6
5.0
EAwarenessprogram
plannedby
anNGO
M
Vesselaccessibleto
child
ren
Discussionwith
consum
ers
P,M
Vesselsatappropriateheight
in50
%of
households
3.5
4.8
VH
Awarenessprogram
plannedby
anNGO
M
Cchem
ical,P
physical,M
microbial,E
extrem
e,VHvery
high,H
high,M
medium,L
low
Environ Monit Assess

In the water supply system of Nagpur, several utilityoperations are outsourced to contractors. It has beensuggested that the authorities develop a detailed proce-dure against which contractor activity could be mea-sured and assessed. Investigation should be undertakeninvolving all staff to discuss the current performance,assess inadequacy of current procedures and addressany issues or concerns during documentation ofprocedure.
An annual review protocol has also been prepared,which includes testing water quality at each step of thewater supply system and comparing this to critical limitsbased on WHO guidelines.
A list of the proposed management programmes forNagpur WSP is given in Table 8.
Supporting programmes
A key finding of this study is the importance ofsupporting programmes. It was found that the watersupply utility alone cannot ensure the provision of safedrinking water and protection against water-borne dis-eases. In several parts of the city, water is supplied tohouseholds through water tankers during summermonths. In such cases, it becomes difficult to controlwater quality. As shown in “Households”, improperstorage and handling also cause recontamination.Therefore, it becomes necessary to create awarenessabout point-of-use water treatment by involving a localNGO. Tools such as rallies, locality meetings and
informative posters have been deployed to promote safewater practices and hygiene in Nagpur.
It is also suggested that the Water Works Departmentand Public Health Department of NMC should collabo-rate to conduct surveillance monitoring as part of a duediligence program. This would involve collecting dataof jaundice and typhoid cases from hospitals and iden-tifying those localities in the city where water might begetting contaminated in the distribution network. Localdispensaries and primary health centres should reportcases of water-borne diseases to the local governmenthospitals. If contaminated water is being pumped fromtheWTPs, then these results should be communicated tothe operator immediately.
Training and awareness workshops have been carriedout to enhance the skills of WSP team members andpublic health engineers and to increase their capacity to
87
8
0 0
7
12
51
4
72
3235
28
0
10
20
30
40
50
60
70
80
90
100
CFU/100ml
Fig. 4 Average faecal coliformcount in Nagpur water supplysystem
Table 8 Proposed management programmes
Employee training to disseminate the concept of WSP
Developing SOPs to ensure compliance with water qualitystandards
Annual external auditing of the Water Works Department
Setting up a toll-free helpline to improve customer service
Monitoring employee performance through indicators such asresponse time, % customer complaint redressal and supplyrestoration time after cleaning or repair
Biennial review of WSP
Environ Monit Assess

manage the water supply system. These were conductedby external experts and in-house personnel to addressthe issue of gaps in staff knowledge that might impedethe implementation of the WSP. This also increasedcommunication between stakeholders and helped themgain an understanding of the importance of a WSP.
Challenges faced during implementation
One of the challenges faced during this study is relatedto the feasibility of catchment protection within thewater supply. Since land ownership is ambiguous anda great number of bureaucratic hurdles exist, it might notbe feasible to change and implement policies regardingland use and catchment protection. It is also not possibleto delineate a timeline for each corrective action. Even ifland management policies are kept in place and physicaldemarcation and protection is done, adherence to theserules or their long-term effectiveness cannot be ensured.Therefore, instead of substantially restricting activitywithin the catchment, stakeholders should be sensitizedabout the need to restrict dumping of untreated munic-ipal or industrial sewage, building of residential com-plexes near water bodies and allowing the catchmentarea to be developed for tourist purposes.
Lately, there has been increasing interest in the ef-fects of organizational culture within the agencies re-sponsible for supplying water on the success of WSPs(Summerill et al. 2012). Although there is full commit-ment of the operator, certain hindrances are still beingfaced during implementation. These stem from the in-ternal complexity of the water supply system as well asexternal influencing agents. At times, there is lack ofcommunication between various stakeholders and am-biguity of control and authority. Where there are multi-ple organizations involved, the WSP team acts as amediator to ensure that the risk is removed smoothly.
During rehabilitation of the distribution network, ithas been observed that delay in procuring equipment,conflicts between contractors and engineers and lack ofcooperation from residents impede the implementationprocess. Legalization of unregistered connections issometimes met unfavourably. Therefore, it is importantfor the WSP team to have administrative backing andmembers who can solve these problems.
Public health surveillance is of great importance inorder to meet health-based targets. Sufficient data re-garding water-borne diseases were not available at
primary health care centres. More efficient record keep-ing is needed to identify incidents of disease and quan-tify the effects of WSP.
Conclusion
This study describes the process of developing andimplementing a WSP for a large-piped water supply inIndia. To introduce the concept of WSP, it was essentialto have a key resource person with prior experience indeveloping WSPs. This experience came from WHOandYarra ValleyWater, Melbourne. It would be useful ifa group of experts is made available to guide futureWSP development in India. To this effect, NEERI andWHO have taken steps to identify and train water supplyofficials from selected cities.
NMC is now moving towards the provision of con-tinuous water supply in Nagpur. The findings of theWSP study are being used to prioritize the interventionsplanned as a part of this project. The principles of WSPhave been used to make day-to-day operations moreefficient and employees more accountable. It has result-ed in better communication and incident reporting.
This study revealed certain vulnerabilities in the wa-ter supply system, especially within the distributionnetwork. These include intermittent water supply, irreg-ular repairs and faulty layout of the pipe network. Evenwhere protocol is in place, it is not always followed.
Further, it was found that there is a lack of consumerawareness regarding point-of-use water treatment andlimited availability of health data, which is not conduciveto achieving health-based targets. Supporting programmesare, therefore, critical to address these issues.
Further research is being planned to assess cost savingsand health benefits of implementing WSP in Nagpur.
The process of developing and implementing a WSPwill face challenges unique to each water supply.Although risks to water quality might be similar for alarge number of cities in India, certain modifications tothe WSP will be necessary based on how the waterutility is operated. Several hindrances will be facedduring implementation which requires in-depth knowl-edge of the system and local expertise. Experiences arerequired from different parts of the country so thatWSPs can be integrated into India’s urban water supply.
Acknowledgments The authors wish to thankWHO for endors-ing this study; Ms. Payden, Mr. Asoka Jayaratne, Dr. A.
Environ Monit Assess
Gunasekar andMr. Bruce Gordon for providing their expertise; theGovernment of India for funding implementation; the engineers,chemists and operators of Water Works Department of NMC, staffof Orange City Water and Center for Development Research andthe research staff at NEERI, especially Mr. A. Talkhande, Ms. VijiJohn, Ms. Priya Kundley and Mr. Swapnil Kamble, for theirsignificant contributions. The authors also wish to thank Dr. P.Nagarnaik for his advice in paper structuring and content.
References
APHA, AWWA, & WEF. (2005). Standard methods for the ex-amination of water & wastewater, centennial. Washington,DC: American Public Health Association.
Barry, S. J., Atwill, E. R., Tate, K. W., Koopman, T. S., Cullor, J.,& Huff, T. (1998).Developing and implementing a HACCP-based programme to control Cryptosporidium and otherwaterborne pathogens in the Alameda Creek watershed: casestudy. American Water Works Association AnnualConference, 21–25 June 1998 (pp. 57–69). Dallas: TexasWater Resources.
Bartram, J., Corrales, L., Davison, A., Deere, D., Drury, D.,Gordon, B., Howard, G., Rinehold, A., & Stevens, M.(2009).Water safety plan manual: step-by-step risk manage-ment for drinking-water supplier. Geneva: World HealthOrganization—International Water Association.
BIS. (1991). Bureau of Indian Standards specification for drinkingwater (BIS 10500:1991). New Delhi: Bureau of IndianStandards.
CDC. (2003). Safe water systems for the developing world: a hand-book for implementing household-based water treatment andsafe storage projects. Atlanta: US Department of Health andHuman Services, Center for Disease Control and Prevention.
Davison, A., Howard, G., Stevens, M., Callan, P., Fewtrell, L.,Deere, D., & Bartram, J. (2005).Water safety plans: manag-ing drinking-water quality from catchment to consumer.WHO/SDE/WSH/05.06. Geneva:World HealthOrganization.
Deere, D., & Davison, A. (1998). Safe water—are food guidelinesthe answer? Water, 25, 21–24.
Deere, D., Stevens, M., Davison, A., Helm, G., & Dufour, A.(2001). Management strategies. In L. Fewtrell & J. Bartram(Eds.), Water quality: guidelines, standards and health.Assessment of risk and risk management for water-relatedinfectious disease (pp. 257–288). London: InternationalWater Association.
Elala, D., Labhasetwar, P., & Tyrrel, S. F. (2011). Deterioration inwater quality from supply chain to household and appropriatestorage in the context of intermittent water supplies. WaterScience and Technology: Water Supply, 11(4), 400–408.
Godfrey, S., & Howard, G. (2004). Water safety plans for pipedurban water suppl ies in developing countries .Loughborough: WEDC.
Gunnarsdóttir, M. J., & Gissurarson, L. R. (2006). HACCP inIcelandic water supply: preliminary evaluation of experience5 (pp. 21–28). Reykjavik: Nordic Water Supply Conference.
Gunnarsdóttir, M. J., & Gissurarson, L. R. (2008). HACCP andwater safety plans in Icelandic water supply: preliminaryevaluation of experience. Journal of Water and Health,6((3), 377–382.
Havelaar, A. H. (1994). Application of HACCP to drinking watersupply. Food Control, 5, 145–152.
Howard, G., Godfrey, S., Tibatemwa, S., & Niwagba, C. (2005).Water safety plans for piped urban supplies in developingcountries: a case study from Kampala, Uganda.UrbanWaterJournal, 2(3), 161–170.
Mahmud, S. G., Shamsuddin, A. J., Ahmed, A. F., Davison, A.,Deere, D., & Howard, G. (2007). Development and imple-mentation of water safety plans for small water supplies inBangladesh: benefits and lessons learned. Journal of Waterand Health, 5(4), 585–597.
Ministry of Home Affairs. (2011). Provisional population totalspaper 1: census 2011. New Delhi: Ministry of Home Affairs,Government of India.
MoSPI. (2010). Housing condition survey: NSS 65th round: July2008–June 2009 report no. 535 (65/1/2/1). New Delhi:Ministry of Statistics and Programme Implementation,Government of India.
MoUD (2009) Improving urban services through service levelbenchmarking . New Delh i : Minis t ry of UrbanDevelopment, Government of India. http://www.urbanindia.nic.in/programme/uwss/slb/slb.htm. Accessed 10 June 2012.
Nath, K.J., Bloomfield, S. & Jones, M. (2006) Household waterstorage, handling and point-of-use treatment. InternationalScientific Forum on Home Hygiene. http://www.ifh-homehygiene.org. Accessed 20 December 2012.
Summerill, C., Pollard, S. J. T., & Smith, A. J. (2012). The role oforganizational culture and leadership in water safety planimplementation for improved risk management. Science ofthe Total Environment, 408, 4319–4327.
SWGIA. (2003).W1002 regulation—recommendations for a sim-ple water quality assurance system for water supplies.Zurich: Swiss Gas and Water Industry Association.
WHO. (2004). guidelines for drinking-water quality (3rd ed.).Geneva: World Health Organization.
Environ Monit Assess