implementation status of sberbank group€¦ · yulia chupina deputy ceo implementation status of...
TRANSCRIPT
Yulia Chupina Deputy CEO
Implementation Status
of Sberbank Group
Strategy 2014-2018
December, 2016
2
Contents
What has changed
in the economy?
Markets and trends
What is our status?
Achievements and
development zones
3
11.0
13.0
12.0
10.0
9.0
2.0
2010 11 12 13 15 14 16 19 2020 18 17
-0.3
7.0
5.0
6.0
3.0
4.0
2.0
11 2010 17 18 2020 19
+0.1
15 12 13 14 16
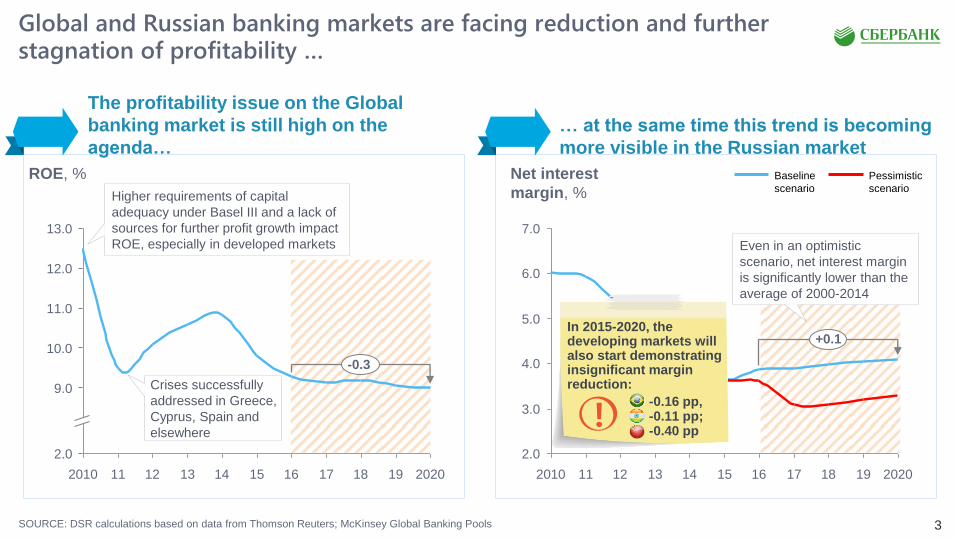
SOURCE: DSR calculations based on data from Thomson Reuters; McKinsey Global Banking Pools
Global and Russian banking markets are facing reduction and further stagnation of profitability …
The profitability issue on the Global
banking market is still high on the
agenda…
… at the same time this trend is becoming
more visible in the Russian market
ROE, % Baseline
scenario
Pessimistic
scenario
Net interest
margin, %
Crises successfully
addressed in Greece,
Cyprus, Spain and
elsewhere
In 2015-2020, the developing markets will also start demonstrating insignificant margin reduction:
-0.16 pp, -0.11 pp; -0.40 pp
Higher requirements of capital
adequacy under Basel III and a lack of
sources for further profit growth impact
ROE, especially in developed markets Even in an optimistic
scenario, net interest margin
is significantly lower than the
average of 2000-2014
4
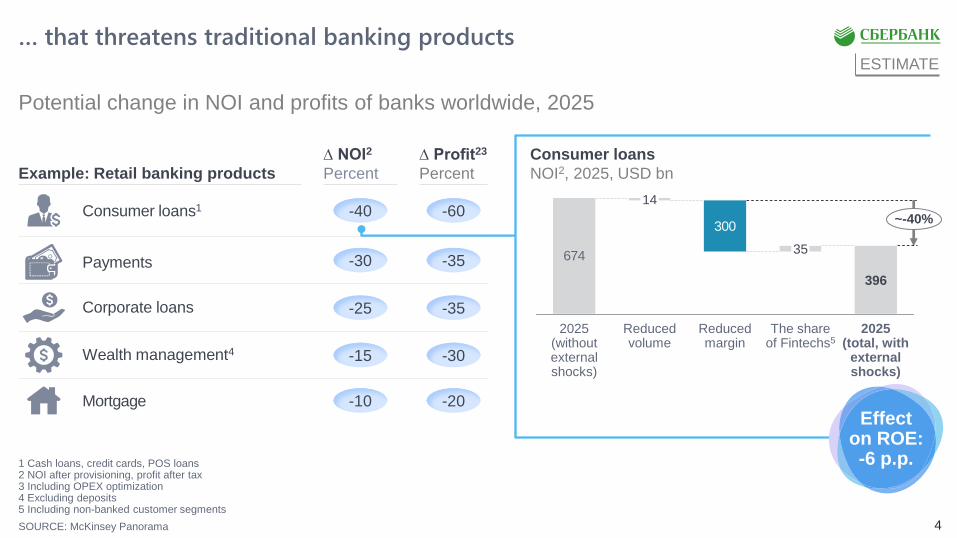
… that threatens traditional banking products
Consumer loans
NOI2, 2025, USD bn
300
67435
396
The share of Fintechs5
Reduced volume
14
2025 (without external shocks)
Reduced margin
~-40%
2025 (total, with
external shocks)
Mortgage
Consumer loans1
Payments
Wealth management4
-10 -20
-40 -60
-30 -35
-15 -30
-25 -35 Corporate loans
ESTIMATE
Potential change in NOI and profits of banks worldwide, 2025
SOURCE: McKinsey Panorama
1 Cash loans, credit cards, POS loans 2 NOI after provisioning, profit after tax 3 Including OPEX optimization 4 Excluding deposits 5 Including non-banked customer segments
Example: Retail banking products
∆ NOI2
Percent
∆ Profit23
Percent
Effect on ROE: -6 p.p.
5 SOURCE: Forecast of Strategy Department
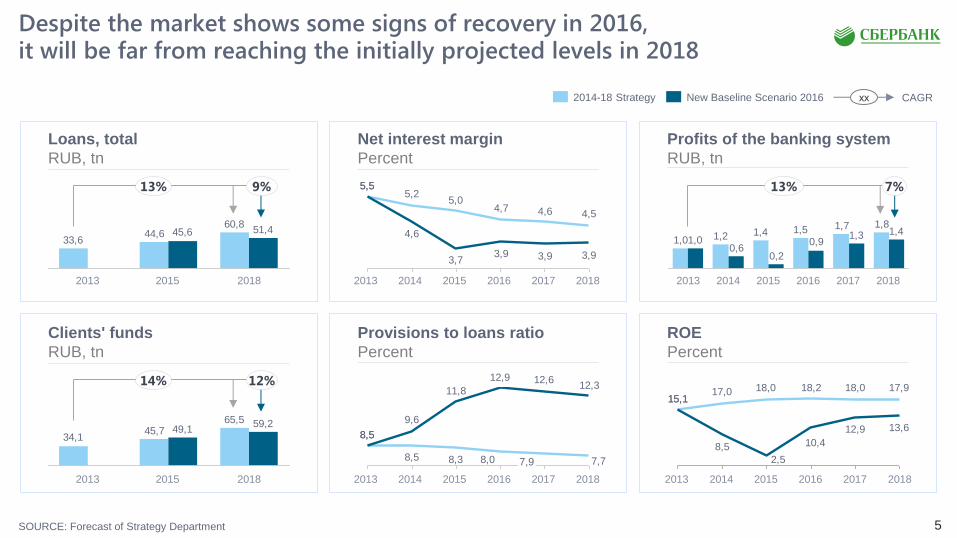
Despite the market shows some signs of recovery in 2016, it will be far from reaching the initially projected levels in 2018
Loans, total
RUB, tn
Clients' funds
RUB, tn
Profits of the banking system
RUB, tn
Net interest margin
Percent
ROE
Percent
Provisions to loans ratio
Percent
60,844,6
33,651,445,6
New Baseline Scenario 2016 2014-18 Strategy
1,81,71,51,41,21,01,41,3
0,9
0,20,6
1,0
17,918,018,218,017,015,1
13,612,9
10,4
2,5
8,5
15,1
4,54,64,75,0
5,25,5
3,93,93,93,7
4,6
5,5
7,78,08,38,5
8,5
12,312,612,9
11,8
9,6
8,5
7,9
13% 9%
14% 12%
7% 13%
2013 2015 2018 2014 2016 2017
2013 2015 2018 2016 2017 2014
2013 2015 2018 2016 2017 2014 2013 2015 2018
2013 2015 2018 2013 2015 2018 2016 2017 2014
65,545,7
34,1
59,249,1
CAGR xх
6
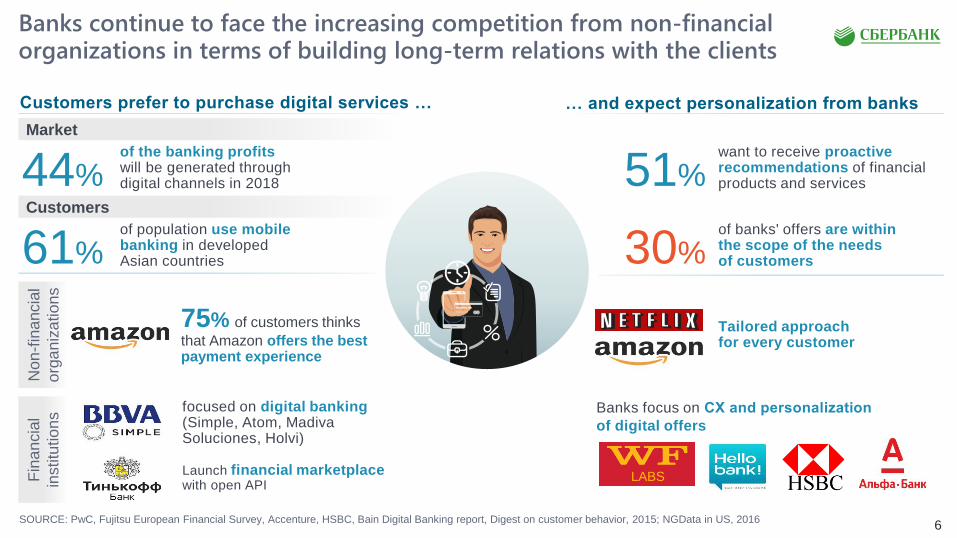
Banks continue to face the increasing competition from non-financial organizations in terms of building long-term relations with the clients
… and expect personalization from banks Customers prefer to purchase digital services …
Market
Customers
want to receive proactive recommendations of financial products and services
of the banking profits will be generated through digital channels in 2018 44% 51%
of banks' offers are within the scope of the needs of customers 61%
of population use mobile banking in developed Asian countries 30%
Non
-fin
ancia
l
org
an
iza
tio
ns
Fin
an
cia
l
institu
tio
ns
75% of customers thinks
that Amazon offers the best payment experience
Tailored approach for every customer
focused on digital banking (Simple, Atom, Madiva Soluciones, Holvi)
Banks focus on СX and personalization
of digital offers
Launch financial marketplace
with open API
SOURCE: PwC, Fujitsu European Financial Survey, Accenture, HSBC, Bain Digital Banking report, Digest on customer behavior, 2015; NGData in US, 2016
LABS
7
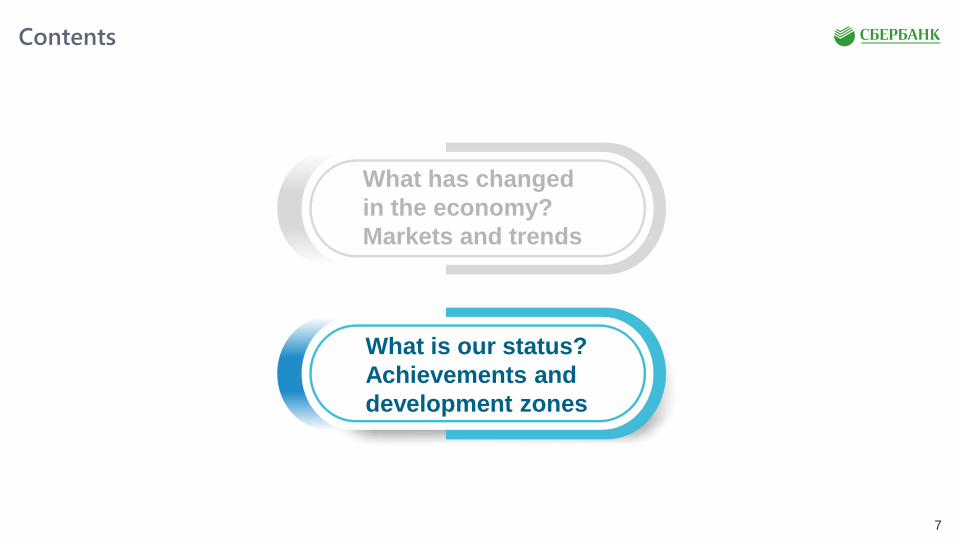
Contents
What has changed
in the economy?
Markets and trends
What is our status?
Achievements and
development zones
8
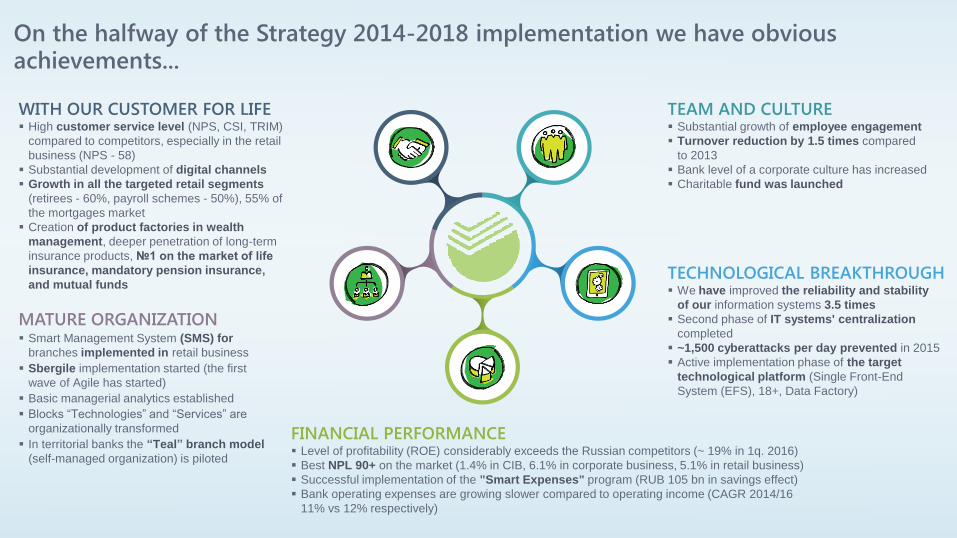
On the halfway of the Strategy 2014-2018 implementation we have obvious achievements...
TECHNOLOGICAL BREAKTHROUGH We have improved the reliability and stability
of our information systems 3.5 times
Second phase of IT systems' centralization
completed
~1,500 cyberattacks per day prevented in 2015
Active implementation phase of the target
technological platform (Single Front-End
System (EFS), 18+, Data Factory)
WITH OUR CUSTOMER FOR LIFE High customer service level (NPS, CSI, TRIM)
compared to competitors, especially in the retail
business (NPS - 58)
Substantial development of digital channels
Growth in all the targeted retail segments
(retirees - 60%, payroll schemes - 50%), 55% of
the mortgages market
Creation of product factories in wealth
management, deeper penetration of long-term
insurance products, №1 on the market of life
insurance, mandatory pension insurance,
and mutual funds
FINANCIAL PERFORMANCE Level of profitability (ROE) considerably exceeds the Russian competitors (~ 19% in 1q. 2016)
Best NPL 90+ on the market (1.4% in CIB, 6.1% in corporate business, 5.1% in retail business)
Successful implementation of the "Smart Expenses" program (RUB 105 bn in savings effect)
Bank operating expenses are growing slower compared to operating income (CAGR 2014/16
11% vs 12% respectively)
MATURE ORGANIZATION Smart Management System (SMS) for
branches implemented in retail business
Sbergile implementation started (the first
wave of Agile has started)
Basic managerial analytics established
Blocks “Technologies” and “Services” are
organizationally transformed
In territorial banks the “Teal” branch model
(self-managed organization) is piloted
TEAM AND CULTURE Substantial growth of employee engagement
Turnover reduction by 1.5 times compared
to 2013
Bank level of a corporate culture has increased
Charitable fund was launched
9
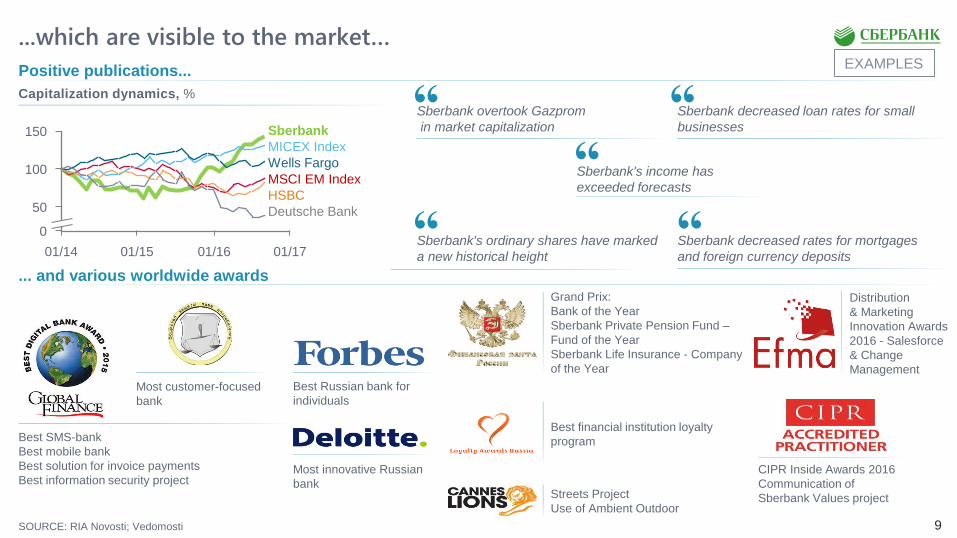
...which are visible to the market…
Sberbank decreased rates for mortgages
and foreign currency deposits
Sberbank decreased loan rates for small
businesses
Best SMS-bank
Best mobile bank
Best solution for invoice payments
Best information security project
Most customer-focused
bank
Most innovative Russian
bank
Best Russian bank for
individuals
CIPR Inside Awards 2016
Communication of
Sberbank Values project
Best financial institution loyalty
program
Grand Prix:
Bank of the Year
Sberbank Private Pension Fund –
Fund of the Year
Sberbank Life Insurance - Company
of the Year
Positive publications...
Sberbank's ordinary shares have marked
a new historical height
Sberbank's income has
exceeded forecasts
... and various worldwide awards
Streets Project
Use of Ambient Outdoor
Capitalization dynamics, %
0
01/17
150
100
50
01/15 01/16 01/14
Sberbank overtook Gazprom
in market capitalization Sberbank
MICEX Index
Wells Fargo
HSBC
MSCI EM Index
Deutsche Bank
SOURCE: RIA Novosti; Vedomosti
EXAMPLES
Distribution
& Marketing
Innovation Awards
2016 - Salesforce
& Change
Management
10
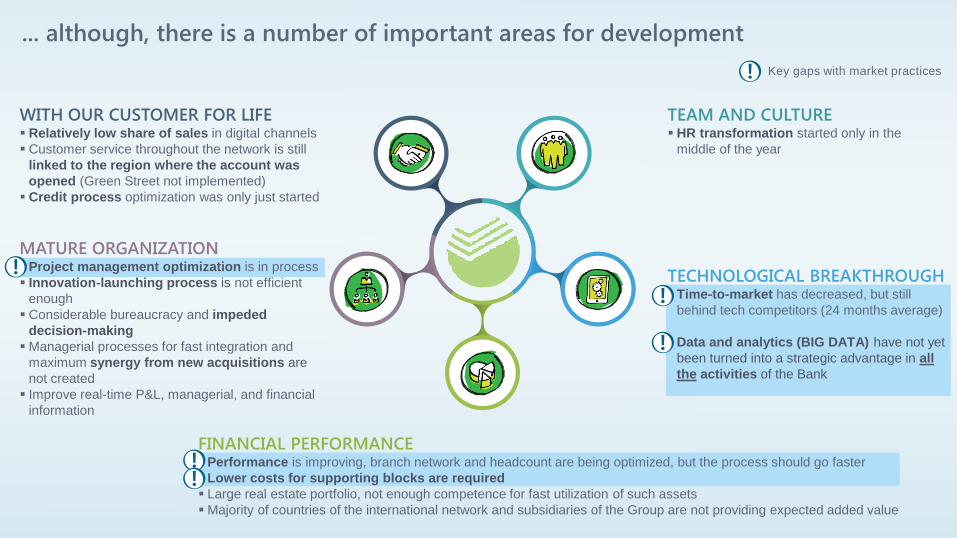
... although, there is a number of important areas for development
WITH OUR CUSTOMER FOR LIFE Relatively low share of sales in digital channels
Customer service throughout the network is still
linked to the region where the account was
opened (Green Street not implemented)
Credit process optimization was only just started
MATURE ORGANIZATION Project management optimization is in process
Innovation-launching process is not efficient
enough
Considerable bureaucracy and impeded
decision-making
Managerial processes for fast integration and
maximum synergy from new acquisitions are
not created
Improve real-time P&L, managerial, and financial
information
TEAM AND CULTURE HR transformation started only in the
middle of the year
TECHNOLOGICAL BREAKTHROUGH Time-to-market has decreased, but still
behind tech competitors (24 months average)
Data and analytics (BIG DATA) have not yet
been turned into a strategic advantage in all
the activities of the Bank
FINANCIAL PERFORMANCE Performance is improving, branch network and headcount are being optimized, but the process should go faster
Lower costs for supporting blocks are required
Large real estate portfolio, not enough competence for fast utilization of such assets
Majority of countries of the international network and subsidiaries of the Group are not providing expected added value
Key gaps with market practices
11
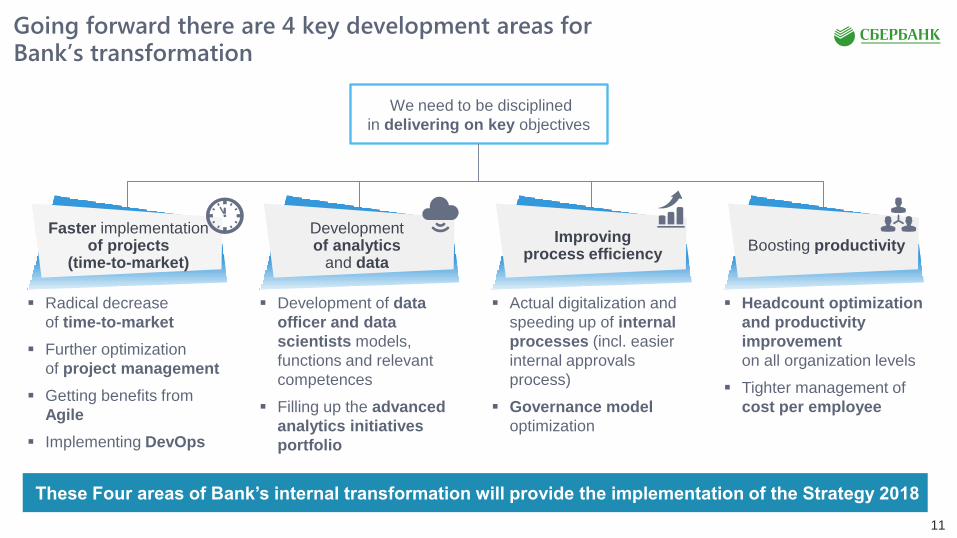
Radical decrease
of time-to-market
Further optimization
of project management
Getting benefits from
Agile
Implementing DevOps
Development of data
officer and data
scientists models,
functions and relevant
competences
Filling up the advanced
analytics initiatives
portfolio
Actual digitalization and
speeding up of internal
processes (incl. easier
internal approvals
process)
Governance model
optimization
Headcount optimization
and productivity
improvement
on all organization levels
Tighter management of
cost per employee
Going forward there are 4 key development areas for Bank’s transformation
We need to be disciplined
in delivering on key objectives
These Four areas of Bank’s internal transformation will provide the implementation of the Strategy 2018
Faster implementation of projects
(time-to-market)
Development of analytics
and data Boosting productivity
Improving process efficiency
12
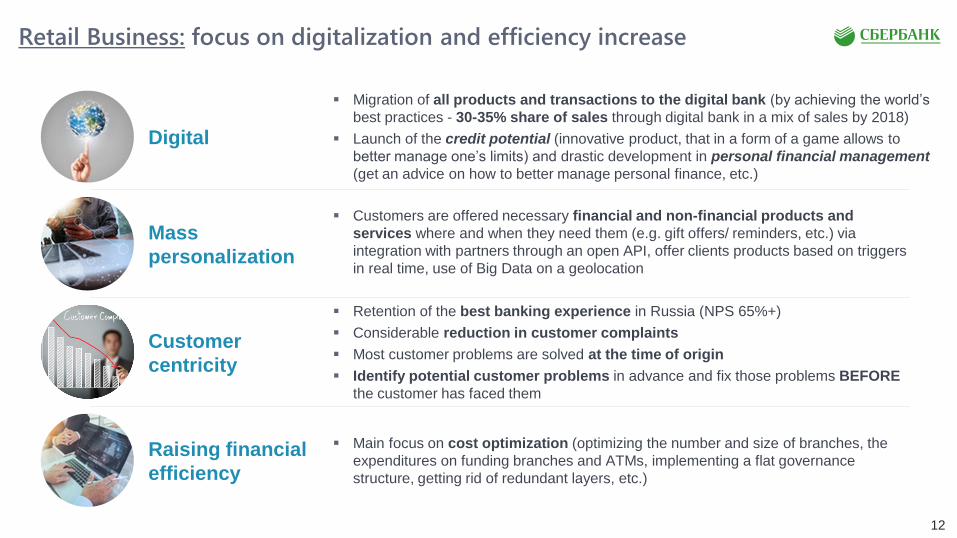
Retail Business: focus on digitalization and efficiency increase
Digital
Migration of all products and transactions to the digital bank (by achieving the world’s
best practices - 30-35% share of sales through digital bank in a mix of sales by 2018)
Launch of the credit potential (innovative product, that in a form of a game allows to
better manage one’s limits) and drastic development in personal financial management
(get an advice on how to better manage personal finance, etc.)
Mass
personalization
Customers are offered necessary financial and non-financial products and
services where and when they need them (e.g. gift offers/ reminders, etc.) via
integration with partners through an open API, offer clients products based on triggers
in real time, use of Big Data on a geolocation
Customer
centricity
Retention of the best banking experience in Russia (NPS 65%+)
Considerable reduction in customer complaints
Most customer problems are solved at the time of origin
Identify potential customer problems in advance and fix those problems BEFORE
the customer has faced them
Raising financial
efficiency
Main focus on cost optimization (optimizing the number and size of branches, the
expenditures on funding branches and ATMs, implementing a flat governance
structure, getting rid of redundant layers, etc.)
13
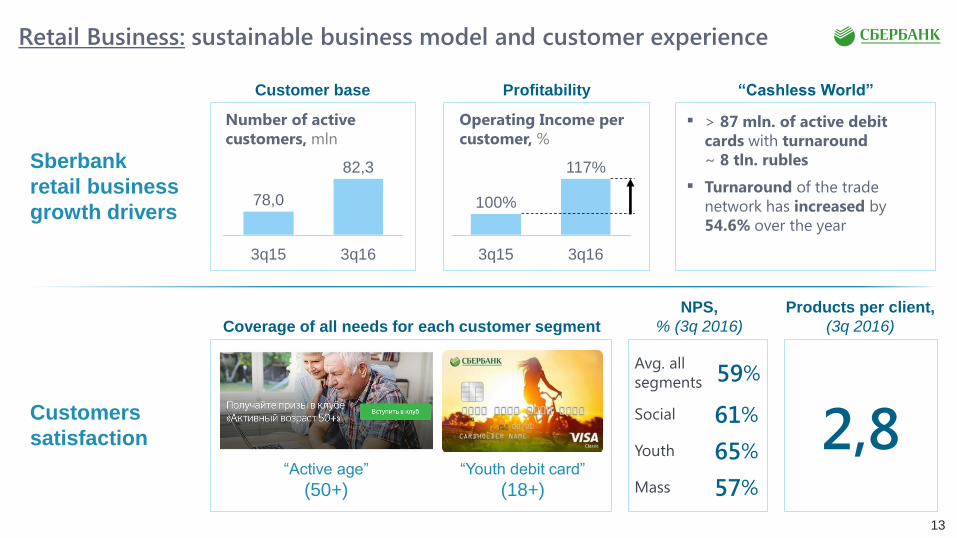
Retail Business: sustainable business model and customer experience
Sberbank
retail business
growth drivers
Customer base “Cashless World”
Customers
satisfaction
Coverage of all needs for each customer segment
> 87 mln. of active debit
cards with turnaround
~ 8 tln. rubles
Turnaround of the trade
network has increased by
54.6% over the year
“Youth debit card”
(18+) “Active age”
(50+)
2,8
Products per client,
(3q 2016)
NPS,
% (3q 2016)
59% Avg. all
segments
61% Social
65% Youth
57% Mass
3q16
82,3
3q15
78,0
Number of active
customers, mln
Profitability
3q16 3q15
117%
100%
Operating Income per
customer, %
14
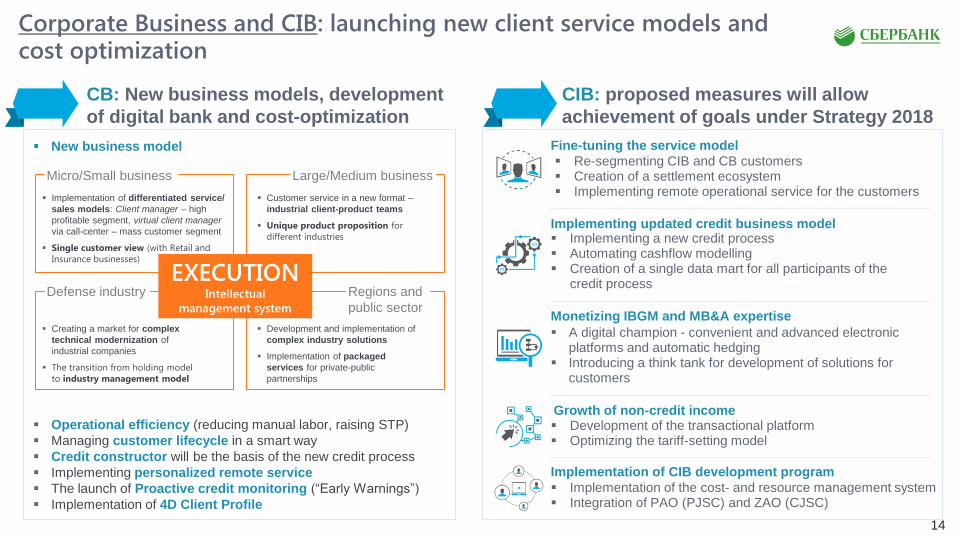
CB: New business models, development
of digital bank and cost-optimization
CIB: proposed measures will allow
achievement of goals under Strategy 2018
Corporate Business and CIB: launching new client service models and cost optimization
New business model
Operational efficiency (reducing manual labor, raising STP)
Managing customer lifecycle in a smart way
Credit constructor will be the basis of the new credit process
Implementing personalized remote service
The launch of Proactive credit monitoring (“Early Warnings”)
Implementation of 4D Client Profile
Fine-tuning the service model
Re-segmenting CIB and CB customers Creation of a settlement ecosystem Implementing remote operational service for the customers
Implementing updated credit business model Implementing a new credit process Automating cashflow modelling Creation of a single data mart for all participants of the
credit process
Monetizing IBGM and MB&A expertise
A digital champion - convenient and advanced electronic platforms and automatic hedging
Introducing a think tank for development of solutions for customers
Growth of non-credit income Development of the transactional platform Optimizing the tariff-setting model
Implementation of CIB development program
Implementation of the cost- and resource management system Integration of PAO (PJSC) and ZAO (CJSC)
EXECUTION Intellectual
management system
Micro/Small business Large/Medium business
Defense industry Regions and
public sector
Implementation of differentiated service/
sales models: Client manager – high
profitable segment, virtual client manager
via call-center – mass customer segment
Single customer view (with Retail and
Insurance businesses)
Creating a market for complex
technical modernization of
industrial companies
The transition from holding model
to industry management model
Customer service in a new format –
industrial client-product teams
Unique product proposition for
different industries
Development and implementation of
complex industry solutions
Implementation of packaged
services for private-public
partnerships
15
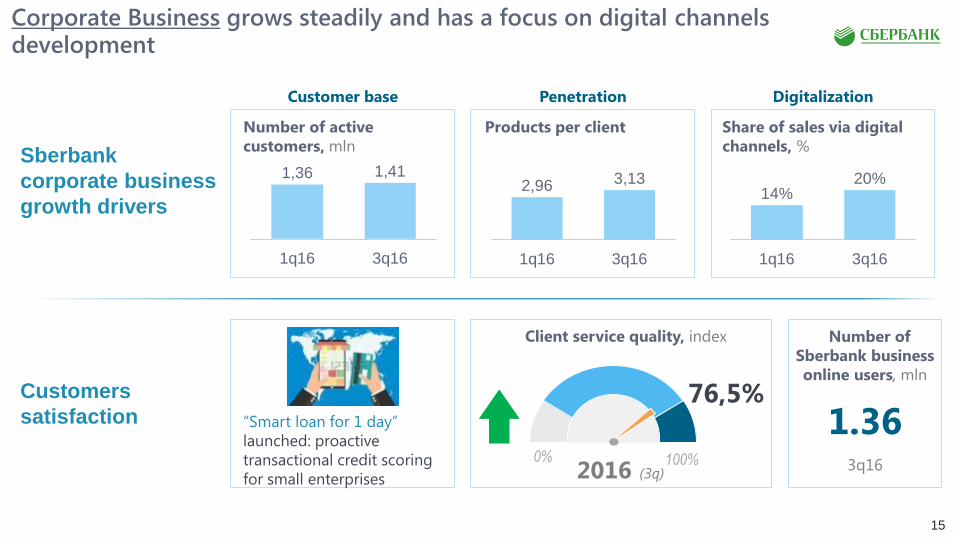
Corporate Business grows steadily and has a focus on digital channels development
Sberbank
corporate business
growth drivers
Customers
satisfaction
Customer base Digitalization Penetration
Share of sales via digital
channels, %
Products per client Number of active
customers, mln
3q16
1,41
1q16
1,36
3q16
3,13
1q16
2,96
1q16
14%
3q16
20%
“Smart loan for 1 day”
launched: proactive
transactional credit scoring
for small enterprises 3q16
1.36
Number of
Sberbank business
online users, mln
Client service quality, index
0%
76,5%
2016 (3q) 100%
16
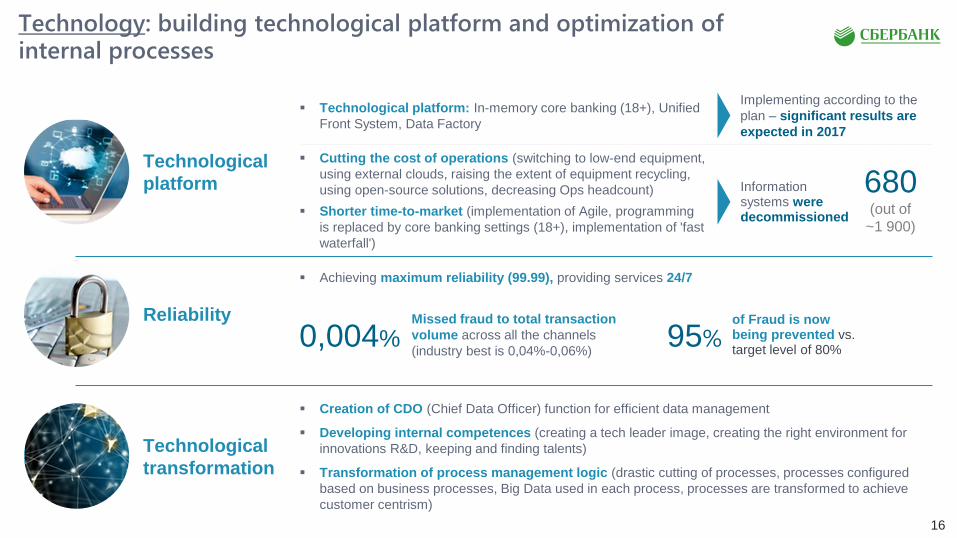
Technology: building technological platform and optimization of internal processes
Technological
platform
Reliability
Technological
transformation
Technological platform: In-memory core banking (18+), Unified
Front System, Data Factory
Creation of CDO (Chief Data Officer) function for efficient data management
Developing internal competences (creating a tech leader image, creating the right environment for
innovations R&D, keeping and finding talents)
Transformation of process management logic (drastic cutting of processes, processes configured
based on business processes, Big Data used in each process, processes are transformed to achieve
customer centrism)
680 (out of
~1 900)
Information systems were decommissioned
Implementing according to the
plan – significant results are
expected in 2017
Achieving maximum reliability (99.99), providing services 24/7
Missed fraud to total transaction
volume across all the channels
(industry best is 0,04%-0,06%) 0,004%
of Fraud is now being prevented vs. target level of 80%
95%
Cutting the cost of operations (switching to low-end equipment,
using external clouds, raising the extent of equipment recycling,
using open-source solutions, decreasing Ops headcount)
Shorter time-to-market (implementation of Agile, programming
is replaced by core banking settings (18+), implementation of 'fast
waterfall')
17
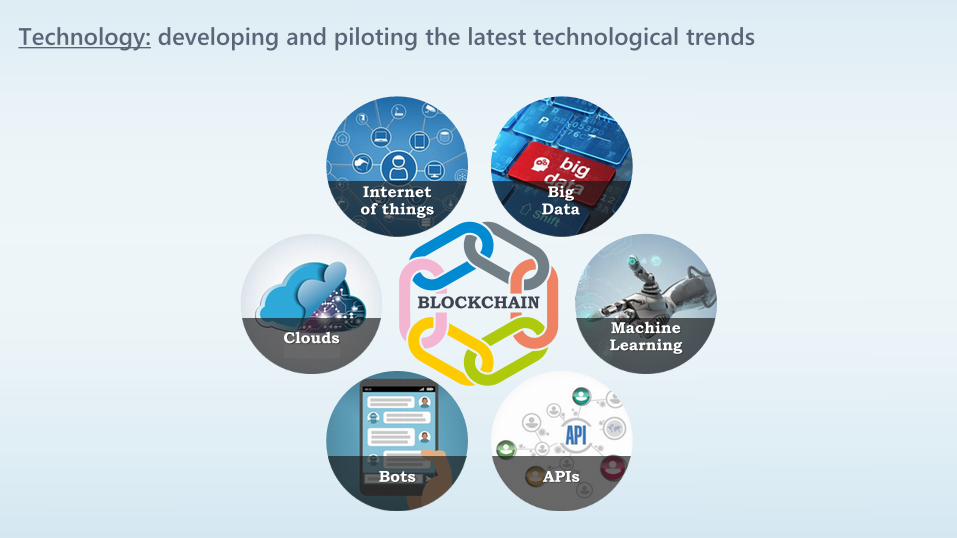
Technology: developing and piloting the latest technological trends
Internet of things
Big Data
Clouds Machine Learning
Bots APIs
BLOCKCHAIN
18
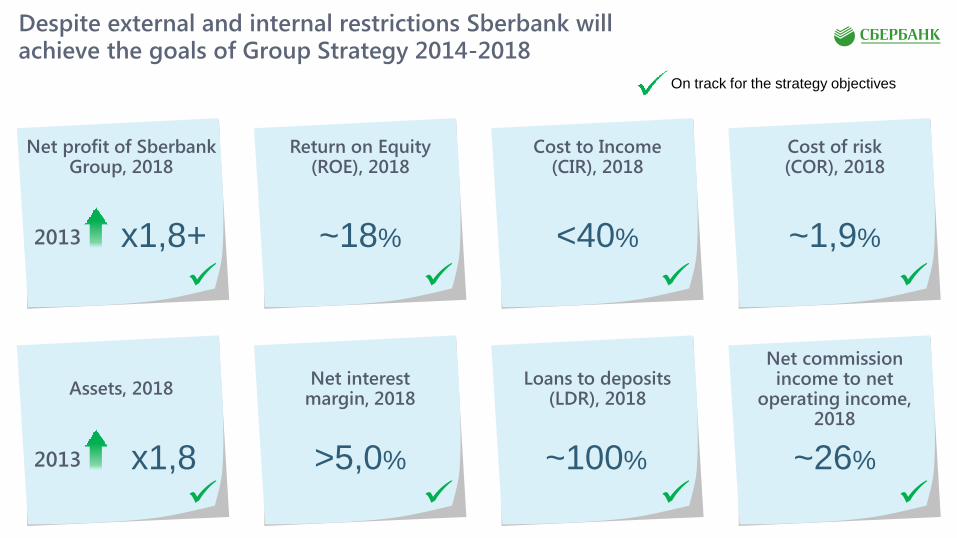
Despite external and internal restrictions Sberbank will achieve the goals of Group Strategy 2014-2018
Net profit of Sberbank Group, 2018
Return on Equity (ROE), 2018
Cost to Income (CIR), 2018
Cost of risk (COR), 2018
2013 x1,8+ ~18% <40% ~1,9%
Assets, 2018 Net interest
margin, 2018 Loans to deposits
(LDR), 2018
Net commission income to net
operating income, 2018
2013 x1,8 >5,0% ~100% ~26%
On track for the strategy objectives

Q&A

20
Appendix
21
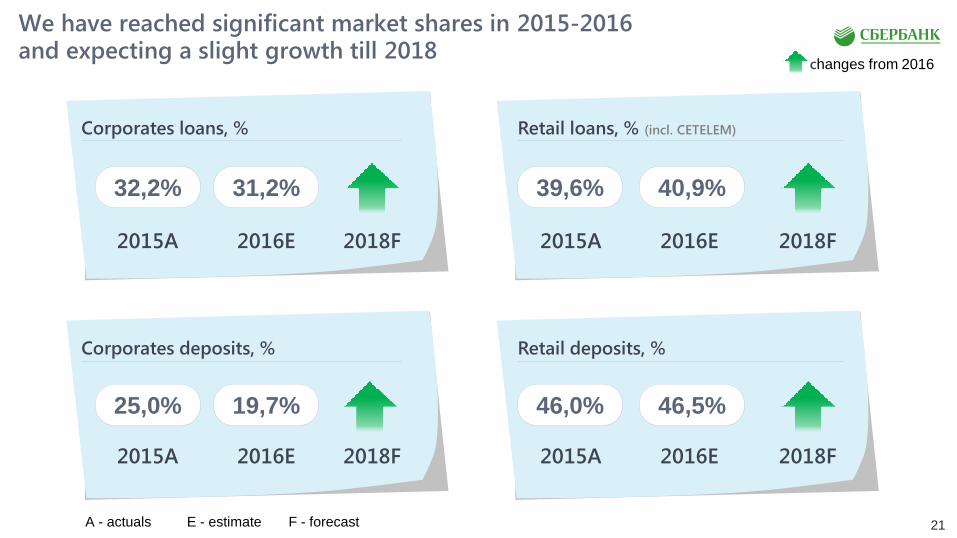
We have reached significant market shares in 2015-2016 and expecting a slight growth till 2018
Corporates loans, %
Corporates deposits, %
Retail loans, % (incl. CETELEM)
Retail deposits, %
32,2%
2015A 2018F
39,6% 31,2%
2016E
40,9%
25,0% 46,0% 19,7% 46,5%
changes from 2016
2015A 2018F 2016E
2015A 2018F 2016E 2015A 2018F 2016E
A - actuals E - estimate F - forecast

Sberbank Wealth Management
December 2016
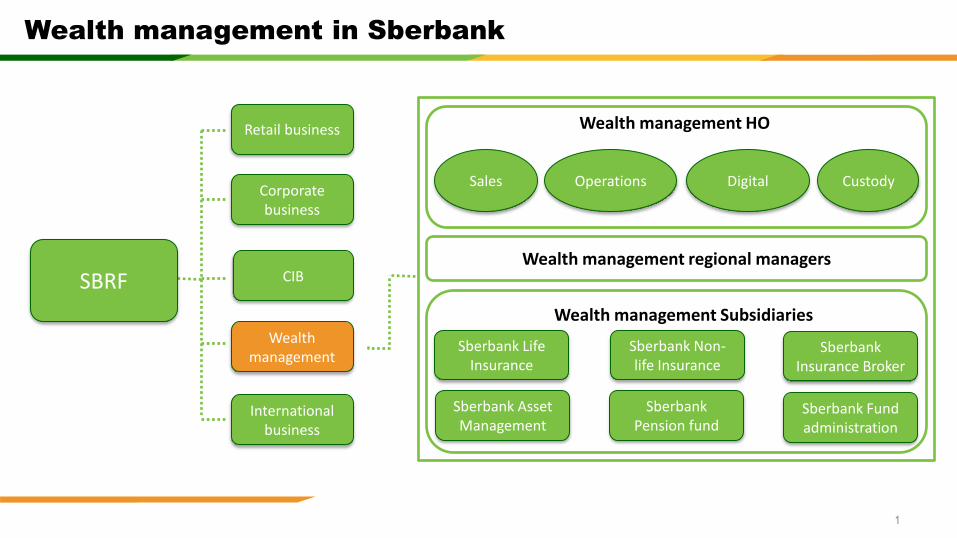
Wealth management in Sberbank
1
Retail business
Corporate business
CIB
Wealth management
International business
SBRF
Wealth management HO
Sales Operations Digital Custody
Wealth management regional managers
Wealth management Subsidiaries
Sberbank Life Insurance
Sberbank Non-life Insurance
Sberbank Insurance Broker
Sberbank Asset Management
Sberbank Pension fund
Sberbank Fund administration
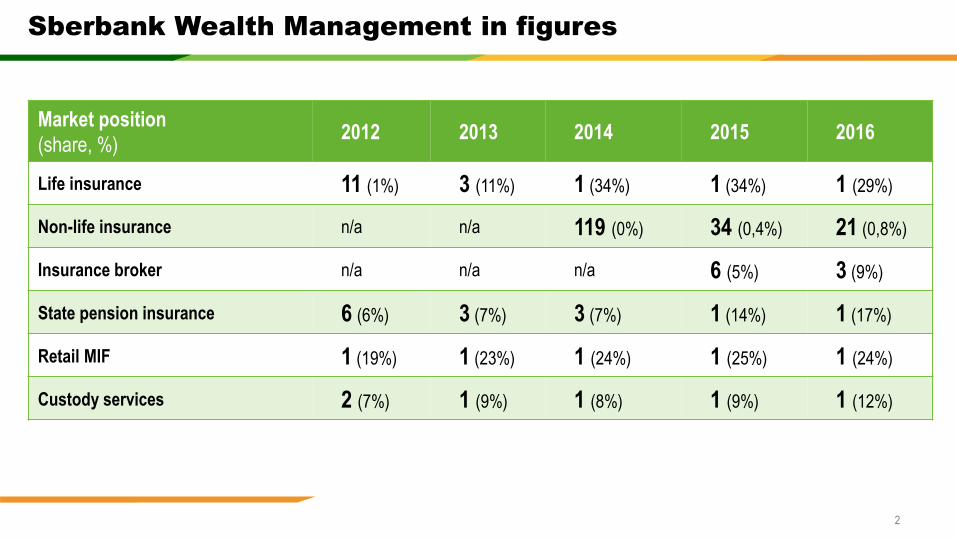
Sberbank Wealth Management in figures
2
Market position
(share, %) 2012 2013 2014 2015 2016
Life insurance 11 (1%) 3 (11%) 1 (34%) 1 (34%) 1 (29%)
Non-life insurance n/a n/a 119 (0%) 34 (0,4%) 21 (0,8%)
Insurance broker n/a n/a n/a 6 (5%) 3 (9%)
State pension insurance 6 (6%) 3 (7%) 3 (7%) 1 (14%) 1 (17%)
Retail MIF 1 (19%) 1 (23%) 1 (24%) 1 (25%) 1 (24%)
Custody services 2 (7%) 1 (9%) 1 (8%) 1 (9%) 1 (12%)
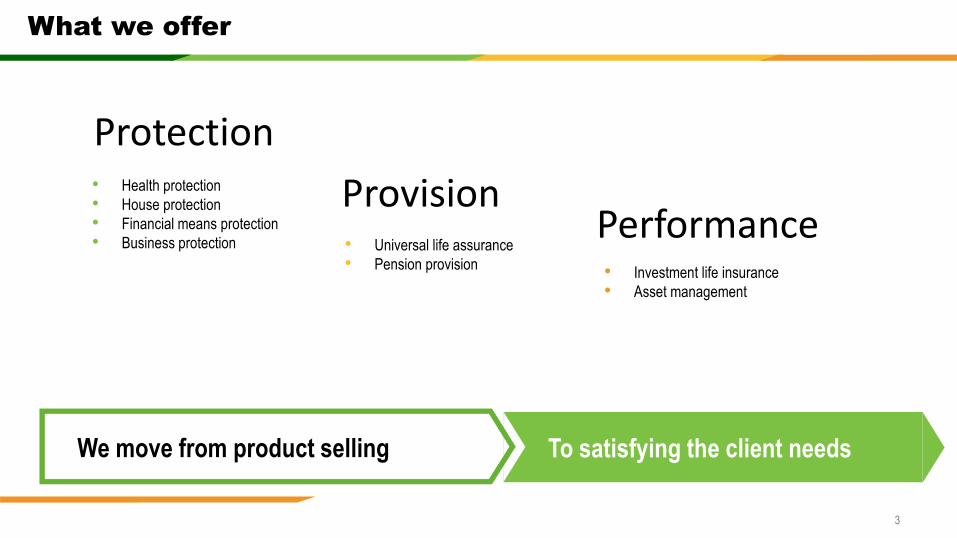
What we offer
3
• Health protection
• House protection
• Financial means protection
• Business protection • Universal life assurance
• Pension provision • Investment life insurance
• Asset management
To satisfying the client needs We move from product selling
Protection
Provision Performance
050
100150200250300350400
2016 2019
Credit Life Insurance Non-Credit Life Insurance
59 83
103 117
0
0.2
0.4
0.6
0.8
1
2016 2017 2018 2019
Gross premiums written, RUB bn
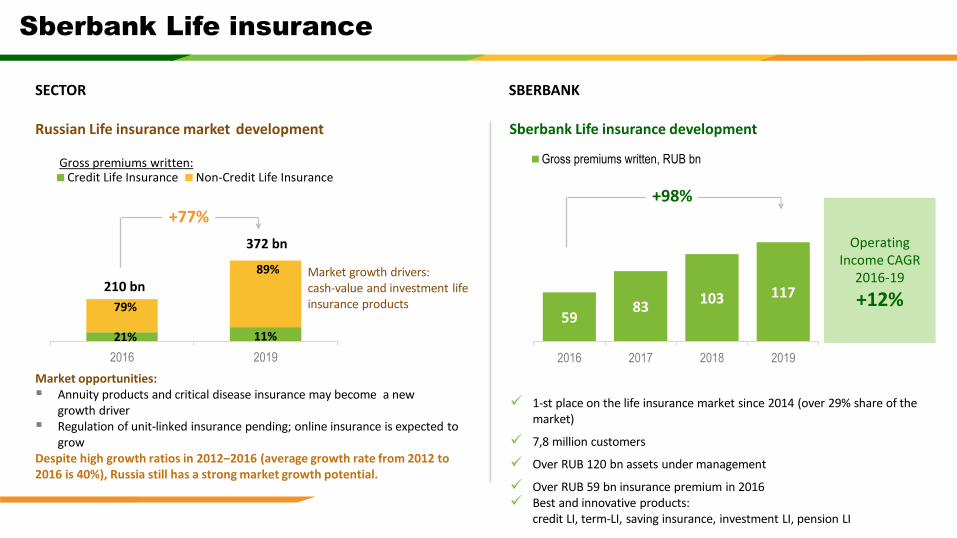
Sberbank Life insurance
Despite high growth ratios in 2012‒2016 (average growth rate from 2012 to 2016 is 40%), Russia still has a strong market growth potential.
372 bn
+77%
210 bn
Russian Life insurance market development
Market growth drivers: cash-value and investment life insurance products
Market opportunities: Annuity products and critical disease insurance may become a new
growth driver Regulation of unit-linked insurance pending; online insurance is expected to
grow
89%
11%
79%
21%
1-st place on the life insurance market since 2014 (over 29% share of the market)
7,8 million customers
Over RUB 120 bn assets under management
Over RUB 59 bn insurance premium in 2016 Best and innovative products:
credit LI, term-LI, saving insurance, investment LI, pension LI
SECTOR SBERBANK
Sberbank Life insurance development
Operating Income CAGR
2016-19
+12%
+98%
Gross premiums written:
8 10 15
26
051015202530
0
0.2
0.4
0.6
0.8
1
2016 2017 2018 2019
Gross premiums written
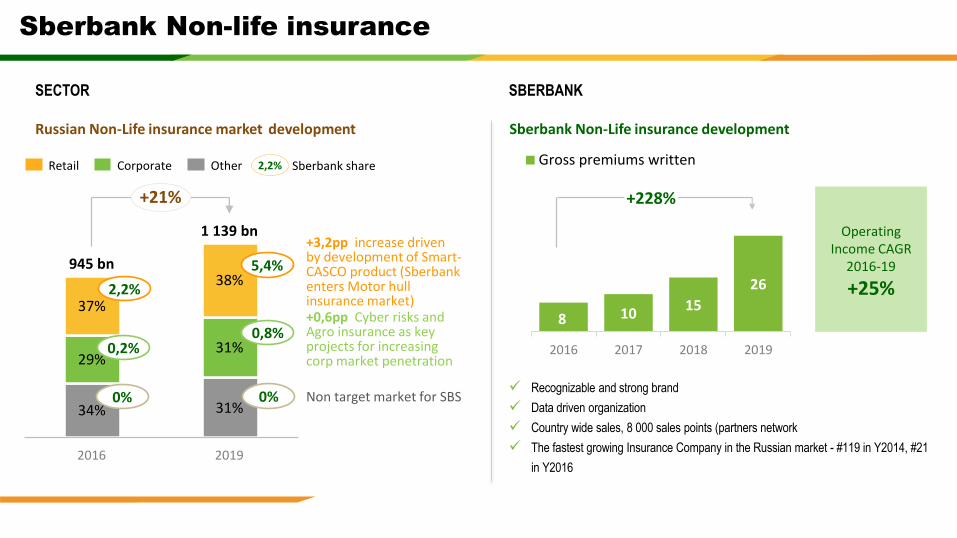
Sberbank Non-life insurance
Russian Non-Life insurance market development
SECTOR SBERBANK
Sberbank Non-Life insurance development
34% 31%
1 139 bn
38%
2019
37%
2016
29%
945 bn
31%
+21%
Other Retail Corporate
2,2%
Sberbank share
0,2%
0%
5,4%
0,8%
0%
+3,2pp increase driven by development of Smart-CASCO product (Sberbank enters Motor hull insurance market) +0,6pp Cyber risks and Agro insurance as key projects for increasing corp market penetration
Non target market for SBS
2,2%
Recognizable and strong brand
Data driven organization
Country wide sales, 8 000 sales points (partners network
The fastest growing Insurance Company in the Russian market - #119 in Y2014, #21
in Y2016
Operating Income CAGR
2016-19
+25%
+228%
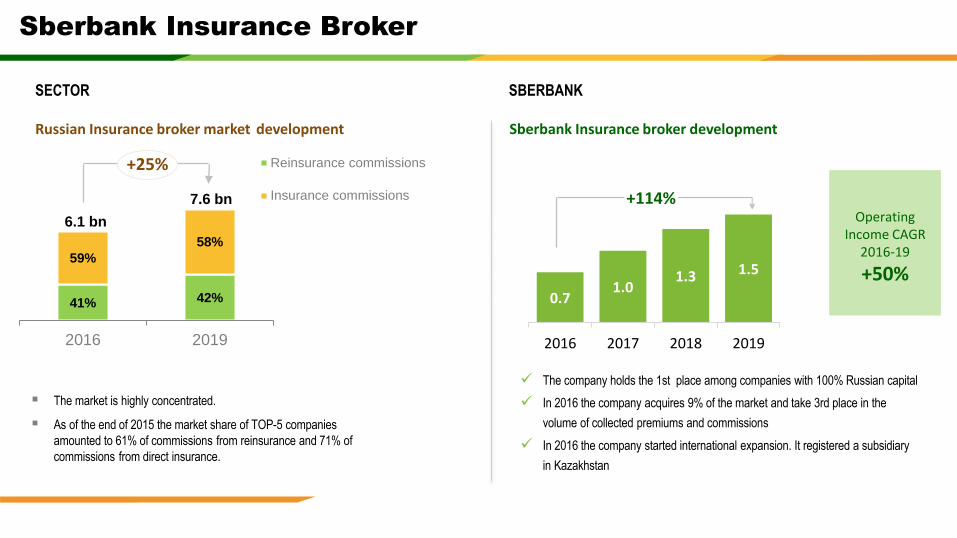
41% 42%
59%
58%
2016 2019
Reinsurance commissions
Insurance commissions
Sberbank Insurance Broker
Russian Insurance broker market development
SECTOR SBERBANK
Sberbank Insurance broker development
+25%
6.1 bn
7.6 bn
The market is highly concentrated.
As of the end of 2015 the market share of TOP-5 companies
amounted to 61% of commissions from reinsurance and 71% of
commissions from direct insurance.
The company holds the 1st place among companies with 100% Russian capital
In 2016 the company acquires 9% of the market and take 3rd place in the
volume of collected premiums and commissions
In 2016 the company started international expansion. It registered a subsidiary
in Kazakhstan
Operating Income CAGR
2016-19
+50% 0.7
1.0 1.3 1.5
0
0.5
1
1.5
2
0
0.2
0.4
0.6
0.8
1
1.2
2016 2017 2018 2019
+114%
7
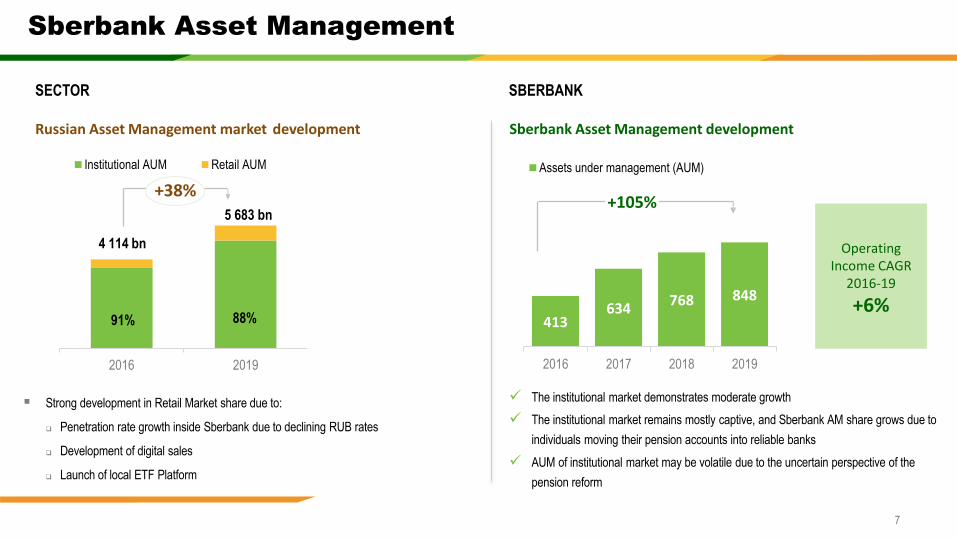
Sberbank Asset Management
Strong development in Retail Market share due to:
Penetration rate growth inside Sberbank due to declining RUB rates
Development of digital sales
Launch of local ETF Platform
The institutional market demonstrates moderate growth
The institutional market remains mostly captive, and Sberbank AM share grows due to
individuals moving their pension accounts into reliable banks
AUM of institutional market may be volatile due to the uncertain perspective of the
pension reform
0
1000
2000
3000
4000
5000
6000
2016 2019
Institutional AUM Retail AUM
5 683 bn
4 114 bn
91% 88% 413 634
768 848
0
200
400
600
800
1000
0
0.2
0.4
0.6
0.8
1
2016 2017 2018 2019
Assets under management (AUM)
+38% +105%
Russian Asset Management market development
SECTOR SBERBANK
Sberbank Asset Management development
Operating Income CAGR
2016-19
+6%
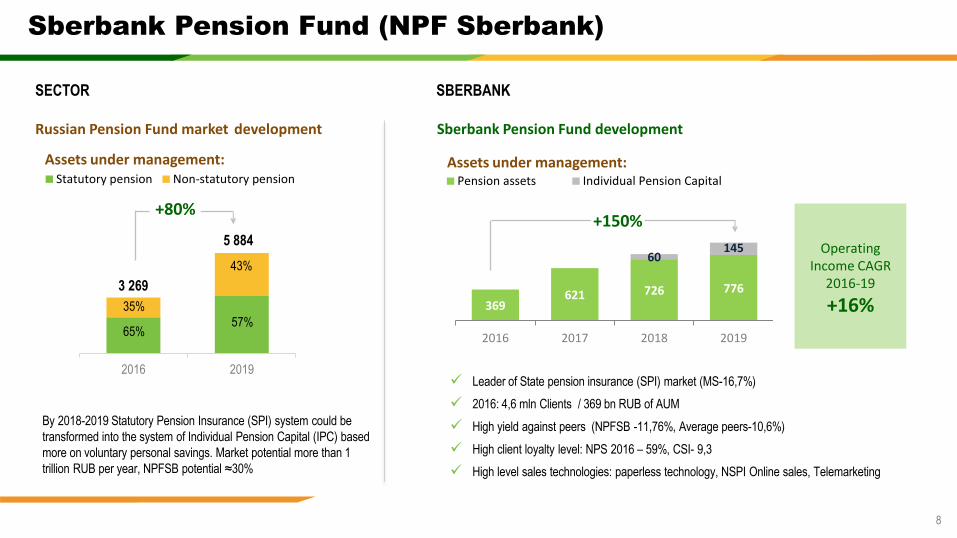
369 621 726 776
60 145
0
200
400
600
800
1 000
1 200
2016 2017 2018 2019
Pension assets Individual Pension Capital
8
Sberbank Pension Fund (NPF Sberbank)
+150%
Russian Pension Fund market development
SECTOR SBERBANK
Sberbank Pension Fund development
Operating Income CAGR
2016-19
+16%
01000200030004000500060007000
2016 2019
Statutory pension Non-statutory pension
35%
65%
43%
57%
5 884
3 269
+80%
Assets under management:
Leader of State pension insurance (SPI) market (MS-16,7%)
2016: 4,6 mln Clients / 369 bn RUB of AUM
High yield against peers (NPFSB -11,76%, Average peers-10,6%)
High client loyalty level: NPS 2016 – 59%, CSI- 9,3
High level sales technologies: paperless technology, NSPI Online sales, Telemarketing
Assets under management:
By 2018-2019 Statutory Pension Insurance (SPI) system could be
transformed into the system of Individual Pension Capital (IPC) based
more on voluntary personal savings. Market potential more than 1
trillion RUB per year, NPFSB potential ≈30%
9
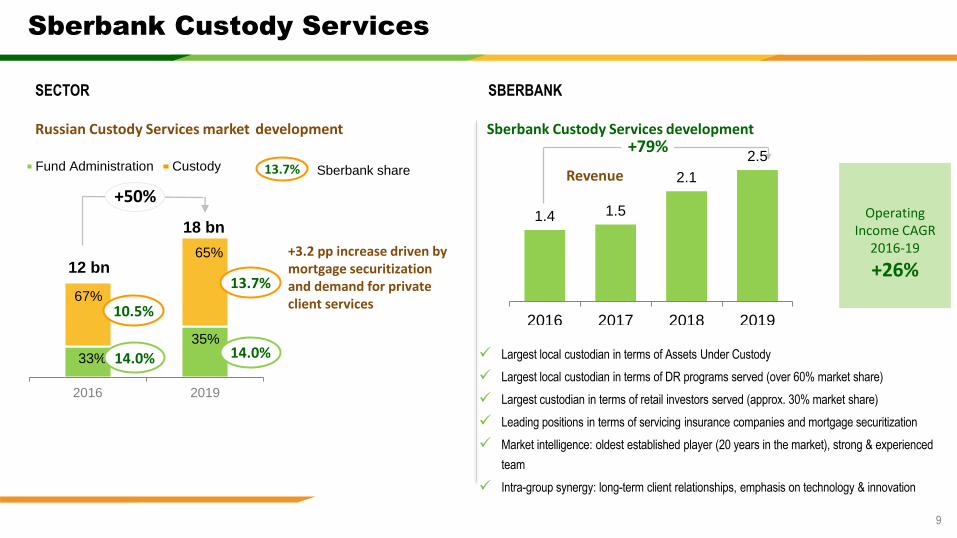
Sberbank Custody Services
Russian Custody Services market development
SECTOR SBERBANK
Sberbank Custody Services development
Operating Income CAGR
2016-19
+26%
Largest local custodian in terms of Assets Under Custody
Largest local custodian in terms of DR programs served (over 60% market share)
Largest custodian in terms of retail investors served (approx. 30% market share)
Leading positions in terms of servicing insurance companies and mortgage securitization
Market intelligence: oldest established player (20 years in the market), strong & experienced
team
Intra-group synergy: long-term client relationships, emphasis on technology & innovation
2016 2019
Fund Administration Custody
67%
33%
65%
35%
12 bn
18 bn
10.5%
14.0%
13.7%
14.0%
+3.2 pp increase driven by mortgage securitization and demand for private client services
13.7% Sberbank share
+50% 1.4 1.5
2.1
2.5
2016 2017 2018 2019
+79%
Revenue
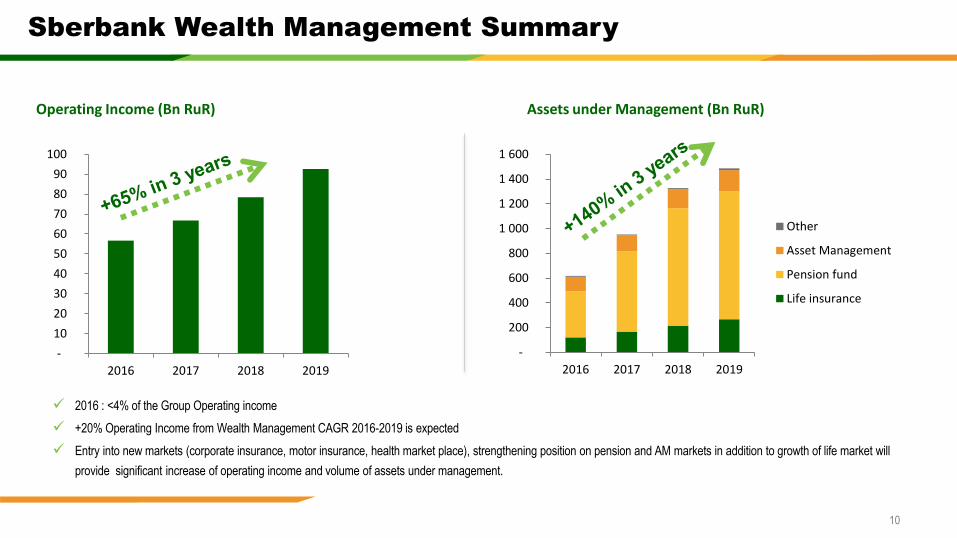
Sberbank Wealth Management Summary
10
2016 : <4% of the Group Operating income
+20% Operating Income from Wealth Management CAGR 2016-2019 is expected
Entry into new markets (corporate insurance, motor insurance, health market place), strengthening position on pension and AM markets in addition to growth of life market will
provide significant increase of operating income and volume of assets under management.
Operating Income (Bn RuR) Assets under Management (Bn RuR)
-
200
400
600
800
1 000
1 200
1 400
1 600
2016 2017 2018 2019
Other
Asset Management
Pension fund
Life insurance
-
10
20
30
40
50
60
70
80
90
100
2016 2017 2018 2019

Sberbank Analyst Day 14.12.2016
ASSET QUALITY
DISCUSSION
2
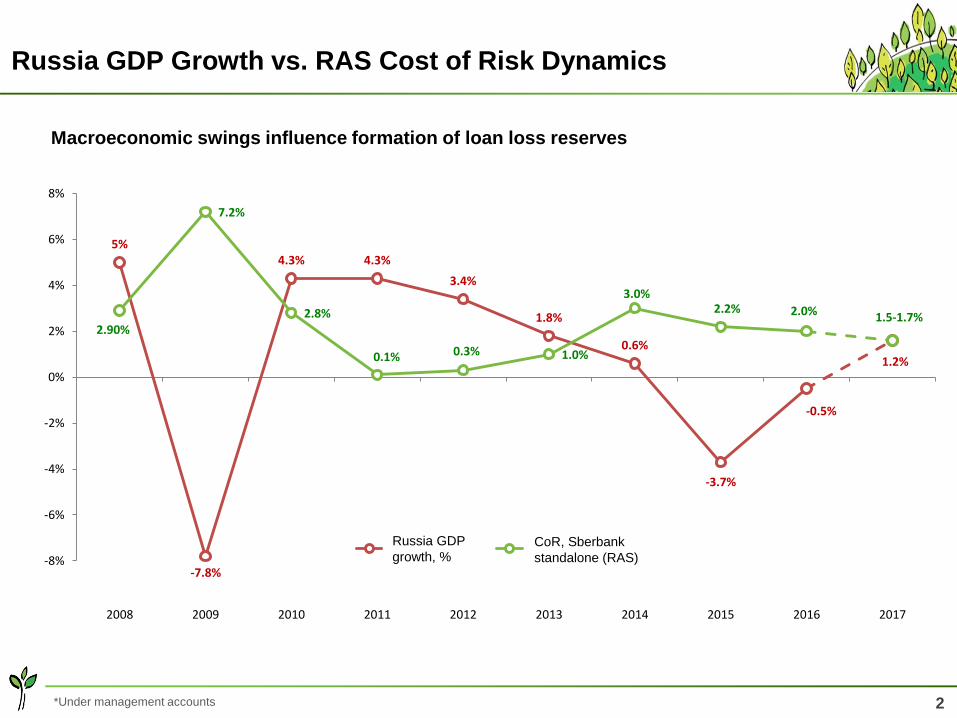
Russia GDP Growth vs. RAS Cost of Risk Dynamics
5%
-7.8%
4.3% 4.3%
3.4%
1.8%
0.6%
-3.7%
-0.5%
1.2%
2.90%
7.2%
2.8%
0.1% 0.3% 1.0%
3.0% 2.2% 2.0% 1.5-1.7%
-8%
-6%
-4%
-2%
0%
2%
4%
6%
8%
2008 2009 2010 2011 2012 2013 2014 2015 2016 2017
GDP CoR Сбербанка
Macroeconomic swings influence formation of loan loss reserves
*Under management accounts
Russia GDP
growth, % CoR, Sberbank
standalone (RAS)
3
7 678 7 768 7 309
4 049 4 502 4 338
01.10.15 01.01.16 01.10.16
RUB
FX
-0.7%
-5.1%
319 306 279
86 113
35
01.10.15 01.01.16 01.10.16
RUB
FX
-22.4%
-25.0%
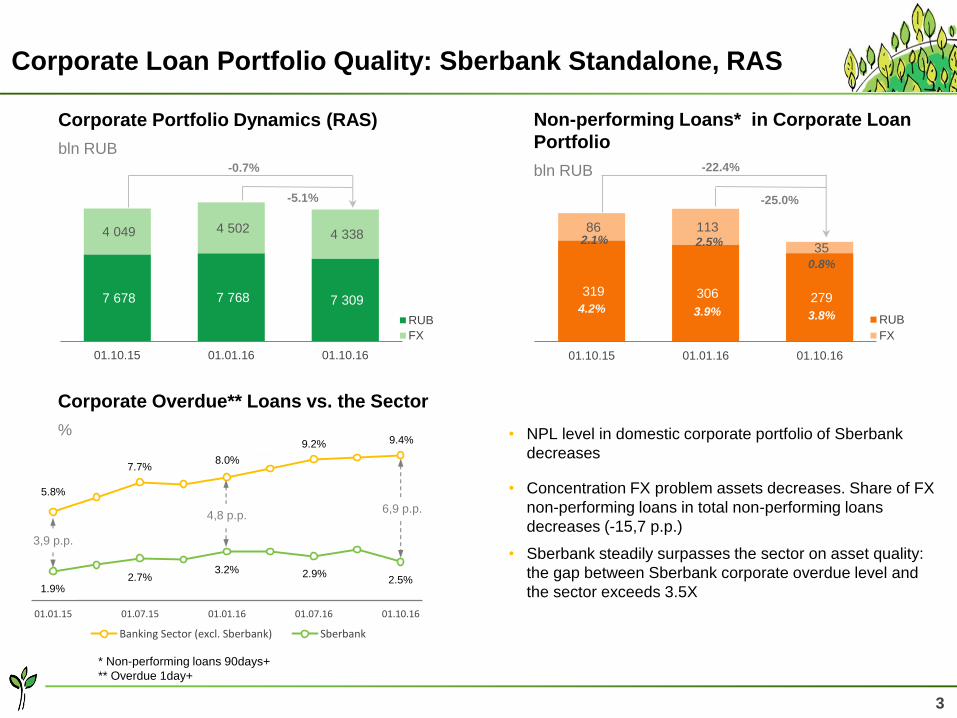
Corporate Portfolio Dynamics (RAS)
bln RUB
Non-performing Loans* in Corporate Loan
Portfolio
bln RUB
Corporate Loan Portfolio Quality: Sberbank Standalone, RAS
• NPL level in domestic corporate portfolio of Sberbank
decreases
• Concentration FX problem assets decreases. Share of FX
non-performing loans in total non-performing loans
decreases (-15,7 p.p.)
• Sberbank steadily surpasses the sector on asset quality:
the gap between Sberbank corporate overdue level and
the sector exceeds 3.5X
5.8% 6.7%
7.7% 7.6% 8.0%
8.6% 9.2% 9.3% 9.4%
1.9% 2.3%
2.7% 2.7% 3.2% 3.2% 2.9%
3.3% 2.5%
01.01.15 01.07.15 01.01.16 01.07.16 01.10.16
Banking Sector (excl. Sberbank) Sberbank
Corporate Overdue** Loans vs. the Sector
%
6,9 p.p.
3,9 p.p.
4,8 p.p.
* Non-performing loans 90days+
** Overdue 1day+
1.9% 2.3% 2.7% 2.7%
3.2% 3.2% 2.9% 3.3% 2.5%
5.8%
6.7% 7.7% 7.6%
8.0% 8.6%
9.2% 9.3% 9.4%
4.2% 3.9% 3.8%
2.1% 2.5%
0.8%
4
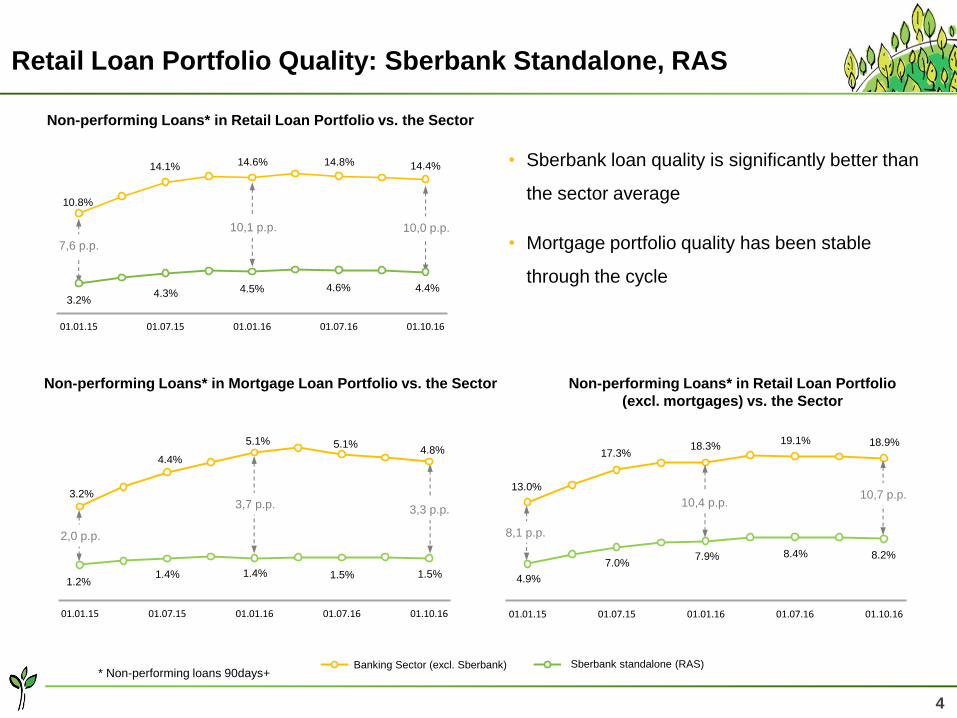
Retail Loan Portfolio Quality: Sberbank Standalone, RAS
• Sberbank loan quality is significantly better than
the sector average
• Mortgage portfolio quality has been stable
through the cycle
1.2% 1.4% 1.4% 1.5% 1.4% 1.5% 1.5% 1.5% 1.5%
3.2%
3.9% 4.4%
4.8% 5.1% 5.3%
5.1% 4.9% 4.8%
01.01.15 01.07.15 01.01.16 01.07.16 01.10.16
2,0 p.p.
3,3 p.p.
Non-performing Loans* in Mortgage Loan Portfolio vs. the Sector
3,7 p.p.
3.2% 3.8% 4.3% 4.6% 4.5% 4.7% 4.6% 4.6% 4.4%
10.8%
12.6% 14.1% 14.8% 14.6% 15.1% 14.8% 14.6% 14.4%
01.01.15 01.07.15 01.01.16 01.07.16 01.10.16
10,0 p.p.
7,6 p.p.
Non-performing Loans* in Retail Loan Portfolio vs. the Sector
Banking Sector (excl. Sberbank) Sberbank
10,1 p.p.
4.9% 6.1%
7.0% 7.7% 7.9% 8.4% 8.4% 8.4% 8.2%
13.0%
15.3% 17.3%
18.3% 18.3% 19.3% 19.1% 19.1% 18.9%
01.01.15 01.07.15 01.01.16 01.07.16 01.10.16
10,7 p.p.
8,1 p.p.
Non-performing Loans* in Retail Loan Portfolio
(excl. mortgages) vs. the Sector
10,4 p.p.
* Non-performing loans 90days+ Sberbank standalone (RAS)
3.2% 4.3% 4.6% 4.5% 4.7% 4.6% 4.6% 4.4%
10.8%
12.6%
14.1% 14.8% 14.6% 15.1% 14.8% 14.6% 14.4%
3.2%
4.4%
5.1% 5.1% 4.8%
1.2% 1.4% 1.4% 1.5% 1.5% 4.9%
7.0% 7.9% 8.4% 8.2%
18.9% 19.1% 18.3%
17.3%
13.0%
APPENDIX
6
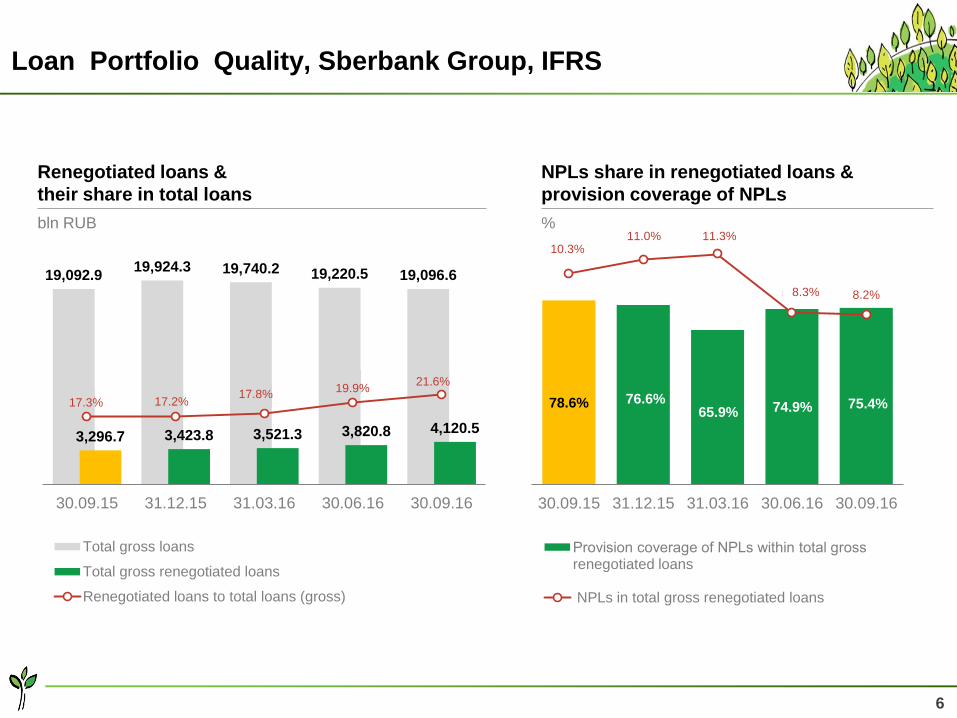
Loan Portfolio Quality, Sberbank Group, IFRS
Renegotiated loans &
their share in total loans
bln RUB
19,092.9 19,924.3 19,740.2 19,220.5 19,096.6
3,296.7 3,423.8 3,521.3 3,820.8 4,120.5
17.3% 17.2% 17.8% 19.9%
21.6%
30.09.15 31.12.15 31.03.16 30.06.16 30.09.16
Total gross loans
Total gross renegotiated loans
Renegotiated loans to total loans (gross)
NPLs share in renegotiated loans &
provision coverage of NPLs
%
78.6% 76.6% 65.9%
74.9% 75.4%
10.3%
11.0% 11.3%
8.3% 8.2%
30.09.15 31.12.15 31.03.16 30.06.16 30.09.16
Рrovision coverage of NPLs within total gross renegotiated loans
NPLs in total gross renegotiated loans
10.3% 11.0% 11.3%
8.3% 8.2%
78.6% 76.6% 65.9% 74.9% 75.4%
21.6% 19.9%
17.8% 17.2% 17.3%
7
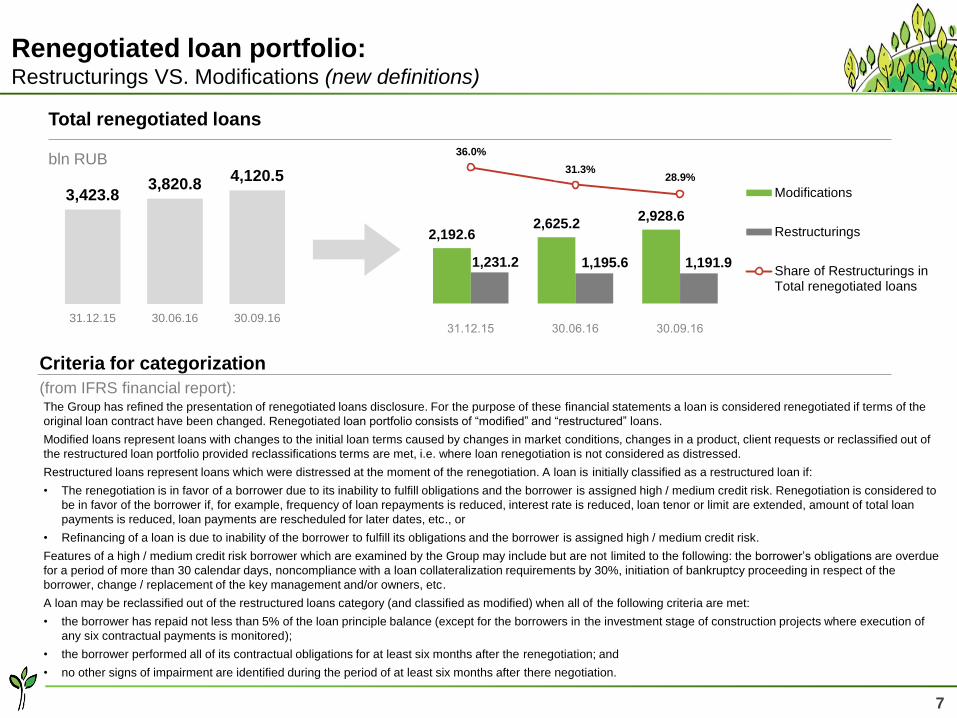
3,423.8 3,820.8
4,120.5
31.12.15 30.06.16 30.09.16
2,192.6 2,625.2
2,928.6
1,231.2 1,195.6 1,191.9
36.0%
31.3% 28.9%
Modifications
Restructurings
Share of Restructurings inTotal renegotiated loans
Renegotiated loan portfolio: Restructurings VS. Modifications (new definitions)
Total renegotiated loans
bln RUB
Criteria for categorization
(from IFRS financial report): The Group has refined the presentation of renegotiated loans disclosure. For the purpose of these financial statements a loan is considered renegotiated if terms of the
original loan contract have been changed. Renegotiated loan portfolio consists of “modified” and “restructured” loans.
Modified loans represent loans with changes to the initial loan terms caused by changes in market conditions, changes in a product, client requests or reclassified out of
the restructured loan portfolio provided reclassifications terms are met, i.e. where loan renegotiation is not considered as distressed.
Restructured loans represent loans which were distressed at the moment of the renegotiation. A loan is initially classified as a restructured loan if:
• The renegotiation is in favor of a borrower due to its inability to fulfill obligations and the borrower is assigned high / medium credit risk. Renegotiation is considered to
be in favor of the borrower if, for example, frequency of loan repayments is reduced, interest rate is reduced, loan tenor or limit are extended, amount of total loan
payments is reduced, loan payments are rescheduled for later dates, etc., or
• Refinancing of a loan is due to inability of the borrower to fulfill its obligations and the borrower is assigned high / medium credit risk.
Features of a high / medium credit risk borrower which are examined by the Group may include but are not limited to the following: the borrower’s obligations are overdue
for a period of more than 30 calendar days, noncompliance with a loan collateralization requirements by 30%, initiation of bankruptcy proceeding in respect of the
borrower, change / replacement of the key management and/or owners, etc.
A loan may be reclassified out of the restructured loans category (and classified as modified) when all of the following criteria are met:
• the borrower has repaid not less than 5% of the loan principle balance (except for the borrowers in the investment stage of construction projects where execution of
any six contractual payments is monitored);
• the borrower performed all of its contractual obligations for at least six months after the renegotiation; and
• no other signs of impairment are identified during the period of at least six months after there negotiation.
36.0%
31.3% 28.9%
8
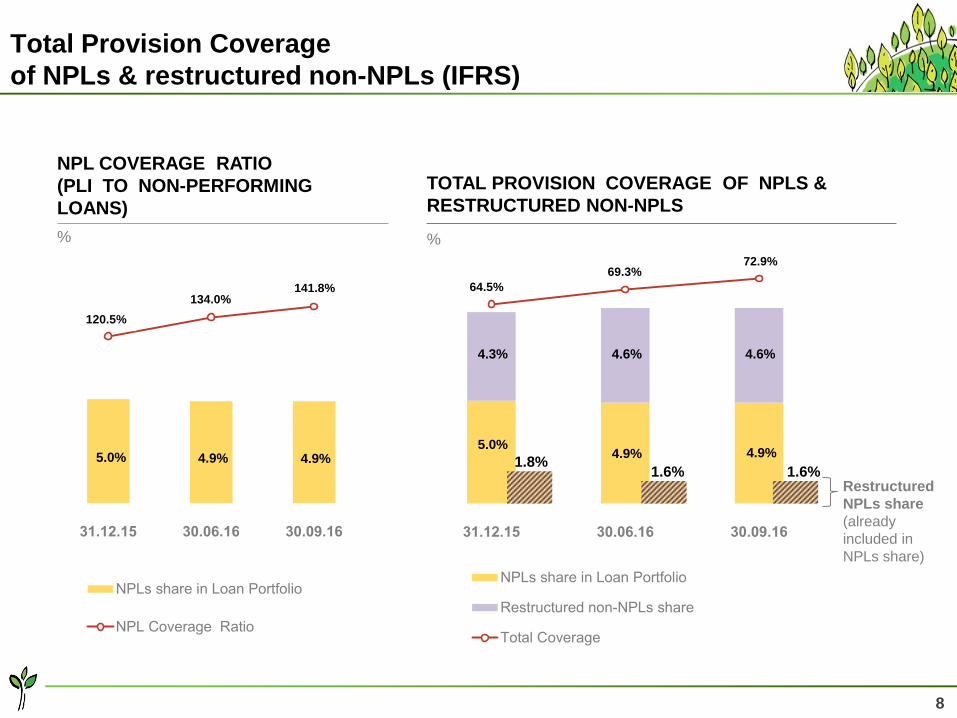
Total Provision Coverage
of NPLs & restructured non-NPLs (IFRS)
TOTAL PROVISION COVERAGE OF NPLS &
RESTRUCTURED NON-NPLS
%
5.0 4.9 4.9
4.3 4.6 4.6
64.5 69.3
72.9
0
10
20
30
40
50
60
70
80
0
2
4
6
8
10
12
NPL COVERAGE RATIO
(PLI TO NON-PERFORMING
LOANS)
%
Restructured
NPLs share
(already
included in
NPLs share)
5.0 4.9 4.9
120.5
134.0 141.8
0.0
2.0
4.0
6.0
8.0
10.0
12.0
1.8% 1.6% 1.6%
120.5%
134.0% 141.8% 64.5%
69.3% 72.9%
5.0% 4.9% 4.9% 5.0%
4.9% 4.9%
4.6% 4.6% 4.3%
9
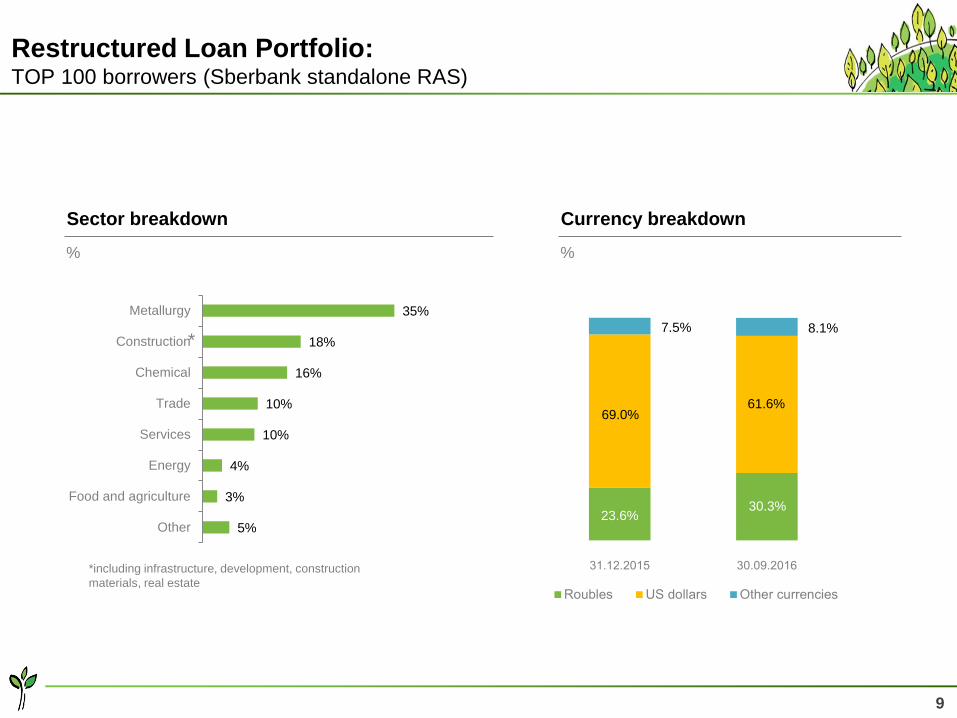
Restructured Loan Portfolio: TOP 100 borrowers (Sberbank standalone RAS)
Currency breakdown
%
23.6 30.3
69.0 61.6
7.5 8.1
Sector breakdown
%
5%
3%
4%
10%
10%
16%
18%
35%
Other
Food and agriculture
Energy
Services
Trade
Chemical
Construction
Metallurgy
*
*including infrastructure, development, construction
materials, real estate
7.5% 8.1%
61.6% 69.0%
23.6% 30.3%
10
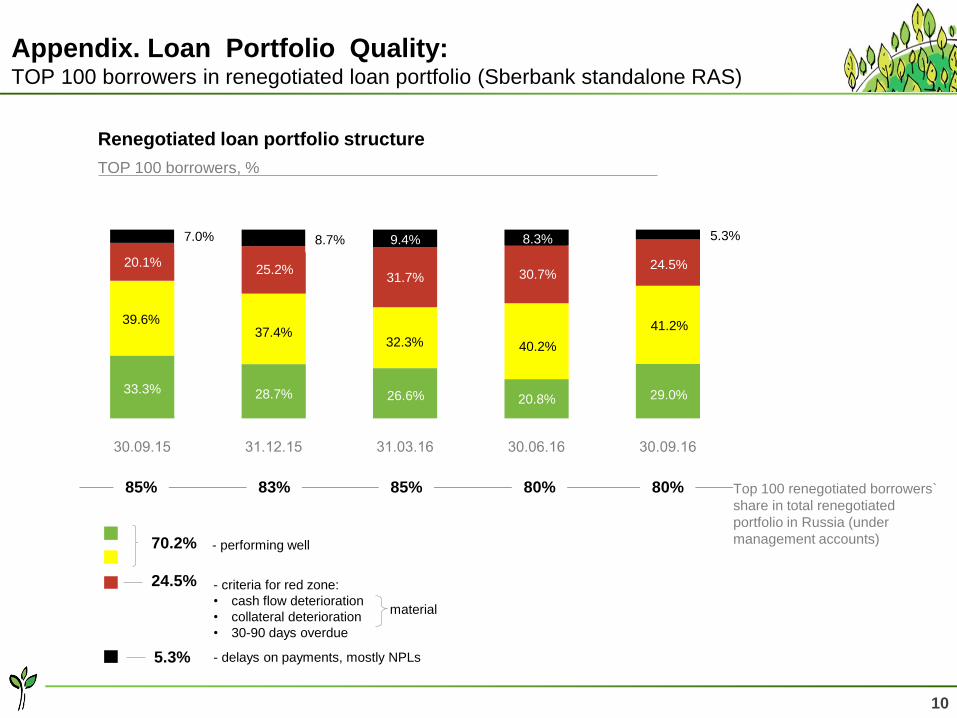
Appendix. Loan Portfolio Quality: TOP 100 borrowers in renegotiated loan portfolio (Sberbank standalone RAS)
Renegotiated loan portfolio structure
TOP 100 borrowers, %
33.3% 28.7% 26.6% 20.8% 29.0%
39.6% 37.4%
32.3% 40.2%
41.2%
20.1% 25.2%
31.7% 30.7% 24.5%
7.0% 8.7% 9.4% 8.3% 5.3%
Top 100 renegotiated borrowers`
share in total renegotiated
portfolio in Russia (under
management accounts)
85% 83% 85% 80%
- delays on payments, mostly NPLs 5.3%
- criteria for red zone:
• cash flow deterioration
• collateral deterioration
• 30-90 days overdue
24.5%
- performing well 70.2%
material
80%
7.0% 8.7% 5.3% 9.4% 8.3%
24.5% 30.7% 31.7%
25.2% 20.1%
39.6% 37.4%
32.3% 40.2%
41.2%
29.0% 20.8% 26.6% 28.7% 33.3%