implementing a contributory scoring approach for the gre ... · implementing a contributory scoring...
TRANSCRIPT
Implementing a Contributory ScoringApproach for the GRE® Analytical WritingSection: A Comprehensive EmpiricalInvestigation
April 2017
Research ReportETS RR–17-14
F. Jay Breyer
André A. Rupp
Brent Bridgeman
ETS Research Report Series
EIGNOR EXECUTIVE EDITOR
James CarlsonPrincipal Psychometrician
ASSOCIATE EDITORS
Beata Beigman KlebanovSenior Research Scientist
Heather BuzickResearch Scientist
Brent BridgemanDistinguished Presidential Appointee
Keelan EvaniniResearch Director
Marna Golub-SmithPrincipal Psychometrician
Shelby HabermanDistinguished Presidential Appointee
Anastassia LoukinaResearch Scientist
John MazzeoDistinguished Presidential Appointee
Donald PowersManaging Principal Research Scientist
Gautam PuhanPrincipal Psychometrician
John SabatiniManaging Principal Research Scientist
Elizabeth StoneResearch Scientist
Rebecca ZwickDistinguished Presidential Appointee
PRODUCTION EDITORS
Kim FryerManager, Editing Services
Ayleen GontzSenior Editor
Since its 1947 founding, ETS has conducted and disseminated scientific research to support its products and services, andto advance the measurement and education fields. In keeping with these goals, ETS is committed to making its researchfreely available to the professional community and to the general public. Published accounts of ETS research, includingpapers in the ETS Research Report series, undergo a formal peer-review process by ETS staff to ensure that they meetestablished scientific and professional standards. All such ETS-conducted peer reviews are in addition to any reviews thatoutside organizations may provide as part of their own publication processes. Peer review notwithstanding, the positionsexpressed in the ETS Research Report series and other published accounts of ETS research are those of the authors andnot necessarily those of the Officers and Trustees of Educational Testing Service.
The Daniel Eignor Editorship is named in honor of Dr. Daniel R. Eignor, who from 2001 until 2011 served the Research andDevelopment division as Editor for the ETS Research Report series. The Eignor Editorship has been created to recognizethe pivotal leadership role that Dr. Eignor played in the research publication process at ETS.
ETS Research Report Series ISSN 2330-8516
R E S E A R C H R E P O R T
Implementing a Contributory Scoring Approach for theGRE® Analytical Writing Section: A Comprehensive EmpiricalInvestigation
F. Jay Breyer, André A. Rupp, & Brent Bridgeman
Educational Testing Service, Princeton, NJ
In this research report, we present an empirical argument for the use of a contributory scoring approach for the 2-essay writing assess-ment of the analytical writing section of the GRE® test in which human and machine scores are combined for score creation at the taskand section levels. The approach was designed to replace a currently operational all-human check scoring approach in which machinescores are used solely as quality-control checks to determine when additional human ratings are needed due to unacceptably large scorediscrepancies. We use data from 6 samples of essays collected from test takers during operational administrations and special validitystudies to empirically evaluate 6 different score computation methods. During the presentation of our work, we critically discuss keymethodological design decisions and underlying rationales for these decisions. We close the report by discussing how the researchmethodology is generalizable to other testing programs and use contexts.
Keywords Automated essay scoring; check scoring approach; contributory scoring approach; GRE®; GRE® analytical writing;writing assessment; design decisions for automated scoring deployment; scoring methodology
doi:10.1002/ets2.12142
Automated essay scoring is a term that describes various artificial intelligence scoring technologies for extended writingtasks and is employed in many large-scale testing programs; see Shermis and Hamner (2013) for a comparison of differentapplications. Under an automated essay scoring approach, through use of specialized software, digitally submitted essaysget automatically parsed and specific linguistic elements pertaining to aspects of grammar, syntax, vocabulary, and orga-nization, among others, get evaluated and used in prediction models to create holistic scores or diagnostic feedback. Inany consideration of using automated essay scoring—specifically for operational assessments that aid in making high-stakes decisions—one needs to ensure that various stringent quality-control mechanisms are in place and that evidencefor different facets of the core validity argument is collected (for more details, see, e.g., Bejar, Mislevy, & Zhang, 2016;Williamson, Xi, & Breyer, 2012).
These fundamental issues take on a particular importance when the scoring approach for an assessment is changed,such as when one considers moving from a so-called all-human check scoring approach to a so-called contributory scoringapproach, which is the context that is the focus of the studies in this report. In the former, machine scores are only usedfor identifying cases when additional human raters might be needed to resolve discrepancies between first human ratingsand machine scores; however, machine scores are not used for eventual reporting. In the latter approach, machine scoresare generally combined with human ratings for reporting to save the costs of additional human raters.
In this research report, we specifically present an empirical argument for the use of a contributory scoring approachin place of an all-human check scoring approach for the GRE® Analytical Writing (GRE-AW) section. We argue thatthe contributory scoring approach yields more reliable and valid scores, which is especially critical for assessments withhigh-stakes consequences such as the GRE. We describe a systematic process that involves several data samples, analyses,and associated methodological design decisions to provide the necessary empirical evidence to deploy the contributoryscoring approach in practice.
We have organized this report into five major sections. In the first section, we discuss key terminology and method-ological approaches for automated scoring to create a framework for the discussion of the methods and results later in thereport. In the second section, we describe the motivation for this research along with the research questions that we use
Corresponding author: A. A. Rupp, E-mail: [email protected]
ETS Research Report No. RR-17-14. © 2017 Educational Testing Service 1
F. J. Breyer et al. Implementing a Contributory Scoring Approach for GRE-AW
to structure our investigations. In the third section, we describe the samples and methodological approaches that we usedto answer our research questions. In the fourth section, we describe the results of our analyses. We close the report with abrief summary of key findings and with a discussion of limitations of this work and recommendations for best practices.
Terminology and Motivation
The GRE® and the GRE® Analytical Writing Section
The GRE revised General Test comprises three sections: (a) verbal reasoning, (b) quantitative reasoning, and (c) ana-lytical writing. In our work, we use scale scores from all three sections for correlational analyses to empirically evaluaterelationships between verbal, quantitative, and writing skills.
Specifically, the verbal reasoning section measures skills that involve analyzing, evaluating, and synthesizing informa-tion contained in written material while recognizing relationships among different concepts. The quantitative reasoningsection measures problem-solving ability that relies on arithmetic, algebra, geometry, and numeric skills. The GRE-AWsection is designed specifically to assess critical thinking and analytic writing skills that provide evidence of writing toexpress and support complex ideas clearly and effectively (Educational Testing Service [ETS], 2016). All of the skills setsin the three test sections have been shown to be necessary for graduate and business school success (Kuncel, Hezlett, &Ones, 2014; Young, Klieger, Bochenek, Li, & Cline, 2014).
The GRE-AW section consists of two essays; each essay is produced under a 30-minute time limit and typed on a wordprocessor with limited capabilities (e.g., a cut-and-paste function is available but spelling error detection and grammarchecking functions are not). The first task asks test takers to evaluate or critique an argument presented in the promptby developing supporting evidence and reasoning; this task is consequently called the argument task. The second taskrequires the test taker to develop and support a position on an issue provided in the prompt; this task is consequentlycalled the issue task.
Automated Scoring Model Types
For the kinds of automated scoring models we consider in this report, we say that an automated/machine score is producedby an automated/machine scoring model using a supervised learning approach. The automated scoring model is built byextracting linguistic features from the response text through use of natural language processing techniques (Manning &Schütze, 1999) and utilizes these features to predict holistic human ratings. For the purpose of this report, we specificallyuse a nonnegative linear least squares regression approach (Cohen, Cohen, West, & Aiken, 2003); we do not consider othermachine learning techniques (Alpaydin, 2014) and other prediction models. It is often helpful to distinguish cases inwhich models are built for individual prompts or for prompt families that share the same core design parameters (i.e.,task types). Models for the former are sometimes referred to as prompt-specific models, whereas models for the latter aresometimes referred to as generic models. In this report, we specifically use two generic models associated with the twodistinct GRE-AW tasks under consideration.
Scoring Approaches for Reporting
As mentioned earlier, when considering the use of automated scoring in operational practice, it can be helpful to differ-entiate between check and contributory scoring approaches as well as, in certain lower stakes use contexts, sole machinescoring approaches; for a broader range of scoring approaches, please see Foltz, Leacock, Rupp, and Zhang (2016). Wedescribe each of these three approaches briefly in turn as they had been implemented in the past, in the case of the checkscoring approach, or are currently implemented, in the case of the contributory scoring approach, within the GRE-AWsection. The descriptions of these three approaches should be seen as illustrative and not comprehensive, as modificationsand adaptations are likely in place in other testing contexts.
Under either a check or a contributory scoring approach, the first human rating is compared to the machine score, andtheir relative difference is evaluated using what we call a primary adjudication threshold. Under a check scoring approach,the first human rating then becomes the task score if the score difference is below the primary adjudication threshold.If the score difference is equal to or greater than the threshold, a second human rater is asked to provide another rating.
2 ETS Research Report No. RR-17-14. © 2017 Educational Testing Service
F. J. Breyer et al. Implementing a Contributory Scoring Approach for GRE-AW
This rating is then combined with the first human rating for operational reporting or, in a few rare instances, adjudicatedthrough a supervisor rating; in either case, only human scores are reported.
Under a contributory scoring approach, if the human–machine score difference is below the primary adjudicationthreshold, then the first human rating is combined in a weighted manner—for example, a simple average—with themachine score; we call this the primary score combination rule. If the human–machine score difference is equal to orlarger than the primary adjudication threshold, then, as in the check scoring approach, additional human ratings areemployed, which are subsequently combined with human and/or machine scores unless a direct adjudication through asupervisor is required.
Under either scoring approach, how score combinations are made once the need for an adjudication is identified is afunction of what we call the secondary adjudication threshold and the associated secondary score combination rules thatspecify secondary allowable score differences and the mechanism for combining sets of scores, respectively. Together,the primary adjudication threshold, the primary score combination rule, the secondary adjudication threshold, and thesecondary score combination rules form a task-level score computation method. Once the task scores are available, theyneed to be further combined into a reported total score, which requires the determination of task score weights in whatwe call a task score combination rule. This total score might then be scaled using a reference distribution for operationalreporting.
Under a sole machine scoring approach, as the name implies, the machine score is used by itself for operational scoringwithout any additional human ratings. In high-stakes applications with important consequences for individual test takersand rigorous fairness standards for population subgroups, the lack of a human rating may not be acceptable. The sensitivityof validation issues in such a use context has been underscored in the popular press in recent years, where certain authorshave criticized the sole use of machine scores in certain situations that were particularly susceptible to gaming the system(Perelman, 2014a, 2014b; Winerip, 2012).
The argument of critics is that “nonsense” and perhaps “obviously flawed” essays that result from gaming attemptscan be detected by human readers but not always by built-in machine detectors (i.e., advisories) in the automated scoringsystem (see Ramineni, Trapani, Williamson, Davey, & Bridgeman, 2012a, or Breyer et al., 2014, for a description of the dif-ferent advisories evaluated for the GRE-AW section). For the purpose of this report, the sole machine scoring approach isnot considered further for the GRE-AW section because the consequential use of the GRE-AW section scores is associatedwith relatively high stakes for individual test takers.
Levels of Scoring
In describing the empirical evaluations of the check and contributory scoring approaches in the context of the GRE-AWsection in more detail, it is important to consider three levels of scoring that occur:
1. the human and/or machine ratings (rating level),2. the task scores for which the human or human and machine ratings are combined in some fashion after adjudication
procedures are instantiated (task level), and3. the aggregated total score for which the individual task scores are combined (section score level).
We will use different score levels for different analyses with the strongest emphasis on task scores and the aggregateGRE-AW section score.
Five Methodological Design Decisions
As described in the previous section, when implementing a contributory scoring approach operationally, testing programsneed to make five important methodological design decisions at the different score levels based on empirical evidence;these decisions involve determining
1. the primary score combination rule,2. the primary adjudication threshold,3. the secondary adjudication threshold,4. the secondary score combination rules, and5. the task score combination rule.
ETS Research Report No. RR-17-14. © 2017 Educational Testing Service 3
F. J. Breyer et al. Implementing a Contributory Scoring Approach for GRE-AW
Note that, in the context of the GRE-AW section, design decisions for 1–4 affect the computation of the issue andargument task scores, while design decisions for 5 are about the creation of the GRE-AW section score. We refer to thereported GRE-AW section score simply as the “AW score” in the remainder of this report for brevity and to distinguish itlinguistically from supplementary writing scores that we obtained from independent performance measures for some ofour test-taker samples.
Determining the Primary Adjudication Threshold
A major consideration for determining the primary adjudication threshold through empirical evidence has been theobservation that human and machine scores can separate from each other for some—but not all—subgroups of testtakers that are pertinent in comprehensive fairness evaluations; we call this issue score separation in short (Breyer et al.,2014; Bridgeman, Trapani, & Attali, 2012). Score separation is not something that can be evaluated properly by focusingon human–machine score differences at the rating level but, rather, needs to be evaluated by focusing on these differ-ences at the task or reported scale score level once adjudication procedures have been applied. Furthermore, it is generallyadvisable to perform these evaluations with different score pairs or frames of reference. In our work, we compared a con-tributory task score to a “gold standard” double-human score (i.e., where every response receives two human ratings) andto a (previously operational) check score.
For different assessments at ETS, the primary adjudication threshold has been set at .5 for the GRE-AW issue andargument tasks under an all-human check scoring approach as well as at 1.0 for the TOEFL® test’s integrated task undera contributory scoring approach when automated scoring was first implemented. This was done because of the relativelylarge observed score separation for subgroups at the rating level at the time in order to bring in additional human raterseven for somewhat smaller score differences. In contrast, the primary adjudication threshold has been set at 1.5 for both theTOEFL independent task and the PRAXIS® test’s argumentative task under a contributory scoring approach. Similarly, itwas recently reset to 2.0 for the TOEFL integrated task, with the potentially undesirable effects of the larger primary thresh-old on score separation compensated for by giving human ratings twice the weight of the machine scores for reportingpurposes (Breyer et al., 2014; Ramineni, Trapani, & Williamson, 2015; Ramineni, Trapani, Williamson, Davey, & Bridge-man, 2012b; Ramineni et al., 2012a).
In the work presented in this report, we report on findings for primary adjudication thresholds of .5, .75, and 1.0 becausethese were considered acceptable a priori by the program. Reasons for this choice include efforts to reduce the possibilityof threats to validity due to some vulnerabilities of any automated system to aforementioned gaming approaches andassociated sensitivities by stakeholders regarding the use of automated scoring systems in general; however, informationfrom additional analyses for thresholds of 1.5 and 2.0 are available upon request from the second author.
Determining the Primary Score Combination Rule
This methodological step is about determining the weights that the human ratings and, possibly, machine scores receiveunder a particular scoring approach. Common past practice at ETS has been to equally weight any ratings when creatingtask scores (Breyer et al., 2014; Ramineni et al., 2012b). However, as noted, there are exceptions. For example, for theintegrated task on the TOEFL test, which is already scored using a contributory scoring approach, the first human ratingreceives twice the weight of the machine score to partially compensate for the fact that differences between aspects of theconstruct that human raters can attend to and the machine can attend to are larger for this kind of task.
More generally speaking, instead of simply defaulting to an equally weighted average, we argue that this weightingdecision should be made through the use of empirical regression procedures. The methodology used to arrive at thisdecision might involve a design in which the human and machine ratings serve as the predictors and an independentcriterion, such as a double-human score, functions as the dependent variable. Determining this weighting scheme firstmakes most sense because the weighted ratings are used to form the task scores. For the check scoring approach, thereis no need to determine the weights of the ratings first because the automated scores do not figure into the calculation ofthe task scores and human ratings are treated as randomly equivalent (i.e., exchangeable), suggesting an equal weightingof any human ratings.
In our work, we conceptually consider the human and machine scores as complementary, each measuring differentaspects of the writing construct (i.e., one might say that human raters use a holistic scoring process and automated systems
4 ETS Research Report No. RR-17-14. © 2017 Educational Testing Service
F. J. Breyer et al. Implementing a Contributory Scoring Approach for GRE-AW
use an analytic scoring process). Thus we determined the appropriateness of the weights for the human and machineratings by predicting the score from an external measure of writing gathered in graduate school work and from an all-human check score from the GRE-AW section obtained on an alternate occasion within a 6-month period.
Determining the Secondary Adjudication Threshold
The next methodological step is determining the secondary adjudication threshold, which determines the allowable scoredifference of the first human rating, possibly the machine score, and any additional human ratings that are brought in.For example, if a primary adjudication threshold under an all-human check scoring approach is ±.5 points, the secondarythreshold may be set to 1.5 or 2.0 points, depending on the testing program, the secondary score combination rules, andthe associated reporting stakes. In our work, we examined secondary adjudication thresholds of 1.001, 1.5, and 2.0, in linewith previous practice at ETS.
Determining the Secondary Score Combination Rules
The next methodological step is determining the weights for how to combine human ratings and, possibly, machine scoresonce adjudication has become necessary. There are a variety of options, because multiple pairs of ratings can be comparedusing the secondary adjudication threshold once adjudication ratings are available. In particular, the selection of the sec-ondary score combination rules and the secondary adjudication threshold is based on that combination of primary andsecondary adjudication thresholds and associated score combination rules that most minimizes a carefully selected targetcriterion. At ETS, the criterion that is most commonly chosen for high-stakes use contexts such as the GRE, TOEFL, andPRAXIS tests is the human–machine score difference for critical subgroups at the section score level. We refer to the jointset of threshold and score combination rules across all adjudication stages as the resulting score computation method. Inour work, we compared the performance of six different methods using standardized mean score differences for subgroupsas the primary evaluation criterion, along with a few secondary ones.
Determining the Task Score Combination Rule
Finally, a decision must be made on how to combine the individual task scores to create an aggregate section score that canthen be scaled to a reference distribution for reporting, if desirable. Note that the task score combination rule can have animpact on score validity when different tasks target rather distinct aspects of the overall writing construct. Consequently,different weighting schemes assign different degrees of relative importance to different aspects of the empirical constructrepresentation. Determining such weights empirically can be a useful activity for operational testing programs even if theempirical results are used as a reference point only and an equal weighting continues to be used, for example, for reasonsof consistency with past practice and ease of communicability.
In the past at ETS, for the GRE-AW section, this weighting has taken the form of a simple average that is then roundedto half-point intervals, typically with an associated scale transformation. While this decision has been made by followingpast practices from other programs at ETS, we argue that it can be more strongly informed through the use of regressionprocedures in general. Under such a regression approach, the different individual task scores might form the predictors,and an independent criterion, such as a section score from an alternate testing occasion or a score from an independentwriting sample from graduate school course work, can form the dependent variable; this is the approach that we used inour work.
Motivation and Research Goals
Check Scoring Approach for the GRE® Analytical Writing Section
In the current implementation of the check scoring approach for the GRE-AW section, a first human rater evaluates eachessay, and, if the resulting score is from 1 to 6 inclusive (i.e., if the rater provides a nonzero rating), the essay response issent to the e-rater® automated scoring engine, which then produces a score using a generic scoring model for that task; seeBurstein, Tetreault, and Madnani (2013) for an overview. If the first human rating is 0 or if e-rater produces an advisory,the essay is sent to a second human rater for verification.
ETS Research Report No. RR-17-14. © 2017 Educational Testing Service 5
F. J. Breyer et al. Implementing a Contributory Scoring Approach for GRE-AW
Conceptually, a human rating of 0 indicates that writing skills cannot be reliably evaluated; for example, the responsedoes not correspond to the assigned topic, merely copies the assignment description, or is written in a foreign language.A machine advisory similarly indicates that the response should not be machine scored, albeit not always for the samereason that a human rater would give. For example, if the response is too short or too long relative to a calibration set,does not contain paragraph breaks, or contains atypical repetition, e-rater may produce an advisory, but a human ratermight consider these aspects acceptable for producing a reliable rating.
When the unrounded machine score and the first human rating are within ±.5 points of each other (i.e., are belowthe primary adjudication threshold), the first human rating becomes the final task score; no other human raters evaluatethat essay. If an additional human rater is required to rate the essay, then the second human rating is compared to thefirst human rating using the secondary adjudication threshold. If those two human ratings are 1 point or less apart (i.e.,are considered “adjacent”), the final task score is the average of the two human ratings. The average, in this case, is theequal weighting of the two human ratings. If the two human ratings are more than 1 point apart (i.e., are not considered“adjacent”), then a third human is required and more complex secondary score combination rules specify how the humanratings are used in computing the final task score.
As we noted in the first section, regardless of how many human ratings are required to arrive at a task score, the machinescore does not contribute to the task score under the all-human check scoring approach. Moreover, each argument andissue task is scored separately using the same process. To create the total AW section score, the resulting argument andissue task scores are combined and then averaged using equal weighting, and the resulting total score is then rounded upto the nearest half-point increment. This creates a reporting scale that ranges from a minimum score of 0 to a maximumscore of 6 in half-point increments (i.e., 0, .5, 1.5, 2, 2.5, … , 5.5, 6); only the total score is reported for the GRE-AWsection (i.e., individual task scores are not reported).
Previous Research on Scoring Approaches for the GRE® Analytical Writing Section
Two previous studies had supported the use of an all-human check scoring approach for the GRE-AW section. Ramineniet al. (2012a) found that a prompt-specific model was appropriate for argument prompts and that a generic model with aprompt-specific intercept was a viable candidate for use with issue prompts. Recently, Breyer et al. (2014) demonstratedthat two separate generic models, one for argument prompts and one for issue prompts, were appropriate for use in acheck score implementation as well.
Both of these studies built and evaluated prompt-specific and generic models for argument and issue tasks separatelyand performed statistical evaluations by prompt, test center country, gender, and ethnic subgroups. The authors also eval-uated correlations of task scores with scores from other GRE sections and simulated GRE-AW scores under each modelscenario and different primary adjudication thresholds. However, Ramineni et al. (2012a) and Breyer et al. (2014) did notcompare the all-human check scoring and contributory scoring approaches directly. They also focused their evaluationsextensively on reducing human–machine score separation for subgroups at the rating level rather than on reducing thisseparation at the section level. In the work that we present in this report, we fill in these gaps and subsequently argue forthe use of a contributory scoring approach using a broader portfolio of empirical evidence.
Advantages of a Contributory Scoring Approach
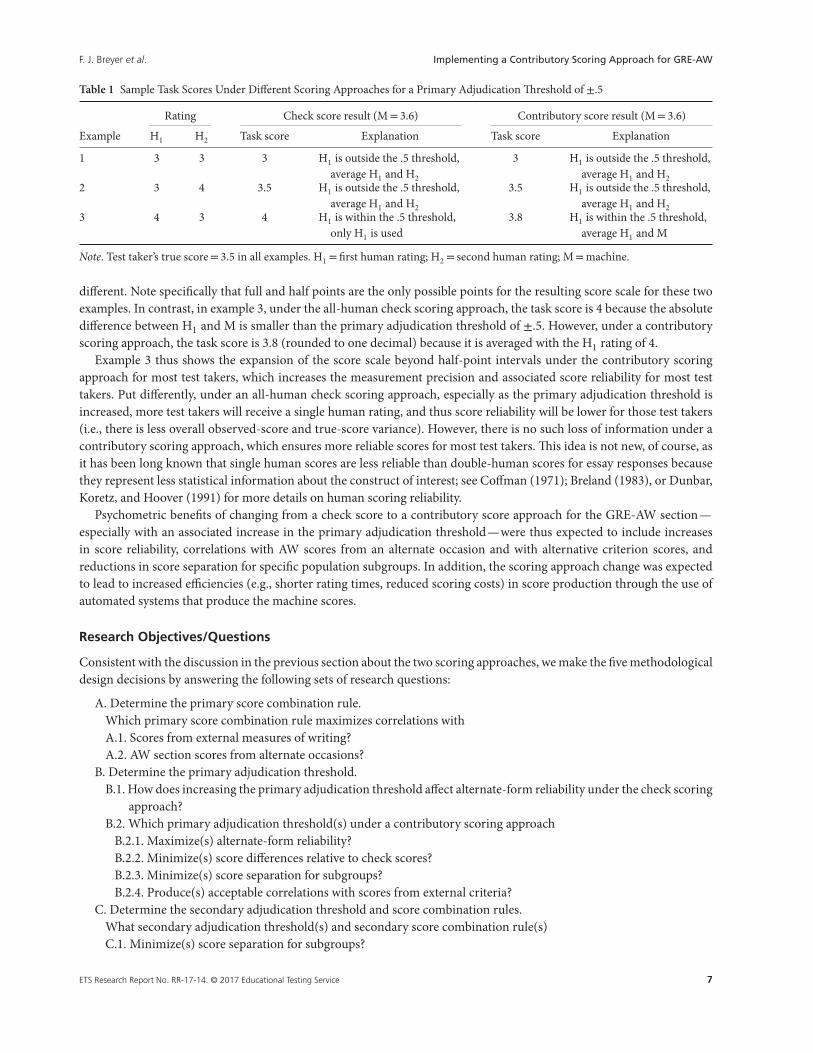
The present use of the all-human check scoring approach creates, in effect, two parallel scales for different subgroups oftest takers as a function of the discrete nature of the human score scale. Consider three examples presented in Table 1to illustrate this phenomenon. In each case, the test taker’s “true” score from two ideal human raters is 3.5; the resultingcheck and contributory scores are provided for the same machine (M) score, M= 3.6; the primary adjudication thresholdis ±.5. The body of Table 1 shows the example number, the H1 and H2 ratings, and the task score results, along with anannotated score computation explanation.
In example 1, an H1 rating of 3, an M rating of 3.6, and an H2 rating of 3 result in a task score of 3 under the all-humancheck and contributory scoring approaches because the absolute difference between H1 and M is larger than the primaryadjudication threshold of ±.5 but H1 and H2 are identical. In example 2, an H1 rating of 3, an M rating of 3.6, and anH2 rating of 4 result in a task score of 3.5 under the all-human check and contributory scoring approaches because theabsolute difference between H1 and M is again larger than the primary adjudication threshold of ±.5 but H1 and H2 are
6 ETS Research Report No. RR-17-14. © 2017 Educational Testing Service
F. J. Breyer et al. Implementing a Contributory Scoring Approach for GRE-AW
Table 1 Sample Task Scores Under Different Scoring Approaches for a Primary Adjudication Threshold of ±.5
Rating Check score result (M= 3.6) Contributory score result (M= 3.6)
Example H1 H2 Task score Explanation Task score Explanation
1 3 3 3 H1 is outside the .5 threshold,average H1 and H2
3 H1 is outside the .5 threshold,average H1 and H2
2 3 4 3.5 H1 is outside the .5 threshold,average H1 and H2
3.5 H1 is outside the .5 threshold,average H1 and H2
3 4 3 4 H1 is within the .5 threshold,only H1 is used
3.8 H1 is within the .5 threshold,average H1 and M
Note. Test taker’s true score= 3.5 in all examples. H1 = first human rating; H2 = second human rating; M=machine.
different. Note specifically that full and half points are the only possible points for the resulting score scale for these twoexamples. In contrast, in example 3, under the all-human check scoring approach, the task score is 4 because the absolutedifference between H1 and M is smaller than the primary adjudication threshold of ±.5. However, under a contributoryscoring approach, the task score is 3.8 (rounded to one decimal) because it is averaged with the H1 rating of 4.
Example 3 thus shows the expansion of the score scale beyond half-point intervals under the contributory scoringapproach for most test takers, which increases the measurement precision and associated score reliability for most testtakers. Put differently, under an all-human check scoring approach, especially as the primary adjudication threshold isincreased, more test takers will receive a single human rating, and thus score reliability will be lower for those test takers(i.e., there is less overall observed-score and true-score variance). However, there is no such loss of information under acontributory scoring approach, which ensures more reliable scores for most test takers. This idea is not new, of course, asit has been long known that single human scores are less reliable than double-human scores for essay responses becausethey represent less statistical information about the construct of interest; see Coffman (1971); Breland (1983), or Dunbar,Koretz, and Hoover (1991) for more details on human scoring reliability.
Psychometric benefits of changing from a check score to a contributory score approach for the GRE-AW section—especially with an associated increase in the primary adjudication threshold—were thus expected to include increasesin score reliability, correlations with AW scores from an alternate occasion and with alternative criterion scores, andreductions in score separation for specific population subgroups. In addition, the scoring approach change was expectedto lead to increased efficiencies (e.g., shorter rating times, reduced scoring costs) in score production through the use ofautomated systems that produce the machine scores.
Research Objectives/Questions
Consistent with the discussion in the previous section about the two scoring approaches, we make the five methodologicaldesign decisions by answering the following sets of research questions:
A. Determine the primary score combination rule.Which primary score combination rule maximizes correlations withA.1. Scores from external measures of writing?A.2. AW section scores from alternate occasions?
B. Determine the primary adjudication threshold.B.1. How does increasing the primary adjudication threshold affect alternate-form reliability under the check scoring
approach?B.2. Which primary adjudication threshold(s) under a contributory scoring approach
B.2.1. Maximize(s) alternate-form reliability?B.2.2. Minimize(s) score differences relative to check scores?B.2.3. Minimize(s) score separation for subgroups?B.2.4. Produce(s) acceptable correlations with scores from external criteria?
C. Determine the secondary adjudication threshold and score combination rules.What secondary adjudication threshold(s) and secondary score combination rule(s)C.1. Minimize(s) score separation for subgroups?
ETS Research Report No. RR-17-14. © 2017 Educational Testing Service 7
F. J. Breyer et al. Implementing a Contributory Scoring Approach for GRE-AW
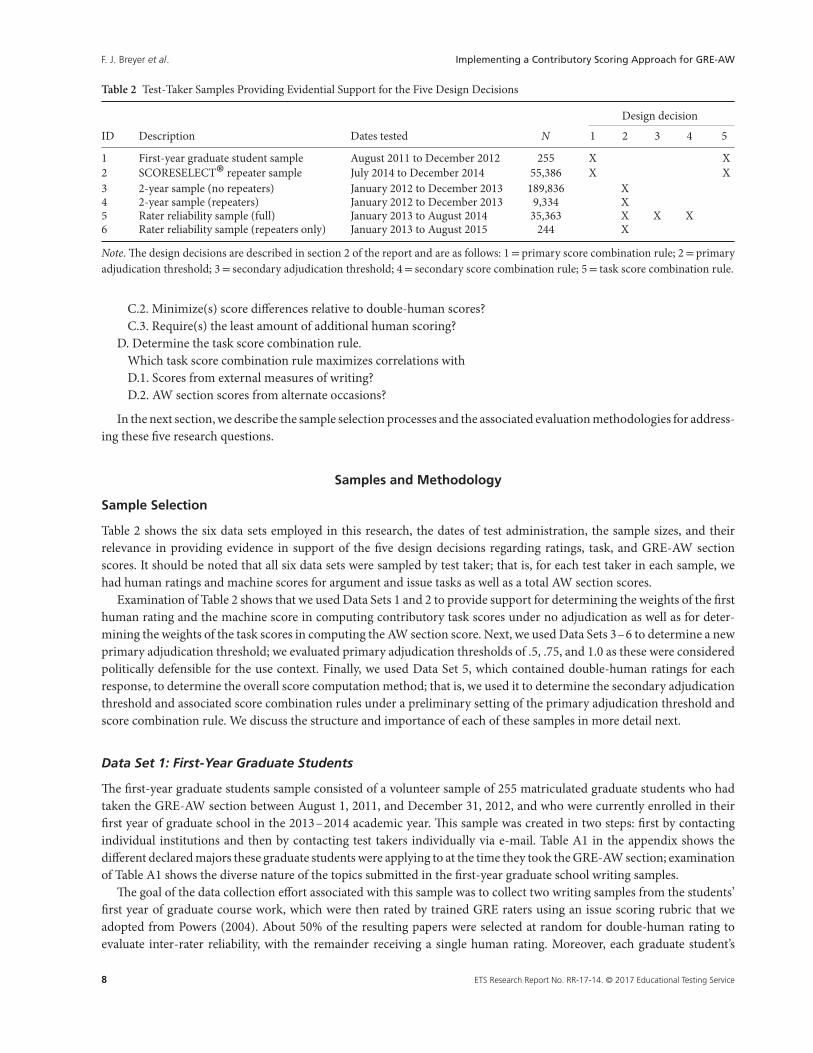
Table 2 Test-Taker Samples Providing Evidential Support for the Five Design Decisions
Design decision
ID Description Dates tested N 1 2 3 4 5
1 First-year graduate student sample August 2011 to December 2012 255 X X2 SCORESELECT® repeater sample July 2014 to December 2014 55,386 X X3 2-year sample (no repeaters) January 2012 to December 2013 189,836 X4 2-year sample (repeaters) January 2012 to December 2013 9,334 X5 Rater reliability sample (full) January 2013 to August 2014 35,363 X X X6 Rater reliability sample (repeaters only) January 2013 to August 2015 244 X
Note. The design decisions are described in section 2 of the report and are as follows: 1= primary score combination rule; 2= primaryadjudication threshold; 3= secondary adjudication threshold; 4= secondary score combination rule; 5= task score combination rule.
C.2. Minimize(s) score differences relative to double-human scores?C.3. Require(s) the least amount of additional human scoring?
D. Determine the task score combination rule.Which task score combination rule maximizes correlations withD.1. Scores from external measures of writing?D.2. AW section scores from alternate occasions?
In the next section, we describe the sample selection processes and the associated evaluation methodologies for address-ing these five research questions.
Samples and Methodology
Sample Selection
Table 2 shows the six data sets employed in this research, the dates of test administration, the sample sizes, and theirrelevance in providing evidence in support of the five design decisions regarding ratings, task, and GRE-AW sectionscores. It should be noted that all six data sets were sampled by test taker; that is, for each test taker in each sample, wehad human ratings and machine scores for argument and issue tasks as well as a total AW section scores.
Examination of Table 2 shows that we used Data Sets 1 and 2 to provide support for determining the weights of the firsthuman rating and the machine score in computing contributory task scores under no adjudication as well as for deter-mining the weights of the task scores in computing the AW section score. Next, we used Data Sets 3–6 to determine a newprimary adjudication threshold; we evaluated primary adjudication thresholds of .5, .75, and 1.0 as these were consideredpolitically defensible for the use context. Finally, we used Data Set 5, which contained double-human ratings for eachresponse, to determine the overall score computation method; that is, we used it to determine the secondary adjudicationthreshold and associated score combination rules under a preliminary setting of the primary adjudication threshold andscore combination rule. We discuss the structure and importance of each of these samples in more detail next.
Data Set 1: First-Year Graduate Students
The first-year graduate students sample consisted of a volunteer sample of 255 matriculated graduate students who hadtaken the GRE-AW section between August 1, 2011, and December 31, 2012, and who were currently enrolled in theirfirst year of graduate school in the 2013–2014 academic year. This sample was created in two steps: first by contactingindividual institutions and then by contacting test takers individually via e-mail. Table A1 in the appendix shows thedifferent declared majors these graduate students were applying to at the time they took the GRE-AW section; examinationof Table A1 shows the diverse nature of the topics submitted in the first-year graduate school writing samples.
The goal of the data collection effort associated with this sample was to collect two writing samples from the students’first year of graduate course work, which were then rated by trained GRE raters using an issue scoring rubric that weadopted from Powers (2004). About 50% of the resulting papers were selected at random for double-human rating toevaluate inter-rater reliability, with the remainder receiving a single human rating. Moreover, each graduate student’s
8 ETS Research Report No. RR-17-14. © 2017 Educational Testing Service
F. J. Breyer et al. Implementing a Contributory Scoring Approach for GRE-AW
GRE-AW argument and issue essays were rescored by two trained human raters using the same rubric as well as e-raterversion 14.1 to ensure that the most current scoring rubrics, automated scoring engine version, and automated scoringmodels were used.
Table A2 shows the human–human agreement from this sample while Table A3 shows the human–machine agree-ment. Both tables show the number of test takers, rating/score means and standard deviations, and agreement statisticsthat include the standardized mean score difference or Cohen’s d, the quadratic-weighted kappa (QWK), and the Pearsoncorrelation (r) between the ratings/scores. We note that all agreement indices met general industry guidelines at the ratinglevel (see Williamson et al., 2012) but also acknowledge that this sample is relatively small, which limits the generalizabil-ity of the results. We used this sample to help determine the primary score combination rule as well as the task scorecombination rule because this data set contained independent criterion score information that was not readily availablein the other data sets.
Data Set 2: Repeaters Using the SCORESELECT® Service
The SCORESELECT repeater sample consisted of test takers who took the GRE at least two times between July 1, 2014,and December 31, 2014, in response to the SCORESELECT service option from the GRE program (Educational TestingService, 2015). SCORESELECT permits a test taker to select those scores from the administration of their choice that theywant to send to graduate programs. We note that this sample is large so that conclusions based on analyses in this sampleare relatively robust. Like the first-year graduate student sample, we used this sample to help determine the primary scorecombination rule as well as the task score combination rule because this data set also contained independent criterionscore information that was not readily available in the other data sets.
Data Sets 3 and 4: Operational 2-Year Samples
An overall sample with repeaters was first selected at random from operational administrations so that half of the respon-dents were tested between January and December 2012 and half were tested between January and December 2013. Thisoverall sample was then subdivided into two subsamples: the 2-year no-repeater sample and the 2-year repeater sample.The 2-year repeater sample consisted of those test takers who took the GRE-AW section a second time; different promptswere used on each occasion.
We used the 2-year no-repeater sample to evaluate standardized mean score differences at different primary adjudi-cation thresholds as well as correlations among various sets of scores to determine the primary adjudication threshold.We used the 2-year repeater sample to evaluate the alternate-form reliability, again to determine the primary adjudicationthreshold. Both of these samples were reasonably large so that conclusions based on analyses of these samples are relativelyrobust.
Data Sets 5 and 6: Rater Reliability Samples
The full rater reliability sample included double-human ratings for 5% of randomly selected test takers; those test-takerresponses were selected into the sample regardless of their e-rater scores so that double-human ratings and machine scoreswere available for responses to issue and argument tasks for all test takers in this sample. The specific rater reliabilityrepeater sample consisted of those 244 test takers who took the GRE-AW section twice in the stated time period.
We specifically used the rater reliability repeater sample to evaluate alternate-occasion reliability in the determinationof the primary adjudication threshold. The two samples together permitted comparisons of double-human, contributory,and all-human check scores on the same set of observations. This allowed for an empirical comparison of the all-humancheck scoring approach and the contributory scoring approach at both the task score and the AW section score levelsto determine alternate-occasion reliability. It also allowed us to assess the effects of using different score computationmethods on key quality-control statistics.
Automated Scoring Models
The generic scoring models that we used were the same generic models for the argument and issue tasks that had been usedin the operational all-human check scoring approach with e-rater engine version 14.1; no new models were developed for
ETS Research Report No. RR-17-14. © 2017 Educational Testing Service 9
F. J. Breyer et al. Implementing a Contributory Scoring Approach for GRE-AW
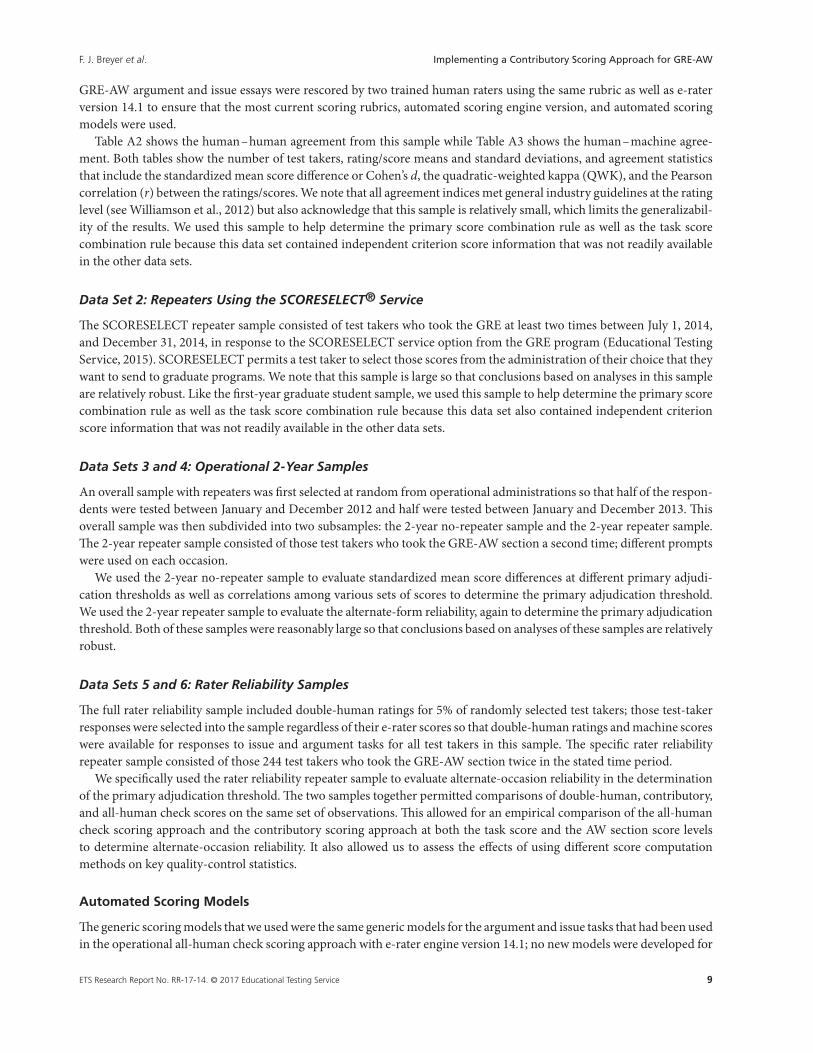
Table 3 A Comparison of Six Score Computation Method for Tasks
Score computation method
Design decision 1 2 3 4 5 6
Primary adjudicationthreshold
1.0 1.0 1.0 1.0 1.0 1.0
Primary scorecombination rule
T= (H1 +M)/2 T= (H1 +M)/2 T= (H1 +M)/2 T= (H1 +M)/2 T= (H1 +M)/2 T= (H1 +M)/2
Secondary adjudicationthreshold (2TH)
1.0001 1.5 2.0 1.5 N/A N/A
Secondary scorecombination rulesRule 1 Sort all ratings Sort all ratings Sort all ratings Drop m Drop M N/ARule 2 Compare pairs Compare pairs Compare pairs Sort all H ratings N/A N/ARule 3 Average all
pairs< 2THAverage all
pairs< 2THAverage all
pairs< 2THAverage all Hpairs< 2TH
N/A N/A
Rule 4 Average allratings< 2TH
Average allratings< 2TH
Average allratings< 2TH
Average all Hratings< 2TH
Average H1and H2
Average allratings
Rule 5 If any H= 0,HADJ = final score
If any H= 0,HADJ = final score
If any H= 0,HADJ = final score
If any H= 0,HADJ = final score
N/A If any H= 0,HADJ = final
score
Note. H1 = first human rating; H2 = second human rating; HADJ = human adjudicator rating; M=machine score; 2TH= secondary adjudication thresh-old.
this research. Table A4 shows the feature names, the R2, the relative percentage weights (Johnson, 2000), and the relativeimportance weights (Azen & Budescu, 2003; Budescu, 1993) used to produce the argument and issue machine scores fromthese models.
Note that relative percentage weights show each feature’s weighted contribution to the predicted human score as afunction of the sum of the standardized regression weights, whereas the relative importance weights are interpreted as aproportion of the contribution each predictor makes to the multiple correlation (i.e., R2). We note that the largest featureweights are for the organization and development features regardless of the type of weight that is examined for bothargument and issue models; these features are strongly related to essay length.
Score Computation Methods
As we discussed earlier, after the primary adjudication threshold and primary score combination rule are determined,the secondary adjudication threshold and associated score combination rules have to be determined to form a scorecomputation method. We evaluated six overall score computation methods, which are presented in Table 3. The tableshows, for each score computation method, the primary adjudication threshold, the primary score combination rule,the secondary adjudication threshold, and the secondary score combination rules. We note that we fixed the primaryadjudication threshold at 1.0 for each of the six score computation methods; this value was deemed acceptable in the priorevaluations and desired by in-house stakeholders. Furthermore, we employed the same primary score combination rulethat provides an equal weighting to the first human rating and the machine score under a contributory scoring approachfor all methods, because we found, based on preliminary analyses, that it maximized correlations of task scores with scoresfrom external writing measures and AW scores from an alternate occasion.
The key computational difference between Computation Methods 1–3 is the specification of the secondary adjudica-tion threshold. Furthermore, Computation Method 4 ignores the machine score if the score difference between the firsthuman rating and the machine score is larger than the primary adjudication threshold; subsequently, all-human scoringoccurs, including the possibility of adjudicator scoring. Computation Method 5 similarly ignores the machine score underthis condition but then simply averages the two human ratings for reporting. Computation Method 6 simply takes theaverage of the first human rating and the machine score regardless of their difference.
Expressed mathematically, let T represent the task score for either argument or issue (i.e., TA, TI), let H1, H2, H3, Hadjrepresent the first, second, third, and adjudicator ratings, let Xk contain the set of possible ratings {H1, H2, H3, Hadj, M},let M be the machine score, and let 2TH be the secondary adjudication threshold. Then, the primary score combination
10 ETS Research Report No. RR-17-14. © 2017 Educational Testing Service
F. J. Breyer et al. Implementing a Contributory Scoring Approach for GRE-AW
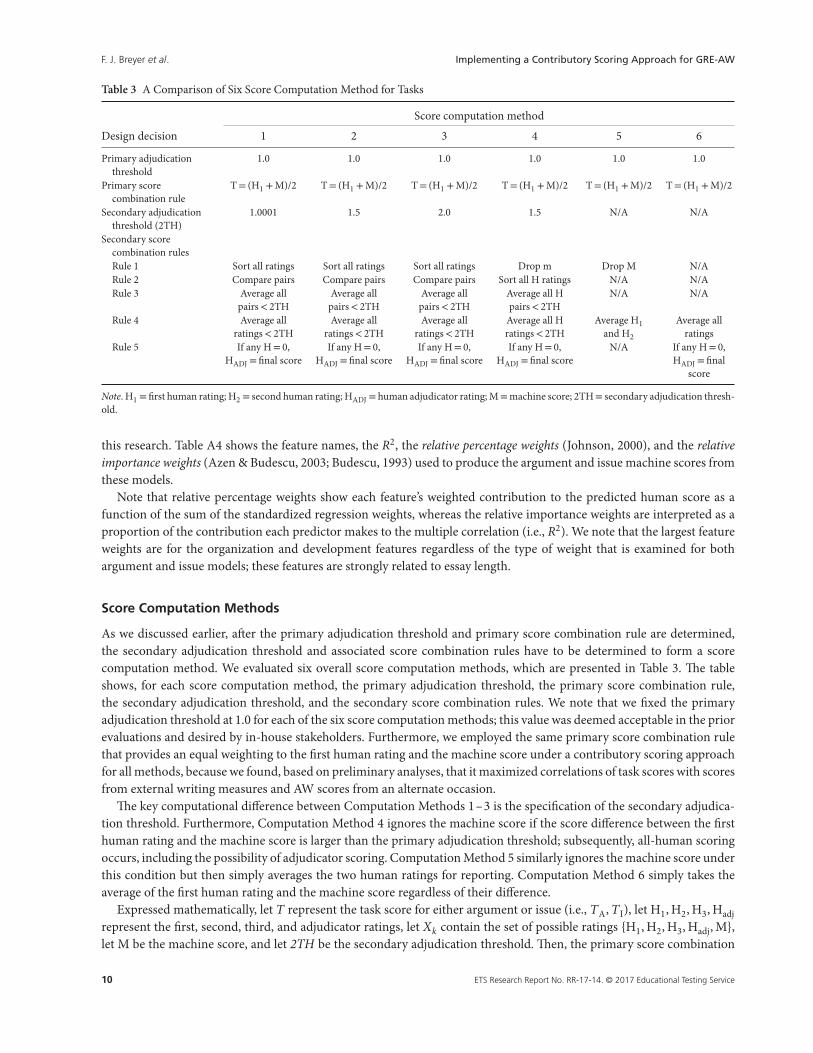
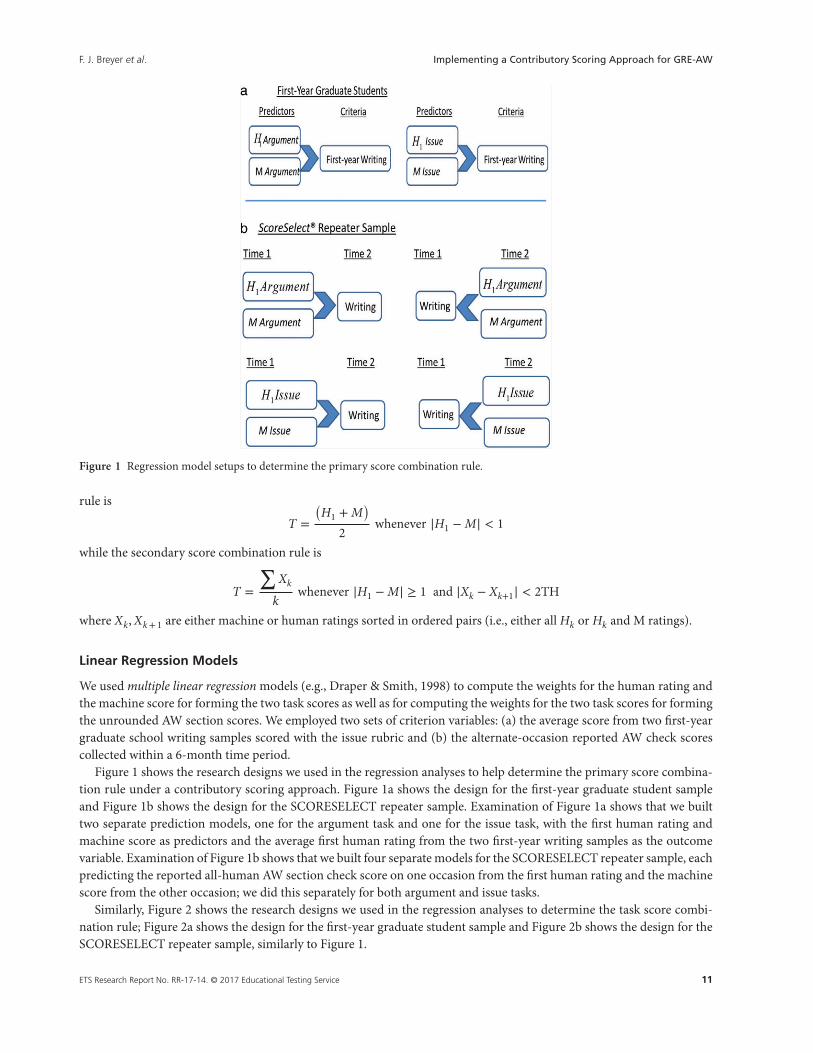
Figure 1 Regression model setups to determine the primary score combination rule.
rule is
T =(
H1 + M)
2whenever |H1 − M| < 1
while the secondary score combination rule is
T =
∑Xk
kwhenever |H1 − M| ≥ 1 and |Xk − Xk+1| < 2TH
where Xk, Xk+ 1 are either machine or human ratings sorted in ordered pairs (i.e., either all Hk or Hk and M ratings).
Linear Regression Models
We used multiple linear regression models (e.g., Draper & Smith, 1998) to compute the weights for the human rating andthe machine score for forming the two task scores as well as for computing the weights for the two task scores for formingthe unrounded AW section scores. We employed two sets of criterion variables: (a) the average score from two first-yeargraduate school writing samples scored with the issue rubric and (b) the alternate-occasion reported AW check scorescollected within a 6-month time period.
Figure 1 shows the research designs we used in the regression analyses to help determine the primary score combina-tion rule under a contributory scoring approach. Figure 1a shows the design for the first-year graduate student sampleand Figure 1b shows the design for the SCORESELECT repeater sample. Examination of Figure 1a shows that we builttwo separate prediction models, one for the argument task and one for the issue task, with the first human rating andmachine score as predictors and the average first human rating from the two first-year writing samples as the outcomevariable. Examination of Figure 1b shows that we built four separate models for the SCORESELECT repeater sample, eachpredicting the reported all-human AW section check score on one occasion from the first human rating and the machinescore from the other occasion; we did this separately for both argument and issue tasks.
Similarly, Figure 2 shows the research designs we used in the regression analyses to determine the task score combi-nation rule; Figure 2a shows the design for the first-year graduate student sample and Figure 2b shows the design for theSCORESELECT repeater sample, similarly to Figure 1.
ETS Research Report No. RR-17-14. © 2017 Educational Testing Service 11
F. J. Breyer et al. Implementing a Contributory Scoring Approach for GRE-AW
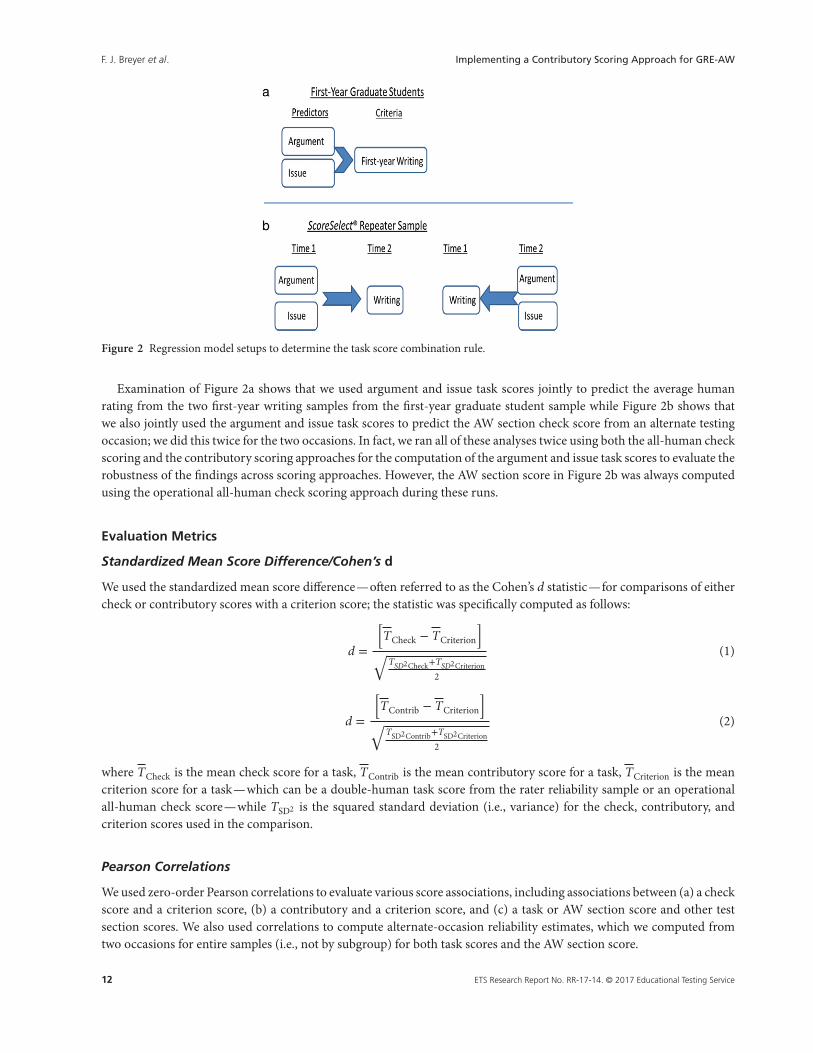
Figure 2 Regression model setups to determine the task score combination rule.
Examination of Figure 2a shows that we used argument and issue task scores jointly to predict the average humanrating from the two first-year writing samples from the first-year graduate student sample while Figure 2b shows thatwe also jointly used the argument and issue task scores to predict the AW section check score from an alternate testingoccasion; we did this twice for the two occasions. In fact, we ran all of these analyses twice using both the all-human checkscoring and the contributory scoring approaches for the computation of the argument and issue task scores to evaluate therobustness of the findings across scoring approaches. However, the AW section score in Figure 2b was always computedusing the operational all-human check scoring approach during these runs.
Evaluation Metrics
Standardized Mean Score Difference/Cohen’s d
We used the standardized mean score difference—often referred to as the Cohen’s d statistic—for comparisons of eithercheck or contributory scores with a criterion score; the statistic was specifically computed as follows:
d =
[TCheck − TCriterion
]√
TSD2Check+TSD2Criterion2
(1)
d =
[TContrib − TCriterion
]√
TSD2Contrib+TSD2Criterion2
(2)
where TCheck is the mean check score for a task, TContrib is the mean contributory score for a task, TCriterion is the meancriterion score for a task—which can be a double-human task score from the rater reliability sample or an operationalall-human check score—while TSD2 is the squared standard deviation (i.e., variance) for the check, contributory, andcriterion scores used in the comparison.
Pearson Correlations
We used zero-order Pearson correlations to evaluate various score associations, including associations between (a) a checkscore and a criterion score, (b) a contributory and a criterion score, and (c) a task or AW section score and other testsection scores. We also used correlations to compute alternate-occasion reliability estimates, which we computed fromtwo occasions for entire samples (i.e., not by subgroup) for both task scores and the AW section score.
12 ETS Research Report No. RR-17-14. © 2017 Educational Testing Service

F. J. Breyer et al. Implementing a Contributory Scoring Approach for GRE-AW
Table 4 A Summary of Statistically Optimal as Well as Conceptual H1 and Machine Weights
Percentageweights
Relativeimportanceweights (%)
Weights Task Criterion N H1 M H1 M R2 Zero-order r
Optimal (regression) Argument First-year writing 253a 23 77 37 63 .14 .38Time 2 AW 55,386 36 64 43 57 .62 .79Time 1 AW 55,386 37 63 43 57 .62 .79
Issue First-year writing 255 42 58 47 53 .14 .38Time 2 AW 55,386 39 61 45 55 .60 .78Time 1 AW 55,386 37 63 44 56 .62 .79
Conceptual Argument Time 2 AWb 55,386 100 0 — — .55 .74Time 2 AW 55,386 67 33 — — .58 .76Time 2 AW 55,386 60 40 — — .58 .76Time 2 AW 55,386 50 50 — — .59 .77
Issue Time 2 AWb 55,386 100 0 — — .56 .75Time 2 AW 55,386 67 33 — — .58 .76Time 2 AW 55,386 60 40 — — .59 .77Time 2 AW 55,386 50 50 — — .61 .78
Note. AW= analytical writing; H1 = first human rating; M=machine.aTwo individuals received fatal advisories and thus did not receive Argument machine scores. bThis row represents the all-human checkscoring approach.
Quadratic-Weighted Kappa
QWK characterizes the degree of agreement between two discrete (i.e., rounded) scores after correcting for chance agree-ment; it also provides a larger weight for larger score differences due to the quadratic penalty function it uses. We usedQWK to evaluate the agreement between human ratings and machine scores for the two generic scoring models for theargument and issue tasks.
In the following section, we describe the results for our research questions listed earlier to make the five methodologicaldesign decisions for implementing the contributory scoring approach.
Results
Set A: Determining the Primary Score Combination Rule
The first design decision when implementing a contributory scoring approach is the weighting of the human and machinescores when no adjudication is required. Table 4 shows a summary of statistically optimal (i.e., linear regression based)and conceptual weights for the first human rating and machine score based on the research design in Figure 1; conceptualweights are predetermined weights as suggested by past research (Ramineni et al., 2012a, 2012b) and are designed to bemore easily communicable to stakeholders (i.e., test takers and test users). Specifically, Table 4 shows the types of weights,the task, the predicted criterion, the number of cases used in the regression, the relative percentage weights and the relativeimportance weights for H1 and M, the R2, and the zero-order correlations; the 100% value for H1 in the table representsthe all-human check scoring approach.
Examination of Table 4 illustrates that the machine score tends to receive a higher weight compared to the first humanrating when these weights are empirically estimated through regression procedures no matter what the criterion of predic-tion or task is. The overweighting of the machine score seems somewhat surprising at first for the argument task becausethe e-rater engine does not have any features related to the argumentation facet of that writing task; see Table A4 for thefeatures that are present in the generic model. The overweighting is especially pronounced for the models that predictfirst-year writing scores; this is also reflected in the zero-order correlations and the associated R2 of .14 for these models,which are low.
However, these patterns are most likely due to the fact that the writing samples come from multiple areas of graduatestudy with a large diversity of topics, as shown in Table A1, and a possible range restriction for their scores due to the fact
ETS Research Report No. RR-17-14. © 2017 Educational Testing Service 13
F. J. Breyer et al. Implementing a Contributory Scoring Approach for GRE-AW
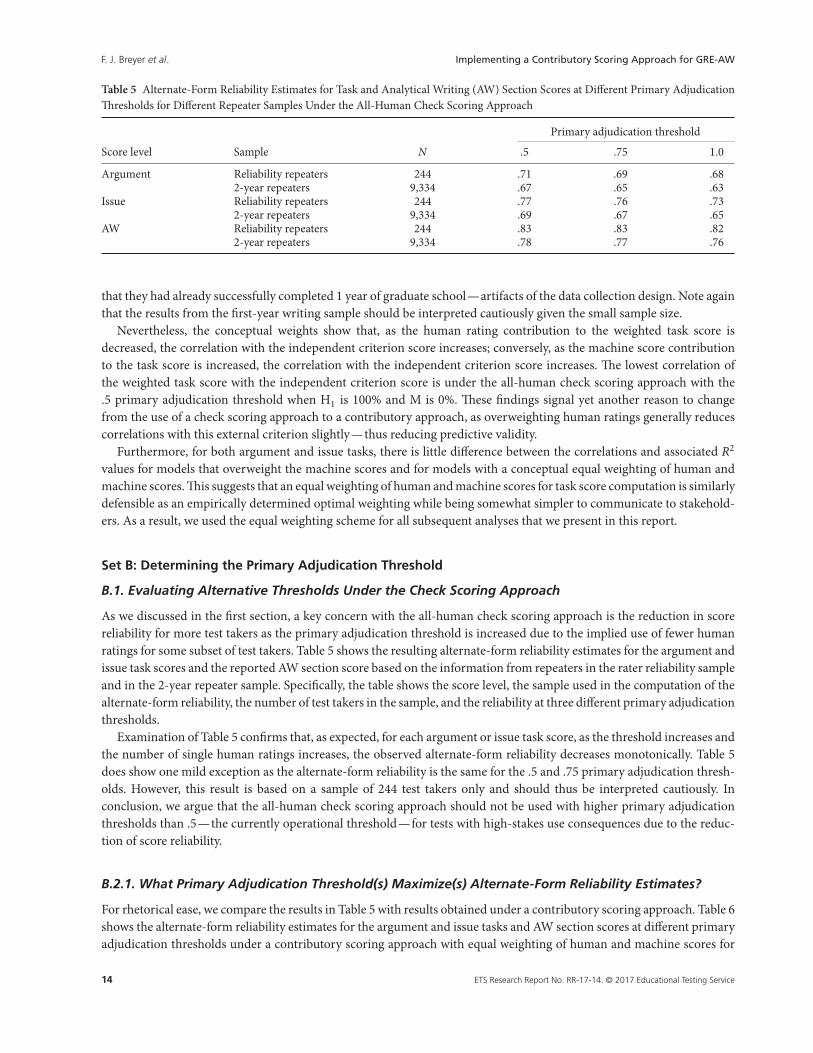
Table 5 Alternate-Form Reliability Estimates for Task and Analytical Writing (AW) Section Scores at Different Primary AdjudicationThresholds for Different Repeater Samples Under the All-Human Check Scoring Approach
Primary adjudication threshold
Score level Sample N .5 .75 1.0
Argument Reliability repeaters 244 .71 .69 .682-year repeaters 9,334 .67 .65 .63
Issue Reliability repeaters 244 .77 .76 .732-year repeaters 9,334 .69 .67 .65
AW Reliability repeaters 244 .83 .83 .822-year repeaters 9,334 .78 .77 .76
that they had already successfully completed 1 year of graduate school—artifacts of the data collection design. Note againthat the results from the first-year writing sample should be interpreted cautiously given the small sample size.
Nevertheless, the conceptual weights show that, as the human rating contribution to the weighted task score isdecreased, the correlation with the independent criterion score increases; conversely, as the machine score contributionto the task score is increased, the correlation with the independent criterion score increases. The lowest correlation ofthe weighted task score with the independent criterion score is under the all-human check scoring approach with the.5 primary adjudication threshold when H1 is 100% and M is 0%. These findings signal yet another reason to changefrom the use of a check scoring approach to a contributory approach, as overweighting human ratings generally reducescorrelations with this external criterion slightly—thus reducing predictive validity.
Furthermore, for both argument and issue tasks, there is little difference between the correlations and associated R2
values for models that overweight the machine scores and for models with a conceptual equal weighting of human andmachine scores. This suggests that an equal weighting of human and machine scores for task score computation is similarlydefensible as an empirically determined optimal weighting while being somewhat simpler to communicate to stakehold-ers. As a result, we used the equal weighting scheme for all subsequent analyses that we present in this report.
Set B: Determining the Primary Adjudication Threshold
B.1. Evaluating Alternative Thresholds Under the Check Scoring Approach
As we discussed in the first section, a key concern with the all-human check scoring approach is the reduction in scorereliability for more test takers as the primary adjudication threshold is increased due to the implied use of fewer humanratings for some subset of test takers. Table 5 shows the resulting alternate-form reliability estimates for the argument andissue task scores and the reported AW section score based on the information from repeaters in the rater reliability sampleand in the 2-year repeater sample. Specifically, the table shows the score level, the sample used in the computation of thealternate-form reliability, the number of test takers in the sample, and the reliability at three different primary adjudicationthresholds.
Examination of Table 5 confirms that, as expected, for each argument or issue task score, as the threshold increases andthe number of single human ratings increases, the observed alternate-form reliability decreases monotonically. Table 5does show one mild exception as the alternate-form reliability is the same for the .5 and .75 primary adjudication thresh-olds. However, this result is based on a sample of 244 test takers only and should thus be interpreted cautiously. Inconclusion, we argue that the all-human check scoring approach should not be used with higher primary adjudicationthresholds than .5—the currently operational threshold—for tests with high-stakes use consequences due to the reduc-tion of score reliability.
B.2.1. What Primary Adjudication Threshold(s) Maximize(s) Alternate-Form Reliability Estimates?
For rhetorical ease, we compare the results in Table 5 with results obtained under a contributory scoring approach. Table 6shows the alternate-form reliability estimates for the argument and issue tasks and AW section scores at different primaryadjudication thresholds under a contributory scoring approach with equal weighting of human and machine scores for
14 ETS Research Report No. RR-17-14. © 2017 Educational Testing Service
F. J. Breyer et al. Implementing a Contributory Scoring Approach for GRE-AW
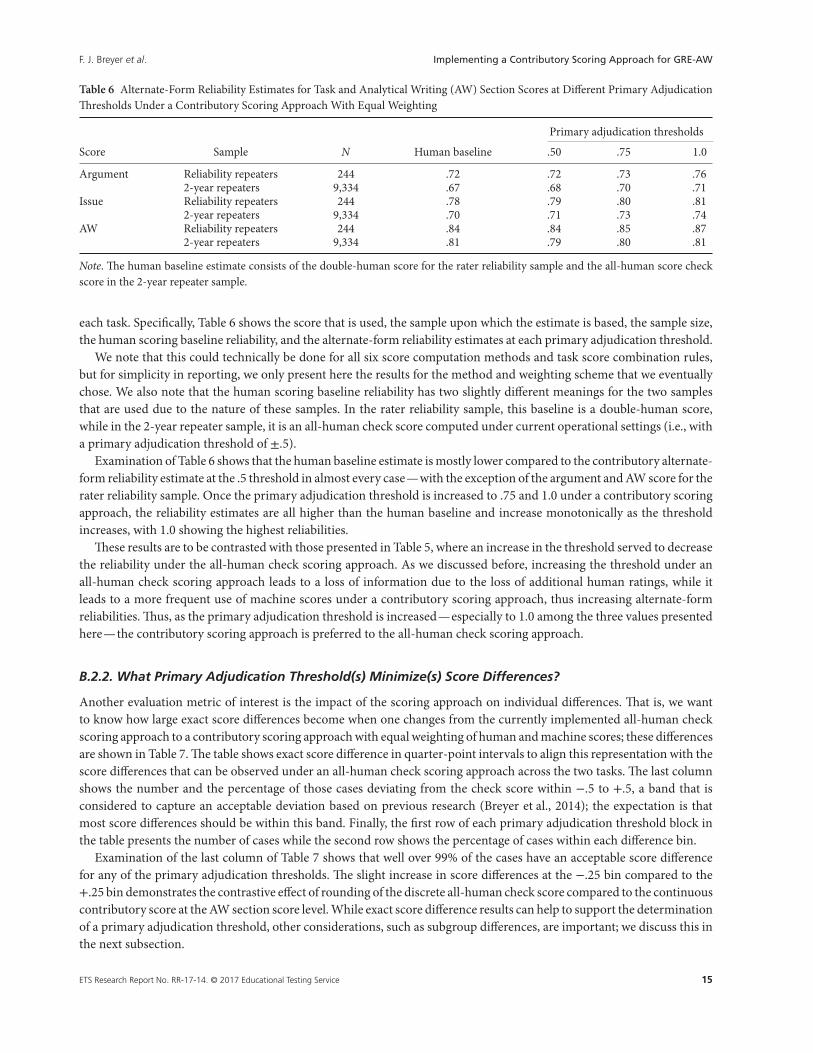
Table 6 Alternate-Form Reliability Estimates for Task and Analytical Writing (AW) Section Scores at Different Primary AdjudicationThresholds Under a Contributory Scoring Approach With Equal Weighting
Primary adjudication thresholds
Score Sample N Human baseline .50 .75 1.0
Argument Reliability repeaters 244 .72 .72 .73 .762-year repeaters 9,334 .67 .68 .70 .71
Issue Reliability repeaters 244 .78 .79 .80 .812-year repeaters 9,334 .70 .71 .73 .74
AW Reliability repeaters 244 .84 .84 .85 .872-year repeaters 9,334 .81 .79 .80 .81
Note. The human baseline estimate consists of the double-human score for the rater reliability sample and the all-human score checkscore in the 2-year repeater sample.
each task. Specifically, Table 6 shows the score that is used, the sample upon which the estimate is based, the sample size,the human scoring baseline reliability, and the alternate-form reliability estimates at each primary adjudication threshold.
We note that this could technically be done for all six score computation methods and task score combination rules,but for simplicity in reporting, we only present here the results for the method and weighting scheme that we eventuallychose. We also note that the human scoring baseline reliability has two slightly different meanings for the two samplesthat are used due to the nature of these samples. In the rater reliability sample, this baseline is a double-human score,while in the 2-year repeater sample, it is an all-human check score computed under current operational settings (i.e., witha primary adjudication threshold of ±.5).
Examination of Table 6 shows that the human baseline estimate is mostly lower compared to the contributory alternate-form reliability estimate at the .5 threshold in almost every case—with the exception of the argument and AW score for therater reliability sample. Once the primary adjudication threshold is increased to .75 and 1.0 under a contributory scoringapproach, the reliability estimates are all higher than the human baseline and increase monotonically as the thresholdincreases, with 1.0 showing the highest reliabilities.
These results are to be contrasted with those presented in Table 5, where an increase in the threshold served to decreasethe reliability under the all-human check scoring approach. As we discussed before, increasing the threshold under anall-human check scoring approach leads to a loss of information due to the loss of additional human ratings, while itleads to a more frequent use of machine scores under a contributory scoring approach, thus increasing alternate-formreliabilities. Thus, as the primary adjudication threshold is increased—especially to 1.0 among the three values presentedhere—the contributory scoring approach is preferred to the all-human check scoring approach.
B.2.2. What Primary Adjudication Threshold(s) Minimize(s) Score Differences?
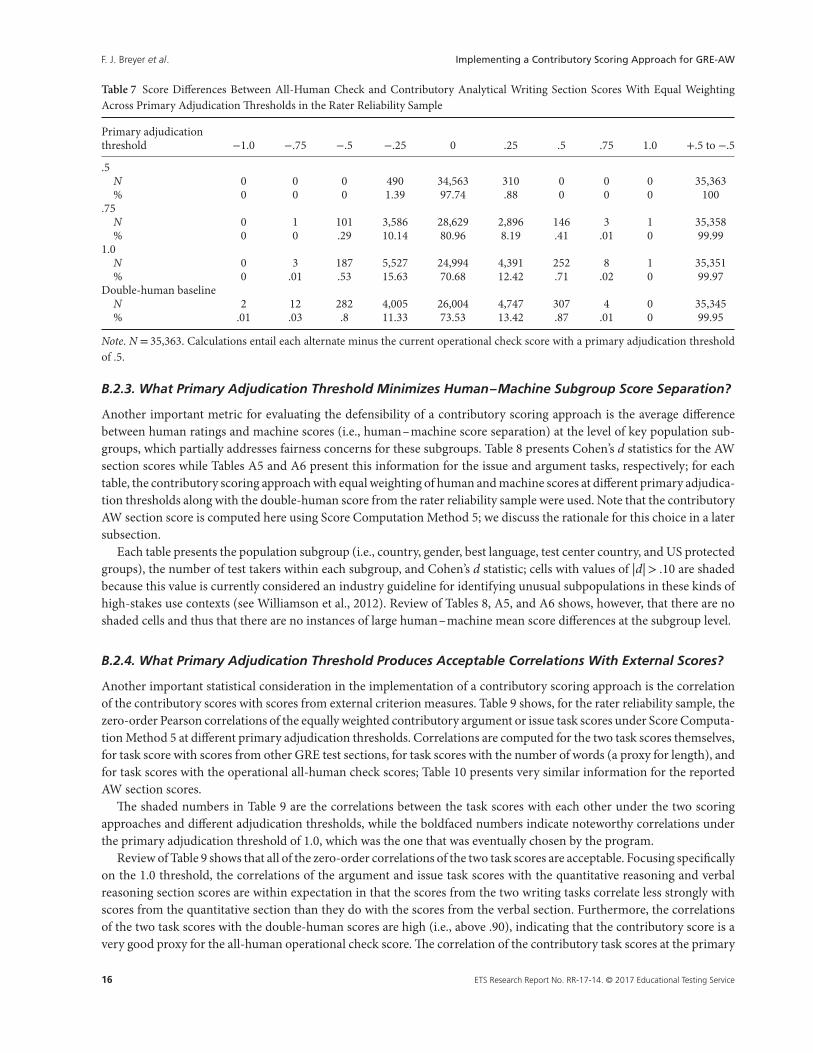
Another evaluation metric of interest is the impact of the scoring approach on individual differences. That is, we wantto know how large exact score differences become when one changes from the currently implemented all-human checkscoring approach to a contributory scoring approach with equal weighting of human and machine scores; these differencesare shown in Table 7. The table shows exact score difference in quarter-point intervals to align this representation with thescore differences that can be observed under an all-human check scoring approach across the two tasks. The last columnshows the number and the percentage of those cases deviating from the check score within −.5 to +.5, a band that isconsidered to capture an acceptable deviation based on previous research (Breyer et al., 2014); the expectation is thatmost score differences should be within this band. Finally, the first row of each primary adjudication threshold block inthe table presents the number of cases while the second row shows the percentage of cases within each difference bin.
Examination of the last column of Table 7 shows that well over 99% of the cases have an acceptable score differencefor any of the primary adjudication thresholds. The slight increase in score differences at the −.25 bin compared to the+.25 bin demonstrates the contrastive effect of rounding of the discrete all-human check score compared to the continuouscontributory score at the AW section score level. While exact score difference results can help to support the determinationof a primary adjudication threshold, other considerations, such as subgroup differences, are important; we discuss this inthe next subsection.
ETS Research Report No. RR-17-14. © 2017 Educational Testing Service 15
F. J. Breyer et al. Implementing a Contributory Scoring Approach for GRE-AW
Table 7 Score Differences Between All-Human Check and Contributory Analytical Writing Section Scores With Equal WeightingAcross Primary Adjudication Thresholds in the Rater Reliability Sample
Primary adjudicationthreshold −1.0 −.75 −.5 −.25 0 .25 .5 .75 1.0 +.5 to −.5
.5N 0 0 0 490 34,563 310 0 0 0 35,363% 0 0 0 1.39 97.74 .88 0 0 0 100
.75N 0 1 101 3,586 28,629 2,896 146 3 1 35,358% 0 0 .29 10.14 80.96 8.19 .41 .01 0 99.99
1.0N 0 3 187 5,527 24,994 4,391 252 8 1 35,351% 0 .01 .53 15.63 70.68 12.42 .71 .02 0 99.97
Double-human baselineN 2 12 282 4,005 26,004 4,747 307 4 0 35,345% .01 .03 .8 11.33 73.53 13.42 .87 .01 0 99.95
Note. N = 35,363. Calculations entail each alternate minus the current operational check score with a primary adjudication thresholdof .5.
B.2.3. What Primary Adjudication Threshold Minimizes Human–Machine Subgroup Score Separation?
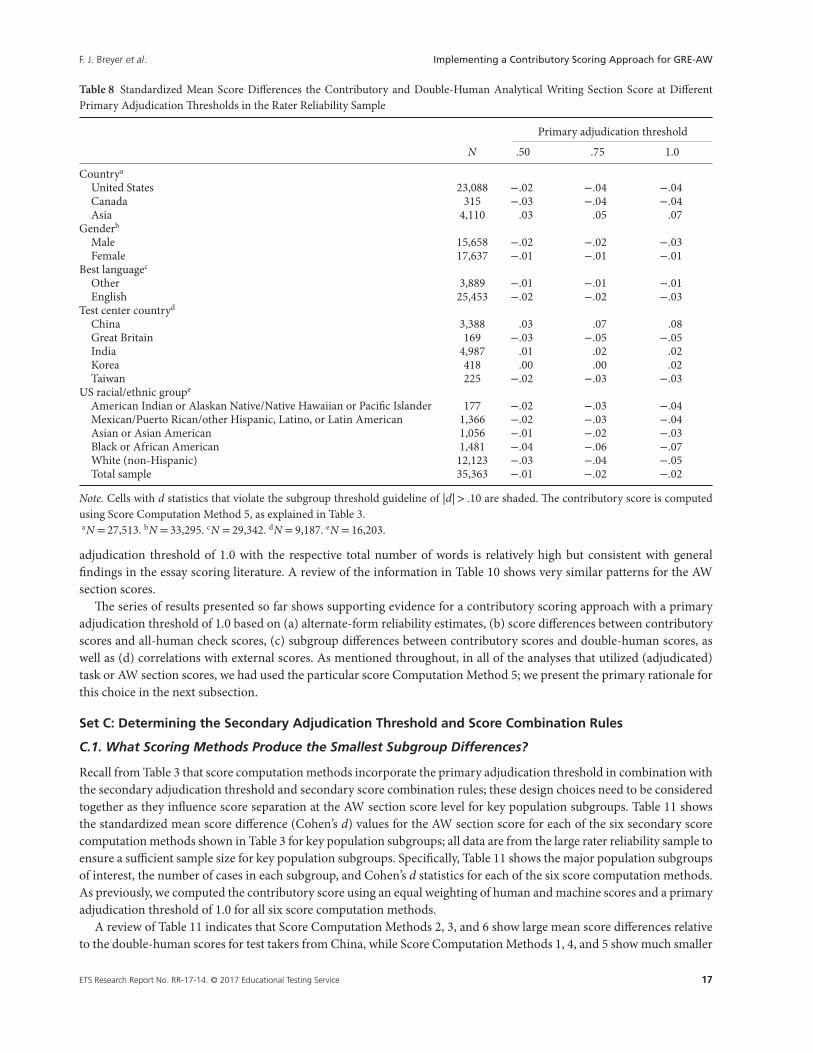
Another important metric for evaluating the defensibility of a contributory scoring approach is the average differencebetween human ratings and machine scores (i.e., human–machine score separation) at the level of key population sub-groups, which partially addresses fairness concerns for these subgroups. Table 8 presents Cohen’s d statistics for the AWsection scores while Tables A5 and A6 present this information for the issue and argument tasks, respectively; for eachtable, the contributory scoring approach with equal weighting of human and machine scores at different primary adjudica-tion thresholds along with the double-human score from the rater reliability sample were used. Note that the contributoryAW section score is computed here using Score Computation Method 5; we discuss the rationale for this choice in a latersubsection.
Each table presents the population subgroup (i.e., country, gender, best language, test center country, and US protectedgroups), the number of test takers within each subgroup, and Cohen’s d statistic; cells with values of |d|> .10 are shadedbecause this value is currently considered an industry guideline for identifying unusual subpopulations in these kinds ofhigh-stakes use contexts (see Williamson et al., 2012). Review of Tables 8, A5, and A6 shows, however, that there are noshaded cells and thus that there are no instances of large human–machine mean score differences at the subgroup level.
B.2.4. What Primary Adjudication Threshold Produces Acceptable Correlations With External Scores?
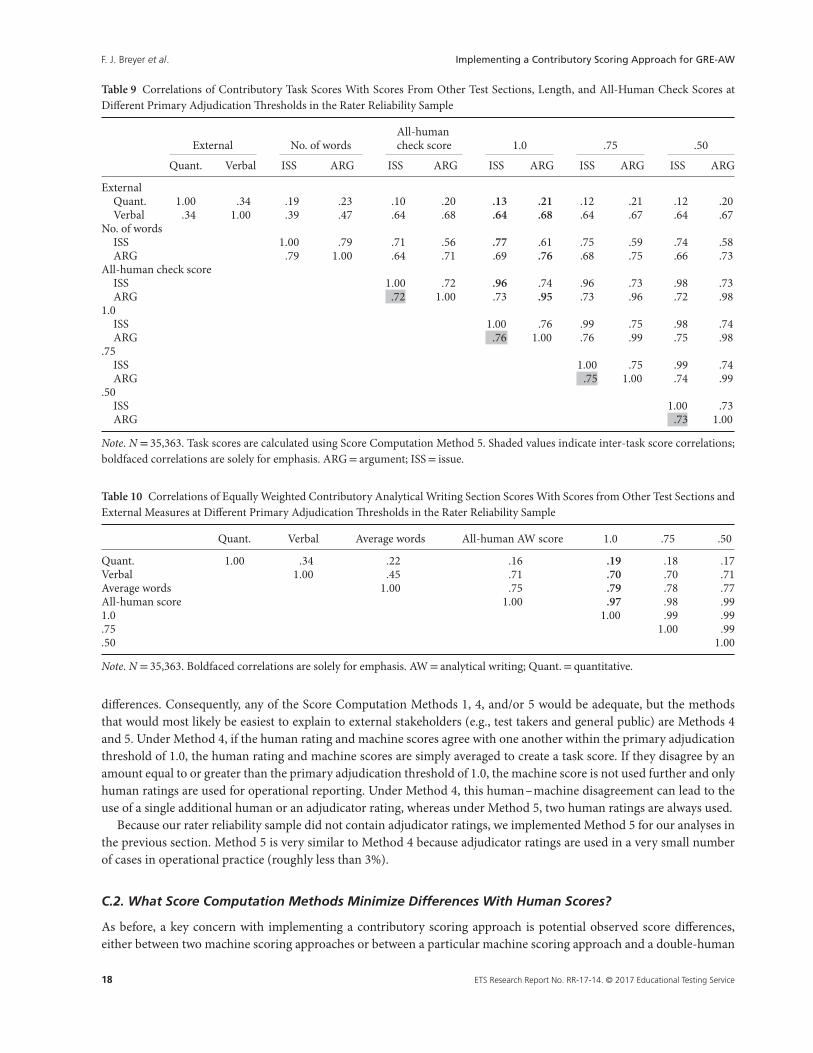
Another important statistical consideration in the implementation of a contributory scoring approach is the correlationof the contributory scores with scores from external criterion measures. Table 9 shows, for the rater reliability sample, thezero-order Pearson correlations of the equally weighted contributory argument or issue task scores under Score Computa-tion Method 5 at different primary adjudication thresholds. Correlations are computed for the two task scores themselves,for task score with scores from other GRE test sections, for task scores with the number of words (a proxy for length), andfor task scores with the operational all-human check scores; Table 10 presents very similar information for the reportedAW section scores.
The shaded numbers in Table 9 are the correlations between the task scores with each other under the two scoringapproaches and different adjudication thresholds, while the boldfaced numbers indicate noteworthy correlations underthe primary adjudication threshold of 1.0, which was the one that was eventually chosen by the program.
Review of Table 9 shows that all of the zero-order correlations of the two task scores are acceptable. Focusing specificallyon the 1.0 threshold, the correlations of the argument and issue task scores with the quantitative reasoning and verbalreasoning section scores are within expectation in that the scores from the two writing tasks correlate less strongly withscores from the quantitative section than they do with the scores from the verbal section. Furthermore, the correlationsof the two task scores with the double-human scores are high (i.e., above .90), indicating that the contributory score is avery good proxy for the all-human operational check score. The correlation of the contributory task scores at the primary
16 ETS Research Report No. RR-17-14. © 2017 Educational Testing Service
F. J. Breyer et al. Implementing a Contributory Scoring Approach for GRE-AW
Table 8 Standardized Mean Score Differences the Contributory and Double-Human Analytical Writing Section Score at DifferentPrimary Adjudication Thresholds in the Rater Reliability Sample
Primary adjudication threshold
N .50 .75 1.0
Countrya
United States 23,088 −.02 −.04 −.04Canada 315 −.03 −.04 −.04Asia 4,110 .03 .05 .07
Genderb
Male 15,658 −.02 −.02 −.03Female 17,637 −.01 −.01 −.01
Best languagec
Other 3,889 −.01 −.01 −.01English 25,453 −.02 −.02 −.03
Test center countryd
China 3,388 .03 .07 .08Great Britain 169 −.03 −.05 −.05India 4,987 .01 .02 .02Korea 418 .00 .00 .02Taiwan 225 −.02 −.03 −.03
US racial/ethnic groupe
American Indian or Alaskan Native/Native Hawaiian or Pacific Islander 177 −.02 −.03 −.04Mexican/Puerto Rican/other Hispanic, Latino, or Latin American 1,366 −.02 −.03 −.04Asian or Asian American 1,056 −.01 −.02 −.03Black or African American 1,481 −.04 −.06 −.07White (non-Hispanic) 12,123 −.03 −.04 −.05Total sample 35,363 −.01 −.02 −.02
Note. Cells with d statistics that violate the subgroup threshold guideline of |d|> .10 are shaded. The contributory score is computedusing Score Computation Method 5, as explained in Table 3.aN = 27,513. bN = 33,295. cN = 29,342. dN = 9,187. eN = 16,203.
adjudication threshold of 1.0 with the respective total number of words is relatively high but consistent with generalfindings in the essay scoring literature. A review of the information in Table 10 shows very similar patterns for the AWsection scores.
The series of results presented so far shows supporting evidence for a contributory scoring approach with a primaryadjudication threshold of 1.0 based on (a) alternate-form reliability estimates, (b) score differences between contributoryscores and all-human check scores, (c) subgroup differences between contributory scores and double-human scores, aswell as (d) correlations with external scores. As mentioned throughout, in all of the analyses that utilized (adjudicated)task or AW section scores, we had used the particular score Computation Method 5; we present the primary rationale forthis choice in the next subsection.
Set C: Determining the Secondary Adjudication Threshold and Score Combination Rules
C.1. What Scoring Methods Produce the Smallest Subgroup Differences?
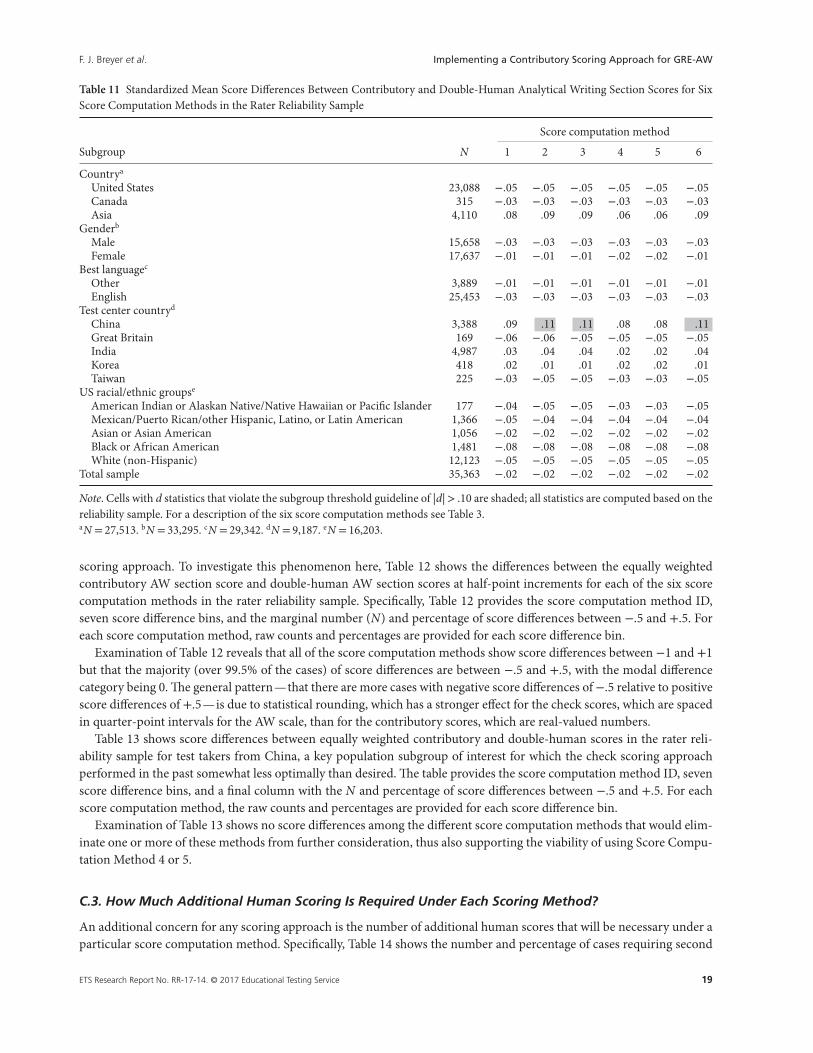
Recall from Table 3 that score computation methods incorporate the primary adjudication threshold in combination withthe secondary adjudication threshold and secondary score combination rules; these design choices need to be consideredtogether as they influence score separation at the AW section score level for key population subgroups. Table 11 showsthe standardized mean score difference (Cohen’s d) values for the AW section score for each of the six secondary scorecomputation methods shown in Table 3 for key population subgroups; all data are from the large rater reliability sample toensure a sufficient sample size for key population subgroups. Specifically, Table 11 shows the major population subgroupsof interest, the number of cases in each subgroup, and Cohen’s d statistics for each of the six score computation methods.As previously, we computed the contributory score using an equal weighting of human and machine scores and a primaryadjudication threshold of 1.0 for all six score computation methods.
A review of Table 11 indicates that Score Computation Methods 2, 3, and 6 show large mean score differences relativeto the double-human scores for test takers from China, while Score Computation Methods 1, 4, and 5 show much smaller
ETS Research Report No. RR-17-14. © 2017 Educational Testing Service 17
F. J. Breyer et al. Implementing a Contributory Scoring Approach for GRE-AW
Table 9 Correlations of Contributory Task Scores With Scores From Other Test Sections, Length, and All-Human Check Scores atDifferent Primary Adjudication Thresholds in the Rater Reliability Sample
External No. of wordsAll-humancheck score 1.0 .75 .50
Quant. Verbal ISS ARG ISS ARG ISS ARG ISS ARG ISS ARG
ExternalQuant. 1.00 .34 .19 .23 .10 .20 .13 .21 .12 .21 .12 .20Verbal .34 1.00 .39 .47 .64 .68 .64 .68 .64 .67 .64 .67
No. of wordsISS 1.00 .79 .71 .56 .77 .61 .75 .59 .74 .58ARG .79 1.00 .64 .71 .69 .76 .68 .75 .66 .73
All-human check scoreISS 1.00 .72 .96 .74 .96 .73 .98 .73ARG .72 1.00 .73 .95 .73 .96 .72 .98
1.0ISS 1.00 .76 .99 .75 .98 .74ARG .76 1.00 .76 .99 .75 .98
.75ISS 1.00 .75 .99 .74ARG .75 1.00 .74 .99
.50ISS 1.00 .73ARG .73 1.00
Note. N = 35,363. Task scores are calculated using Score Computation Method 5. Shaded values indicate inter-task score correlations;boldfaced correlations are solely for emphasis. ARG= argument; ISS= issue.
Table 10 Correlations of Equally Weighted Contributory Analytical Writing Section Scores With Scores from Other Test Sections andExternal Measures at Different Primary Adjudication Thresholds in the Rater Reliability Sample
Quant. Verbal Average words All-human AW score 1.0 .75 .50
Quant. 1.00 .34 .22 .16 .19 .18 .17Verbal 1.00 .45 .71 .70 .70 .71Average words 1.00 .75 .79 .78 .77All-human score 1.00 .97 .98 .991.0 1.00 .99 .99.75 1.00 .99.50 1.00
Note. N = 35,363. Boldfaced correlations are solely for emphasis. AW= analytical writing; Quant.= quantitative.
differences. Consequently, any of the Score Computation Methods 1, 4, and/or 5 would be adequate, but the methodsthat would most likely be easiest to explain to external stakeholders (e.g., test takers and general public) are Methods 4and 5. Under Method 4, if the human rating and machine scores agree with one another within the primary adjudicationthreshold of 1.0, the human rating and machine scores are simply averaged to create a task score. If they disagree by anamount equal to or greater than the primary adjudication threshold of 1.0, the machine score is not used further and onlyhuman ratings are used for operational reporting. Under Method 4, this human–machine disagreement can lead to theuse of a single additional human or an adjudicator rating, whereas under Method 5, two human ratings are always used.
Because our rater reliability sample did not contain adjudicator ratings, we implemented Method 5 for our analyses inthe previous section. Method 5 is very similar to Method 4 because adjudicator ratings are used in a very small numberof cases in operational practice (roughly less than 3%).
C.2. What Score Computation Methods Minimize Differences With Human Scores?
As before, a key concern with implementing a contributory scoring approach is potential observed score differences,either between two machine scoring approaches or between a particular machine scoring approach and a double-human
18 ETS Research Report No. RR-17-14. © 2017 Educational Testing Service
F. J. Breyer et al. Implementing a Contributory Scoring Approach for GRE-AW
Table 11 Standardized Mean Score Differences Between Contributory and Double-Human Analytical Writing Section Scores for SixScore Computation Methods in the Rater Reliability Sample
Score computation method
Subgroup N 1 2 3 4 5 6
Countrya
United States 23,088 −.05 −.05 −.05 −.05 −.05 −.05Canada 315 −.03 −.03 −.03 −.03 −.03 −.03Asia 4,110 .08 .09 .09 .06 .06 .09
Genderb
Male 15,658 −.03 −.03 −.03 −.03 −.03 −.03Female 17,637 −.01 −.01 −.01 −.02 −.02 −.01
Best languagec
Other 3,889 −.01 −.01 −.01 −.01 −.01 −.01English 25,453 −.03 −.03 −.03 −.03 −.03 −.03
Test center countryd
China 3,388 .09 .11 .11 .08 .08 .11Great Britain 169 −.06 −.06 −.05 −.05 −.05 −.05India 4,987 .03 .04 .04 .02 .02 .04Korea 418 .02 .01 .01 .02 .02 .01Taiwan 225 −.03 −.05 −.05 −.03 −.03 −.05
US racial/ethnic groupse
American Indian or Alaskan Native/Native Hawaiian or Pacific Islander 177 −.04 −.05 −.05 −.03 −.03 −.05Mexican/Puerto Rican/other Hispanic, Latino, or Latin American 1,366 −.05 −.04 −.04 −.04 −.04 −.04Asian or Asian American 1,056 −.02 −.02 −.02 −.02 −.02 −.02Black or African American 1,481 −.08 −.08 −.08 −.08 −.08 −.08White (non-Hispanic) 12,123 −.05 −.05 −.05 −.05 −.05 −.05
Total sample 35,363 −.02 −.02 −.02 −.02 −.02 −.02
Note. Cells with d statistics that violate the subgroup threshold guideline of |d|> .10 are shaded; all statistics are computed based on thereliability sample. For a description of the six score computation methods see Table 3.aN = 27,513. bN = 33,295. cN = 29,342. dN = 9,187. eN = 16,203.
scoring approach. To investigate this phenomenon here, Table 12 shows the differences between the equally weightedcontributory AW section score and double-human AW section scores at half-point increments for each of the six scorecomputation methods in the rater reliability sample. Specifically, Table 12 provides the score computation method ID,seven score difference bins, and the marginal number (N) and percentage of score differences between −.5 and +.5. Foreach score computation method, raw counts and percentages are provided for each score difference bin.
Examination of Table 12 reveals that all of the score computation methods show score differences between −1 and +1but that the majority (over 99.5% of the cases) of score differences are between −.5 and +.5, with the modal differencecategory being 0. The general pattern—that there are more cases with negative score differences of −.5 relative to positivescore differences of +.5—is due to statistical rounding, which has a stronger effect for the check scores, which are spacedin quarter-point intervals for the AW scale, than for the contributory scores, which are real-valued numbers.
Table 13 shows score differences between equally weighted contributory and double-human scores in the rater reli-ability sample for test takers from China, a key population subgroup of interest for which the check scoring approachperformed in the past somewhat less optimally than desired. The table provides the score computation method ID, sevenscore difference bins, and a final column with the N and percentage of score differences between −.5 and +.5. For eachscore computation method, the raw counts and percentages are provided for each score difference bin.
Examination of Table 13 shows no score differences among the different score computation methods that would elim-inate one or more of these methods from further consideration, thus also supporting the viability of using Score Compu-tation Method 4 or 5.
C.3. How Much Additional Human Scoring Is Required Under Each Scoring Method?
An additional concern for any scoring approach is the number of additional human scores that will be necessary under aparticular score computation method. Specifically, Table 14 shows the number and percentage of cases requiring second
ETS Research Report No. RR-17-14. © 2017 Educational Testing Service 19
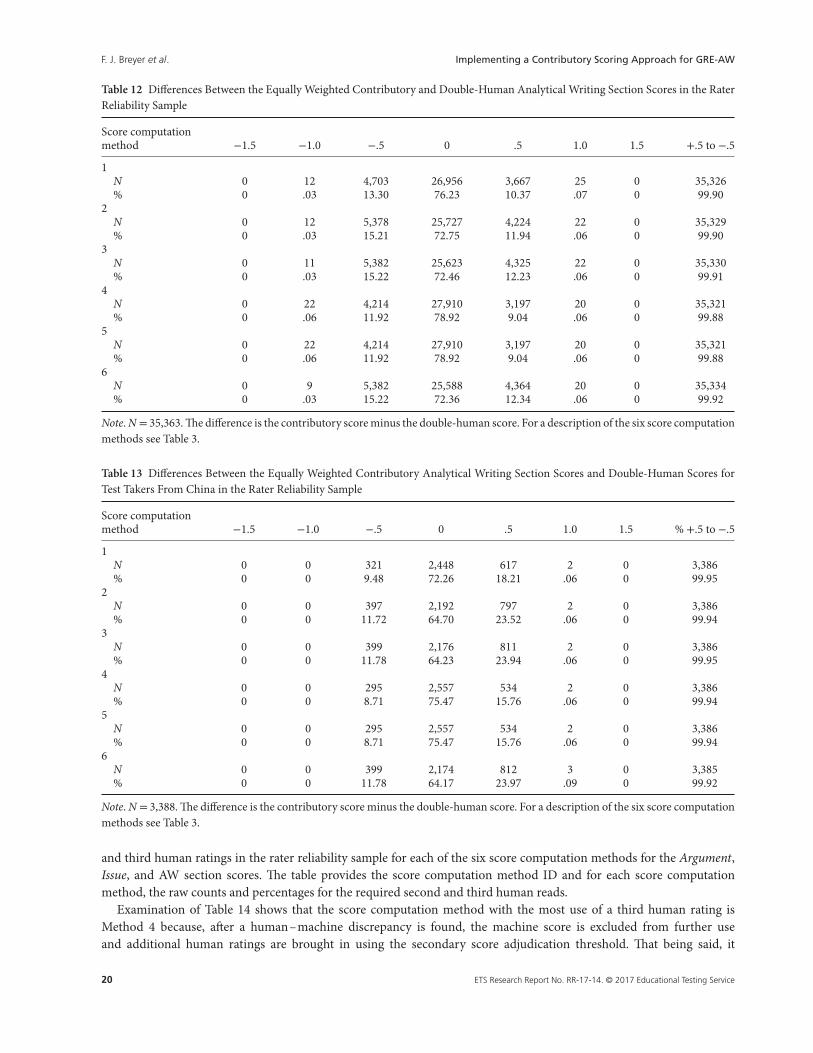
F. J. Breyer et al. Implementing a Contributory Scoring Approach for GRE-AW
Table 12 Differences Between the Equally Weighted Contributory and Double-Human Analytical Writing Section Scores in the RaterReliability Sample
Score computationmethod −1.5 −1.0 −.5 0 .5 1.0 1.5 +.5 to −.5
1N 0 12 4,703 26,956 3,667 25 0 35,326% 0 .03 13.30 76.23 10.37 .07 0 99.90
2N 0 12 5,378 25,727 4,224 22 0 35,329% 0 .03 15.21 72.75 11.94 .06 0 99.90
3N 0 11 5,382 25,623 4,325 22 0 35,330% 0 .03 15.22 72.46 12.23 .06 0 99.91
4N 0 22 4,214 27,910 3,197 20 0 35,321% 0 .06 11.92 78.92 9.04 .06 0 99.88
5N 0 22 4,214 27,910 3,197 20 0 35,321% 0 .06 11.92 78.92 9.04 .06 0 99.88
6N 0 9 5,382 25,588 4,364 20 0 35,334% 0 .03 15.22 72.36 12.34 .06 0 99.92
Note. N = 35,363. The difference is the contributory score minus the double-human score. For a description of the six score computationmethods see Table 3.
Table 13 Differences Between the Equally Weighted Contributory Analytical Writing Section Scores and Double-Human Scores forTest Takers From China in the Rater Reliability Sample
Score computationmethod −1.5 −1.0 −.5 0 .5 1.0 1.5 % +.5 to −.5
1N 0 0 321 2,448 617 2 0 3,386% 0 0 9.48 72.26 18.21 .06 0 99.95
2N 0 0 397 2,192 797 2 0 3,386% 0 0 11.72 64.70 23.52 .06 0 99.94
3N 0 0 399 2,176 811 2 0 3,386% 0 0 11.78 64.23 23.94 .06 0 99.95
4N 0 0 295 2,557 534 2 0 3,386% 0 0 8.71 75.47 15.76 .06 0 99.94
5N 0 0 295 2,557 534 2 0 3,386% 0 0 8.71 75.47 15.76 .06 0 99.94
6N 0 0 399 2,174 812 3 0 3,385% 0 0 11.78 64.17 23.97 .09 0 99.92
Note. N = 3,388. The difference is the contributory score minus the double-human score. For a description of the six score computationmethods see Table 3.
and third human ratings in the rater reliability sample for each of the six score computation methods for the Argument,Issue, and AW section scores. The table provides the score computation method ID and for each score computationmethod, the raw counts and percentages for the required second and third human reads.
Examination of Table 14 shows that the score computation method with the most use of a third human rating isMethod 4 because, after a human–machine discrepancy is found, the machine score is excluded from further useand additional human ratings are brought in using the secondary score adjudication threshold. That being said, it
20 ETS Research Report No. RR-17-14. © 2017 Educational Testing Service

F. J. Breyer et al. Implementing a Contributory Scoring Approach for GRE-AW
Table 14 Number and Percentage of Additional Human Raters Required for Each Score Computation Method
Score computation method
Task Type of case 1 2 3 4 5 6
Argument No H2 requiredN 30,807 30,807 30,807 30,807 30,807 30,807% 87.10 87.10 87.10 87.10 87.10 87.10
H2 requiredN 4,546 4,555 4,555 4,201 4,556 4,555% 12.90 12.90 12.90 11.90 12.90 12.90
H2 and H3 requiredN 10 1 1 355 0 1% .00 .00 .00 1.00 .00 .00
Issue No H2 requiredN 32,412 32,412 32,412 32,412 32,412 32,412% 91.70 91.70 91.70 91.70 91.70 91.70
H2 requiredN 2,947 2,950 2,950 2,725 2,951 2,951% 8.30 8.30 8.30 7.70 8.30 8.30
H2 and H3 requiredN 4 1 1 227 0 1% .00 .00 .00 .60 .00 .00
AW No H2 required for either ARG or ISSN 28,443 28,443 28,443 28,443 28,443 28,443% 80.40 80.40 80.40 80.40 80.40 80.40
One H2 required for either ARG or ISSN 6,906 6,918 6,918 6,348 6,920 6,918% 19.50 19.60 19.60 18.00 19.60 19.60
H2 and H3 required for either ARG or ISSN 14 2 2 572 0 2% .00 .00 .00 1.60 .00 .00
Note. N = 35,363. ARG= argument; AW= analytical writing; ISS= issue; H2 = second human rating; H3 = third human rating. For adescription of the score computation methods see Table 3.
should be noted that these data show that less than 2% of all test takers will likely require second and third humanratings.
All of the analyses taken together in this subsection thus support the use of Score Computation Method 5, that is,the use of an equally weighted contributory scoring approach with a 1.0 adjudication threshold and a secondary scorecombination rule that either averages the human and machine scores (if no adjudication is required) or averages humanscores only (if adjudication is required). The method is statistically defensible and relatively easy to communicate to thegeneral public and other stakeholders.
Set D: Determining the Task Score Combination Rule
In the final subsection of this report, we briefly report on evaluations that we conducted to evaluate whether an unequalweighting of the issue and argument task scores for producing a reported AW section score would provide an empiricalbenefit over the more intuitive equal weighting. Table 15 summarizes the results of four regression models in which theargument and issue task scores are the predictors from one testing occasion and either a writing score from first-yearwriting assessments or the alternate-occasion AW section score is the criterion score in alignment with Figure 2. Recallthat the first-year writing analyses are based on the first-year graduate student sample (N = 255) and that the alternate-occasion analyses are based on the 2-year repeater sample (N = 9,334). Specifically, Table 15 shows the scoring approach,primary adjudication threshold, sample type, criterion type, and sample size as well as the zero-order Pearson correlationsof the task scores with the criterion scores, the R2 and adjusted R2 for the regression model, and the relative percentage andrelative importance weights for the argument and issue task scores; the task scores were created using Score ComputationMethod 5, as before.
ETS Research Report No. RR-17-14. © 2017 Educational Testing Service 21
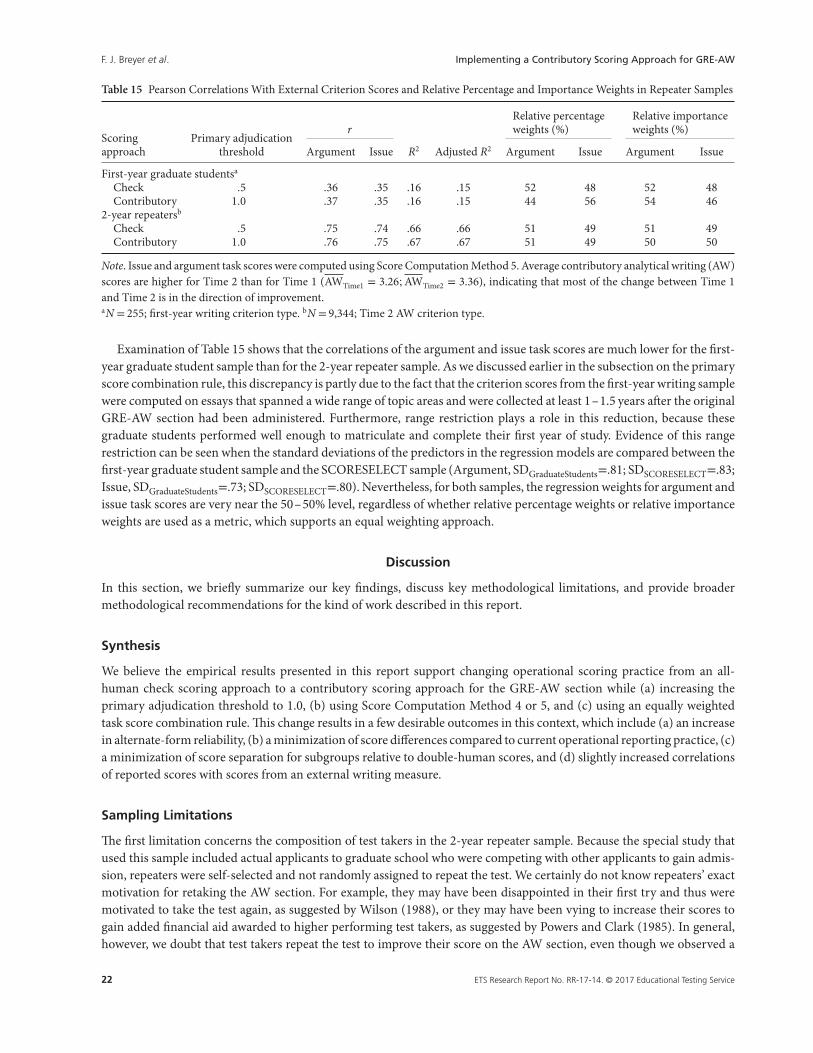
F. J. Breyer et al. Implementing a Contributory Scoring Approach for GRE-AW
Table 15 Pearson Correlations With External Criterion Scores and Relative Percentage and Importance Weights in Repeater Samples
rRelative percentageweights (%)
Relative importanceweights (%)
Scoringapproach
Primary adjudicationthreshold Argument Issue R2 Adjusted R2 Argument Issue Argument Issue
First-year graduate studentsa
Check .5 .36 .35 .16 .15 52 48 52 48Contributory 1.0 .37 .35 .16 .15 44 56 54 46
2-year repeatersb
Check .5 .75 .74 .66 .66 51 49 51 49Contributory 1.0 .76 .75 .67 .67 51 49 50 50
Note. Issue and argument task scores were computed using Score Computation Method 5. Average contributory analytical writing (AW)scores are higher for Time 2 than for Time 1 (AWTime1 = 3.26;AWTime2 = 3.36), indicating that most of the change between Time 1and Time 2 is in the direction of improvement.aN = 255; first-year writing criterion type. bN = 9,344; Time 2 AW criterion type.
Examination of Table 15 shows that the correlations of the argument and issue task scores are much lower for the first-year graduate student sample than for the 2-year repeater sample. As we discussed earlier in the subsection on the primaryscore combination rule, this discrepancy is partly due to the fact that the criterion scores from the first-year writing samplewere computed on essays that spanned a wide range of topic areas and were collected at least 1–1.5 years after the originalGRE-AW section had been administered. Furthermore, range restriction plays a role in this reduction, because thesegraduate students performed well enough to matriculate and complete their first year of study. Evidence of this rangerestriction can be seen when the standard deviations of the predictors in the regression models are compared between thefirst-year graduate student sample and the SCORESELECT sample (Argument, SDGraduateStudents=.81; SDSCORESELECT=.83;Issue, SDGraduateStudents=.73; SDSCORESELECT=.80). Nevertheless, for both samples, the regression weights for argument andissue task scores are very near the 50–50% level, regardless of whether relative percentage weights or relative importanceweights are used as a metric, which supports an equal weighting approach.
Discussion
In this section, we briefly summarize our key findings, discuss key methodological limitations, and provide broadermethodological recommendations for the kind of work described in this report.
Synthesis
We believe the empirical results presented in this report support changing operational scoring practice from an all-human check scoring approach to a contributory scoring approach for the GRE-AW section while (a) increasing theprimary adjudication threshold to 1.0, (b) using Score Computation Method 4 or 5, and (c) using an equally weightedtask score combination rule. This change results in a few desirable outcomes in this context, which include (a) an increasein alternate-form reliability, (b) a minimization of score differences compared to current operational reporting practice, (c)a minimization of score separation for subgroups relative to double-human scores, and (d) slightly increased correlationsof reported scores with scores from an external writing measure.
Sampling Limitations
The first limitation concerns the composition of test takers in the 2-year repeater sample. Because the special study thatused this sample included actual applicants to graduate school who were competing with other applicants to gain admis-sion, repeaters were self-selected and not randomly assigned to repeat the test. We certainly do not know repeaters’ exactmotivation for retaking the AW section. For example, they may have been disappointed in their first try and thus weremotivated to take the test again, as suggested by Wilson (1988), or they may have been vying to increase their scores togain added financial aid awarded to higher performing test takers, as suggested by Powers and Clark (1985). In general,however, we doubt that test takers repeat the test to improve their score on the AW section, even though we observed a
22 ETS Research Report No. RR-17-14. © 2017 Educational Testing Service
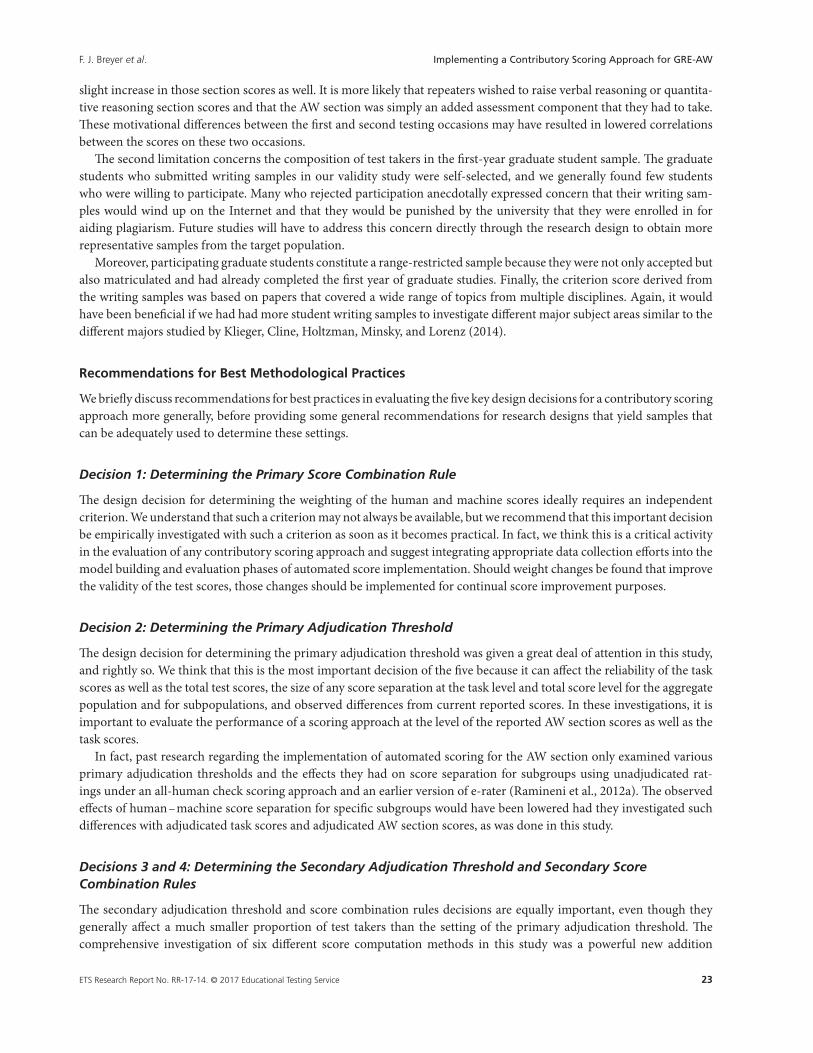
F. J. Breyer et al. Implementing a Contributory Scoring Approach for GRE-AW
slight increase in those section scores as well. It is more likely that repeaters wished to raise verbal reasoning or quantita-tive reasoning section scores and that the AW section was simply an added assessment component that they had to take.These motivational differences between the first and second testing occasions may have resulted in lowered correlationsbetween the scores on these two occasions.
The second limitation concerns the composition of test takers in the first-year graduate student sample. The graduatestudents who submitted writing samples in our validity study were self-selected, and we generally found few studentswho were willing to participate. Many who rejected participation anecdotally expressed concern that their writing sam-ples would wind up on the Internet and that they would be punished by the university that they were enrolled in foraiding plagiarism. Future studies will have to address this concern directly through the research design to obtain morerepresentative samples from the target population.
Moreover, participating graduate students constitute a range-restricted sample because they were not only accepted butalso matriculated and had already completed the first year of graduate studies. Finally, the criterion score derived fromthe writing samples was based on papers that covered a wide range of topics from multiple disciplines. Again, it wouldhave been beneficial if we had had more student writing samples to investigate different major subject areas similar to thedifferent majors studied by Klieger, Cline, Holtzman, Minsky, and Lorenz (2014).
Recommendations for Best Methodological Practices
We briefly discuss recommendations for best practices in evaluating the five key design decisions for a contributory scoringapproach more generally, before providing some general recommendations for research designs that yield samples thatcan be adequately used to determine these settings.
Decision 1: Determining the Primary Score Combination Rule
The design decision for determining the weighting of the human and machine scores ideally requires an independentcriterion. We understand that such a criterion may not always be available, but we recommend that this important decisionbe empirically investigated with such a criterion as soon as it becomes practical. In fact, we think this is a critical activityin the evaluation of any contributory scoring approach and suggest integrating appropriate data collection efforts into themodel building and evaluation phases of automated score implementation. Should weight changes be found that improvethe validity of the test scores, those changes should be implemented for continual score improvement purposes.
Decision 2: Determining the Primary Adjudication Threshold
The design decision for determining the primary adjudication threshold was given a great deal of attention in this study,and rightly so. We think that this is the most important decision of the five because it can affect the reliability of the taskscores as well as the total test scores, the size of any score separation at the task level and total score level for the aggregatepopulation and for subpopulations, and observed differences from current reported scores. In these investigations, it isimportant to evaluate the performance of a scoring approach at the level of the reported AW section scores as well as thetask scores.
In fact, past research regarding the implementation of automated scoring for the AW section only examined variousprimary adjudication thresholds and the effects they had on score separation for subgroups using unadjudicated rat-ings under an all-human check scoring approach and an earlier version of e-rater (Ramineni et al., 2012a). The observedeffects of human–machine score separation for specific subgroups would have been lowered had they investigated suchdifferences with adjudicated task scores and adjudicated AW section scores, as was done in this study.
Decisions 3 and 4: Determining the Secondary Adjudication Threshold and Secondary ScoreCombination Rules
The secondary adjudication threshold and score combination rules decisions are equally important, even though theygenerally affect a much smaller proportion of test takers than the setting of the primary adjudication threshold. Thecomprehensive investigation of six different score computation methods in this study was a powerful new addition
ETS Research Report No. RR-17-14. © 2017 Educational Testing Service 23

F. J. Breyer et al. Implementing a Contributory Scoring Approach for GRE-AW
to the automated scoring implementation evaluation process. The use of Cohen’s d statistic to assess the size of meanscore differences for different score computation methods for key population subgroups under a proposed contributoryapproach and the use of a “gold standard” (e.g., a double-human scoring baseline in our work), as well as a currentlyoperational scoring approach (e.g., an all-human check scoring approach in our work), yield a much more comprehensiveevidentiary picture of the full effect of a particular scoring approach. In addition, using a practical metric that relatesto costs (e.g., the number of additional second and third human ratings in our work) can be helpful to assess thetrade-off between initial research and implementation costs and long-term financial benefits under projected operationalvolumes.
Decision 5: Determining the Task Score Combination Rule
In our work, we also evaluated how to determine weights for the two task scores to create AW section scores; thiswork again requires the existence of an independent criterion. We think that the data collection efforts to obtain such acriterion are worthwhile and can enrich the evidentiary base for this decision in a meaningful way, especially as patternsof weights can be evaluated for consistency with internal and external measures. Even if the results are consistent withwhat one might consider an intuitive equal weighting of tasks, more complex trade-offs between construct representationand statistical performance differences under different weighting schemes can be empirically considered if empirical dataare available.
Additional Recommendations
On the basis of the preceding discussion, we recommend the continued collection of first-year writing samples to augmentthe current set of papers in our validity study that provided the external writing measure. Perhaps a service could beinstituted that would focus the efforts at the institutional level (or preferably even at the program level), which might thenhave the capacity to inform those responsible for admissions at specific institutions and their programs about how well thewriting scores help predict writing performance in graduate school. We also recommend that quality-control monitoringof the e-rater scoring models and their associated implemented scoring approaches be continued on a regular basis, whichrequires the continued collection of double-human scores for a reliability sample.
Such efforts are important, as there is a possibility that automated scoring models with their associated score compu-tation methods are no longer performing as expected due to changes in the population composition, prompt sets for atask type, effectiveness of human rater training, or other factors. If such effects are investigated on an ongoing basis withsuitable data collection designs, then problematic individual instances of human–machine differences as well as poten-tial systemic effects can be identified earlier on and evaluated more rigorously through simulation studies and qualitativeanalyses of the problematic essays.
In short, the deployment and monitoring of an automated scoring approach in a high-stakes environment like theGRE requires a sustained financial and methodological effort by interdisciplinary teams of specialists who understandthe complexities of the different components of the system. Even though the specific focus of the work in this report wasthe GRE-AW section, we believe that the methodological principles, considerations, and approaches apply to other testingcontexts as well. We encourage other teams to carefully consider how to adopt or adapt them and are looking forward tolearning from their experiences through published reports.
Acknowledgments
We want to thank Donald Powers and Megan Schramm-Possinger for providing access to writing samples that were col-lected as part of a separate study and Laura Ridolfi-McCulla for helping to coordinate the data collection and humanscoring of the first-year graduate students sample. We would also like to thank our previous colleagues Frank Williamsand Chaitanya Ramineni for providing valuable comments and advice, our colleagues Chen Li and Chunyi Ruan fortheir programming and statistical processing expertise, and our Automated Scoring Technical Advisory Committee col-leagues Dan McCaffrey, Doug Baldwin, Tim Davey, Neal Dorans, Marna Golub-Smith, and Shelby Haberman as well asRobert Kantor, Fred Robin, and representatives from the GRE program for their helpful guidance, advice, and feedbackthroughout the study.
24 ETS Research Report No. RR-17-14. © 2017 Educational Testing Service
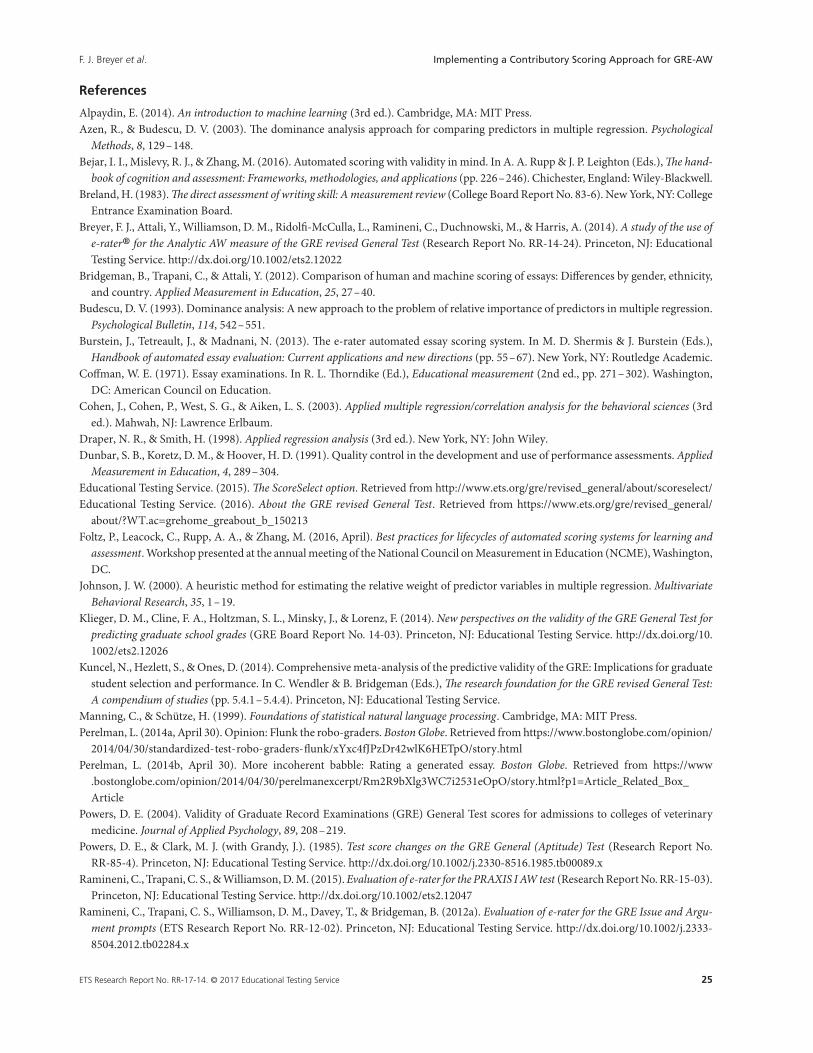
F. J. Breyer et al. Implementing a Contributory Scoring Approach for GRE-AW
References
Alpaydin, E. (2014). An introduction to machine learning (3rd ed.). Cambridge, MA: MIT Press.Azen, R., & Budescu, D. V. (2003). The dominance analysis approach for comparing predictors in multiple regression. Psychological
Methods, 8, 129–148.Bejar, I. I., Mislevy, R. J., & Zhang, M. (2016). Automated scoring with validity in mind. In A. A. Rupp & J. P. Leighton (Eds.), The hand-
book of cognition and assessment: Frameworks, methodologies, and applications (pp. 226–246). Chichester, England: Wiley-Blackwell.Breland, H. (1983). The direct assessment of writing skill: A measurement review (College Board Report No. 83-6). New York, NY: College
Entrance Examination Board.Breyer, F. J., Attali, Y., Williamson, D. M., Ridolfi-McCulla, L., Ramineni, C., Duchnowski, M., & Harris, A. (2014). A study of the use of
e-rater® for the Analytic AW measure of the GRE revised General Test (Research Report No. RR-14-24). Princeton, NJ: EducationalTesting Service. http://dx.doi.org/10.1002/ets2.12022
Bridgeman, B., Trapani, C., & Attali, Y. (2012). Comparison of human and machine scoring of essays: Differences by gender, ethnicity,and country. Applied Measurement in Education, 25, 27–40.
Budescu, D. V. (1993). Dominance analysis: A new approach to the problem of relative importance of predictors in multiple regression.Psychological Bulletin, 114, 542–551.
Burstein, J., Tetreault, J., & Madnani, N. (2013). The e-rater automated essay scoring system. In M. D. Shermis & J. Burstein (Eds.),Handbook of automated essay evaluation: Current applications and new directions (pp. 55–67). New York, NY: Routledge Academic.
Coffman, W. E. (1971). Essay examinations. In R. L. Thorndike (Ed.), Educational measurement (2nd ed., pp. 271–302). Washington,DC: American Council on Education.
Cohen, J., Cohen, P., West, S. G., & Aiken, L. S. (2003). Applied multiple regression/correlation analysis for the behavioral sciences (3rded.). Mahwah, NJ: Lawrence Erlbaum.
Draper, N. R., & Smith, H. (1998). Applied regression analysis (3rd ed.). New York, NY: John Wiley.Dunbar, S. B., Koretz, D. M., & Hoover, H. D. (1991). Quality control in the development and use of performance assessments. Applied
Measurement in Education, 4, 289–304.Educational Testing Service. (2015). The ScoreSelect option. Retrieved from http://www.ets.org/gre/revised_general/about/scoreselect/Educational Testing Service. (2016). About the GRE revised General Test. Retrieved from https://www.ets.org/gre/revised_general/
about/?WT.ac=grehome_greabout_b_150213Foltz, P., Leacock, C., Rupp, A. A., & Zhang, M. (2016, April). Best practices for lifecycles of automated scoring systems for learning and
assessment. Workshop presented at the annual meeting of the National Council on Measurement in Education (NCME), Washington,DC.
Johnson, J. W. (2000). A heuristic method for estimating the relative weight of predictor variables in multiple regression. MultivariateBehavioral Research, 35, 1–19.
Klieger, D. M., Cline, F. A., Holtzman, S. L., Minsky, J., & Lorenz, F. (2014). New perspectives on the validity of the GRE General Test forpredicting graduate school grades (GRE Board Report No. 14-03). Princeton, NJ: Educational Testing Service. http://dx.doi.org/10.1002/ets2.12026
Kuncel, N., Hezlett, S., & Ones, D. (2014). Comprehensive meta-analysis of the predictive validity of the GRE: Implications for graduatestudent selection and performance. In C. Wendler & B. Bridgeman (Eds.), The research foundation for the GRE revised General Test:A compendium of studies (pp. 5.4.1–5.4.4). Princeton, NJ: Educational Testing Service.
Manning, C., & Schütze, H. (1999). Foundations of statistical natural language processing. Cambridge, MA: MIT Press.Perelman, L. (2014a, April 30). Opinion: Flunk the robo-graders. Boston Globe. Retrieved from https://www.bostonglobe.com/opinion/
2014/04/30/standardized-test-robo-graders-flunk/xYxc4fJPzDr42wlK6HETpO/story.htmlPerelman, L. (2014b, April 30). More incoherent babble: Rating a generated essay. Boston Globe. Retrieved from https://www
.bostonglobe.com/opinion/2014/04/30/perelmanexcerpt/Rm2R9bXlg3WC7i2531eOpO/story.html?p1=Article_Related_Box_Article
Powers, D. E. (2004). Validity of Graduate Record Examinations (GRE) General Test scores for admissions to colleges of veterinarymedicine. Journal of Applied Psychology, 89, 208–219.
Powers, D. E., & Clark, M. J. (with Grandy, J.). (1985). Test score changes on the GRE General (Aptitude) Test (Research Report No.RR-85-4). Princeton, NJ: Educational Testing Service. http://dx.doi.org/10.1002/j.2330-8516.1985.tb00089.x
Ramineni, C., Trapani, C. S., & Williamson, D. M. (2015). Evaluation of e-rater for the PRAXIS I AW test (Research Report No. RR-15-03).Princeton, NJ: Educational Testing Service. http://dx.doi.org/10.1002/ets2.12047
Ramineni, C., Trapani, C. S., Williamson, D. M., Davey, T., & Bridgeman, B. (2012a). Evaluation of e-rater for the GRE Issue and Argu-ment prompts (ETS Research Report No. RR-12-02). Princeton, NJ: Educational Testing Service. http://dx.doi.org/10.1002/j.2333-8504.2012.tb02284.x
ETS Research Report No. RR-17-14. © 2017 Educational Testing Service 25
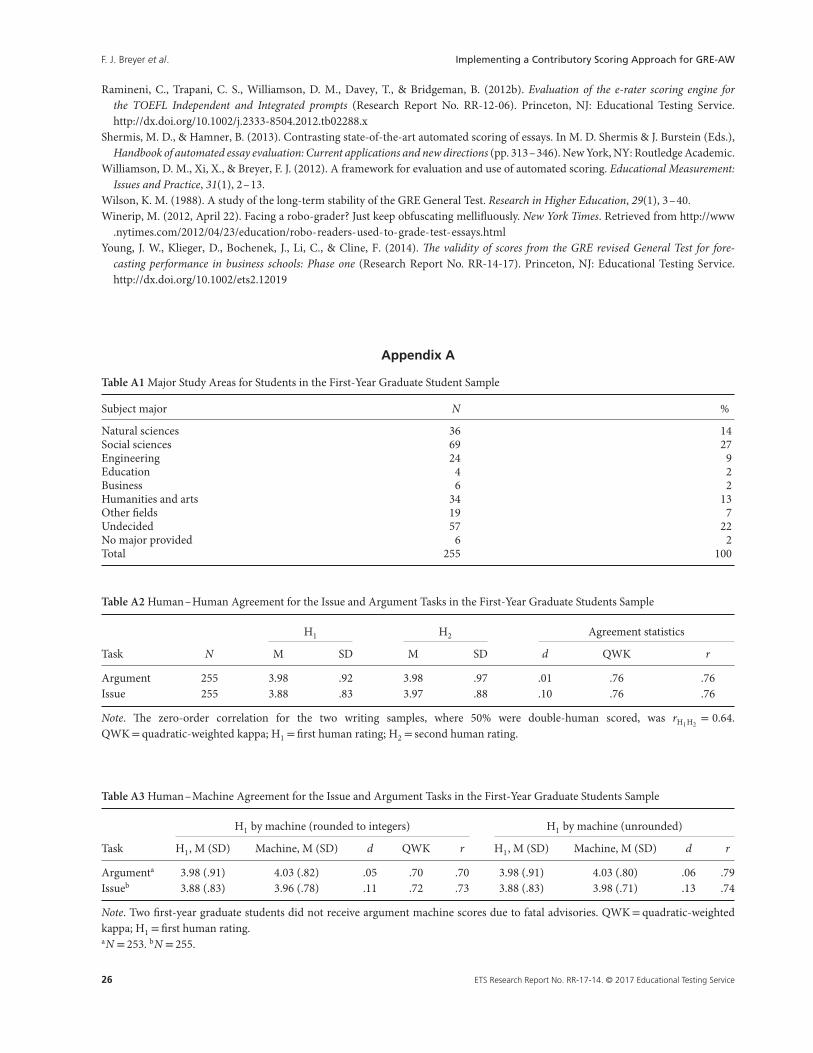
F. J. Breyer et al. Implementing a Contributory Scoring Approach for GRE-AW
Ramineni, C., Trapani, C. S., Williamson, D. M., Davey, T., & Bridgeman, B. (2012b). Evaluation of the e-rater scoring engine forthe TOEFL Independent and Integrated prompts (Research Report No. RR-12-06). Princeton, NJ: Educational Testing Service.http://dx.doi.org/10.1002/j.2333-8504.2012.tb02288.x
Shermis, M. D., & Hamner, B. (2013). Contrasting state-of-the-art automated scoring of essays. In M. D. Shermis & J. Burstein (Eds.),Handbook of automated essay evaluation: Current applications and new directions (pp. 313–346). New York, NY: Routledge Academic.
Williamson, D. M., Xi, X., & Breyer, F. J. (2012). A framework for evaluation and use of automated scoring. Educational Measurement:Issues and Practice, 31(1), 2–13.
Wilson, K. M. (1988). A study of the long-term stability of the GRE General Test. Research in Higher Education, 29(1), 3–40.Winerip, M. (2012, April 22). Facing a robo-grader? Just keep obfuscating mellifluously. New York Times. Retrieved from http://www
.nytimes.com/2012/04/23/education/robo-readers-used-to-grade-test-essays.htmlYoung, J. W., Klieger, D., Bochenek, J., Li, C., & Cline, F. (2014). The validity of scores from the GRE revised General Test for fore-
casting performance in business schools: Phase one (Research Report No. RR-14-17). Princeton, NJ: Educational Testing Service.http://dx.doi.org/10.1002/ets2.12019
Appendix A
Table A1 Major Study Areas for Students in the First-Year Graduate Student Sample
Subject major N %
Natural sciences 36 14Social sciences 69 27Engineering 24 9Education 4 2Business 6 2Humanities and arts 34 13Other fields 19 7Undecided 57 22No major provided 6 2Total 255 100
Table A2 Human–Human Agreement for the Issue and Argument Tasks in the First-Year Graduate Students Sample
H1 H2 Agreement statistics
Task N M SD M SD d QWK r
Argument 255 3.98 .92 3.98 .97 .01 .76 .76Issue 255 3.88 .83 3.97 .88 .10 .76 .76
Note. The zero-order correlation for the two writing samples, where 50% were double-human scored, was rH1H2= 0.64.
QWK= quadratic-weighted kappa; H1 = first human rating; H2 = second human rating.
Table A3 Human–Machine Agreement for the Issue and Argument Tasks in the First-Year Graduate Students Sample
H1 by machine (rounded to integers) H1 by machine (unrounded)
Task H1, M (SD) Machine, M (SD) d QWK r H1, M (SD) Machine, M (SD) d r
Argumenta 3.98 (.91) 4.03 (.82) .05 .70 .70 3.98 (.91) 4.03 (.80) .06 .79Issueb 3.88 (.83) 3.96 (.78) .11 .72 .73 3.88 (.83) 3.98 (.71) .13 .74
Note. Two first-year graduate students did not receive argument machine scores due to fatal advisories. QWK= quadratic-weightedkappa; H1 = first human rating.aN = 253. bN = 255.
26 ETS Research Report No. RR-17-14. © 2017 Educational Testing Service
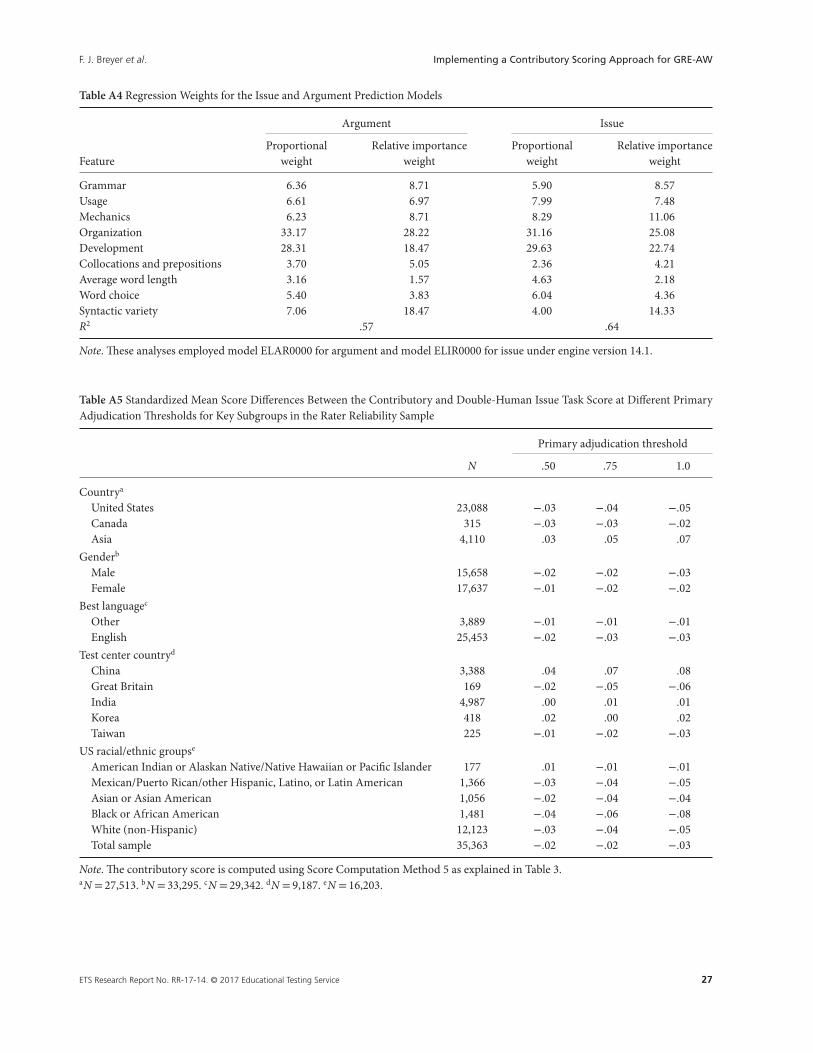
F. J. Breyer et al. Implementing a Contributory Scoring Approach for GRE-AW
Table A4 Regression Weights for the Issue and Argument Prediction Models
Argument Issue
FeatureProportional
weightRelative importance
weightProportional
weightRelative importance
weight
Grammar 6.36 8.71 5.90 8.57Usage 6.61 6.97 7.99 7.48Mechanics 6.23 8.71 8.29 11.06Organization 33.17 28.22 31.16 25.08Development 28.31 18.47 29.63 22.74Collocations and prepositions 3.70 5.05 2.36 4.21Average word length 3.16 1.57 4.63 2.18Word choice 5.40 3.83 6.04 4.36Syntactic variety 7.06 18.47 4.00 14.33R2 .57 .64
Note. These analyses employed model ELAR0000 for argument and model ELIR0000 for issue under engine version 14.1.
Table A5 Standardized Mean Score Differences Between the Contributory and Double-Human Issue Task Score at Different PrimaryAdjudication Thresholds for Key Subgroups in the Rater Reliability Sample
Primary adjudication threshold
N .50 .75 1.0
Countrya
United States 23,088 −.03 −.04 −.05Canada 315 −.03 −.03 −.02Asia 4,110 .03 .05 .07
Genderb
Male 15,658 −.02 −.02 −.03Female 17,637 −.01 −.02 −.02
Best languagec
Other 3,889 −.01 −.01 −.01English 25,453 −.02 −.03 −.03
Test center countryd
China 3,388 .04 .07 .08Great Britain 169 −.02 −.05 −.06India 4,987 .00 .01 .01Korea 418 .02 .00 .02Taiwan 225 −.01 −.02 −.03
US racial/ethnic groupse
American Indian or Alaskan Native/Native Hawaiian or Pacific Islander 177 .01 −.01 −.01Mexican/Puerto Rican/other Hispanic, Latino, or Latin American 1,366 −.03 −.04 −.05Asian or Asian American 1,056 −.02 −.04 −.04Black or African American 1,481 −.04 −.06 −.08White (non-Hispanic) 12,123 −.03 −.04 −.05Total sample 35,363 −.02 −.02 −.03
Note. The contributory score is computed using Score Computation Method 5 as explained in Table 3.aN = 27,513. bN = 33,295. cN = 29,342. dN = 9,187. eN = 16,203.
ETS Research Report No. RR-17-14. © 2017 Educational Testing Service 27
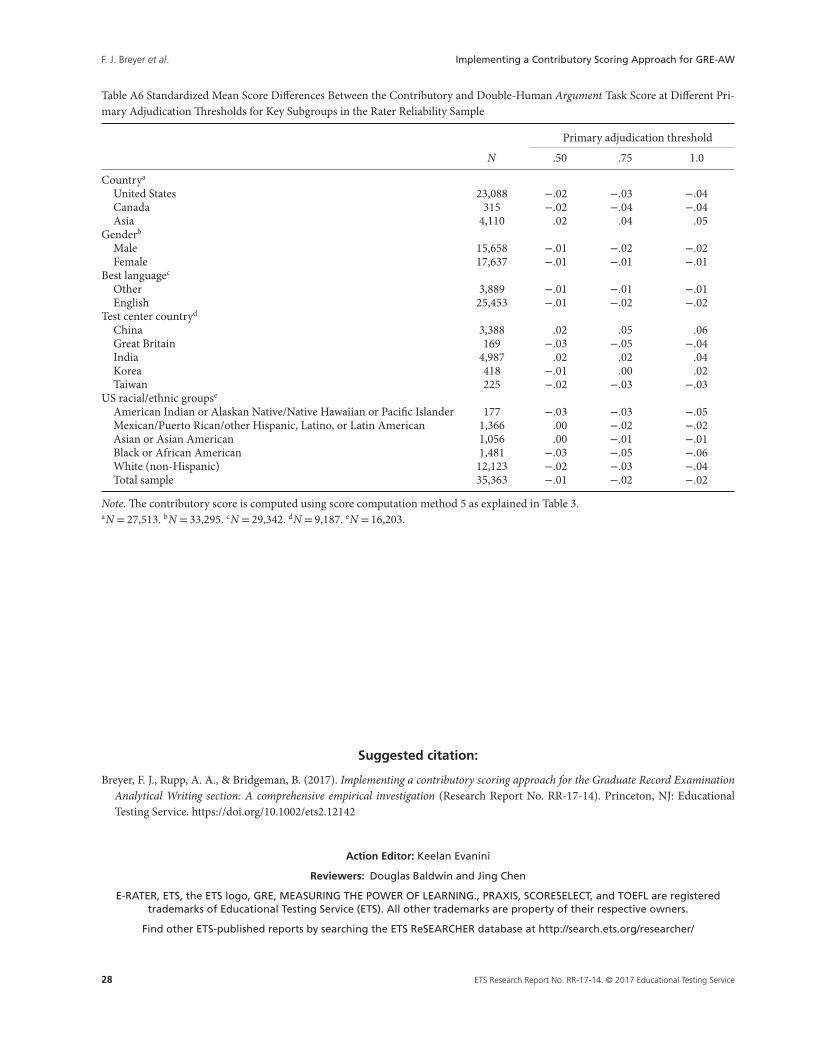
F. J. Breyer et al. Implementing a Contributory Scoring Approach for GRE-AW
Table A6 Standardized Mean Score Differences Between the Contributory and Double-Human Argument Task Score at Different Pri-mary Adjudication Thresholds for Key Subgroups in the Rater Reliability Sample
Primary adjudication threshold
N .50 .75 1.0
Countrya
United States 23,088 −.02 −.03 −.04Canada 315 −.02 −.04 −.04Asia 4,110 .02 .04 .05
Genderb
Male 15,658 −.01 −.02 −.02Female 17,637 −.01 −.01 −.01
Best languagec
Other 3,889 −.01 −.01 −.01English 25,453 −.01 −.02 −.02
Test center countryd
China 3,388 .02 .05 .06Great Britain 169 −.03 −.05 −.04India 4,987 .02 .02 .04Korea 418 −.01 .00 .02Taiwan 225 −.02 −.03 −.03
US racial/ethnic groupse
American Indian or Alaskan Native/Native Hawaiian or Pacific Islander 177 −.03 −.03 −.05Mexican/Puerto Rican/other Hispanic, Latino, or Latin American 1,366 .00 −.02 −.02Asian or Asian American 1,056 .00 −.01 −.01Black or African American 1,481 −.03 −.05 −.06White (non-Hispanic) 12,123 −.02 −.03 −.04Total sample 35,363 −.01 −.02 −.02
Note. The contributory score is computed using score computation method 5 as explained in Table 3.aN = 27,513. bN = 33,295. cN = 29,342. dN = 9,187. eN = 16,203.
Suggested citation:
Breyer, F. J., Rupp, A. A., & Bridgeman, B. (2017). Implementing a contributory scoring approach for the Graduate Record ExaminationAnalytical Writing section: A comprehensive empirical investigation (Research Report No. RR-17-14). Princeton, NJ: EducationalTesting Service. https://doi.org/10.1002/ets2.12142
Action Editor: Keelan Evanini
Reviewers: Douglas Baldwin and Jing Chen
E-RATER, ETS, the ETS logo, GRE, MEASURING THE POWER OF LEARNING., PRAXIS, SCORESELECT, and TOEFL are registeredtrademarks of Educational Testing Service (ETS). All other trademarks are property of their respective owners.
Find other ETS-published reports by searching the ETS ReSEARCHER database at http://search.ets.org/researcher/
28 ETS Research Report No. RR-17-14. © 2017 Educational Testing Service