implementing invertebrate-based … stores/data libraries/files/oweb...implementing...
TRANSCRIPT
1
Project completion report to the Oregon Watershed Enhancement Board
IMPLEMENTING INVERTEBRATE-BASED BIOMONITORING
IN SELECTED WILLAMETTE VALLEY WETLANDS
Clean Water Services, Hillsboro OR West Hayden Island, Portland OR
Submitted to: Wendy Hudson Oregon Watershed Enhancement Board
775 Summer St., Suite 360 Salem, OR 97301
Submitted by: Celeste Mazzacano
Staff Scientist / Aquatic Program Director
The Xerces Society for Invertebrate Conservation
628 NE Broadway, suite 200
Portland, OR 97232

2
Table of Contents
Project background and summary……………………………………………………………………...…………………...…..………………..pg. 3
Methods…………………………………………………………………………………………………………………………………………………………pg. 4
Site Selection…………………………………………….……………………………………………………………………………………….pg. 4
Volunteer training and sampling………………………………………………………………………………………………………..pg. 6
Habitat Assessment……………………………………………………………………………………………………………………………pg. 6
Environmental data……………………………………………………………………………………………………………………………pg. 7
Macroinvertebrate sampling……………………………………………………………………………………………………………..pg. 7
Statistical Methods…………………………………………………………………………………………………………………………….pg. 8
Results and Discussion……………………………………………………………………………………………………………………………………pg. 9
Wetland macroinvertebrate taxa……………………………………………………………………………………………………….pg. 9
Habitat Assessment……………………………………………………………………………………………………………………………pg. 9
Environmental data………………………………………………………………………………………………………………………….pg. 10
Macroinvertebrate community structure…………………………………………………………………………………………pg. 11
Regression analysis of macroinvertebrate community attributes………………………………………………….…pg. 12
Conclusions………………………………………………………………………………………………………………………………………………..…pg. 14
References……………………………………………………………………………………………………………………………………………………pg. 15
Appendix A. Wetland Human Disturbance Assessment form……………………………………………………………………….pg. 16
Appendix B. Wetland macroinvertebrate taxa list…………………………………………………………………………………………pg. 19
3
Project background and summary
This project was undertaken to evaluate a suite of macroinvertebrate-based indicators of wetland biological
health developed previously by Xerces for wetlands in the Willamette Valley. Invertebrates are used routinely
to assess the biological health of streams (Rosenberg & Resh 1996; Karr & Chu 1999), but similar tools for
wetlands have been lacking, and the extreme variability and dynamic nature of wetland invertebrate
communities has been identified as a significant barrier to developing invertebrate indicators (Batzer 2013).
From 2007 through 2010, Xerces worked to develop an invertebrate-based biological assessment tool that could
be used reliably across wetlands in the Willamette Valley to assess wetland quality, detect responses to
anthropogenic stressors, and evaluate restoration success (OWEB, 2011). Our intent was to develop an
invertebrate-based Index of biological Integrity (I-IBI), based on macroinvertebrate community attributes
(metrics) that were significantly different between least-disturbed and most-disturbed sites, and had a sufficient
range of values within the attribute that a scoring system could be devised. Our analysis of the data collected
during these four years showed large variation in macroinvertebrate community composition at the same sites
across consecutive years, and this high level of dynamism was ultimately too great to allow a set of scored
rubrics to be developed. However, data analysis revealed two different suites of attributes that were
significantly different at most-impaired versus least-impaired riverine and flats wetlands. Our goal in this project
was to work with volunteers to conduct additional sampling at wetlands in the Willamette Valley to investigate
the ease of use and reliability of wetland sampling and habitat assessment protocols by non-professional users
and test the functionality of this suite of indicator attributes in additional wetlands. We also worked with a
variety of partners to engage in outreach about the importance of wetland habitats and their associated
invertebrate communities.
Major findings from this study include:
Most partners and volunteers who had conducted macroinvertebrate-based monitoring in streams were
unaware that completely different indicators of biological health are required for wetland monitoring.
A high level of consistency in conducting wetland macroinveretrbate sampling was seen between
volunteers and trained professionals.
Much less consistency was seen in completing the Human Disturbance Assessment (HDA) that provides
an indication of anthropogenic impairment at a site (resulting in an overall ranking of least-disturbed,
intermediate disturbance, or most-disturbed). Not only did scores vary among different people rating
the same site, indivduals who had been involved in site restoration activities in the past were more likely
to rate the wetland as experiencing lower levels of human disturbance. More detailed training will be
required to enable non-expert users to implement the HDA successfully, and the links between the land
use checklist on the HDA form and the appropriate resulting scoring should be made more explicit.
Two new taxa were added the Willamette Valley wetland invertebrate taxa database developed during
Xerces’ previous 2007-2010 wetland study: Elodes (a genus of scirtid marsh beetle) and Ptychoptera (a
genus of phantom crane fly).
A weak correlation between increased site impairment and higher conductivity and total phosphorus
was observed, consistent with the findings of Xerces’ previous wetlands research (2007-2010).
4
Analysis of similarity of macroinvertebrate community composition showed that all sites sampled by
both trained volunteers and Xerces staff were most similar to each other, indicating that volunteers
were able to conduct the wetland macroinvertebrate sampling protocol consistently and successfully.
Higher levels of anthropogenic-induced impairment appeared to be a stronger driver of similarity in
community composition among different wetlands, regardless of hydrogeomorphic type (i.e. riverine vs.
flats).
Macroinvertebrate community attributes identified previously as potential indicators of biological health
for riverine wetlands performed more robustly than those identified for flats wetlands. Six of the 12
attributes identified previously for riverine wetlands showed a strong to moderate correlation with HDA
score, while only two of the seven attributes identified previously for flats wetlands showed a
correlation with HDA score.
Nine of the 12 macroinvertebrate community attributes calculated for riverine wetlands in this study
were within the ranges expected based on their disturbance class when compared to mean attribute
values from Xerces’ work in 2007-2010. This suggests that even within the framework of extreme
annual variability in wetland invertebrate communities, these attributes may have predictive value for
wetland biological health at riverine sites. Conversely, only one of the macroinvertebrate community
attributes for flats wetland in this study had a mean value within the range seen in Xerces 2007-2011
work.
Methods
Site selection
Xerces worked with partners at the Port of Portland, Portland Environmental Services Clean Rivers Program,
Willamette Resources & Education Network, Friends of Tideman Johnson, and Columbia Slough Watershed
Council to determine suitable sites for macroinvertebrate sampling and/or wetland outreach opportunities to
the public. Sampling sites copnsisted of both riverine and flats types of wetlands, according to the
hydrogeomorphic (HGM) classification system (Brinson 1993, Adamus 2001). Sites at which volunteer-based
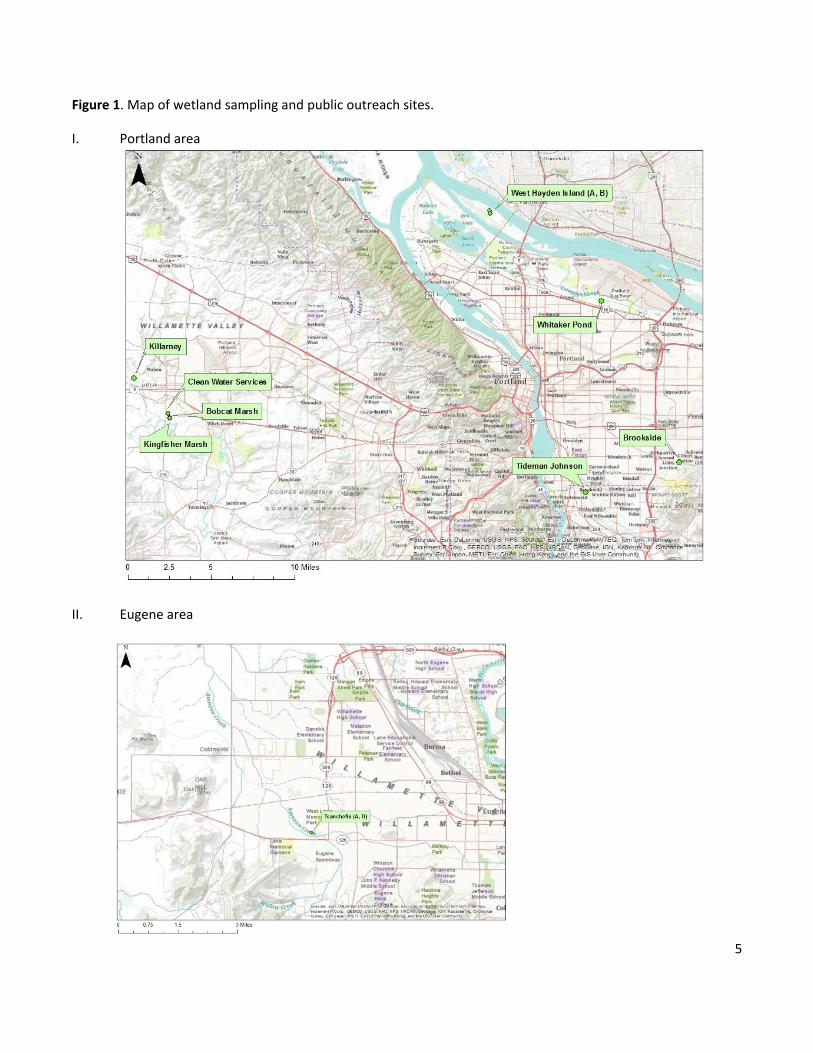
macroinvertebrate sampling and/or outreach and education occurred included West Eugene Wetlands
(Tsanchefin; 2 different sampling sites), Columbia Slough (Whitaker Pond), Tideman Johnson, Brookside, West
Hayden Island (two different sampling sites), Killarney, Kingfisher Marsh, and Bobcat Marsh. A map depicting
the site locations is shown in Figure 1.
5
Figure 1. Map of wetland sampling and public outreach sites.
I. Portland area
II. Eugene area
6
Volunteer Training and Sampling
Habitat assessment and macroinvertebrate sampling were done in conjunction with volunteers and/or staff
associated with site management at Tsanchefin, West Hayden, and Tideman Johnson wetlands. Trained
volunteers and Xerces staff did replicate habitat assessments and macroinvertebrate sampling at these sites to
examine consistency of results. In addition, where sufficient numbers of volunteers were available, multiple
different individuals conducted an HDA assessment of the same site, to look at consistency of disturbance rating
among volunteers.
At sites such as Killarney, Bobcat Marsh, Clean Water Services Marsh, and Kingfisher Marsh, site managers were
educated about wetland macroinvertebrates, bioassessment, and sampling techniques but did not take part in
replicate sampling, and all samples were taken solely by Xerces staff.
At Brookside and Whitaker Pond, extensive education about wetland invertebrates was conducted, including a
guided field session, but formal sampling was not done. At Whitaker Pond, Xerces staff participated in the
Columbia Slough Watershed Council’s annual Slough 101 training day, working with about 40 local residents and
high school student participants. At Brookside, we worked with BES staff during a field session of the Clean
Rivers Program for grade school children, but the number and age of the students precluded formal sampling.
Habitat Assessment
Determining the range of human-induced stressors impacting a given wetland during a site visit is challenging.
Rapid wetland assessment techniques have been developed for Oregon (ORWAP; Adamus et al. 2009), but these
require trained professionals with specialized knowledge and take several hours to complete. To make basic
wetland assessment more accessible to a variety of users, Xerces previously implemented a wetland Human
Disturbance Assessment (HDA) form, modified from a rubric developed by Gernes & Helgen for wetlands in
Minnesota (U.S. EPA 2002). HDA scores were shown previously to correlate well with the more comprehensive
ORWAP stressor scores when both analyses were performed at the same site (OWEB 2011). The HDA examines
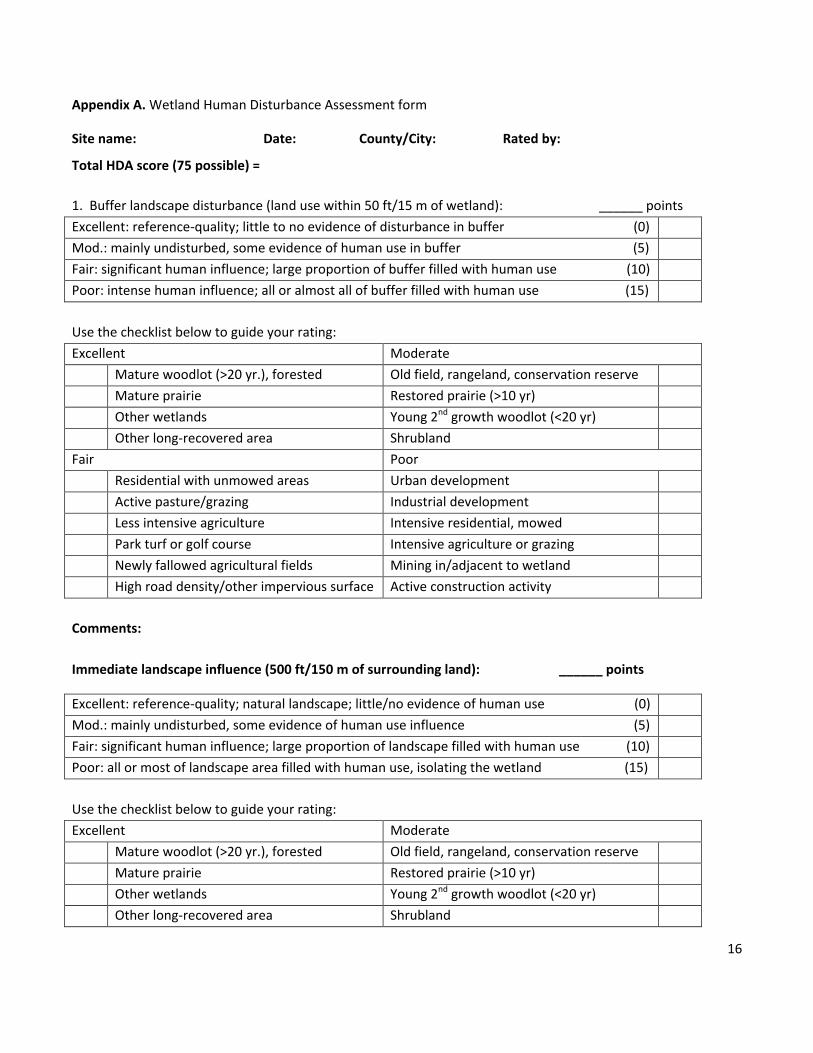
five aspects of the site (see Appendix A for the full form):
Buffer landscape disturbance (land use within 50 ft/15 m of wetland)
Immediate landscape influence (500 ft/150 m of surrounding land)
Habitat alteration, immediate landscape (500 ft/150 m of surrounding land)
Hydrologic alteration, immediate landscape (500 ft/150 m of surrounding land)
Chemical & Sediment Inputs
Each aspect can be rated as Excellent (0 points), Moderate (5 points), Fair (10 points), or Poor (15 points), and is
accompanied by a checklist to guide the user rating, allowing notation of elements such as road density;
industrial, agricultural, or residential development; proportion of non-native plant species; logging, grazing,
construction, foot traffic and vehicle use; dams or culverts; etc. The site HDA score is calculated by summing the
rating for each section, with a lower score indicating better conditions, such that an utterly pristine site would
receive a total score of 0, and a completely disturbed site would score 75 points. Because the Chemical &
Sediment Inputs section includes nutrient levels, final scores for each site were not calculated until water
chemistry data were returned by the contracted lab (see Environmental data below).
7
Environmental data
The location of the sampling site within each wetland was photographed and recorded using a Garmin Rino 120
GPS unit (NAD 83 datum). Measurements such as turbidity, pH, and temperature were taken adjacent to the
sampling region prior to macroinvertebrate sampling, to avoid trampling or disturbing the region from which
macroinvertebrates would be netted. Water temperature, conductivity and pH were measured using a Hach
SensIon 156 multiparameter meter. Turbidity was measured using a polycarbonate transparency tube with a
Secchi disk at the bottom. Calibration of the pH and conductivity probes was checked at the beginning of each
sampling day.
Additional water samples were taken for off-site determination of total Kjeldahl nitrogen, total phosphorus, and
chloride. Samples to be analyzed for nitrogen and phosphorus were placed in acid-washed 1-liter containers
provided by the lab, and a separate sample for chloride determination was taken in a 250 mL container. All
samples were immediately placed in a cooler, and refrigerated afterwards until being delivered within 7 days to
Alexin Analytical Laboratory (Portland, OR) for analysis.
Macroinvertebrate sampling
All macroinvertebrate sampling was done during May, the standard period used by Xerces for wetland studies.
This index period was used previously because it is late enough in the spring that more macroinvertebrates are
mature enough to identify to genus and species, but early enough that there is less risk of sampling sites having
dried down to the point where water levels are too low for sampling nets to be used.
Macroinvertebrates were sampled using a D-frame dip net with 500 m mesh in the near-shore zone of
emergent vegetation, in water 1.6 – 3.2 ft. (0.5 to 1 m) deep. Sampling transects were 24-30 ft. (7-9 m) long,
and were delineated using three 4-foot cedar stakes driven into the substrate. For sites sampled by both
volunteers and Xerces staff, adjacent replicate sampling transects were established. The water depth at each
stake was measured and recorded. Two composite dip net samples were taken at each transect. Each
composite sample consisted of three sets of 1-meter sweeps taken through the top 1-3 in. (2.5-7.5 cm) of the
benthos and up through the water column on one side of each of three cedar stakes (“shore” side and “open
water” side). Thus, each composite sample was comprised of nine individual 1-meter sweeps, three sweeps
each on one “side” of each cedar stake (see Figure 2 for illustration).

8
Figure 2. Wetland macroinvertebrate sampling design. Yellow lines indicate 4-foot cedar stakes used to mark
the transect. Numbers indicate each of the nine 1-meter dipnet sweep areas that comprise a single composite
sample. The 2nd composite sample is taken in the same way on the opposite side of the stakes.
If the volume of sediment in the net bag after three consecutive sweeps was excessive, sample volume was
reduced by submerging the bottom of the net bag in the water in a region of the wetland away from the
sampling site, and stirring the contents with one hand while gently swirling and bouncing the net in the water.
This also allowed large pieces of debris to be rinsed and removed, along with any captured amphibians and fish.
All nine sweeps comprising a single composite sample were pooled in a 10-gallon bucket. Any remaining fish
and amphibians were removed and replaced in the wetland, and larger pieces of debris were rinsed and
discarded. Pooled material was poured through a sieve with 500 m mesh, and rinsed further to remove
sediment. All rinse water was poured through a 500 m mesh sieve prior to use, to avoid accidentally
introducing additional invertebrates into the sample. Sample material was transferred to 1-L Nalgene jars and
80% ethanol was added as a preservative. For maximum preservation, sample volume comprised no more than
75% of the jar, and samples that contained large amounts of filamentous algae comprised no more than 50% of
the jar volume. At the end of each day, the ethanol in each sample was poured off and replaced with fresh 80%
ethanol.
All samples were delivered to the taxonomic lab (ABR, Inc., Forest Grove, OR) for identification. Each composite
sample was randomly subsampled to a target count of 500 organisms, and “large and rare” invertebrates were
picked and identified after the target subsample number was reached. Organisms were identified to the lowest
taxonomic level possible, usually genus.
Statistical methods
The PRIMER v6 software package (Clarke & Gorley 2006) was used to examine overall invertebrate community
structure at each site and the degree of community similarity between sites and replicate samples taken by
volunteers and Xerces staff at the same site. Resemblance matrices for taxa abundance were created for sites
using square root-transformed abundance data (Bray–Curtis distance measure), and patterns in taxa
9
aggregations at each site were examined using CLUSTER analysis and non-metric multidimensional scaling
(MDS).
Xerces previous work identified a suite of macroinvertebrate community attributes that differed significantly
among least-impaired and most-impaired sites. To assess the reliability of the attributes at new sampling sites,
the value of attribute was calculated for all macroinvertebrate samples taken. These attributes included:
Mean significantly greater at most-impaired riverine sites: abundance; #, % diversity, and % abundance
of highly tolerant taxa (Modified Hilsenhoff Biotic Index (MHBI) = 8-10); # of non-insect taxa; # genera
and % diversity of (Crustacea + Mollusca); % diversity of Crustacea; % Chironomus of total Chironomidae
(a tolerant genus of non-biting midge); % abundance Sphaeriidae (pea clams)
Mean significantly greater at least-impaired riverine sites: # genera ECOT (Ephemeroptera, Coleoptera,
Odonata, and Trichoptera); # Coleoptera taxa
Mean significantly greater at most-impaired flats sites: % diversity collector/gatherers; % abundance
Chironomini (tribe of non-biting midges with many tolerant genera); % abundance Chironomus
Mean significantly greater at least-impaired flats sites: # of taxa; % diversity, and % abundance of ETSD
(Ephemeroptera, Trichoptera, Sphaeriidae, and dragonflies); % abundance Sphaeriidae
Linear regression analysis was done in Excel to assess the relationship between the above invertebrate
community attributes and site HDA score (as calculated by Xerces staff). HDA scores were also used to assign
each site to an overall class: class 1 (least-disturbed, HDA score = 0-22), intermediate disturbance (HDA score =
22.1-42), and most-disturbed (HDA = 42.1-75). The mean value of each attribute among all sites in the same
HDA class was then compared to the mean values for the same attributes calculated from Xerces 2007-2010
study to determine whether they fell within a similar range.
Results & Discussion
Wetland macroinvertebrate taxa
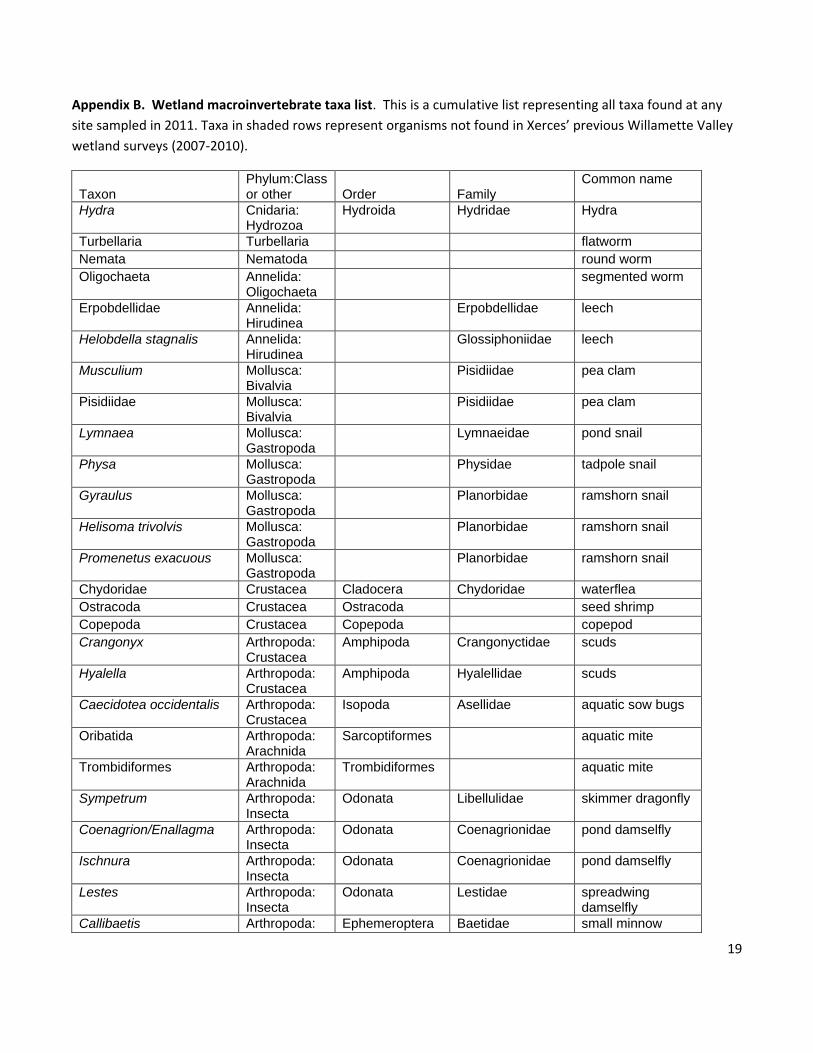
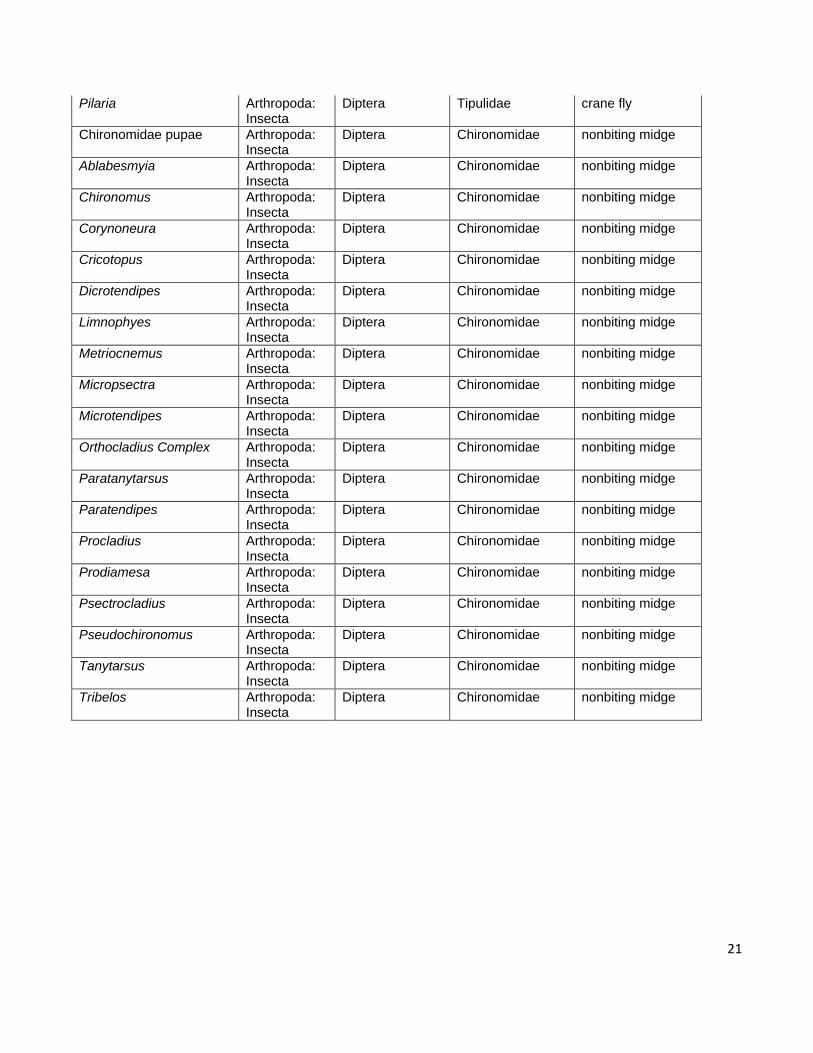
A total of 69 taxa were found among all the wetlands samples (see Appendix B for a complete list). Only two
had not been found previously at any wetland during the four years of Xerces sampling in the Willamette Valley,
namely Elodes (a genus of scirtid marsh beetle) and Ptychoptera (a genus of phantom crane fly), both of which
were part of the community at Tideman Johnson. The number of unique taxa at each site ranged from 20 to 31.
Overall abundance was dominated numerically by a few tolerant, cosmopolitan taxa including aquatic
earthworms (Oligochaeta), snails (Lymnaea, Physa), microcrustacea (cladocerans and copepods), and aquatic
sowbugs (Crangonyx, Hyalella).
Habitat Assessment
Xerces past work showed a high degree of consistency of site HDA scoring among multiple trained users of the
rubric (OWEB 2011). Different Xerces sampling teams scored the same wetlands across different years and,
while the HDA score was generally not identical for the same site in different years, the magnitude of the change
was small enough that the overall site classification as least-impaired, intermediate-impaired, or most-impaired
changed for only four sites of the 50 sites sampled, and those were at the upper or lower score limit for a given
10
impairment class. We had also found consistent correlation between our site HDA score and the more
comprehensive and detailed stressor score generated via ORWAP analysis, indicating that HDA assessment was
a robust and reliable tool. However, because all users from 2007-2010 had been trained Xerces staff, we
wanted to assess the ease of use and consistency of the HDA assessment among volunteers who lacked previous
experience with wetland assessment.
Our results from this project indicate that HDA assessment varies greatly among new users. Staff of agencies
that manage wetlands, such as Port of Portland, tended to be more consistent and generated assessment scores
more similar to those generated by Xerces staff at the same site, but both staff and volunteers that had been
involved in restoration activities at a site were strongly biased towards lower scoring indicating less disturbed
conditions. However, all were conscientious about using the associated checklist of site characteristics intended
to help guide users to a realistic score. These results indicate that additional or more detailed training will be
required to enable non-expert users to implement the HDA form successfully at their wetland, and that the links
between the land use checklist on the HDA form and the appropriate resulting scoring need to be strengthened
and made more explicit.
Overall, site HDA scores generated by Xerces staff ranged from 35 to 62.5; thus, all sites were either moderately
or most-impaired, with no least-impaired sites sampled.
Environmental data
All values for water chemistry parameters measured (pH, conductivity, turbidity, and nutrients) fell within the
range of minimum and maximum values seen for each in Xerces previous 2007-2010 study. The only exception
was the total phosphorus level at Tideman Johnson (2.56 mg/L), which was an order of magnitude higher than
total phosphorus at the other sites in this study and two times greater than the maximum value for total
phosphorus seen in the 2007-2010 study.
Values for pH were similar among all sites, ranging from 7.1 to 8.6, and the median value (7.6) was the same as
the median pH for all wetlands during Xerces previous work. Conductivity showed more variation, ranging from
42.1 to 245 uS/cm, with a median value of 127 uS/cm. Turbidity was low at all sites, ranging from 10 – 15.7 NTU
(nephelometric turbidity units). Nutrient values ranged widely among sites; highs and lows for chloride ranged
from a low of 1.3 mg/L (West Hayden Island) to a high of 9.6 mg/L (Killarney), with a median of 3.7 mg/L; total
Kjeldahl nitrogen had a low of 1.2 mg/L (Tsanchefin and Kingfisher Marsh) and a high of 20.9 mg/L (Tideman
Johnson), with a median of 1.8 mg/L; and total phosphorus ranged from a low of 0.09 mg/L (Tsanchefin) to a
high of 2.56 mg/L (Tideman Johnson), with a median value of 0.23 mg/L.
Xerces’ previous work in Willamette Valley wetlands did not find strong correlations between water chemistry
parameters and site impairment or macroinvertebrate community composition, and the values for conductivity,
Cl-, total Kjeldahl N, and total P varied greatly from year to year the same site. However, a weak correlation was
seen between site impairment and higher levels of N, P, and conductivity. In this study, a similar weak
correlation was seen between site impairment and higher conductivity (R2 = 0.3832) and higher total
phosphorus (R2 = 0.13), but no correlation with total nitrogen was found.

11
Macroinvertebrate community structure
CLUSTER analysis
A CLUSTER analysis was done on a Bray-Curtis similarity matrix of square root-transformed macroinvertebrate
taxa abundance data in PRIMER v6. All sites that were sampled by both trained volunteers and Xerces staff
clustered most closely with each other. Samples taken at Tideman Johnson by volunteers and Xerces staff
clustered at 80.1% similarity, while volunteer and Xerces samples taken at Tsanchefin 1 and Tsanchefin 2
clustered with each other at 72.2% and 86.7% similarity, respectively. This indicates that volunteers trained in
Xerces’ standardized wetland invertebrate sampling techniques were able to implement the sampling protocols
consistently and successfully.
The mitigation wetlands sampled in the Jackson Bottoms complex (Kingfisher Marsh, Bobcat Marsh, and Clean
Water Services wetland) and the Port of Portland West Hayden Island sites formed a separate cluster, with an
overall similarity of 58.5%, but clustering was not based solely on geographic proximity. Bobcat and Kingfisher
had a community similarity of 72.8%, but the next most similar invertebrate community was at West Hayden
Island site A, which was 61.5% similar to the Kingfisher/Bobcat cluster. The community at West Hayden Island B
was most similar to that at the Clean Water Services wetland (68.8% similarity), and this site pair shared a 58.5%
similarity with the Kingfisher/Bobcat/West Hayden A cluster.
Figure 3. Similarity of macroinvertebrate community composition among wetland sampling sites

12
MDS ordination
MDS ordination of the macroinvertebrate communities at the wetland sampling sites revealed additional
community similarities based on level of human disturbance (HDA class) and hydrogeomorphic type (riverine vs.
flats). All of the sites sampled in this project experienced substantial degrees of human impact, such that no
sites were considered minimally disturbed (HDA Class 1). Although some separation was seen between riverine
and flats sites, the level of human disturbance affected the ordination more, as both riverine and flats class 3
sites were separated from the remaining flats sites, which were all HDA class 2. This suggests that as human-
induced stressors increase, the macroinvertebrate community becomes more uniform among equally impaired
sites, regardless of hydrogeomorphic type.
Figure 4. MDS ordination of wetland sampling sites. HDA class 2 = intermediate disturbance; HDA class 3 =
most-disturbed. R = HGM-riverine wetlands, F = HGM flats wetlands.
Regression analysis of macroinvertebrate community attributes
The challenges of finding ecologically meaningful signals in wetland macroinvertebrates in the face of the
extreme variability of their habitats and community composition from year to year were recently summarized by
Batzer (2013), whose assessment of extensive research done in 14 different areas of North America was
accompanied by commentary on “…the frustrating lack of consistency in invertebrate response that occurs
within and among wetlands.” This variability has been evident in the work done by Xerces in Willamette Valley
wetlands from 2007-2010. In 2009, Xerces developed a preliminary invertebrate-based IBI consisting of six
metrics, based on analysis of data from riverine wetland reference sites sampled in 2007 and 2008. However,
this IBI was not supported by the 2009 and 2010 datasets, and final analyses of sites sampled across 2-4 years
revealed instead a suite of macroinvertebrate community attributes whose means were significantly different
between most-impaired (class 3) and least impaired (class 1) sites. Different sets of attributes were identified
13
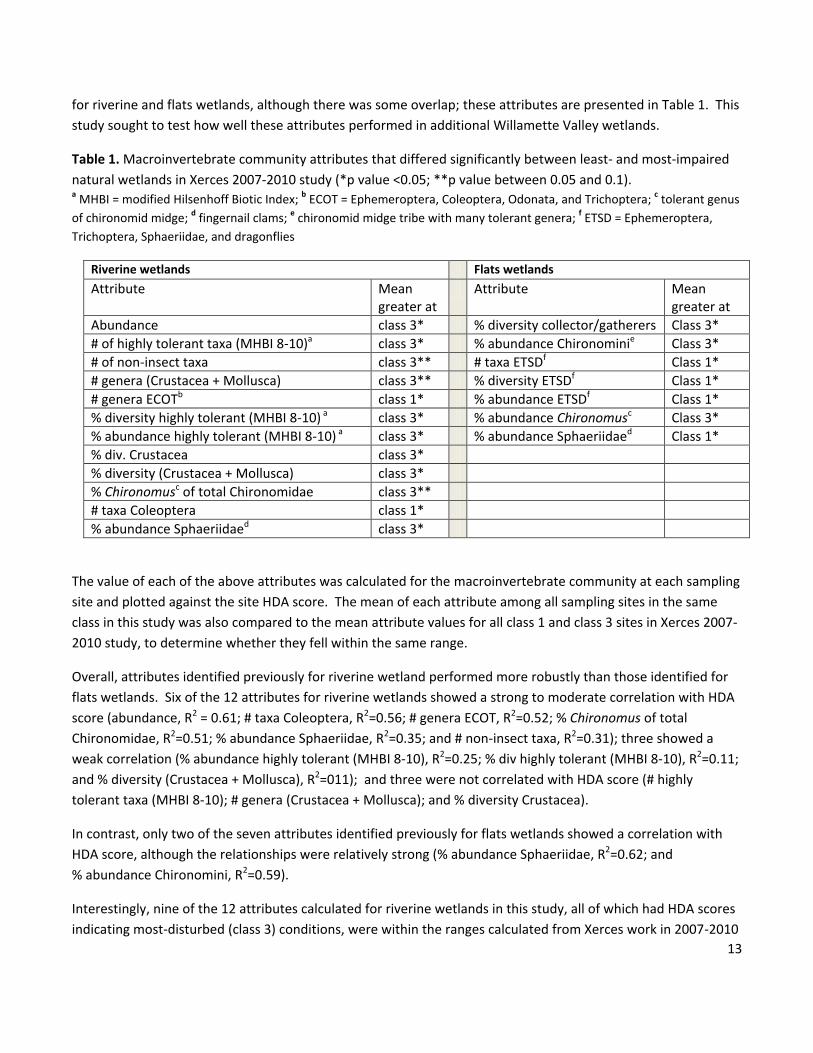
for riverine and flats wetlands, although there was some overlap; these attributes are presented in Table 1. This
study sought to test how well these attributes performed in additional Willamette Valley wetlands.
Table 1. Macroinvertebrate community attributes that differed significantly between least- and most-impaired
natural wetlands in Xerces 2007-2010 study (*p value <0.05; **p value between 0.05 and 0.1). a MHBI = modified Hilsenhoff Biotic Index; b ECOT = Ephemeroptera, Coleoptera, Odonata, and Trichoptera; c tolerant genus
of chironomid midge; d fingernail clams; e chironomid midge tribe with many tolerant genera; f ETSD = Ephemeroptera,
Trichoptera, Sphaeriidae, and dragonflies
Riverine wetlands Flats wetlands
Attribute Mean greater at
Attribute Mean greater at
Abundance class 3* % diversity collector/gatherers Class 3*
# of highly tolerant taxa (MHBI 8-10)a class 3* % abundance Chironominie Class 3*
# of non-insect taxa class 3** # taxa ETSDf Class 1*
# genera (Crustacea + Mollusca) class 3** % diversity ETSDf Class 1*
# genera ECOTb class 1* % abundance ETSDf Class 1*
% diversity highly tolerant (MHBI 8-10) a class 3* % abundance Chironomusc Class 3*
% abundance highly tolerant (MHBI 8-10) a class 3* % abundance Sphaeriidaed Class 1*
% div. Crustacea class 3*
% diversity (Crustacea + Mollusca) class 3*
% Chironomusc of total Chironomidae class 3**
# taxa Coleoptera class 1*
% abundance Sphaeriidaed class 3*
The value of each of the above attributes was calculated for the macroinvertebrate community at each sampling
site and plotted against the site HDA score. The mean of each attribute among all sampling sites in the same
class in this study was also compared to the mean attribute values for all class 1 and class 3 sites in Xerces 2007-
2010 study, to determine whether they fell within the same range.
Overall, attributes identified previously for riverine wetland performed more robustly than those identified for
flats wetlands. Six of the 12 attributes for riverine wetlands showed a strong to moderate correlation with HDA
score (abundance, R2 = 0.61; # taxa Coleoptera, R2=0.56; # genera ECOT, R2=0.52; % Chironomus of total
Chironomidae, R2=0.51; % abundance Sphaeriidae, R2=0.35; and # non-insect taxa, R2=0.31); three showed a
weak correlation (% abundance highly tolerant (MHBI 8-10), R2=0.25; % div highly tolerant (MHBI 8-10), R2=0.11;
and % diversity (Crustacea + Mollusca), R2=011); and three were not correlated with HDA score (# highly
tolerant taxa (MHBI 8-10); # genera (Crustacea + Mollusca); and % diversity Crustacea).
In contrast, only two of the seven attributes identified previously for flats wetlands showed a correlation with
HDA score, although the relationships were relatively strong (% abundance Sphaeriidae, R2=0.62; and
% abundance Chironomini, R2=0.59).
Interestingly, nine of the 12 attributes calculated for riverine wetlands in this study, all of which had HDA scores
indicating most-disturbed (class 3) conditions, were within the ranges calculated from Xerces work in 2007-2010
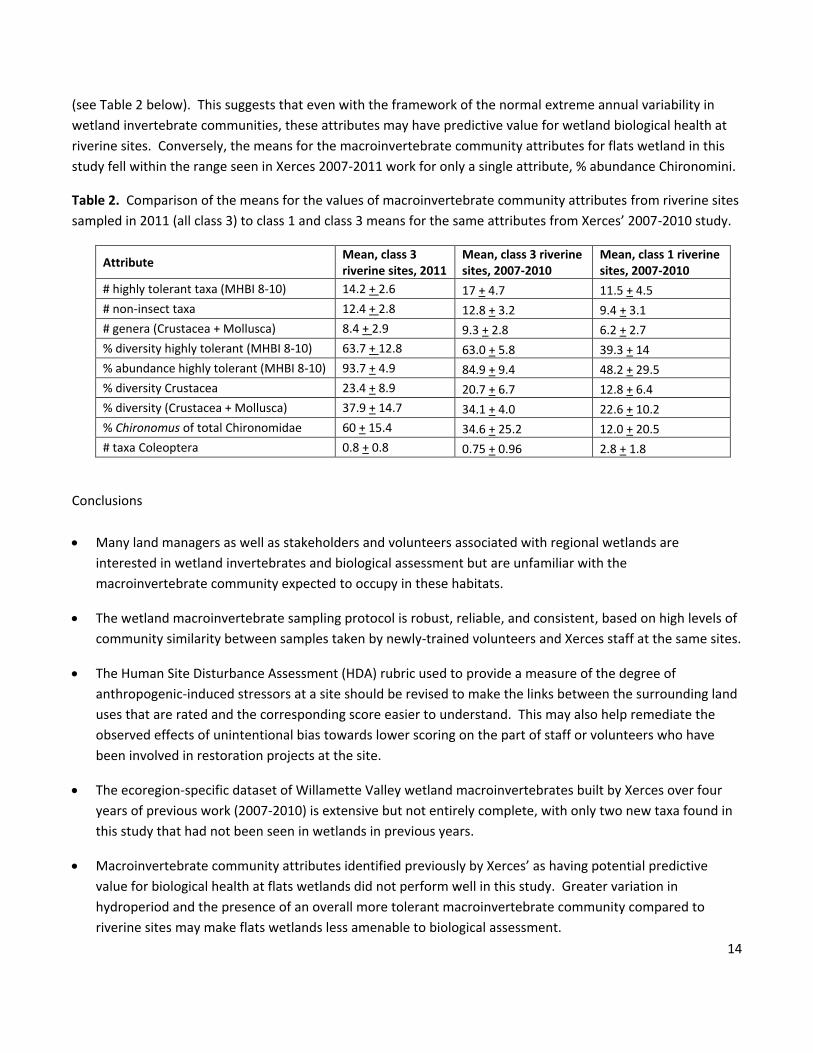
14
(see Table 2 below). This suggests that even with the framework of the normal extreme annual variability in
wetland invertebrate communities, these attributes may have predictive value for wetland biological health at
riverine sites. Conversely, the means for the macroinvertebrate community attributes for flats wetland in this
study fell within the range seen in Xerces 2007-2011 work for only a single attribute, % abundance Chironomini.
Table 2. Comparison of the means for the values of macroinvertebrate community attributes from riverine sites
sampled in 2011 (all class 3) to class 1 and class 3 means for the same attributes from Xerces’ 2007-2010 study.
Attribute Mean, class 3 riverine sites, 2011
Mean, class 3 riverine sites, 2007-2010
Mean, class 1 riverine sites, 2007-2010
# highly tolerant taxa (MHBI 8-10) 14.2 + 2.6 17 + 4.7 11.5 + 4.5
# non-insect taxa 12.4 + 2.8 12.8 + 3.2 9.4 + 3.1
# genera (Crustacea + Mollusca) 8.4 + 2.9 9.3 + 2.8 6.2 + 2.7
% diversity highly tolerant (MHBI 8-10) 63.7 + 12.8 63.0 + 5.8 39.3 + 14
% abundance highly tolerant (MHBI 8-10) 93.7 + 4.9 84.9 + 9.4 48.2 + 29.5
% diversity Crustacea 23.4 + 8.9 20.7 + 6.7 12.8 + 6.4
% diversity (Crustacea + Mollusca) 37.9 + 14.7 34.1 + 4.0 22.6 + 10.2
% Chironomus of total Chironomidae 60 + 15.4 34.6 + 25.2 12.0 + 20.5
# taxa Coleoptera 0.8 + 0.8 0.75 + 0.96 2.8 + 1.8
Conclusions
Many land managers as well as stakeholders and volunteers associated with regional wetlands are
interested in wetland invertebrates and biological assessment but are unfamiliar with the
macroinvertebrate community expected to occupy in these habitats.
The wetland macroinvertebrate sampling protocol is robust, reliable, and consistent, based on high levels of
community similarity between samples taken by newly-trained volunteers and Xerces staff at the same sites.
The Human Site Disturbance Assessment (HDA) rubric used to provide a measure of the degree of
anthropogenic-induced stressors at a site should be revised to make the links between the surrounding land
uses that are rated and the corresponding score easier to understand. This may also help remediate the
observed effects of unintentional bias towards lower scoring on the part of staff or volunteers who have
been involved in restoration projects at the site.
The ecoregion-specific dataset of Willamette Valley wetland macroinvertebrates built by Xerces over four
years of previous work (2007-2010) is extensive but not entirely complete, with only two new taxa found in
this study that had not been seen in wetlands in previous years.
Macroinvertebrate community attributes identified previously by Xerces’ as having potential predictive
value for biological health at flats wetlands did not perform well in this study. Greater variation in
hydroperiod and the presence of an overall more tolerant macroinvertebrate community compared to
riverine sites may make flats wetlands less amenable to biological assessment.

15
Macroinvertebrate community attributes identified in Xerces’ previous work (2007-2010) as being
significantly different between most- and least-impaired wetlands and whose performance was tested in
this study were much more consistent for riverine wetlands than for flats. Nine of the twelve
macroinvertebrate community attributes previously identified as having predictive value for wetland
biological health in riverine sites showed correlated appropriately with disturbance level. The mean values
for the majority of attributes identified for riverine communities were also in the same ranges seen in
Xerces’ previous work.
Macroinvertebrate community attributes identified as having predictive value for biological health of
riverine wetlands in the Willamette Valley have initially performed well, although more extensive testing at
additional sites would be needed to confirm their continued performance.
References
Adamus P. R. 2001. Guidebook for the hydrogeomorphic (HGM)-based assessment of Oregon wetland and
riparian sites: statewide classification and profiles. Oregon Division of State Lands, Salem, OR.
Adamus P., J. Morlan and K.Verble. 2009. Manual for the Oregon Rapid Wetland Assessment Protocol (ORWAP),
version 2.0. Oregon Dept. of State Lands, Salem, OR.
Batzer, D. P. 2013. The seemingly intractable ecological responses of invertebrates in North American wetlands:
a review. Wetlands 33; 1-15.
Brinson M. M. 1993. A hydrogeomorphic classification of wetlands. Technical Report WRP-DE-4. U. S. Army
Corps of Engineers Waterways Experiment Station, Vicksburg, MS.
Clarke K. R. and R. N. Gorley. 2006. PRIMER-E v6 User Manual/Tutorial. Primer-E, Plymouth, UK.
Karr J. R. and E. W. Chu. 1999. Restoring life in running waters: better biological monitoring. Island Press,
Washington DC.
Oregon Watershed Enhancement Board. 2011. Oregon’s wetland monitoring and assessment program: a pilot
study. Final report to US EPA Wetland Program Development Grant Program, compiled by K. Abraham. 61 pp.
Available at http://www.oregon.gov/OWEB/MONITOR/docs/final_wetland_report.pdf.
Rosenberg, D. M. and Resh, V. H. 1996. Use of aquatic insects in biomonitoring. In: An Introduction to the
Aquatic Insects of North America, Merritt, R. W and Cummins, K. W. (eds.), Kendall/Hunt Publishing Company,
Dubuque IA, pg. 87-97.
U. S. EPA. 2002. Methods for evaluating wetland condition: developing metrics and indexes of biological
integrity. EPA-822-R-02-016, Office of Water, U. S. Environmental Protection Agency, Washington DC.
16
Appendix A. Wetland Human Disturbance Assessment form
Site name: Date: County/City: Rated by:
Total HDA score (75 possible) =
1. Buffer landscape disturbance (land use within 50 ft/15 m of wetland): ______ points
Excellent: reference-quality; little to no evidence of disturbance in buffer (0)
Mod.: mainly undisturbed, some evidence of human use in buffer (5)
Fair: significant human influence; large proportion of buffer filled with human use (10)
Poor: intense human influence; all or almost all of buffer filled with human use (15)
Use the checklist below to guide your rating:
Excellent Moderate
Mature woodlot (>20 yr.), forested Old field, rangeland, conservation reserve
Mature prairie Restored prairie (>10 yr)
Other wetlands Young 2nd growth woodlot (<20 yr)
Other long-recovered area Shrubland
Fair Poor
Residential with unmowed areas Urban development
Active pasture/grazing Industrial development
Less intensive agriculture Intensive residential, mowed
Park turf or golf course Intensive agriculture or grazing
Newly fallowed agricultural fields Mining in/adjacent to wetland
High road density/other impervious surface Active construction activity
Comments:
Immediate landscape influence (500 ft/150 m of surrounding land): ______ points
Excellent: reference-quality; natural landscape; little/no evidence of human use (0)
Mod.: mainly undisturbed, some evidence of human use influence (5)
Fair: significant human influence; large proportion of landscape filled with human use (10)
Poor: all or most of landscape area filled with human use, isolating the wetland (15)
Use the checklist below to guide your rating:
Excellent Moderate
Mature woodlot (>20 yr.), forested Old field, rangeland, conservation reserve
Mature prairie Restored prairie (>10 yr)
Other wetlands Young 2nd growth woodlot (<20 yr)
Other long-recovered area Shrubland
17
Fair Poor
Residential with unmowed areas Urban development
Active pasture/grazing Industrial development
Less intensive agriculture Intensive residential, mowed
Park turf or golf course Intensive agriculture or grazing
Newly fallowed agricultural fields Mining in/adjacent to wetland
High road density/other impervious surface Active construction activity
Comments:
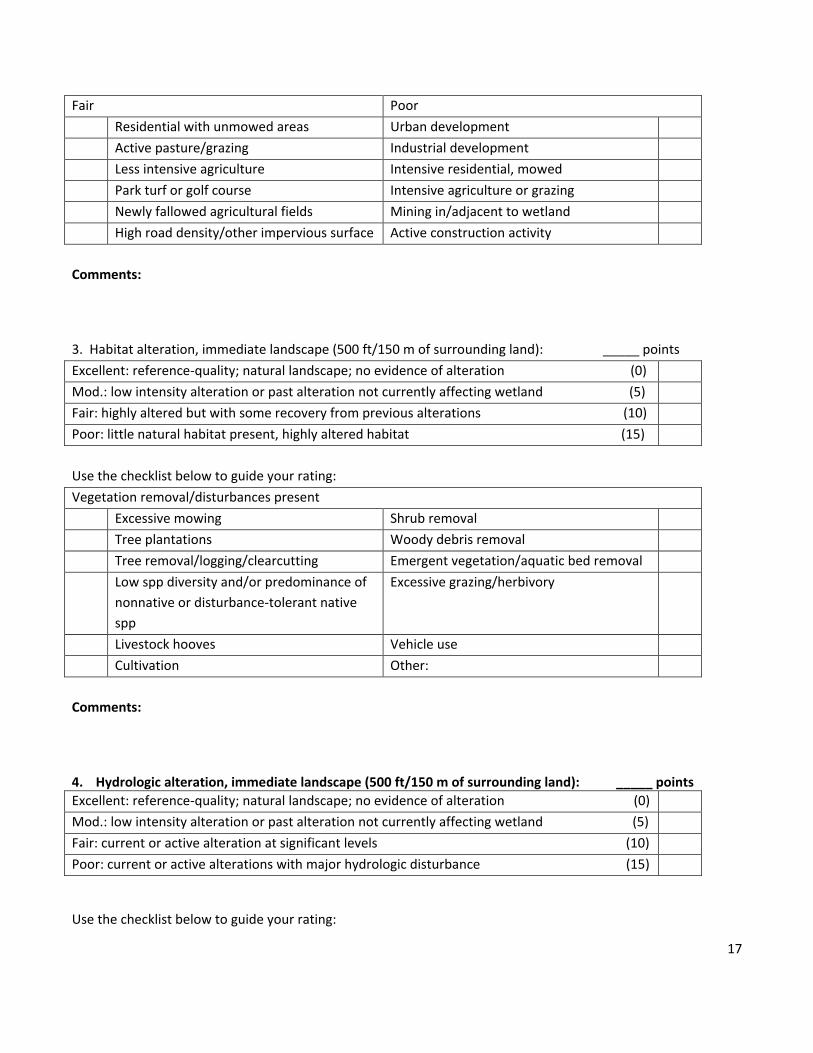
3. Habitat alteration, immediate landscape (500 ft/150 m of surrounding land): _____ points
Excellent: reference-quality; natural landscape; no evidence of alteration (0)
Mod.: low intensity alteration or past alteration not currently affecting wetland (5)
Fair: highly altered but with some recovery from previous alterations (10)
Poor: little natural habitat present, highly altered habitat (15)
Use the checklist below to guide your rating:
Vegetation removal/disturbances present
Excessive mowing Shrub removal
Tree plantations Woody debris removal
Tree removal/logging/clearcutting Emergent vegetation/aquatic bed removal
Low spp diversity and/or predominance of
nonnative or disturbance-tolerant native
spp
Excessive grazing/herbivory
Livestock hooves Vehicle use
Cultivation Other:
Comments:
4. Hydrologic alteration, immediate landscape (500 ft/150 m of surrounding land): _____ points
Excellent: reference-quality; natural landscape; no evidence of alteration (0)
Mod.: low intensity alteration or past alteration not currently affecting wetland (5)
Fair: current or active alteration at significant levels (10)
Poor: current or active alterations with major hydrologic disturbance (15)
Use the checklist below to guide your rating:

18
Ditch inlet/outlet Berm, levee or dike
Tile drain Road or railroad bed
Point source input Drainage
Weir or dam Unnatural connection to other waters
Dredging Dewatering in/near wetland
Grading or filling in/near wetland Source water alteration
Other:
Comments:
5. Chemical & Sediment Inputs: ______ points
Excellent: as expected for natural site, little/no evidence of additional human-related input (0)
Mod.: inputs in low range, little/slight evidence of additional human-related input (5)
Fair: inputs in mid-range, significant evidence of additional human-related input (10)
Poor: high levels of human-related inputs, high potential for biological harm (15)
Use the checklist below to guide your rating:
High [Cl]* High conductivity
High [total P]* Unnaturally high or low pH
High [total N]* High turbidity reading
Excessive algal growth/density Soil disturbance in immediate buffer
Eroding banks/slopes Other:
* These can only be assessed after the site visit, when the water chemistry analysis results have been received
from the lab
Comments:
19
Appendix B. Wetland macroinvertebrate taxa list. This is a cumulative list representing all taxa found at any
site sampled in 2011. Taxa in shaded rows represent organisms not found in Xerces’ previous Willamette Valley
wetland surveys (2007-2010).
Taxon
Phylum:Class or other
Order
Family
Common name
Hydra Cnidaria: Hydrozoa
Hydroida Hydridae Hydra
Turbellaria Turbellaria flatworm
Nemata Nematoda round worm
Oligochaeta Annelida: Oligochaeta
segmented worm
Erpobdellidae Annelida: Hirudinea
Erpobdellidae leech
Helobdella stagnalis Annelida: Hirudinea
Glossiphoniidae leech
Musculium Mollusca: Bivalvia
Pisidiidae pea clam
Pisidiidae Mollusca: Bivalvia
Pisidiidae pea clam
Lymnaea Mollusca: Gastropoda
Lymnaeidae pond snail
Physa Mollusca: Gastropoda
Physidae tadpole snail
Gyraulus Mollusca: Gastropoda
Planorbidae ramshorn snail
Helisoma trivolvis Mollusca: Gastropoda
Planorbidae ramshorn snail
Promenetus exacuous Mollusca: Gastropoda
Planorbidae ramshorn snail
Chydoridae Crustacea Cladocera Chydoridae waterflea
Ostracoda Crustacea Ostracoda seed shrimp
Copepoda Crustacea Copepoda copepod
Crangonyx Arthropoda: Crustacea
Amphipoda Crangonyctidae scuds
Hyalella Arthropoda: Crustacea
Amphipoda Hyalellidae scuds
Caecidotea occidentalis Arthropoda: Crustacea
Isopoda Asellidae aquatic sow bugs
Oribatida Arthropoda: Arachnida
Sarcoptiformes aquatic mite
Trombidiformes Arthropoda: Arachnida
Trombidiformes aquatic mite
Sympetrum Arthropoda: Insecta
Odonata Libellulidae skimmer dragonfly
Coenagrion/Enallagma Arthropoda: Insecta
Odonata Coenagrionidae pond damselfly
Ischnura Arthropoda: Insecta
Odonata Coenagrionidae pond damselfly
Lestes Arthropoda: Insecta
Odonata Lestidae spreadwing damselfly
Callibaetis Arthropoda: Ephemeroptera Baetidae small minnow

20
Insecta mayfly
Belostoma Arthropoda: Insecta
Heteroptera Belostomatidae giant water bug
Corixidae Arthropoda: Insecta
Heteroptera Corixidae water boatman
Buenoa Arthropoda: Insecta
Heteroptera Notonectidae backswimmer
Notonecta Arthropoda: Insecta
Heteroptera Notonectidae backswimmer
Microvelia Arthropoda: Insecta
Heteroptera Veliidae shortlegged strider
Lepidostoma Arthropoda: Insecta
Trichoptera Lepidostomatidae casemaking caddisfly
Limnephilus Arthropoda: Insecta
Trichoptera Limnephilidae northern caddisfly
Agabus Arthropoda: Insecta
Coleoptera Dytiscidae predaceous diving beetle
Dytiscus Arthropoda: Insecta
Coleoptera Dytiscidae predaceous diving beetle
Hydroporus Arthropoda: Insecta
Coleoptera Dytiscidae predaceous diving beetle
Hygrotus Arthropoda: Insecta
Coleoptera Dytiscidae predaceous diving beetle
Neoporus Arthropoda: Insecta
Coleoptera Dytiscidae predaceous diving beetle
Rhantus Arthropoda: Insecta
Coleoptera Dytiscidae predaceous diving beetle
Haliplus Arthropoda: Insecta
Coleoptera Haliplidae crawling water beetle
Hydraena Arthropoda: Insecta
Coleoptera Hydraenidae minute moss beetle
Berosus Arthropoda: Insecta
Coleoptera Hydrophilidae water scavenger beetle
Tropisternus Arthropoda: Insecta
Coleoptera Hydrophilidae water scavenger beetle
Elodes Arthropoda: Insecta
Coleoptera Scirtidae marsh beetle
Ceratopogoninae Arthropoda: Insecta
Diptera Ceratopogonidae biting midge
Dasyhelea Arthropoda: Insecta
Diptera Ceratopogonidae biting midge
Chaoborus Arthropoda: Insecta
Diptera Chaoboridae phantom midge
Dixella Arthropoda: Insecta
Diptera Dixidae dixid midge
Ptychoptera Arthropoda: Insecta
Diptera Ptychopteridae phantom crane fly
Sciomyzidae Arthropoda: Insecta
Diptera Sciomyzidae marsh fly
Simulium Arthropoda: Insecta
Diptera Simuliidae black fly
Odontomyia Arthropoda: Insecta
Diptera Stratiomyidae soldier fly
21
Pilaria Arthropoda: Insecta
Diptera Tipulidae crane fly
Chironomidae pupae Arthropoda: Insecta
Diptera Chironomidae nonbiting midge
Ablabesmyia Arthropoda: Insecta
Diptera Chironomidae nonbiting midge
Chironomus Arthropoda: Insecta
Diptera Chironomidae nonbiting midge
Corynoneura Arthropoda: Insecta
Diptera Chironomidae nonbiting midge
Cricotopus Arthropoda: Insecta
Diptera Chironomidae nonbiting midge
Dicrotendipes Arthropoda: Insecta
Diptera Chironomidae nonbiting midge
Limnophyes Arthropoda: Insecta
Diptera Chironomidae nonbiting midge
Metriocnemus Arthropoda: Insecta
Diptera Chironomidae nonbiting midge
Micropsectra Arthropoda: Insecta
Diptera Chironomidae nonbiting midge
Microtendipes Arthropoda: Insecta
Diptera Chironomidae nonbiting midge
Orthocladius Complex Arthropoda: Insecta
Diptera Chironomidae nonbiting midge
Paratanytarsus Arthropoda: Insecta
Diptera Chironomidae nonbiting midge
Paratendipes Arthropoda: Insecta
Diptera Chironomidae nonbiting midge
Procladius Arthropoda: Insecta
Diptera Chironomidae nonbiting midge
Prodiamesa Arthropoda: Insecta
Diptera Chironomidae nonbiting midge
Psectrocladius Arthropoda: Insecta
Diptera Chironomidae nonbiting midge
Pseudochironomus Arthropoda: Insecta
Diptera Chironomidae nonbiting midge
Tanytarsus Arthropoda: Insecta
Diptera Chironomidae nonbiting midge
Tribelos Arthropoda: Insecta
Diptera Chironomidae nonbiting midge