implementing lightning-nox for studies of …
TRANSCRIPT
Implementing Lightning-NOx
Production For Studies Of
Thunderstorms And Chemistry
Mary Barth, Jeff Lee, Alma HodzicNCAR, Boulder, Colorado contact: [email protected]
Acknowledgments:
Ken Pickering, Lesley Ott, Christelle Barthe for early work on implementing the scheme into WRF
Gabriele Pfister, Louisa Emmons, Christine Wiedinmyer for assistance in configuring simulation
1
Motivation
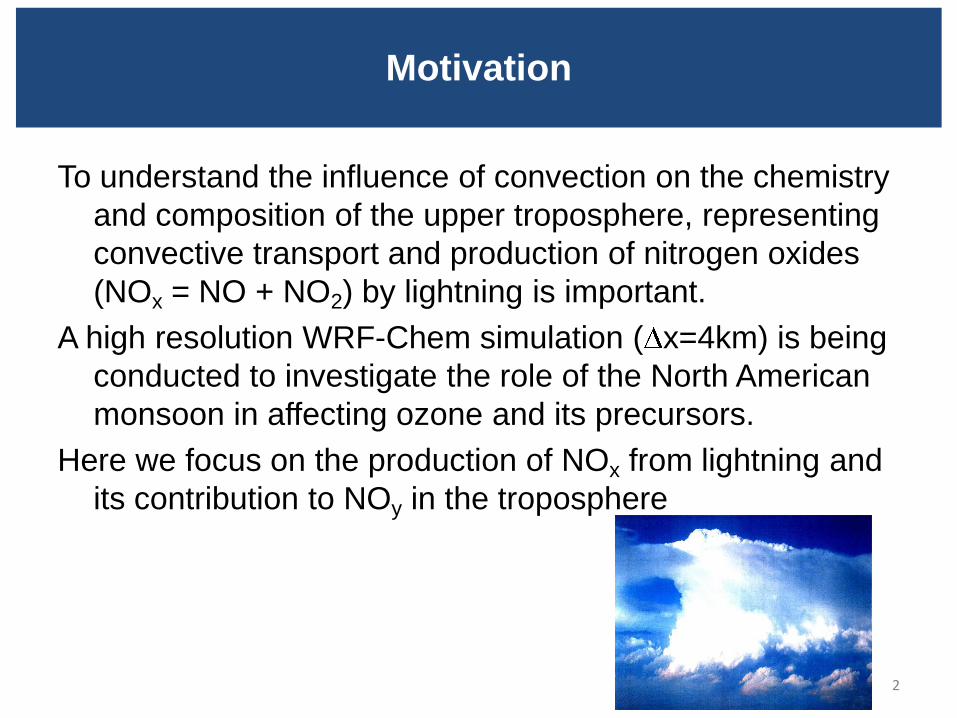
To understand the influence of convection on the chemistry
and composition of the upper troposphere, representing
convective transport and production of nitrogen oxides
(NOx = NO + NO2) by lightning is important.
A high resolution WRF-Chem simulation ( x=4km) is being
conducted to investigate the role of the North American
monsoon in affecting ozone and its precursors.
Here we focus on the production of NOx from lightning and
its contribution to NOy in the troposphere
2
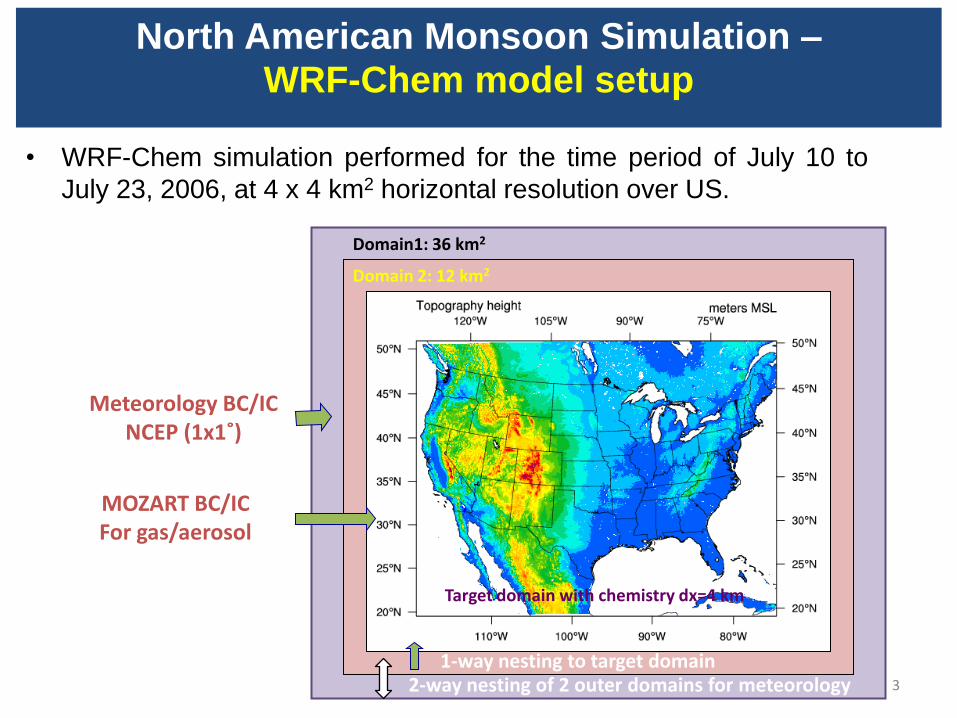
Domain 2: 12 km2
Meteorology BC/IC NCEP (1x1˚)
Target domain with chemistry dx=4 km
Domain1: 36 km2
2-way nesting of 2 outer domains for meteorology1-way nesting to target domain
MOZART BC/IC For gas/aerosol
3
North American Monsoon Simulation –WRF-Chem model setup
• WRF-Chem simulation performed for the time period of July 10 to
July 23, 2006, at 4 x 4 km2 horizontal resolution over US.
Model Description
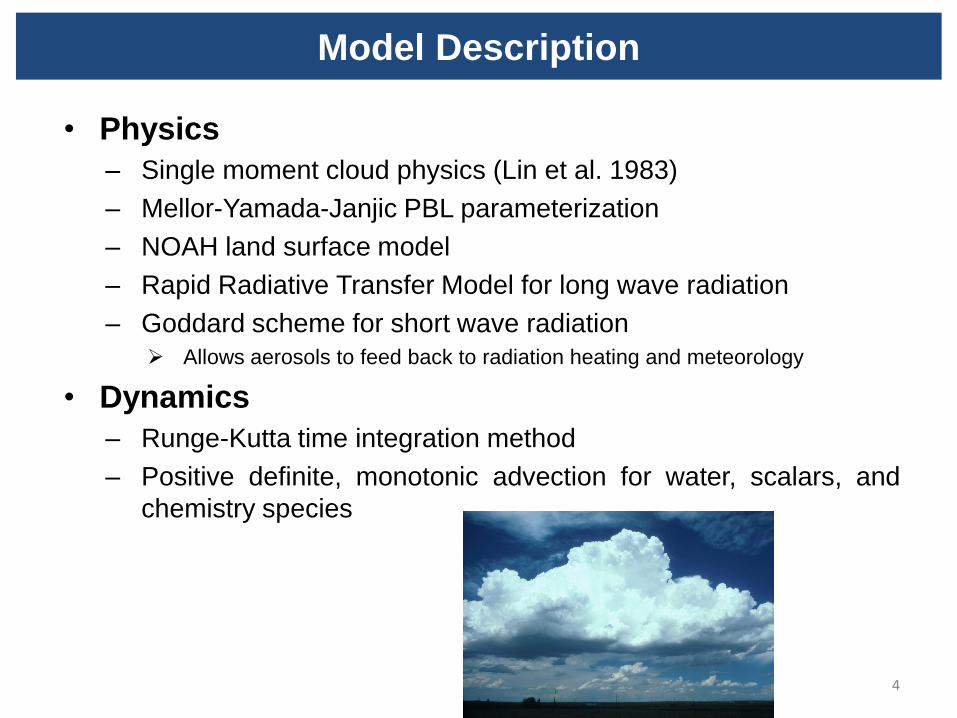
• Physics
– Single moment cloud physics (Lin et al. 1983)
– Mellor-Yamada-Janjic PBL parameterization
– NOAH land surface model
– Rapid Radiative Transfer Model for long wave radiation
– Goddard scheme for short wave radiation
Allows aerosols to feed back to radiation heating and meteorology
• Dynamics
– Runge-Kutta time integration method
– Positive definite, monotonic advection for water, scalars, and
chemistry species
4
Model Description
5
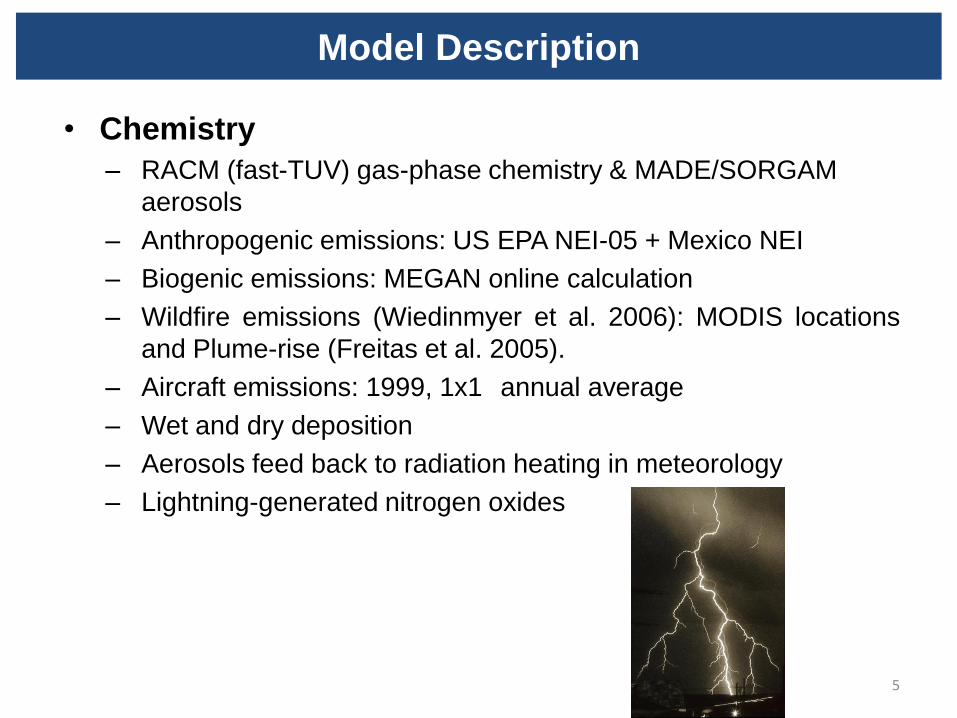
• Chemistry
– RACM (fast-TUV) gas-phase chemistry & MADE/SORGAM
aerosols
– Anthropogenic emissions: US EPA NEI-05 + Mexico NEI
– Biogenic emissions: MEGAN online calculation
– Wildfire emissions (Wiedinmyer et al. 2006): MODIS locations
and Plume-rise (Freitas et al. 2005).
– Aircraft emissions: 1999, 1x1 annual average
– Wet and dry deposition
– Aerosols feed back to radiation heating in meteorology
– Lightning-generated nitrogen oxides
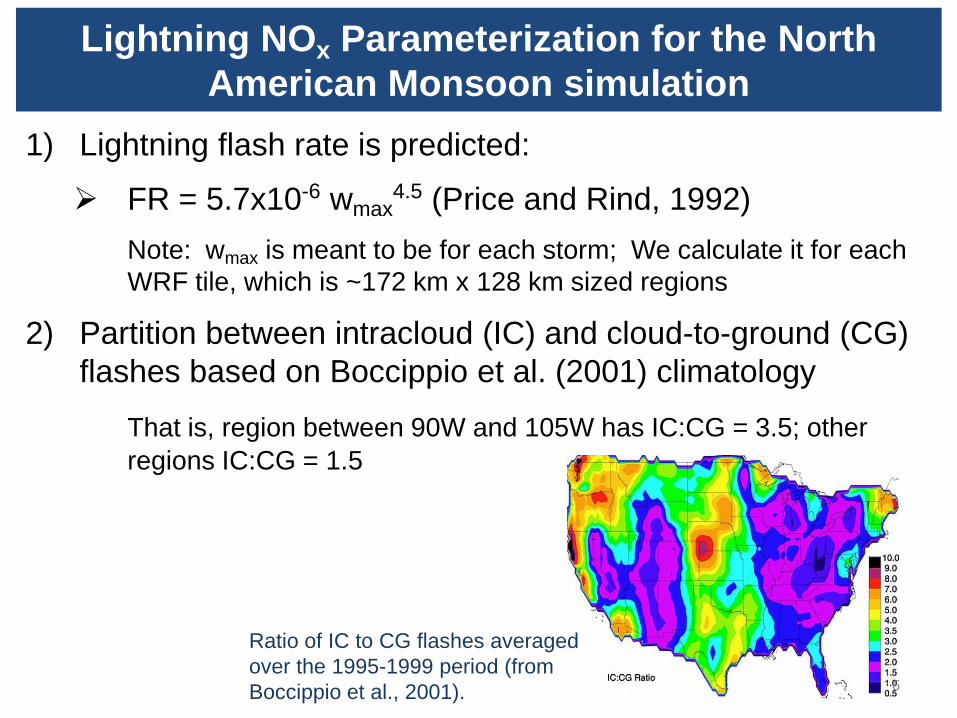
1) Lightning flash rate is predicted:
FR = 5.7x10-6 wmax4.5 (Price and Rind, 1992)
Note: wmax is meant to be for each storm; We calculate it for each
WRF tile, which is ~172 km x 128 km sized regions
2) Partition between intracloud (IC) and cloud-to-ground (CG)
flashes based on Boccippio et al. (2001) climatology
That is, region between 90W and 105W has IC:CG = 3.5; other
regions IC:CG = 1.5
Ratio of IC to CG flashes averaged
over the 1995-1999 period (from
Boccippio et al., 2001). 6
Lightning NOx Parameterization for the North
American Monsoon simulation
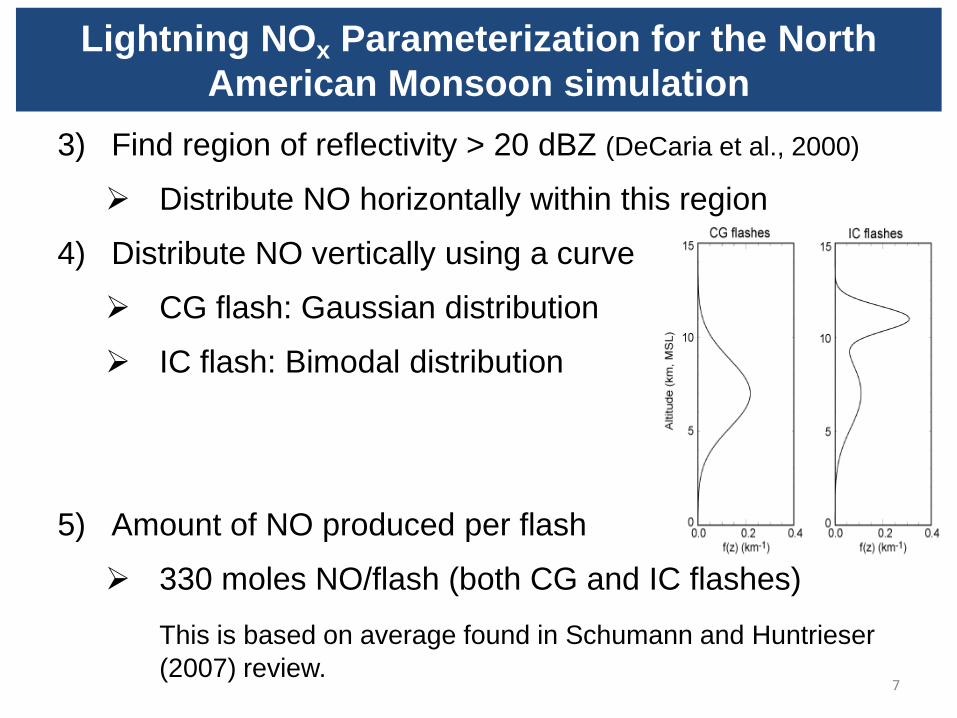
3) Find region of reflectivity > 20 dBZ (DeCaria et al., 2000)
Distribute NO horizontally within this region
4) Distribute NO vertically using a curve
CG flash: Gaussian distribution
IC flash: Bimodal distribution
5) Amount of NO produced per flash
330 moles NO/flash (both CG and IC flashes)
This is based on average found in Schumann and Huntrieser
(2007) review.7
Lightning NOx Parameterization for the North
American Monsoon simulation
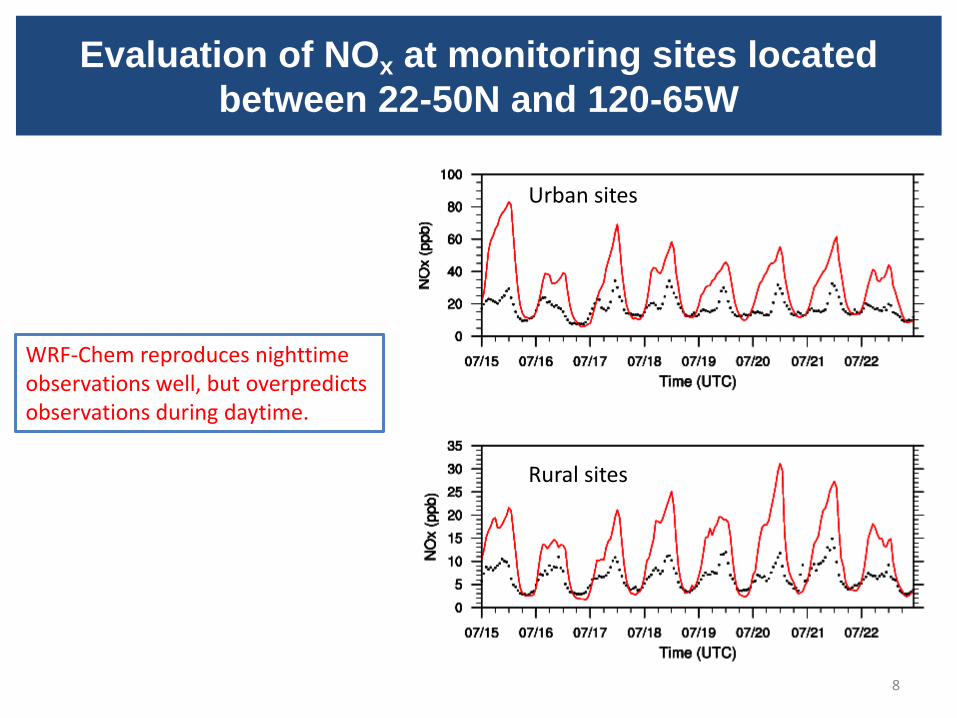
Evaluation of NOx at monitoring sites located
between 22-50N and 120-65W
WRF-Chem reproduces nighttime observations well, but overpredictsobservations during daytime.
Urban sites
Rural sites
8
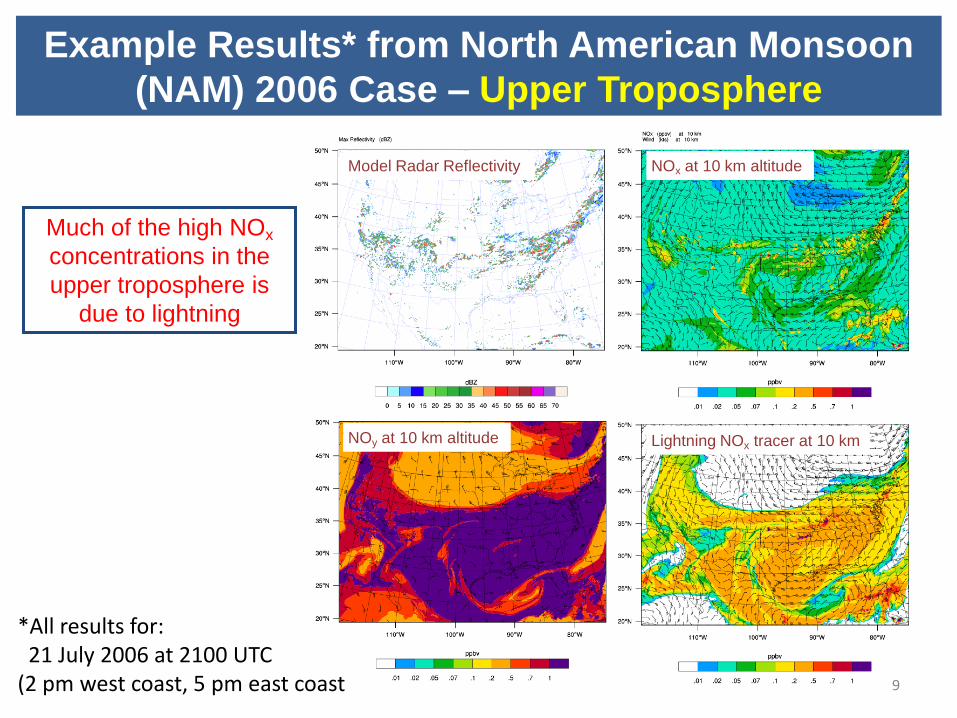
Much of the high NOx
concentrations in the
upper troposphere is
due to lightning
NOy at 10 km altitude Lightning NOx tracer at 10 km
NOx at 10 km altitudeModel Radar Reflectivity
Example Results* from North American Monsoon
(NAM) 2006 Case – Upper Troposphere
*All results for: 21 July 2006 at 2100 UTC
(2 pm west coast, 5 pm east coast 9
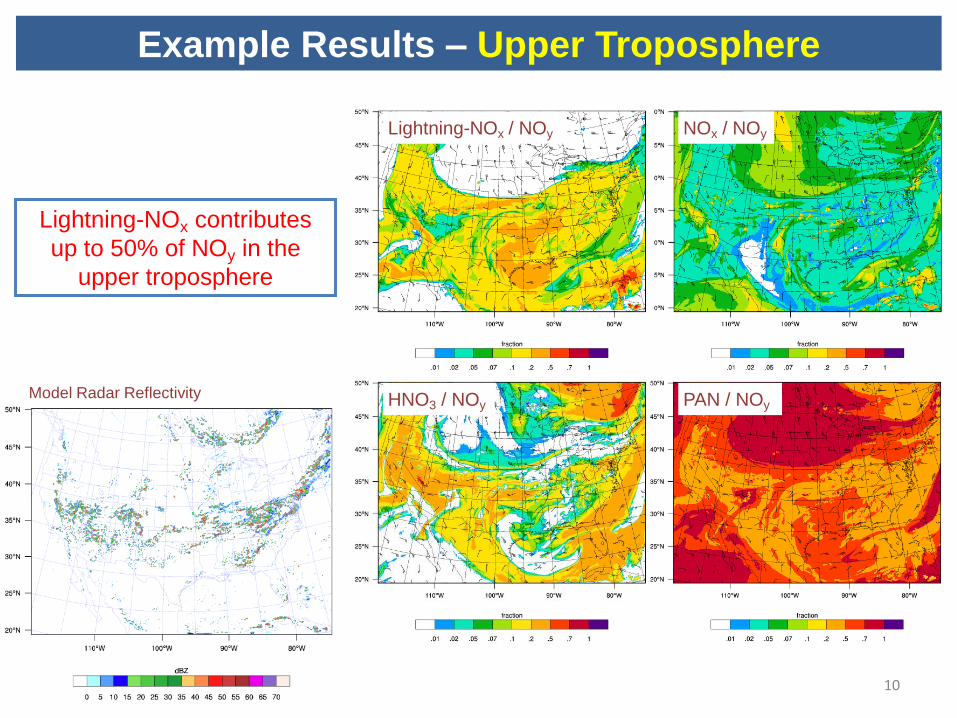
Example Results – Upper Troposphere
Lightning-NOx contributes
up to 50% of NOy in the
upper troposphere
Lightning-NOx / NOy NOx / NOy
HNO3 / NOy PAN / NOyModel Radar Reflectivity
10
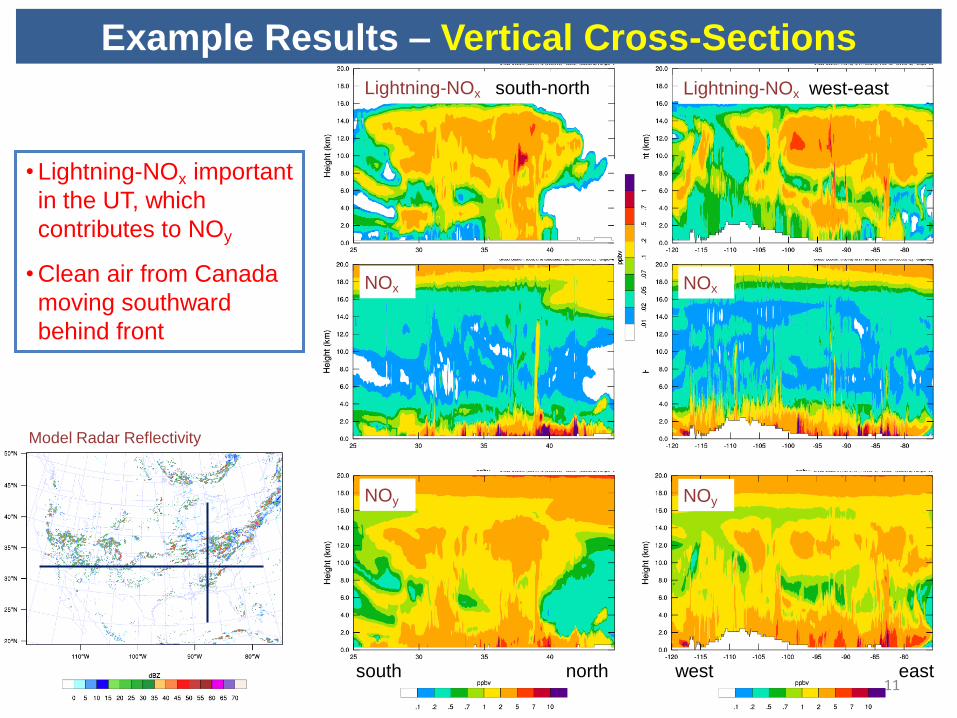
Example Results – Vertical Cross-Sections
•Lightning-NOx important
in the UT, which
contributes to NOy
•Clean air from Canada
moving southward
behind front
Model Radar Reflectivity
Lightning-NOx south-north
NOx
NOy
Lightning-NOx west-east
NOx
NOy
south north west east11
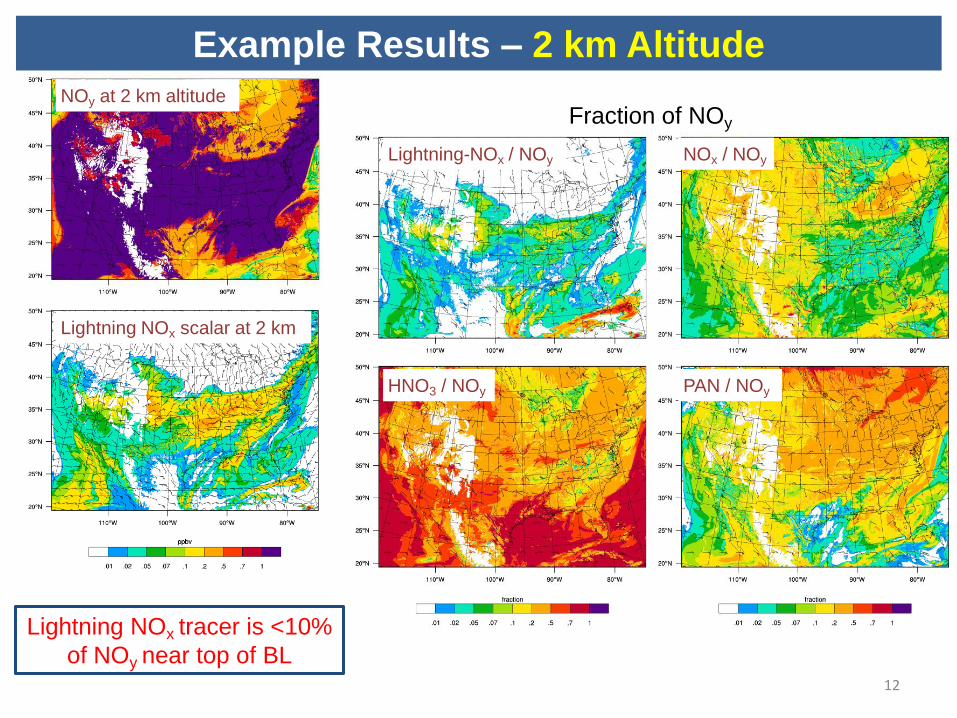
Example Results – 2 km Altitude
New words here
NOy at 2 km altitude
Lightning NOx scalar at 2 km
Lightning-NOx / NOy NOx / NOy
HNO3 / NOy PAN / NOy
Fraction of NOy
Lightning NOx tracer is <10%
of NOy near top of BL12
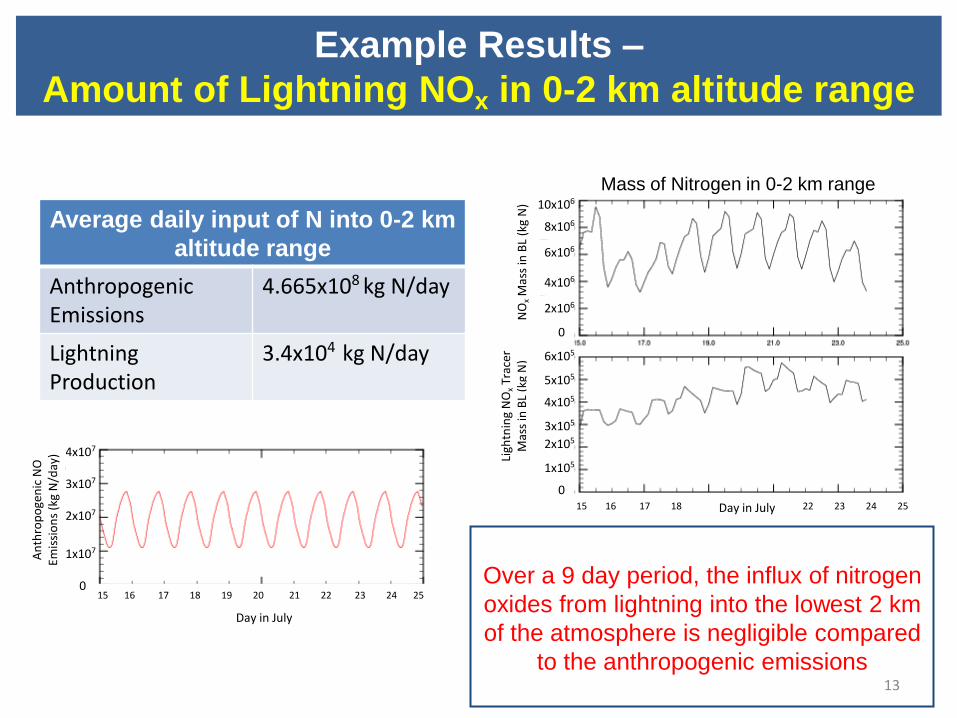
Example Results –
Amount of Lightning NOx in 0-2 km altitude range
Mass of Nitrogen in 0-2 km range10x106
8x10⁶
6x10⁶
4x10⁶
2x10⁶
0
NO
xM
ass
in B
L (k
g N
)Li
ghtn
ing
NO
xTr
acer
M
ass
in B
L (k
g N
)
5x10⁵
4x10⁵
3x10⁵
2x10⁵
1x10⁵
6x10⁵
0
Average daily input of N into 0-2 km
altitude range
Anthropogenic Emissions
4.665x10⁸ kg N/day
Lightning Production
3.4x10⁴ kg N/day
Over a 9 day period, the influx of nitrogen
oxides from lightning into the lowest 2 km
of the atmosphere is negligible compared
to the anthropogenic emissions
3x10⁷
2x10⁷
1x10⁷
4x10⁷
0
An
thro
po
gen
ic N
O
Emis
sio
ns
(kg
N/d
ay)
Day in July
15 16 17 18 19 20 21 22 23 24 25
15 16 17 18 22 23 24 25Day in July
13
Summary
• Production of NOx from lightning is now included in
WRF-Chem for cloud resolving scales
• The Lightning NOx primarily affects the upper
troposphere – this is in agreement with Kaynak et al.
(2008) ACP who found that the impact of lightning NOx
on surface O3 was small (<2 ppbv for 71% of cases)
14