implementing real time recommendation systems using graph
TRANSCRIPT

1
Implementing Real Time Recommendation Systems using
Graph Algorithms & Exploring Graph Analytics in a
Graph Database Platform (Neo4j)
Dissertation submitted in part fulfilment of the requirements
for the degree of
Master of Science in Data Analytics
at Dublin Business School
Amit Kumar
Master of Science in Data Analytics 2018-2019

2
Declaration
I, Amit Kumar, declare that this research is my original work and that it has never
been presented to any institution or university for the award of Degree or Diploma.
In addition, I have referenced correctly all literature and sources used in this work
and this work is fully compliant with the Dublin Business School’s academic
honesty policy.
Signature: Amit Kumar
Date: 07/01/2019

3
Acknowledgements
First and foremost, I would like to offer my sincere gratitude to my Dissertation
Supervisor Prof. Terri Hoare of MSc in Data Analytics course at the Dublin Business
School. Prof. Terri Hoare was always open to help me whenever I was in trouble or
had questions about my research or writing. She consistently ensured that my
Masters research paper was unique and my own work. She also corrected me at times
when she felt any problems or issues in my research artefact or writing. She was
always open for any type of discussions regarding the research. Every meeting with
her was a great learning experience since she asked me to try and do investigation
on a lot of options in the areas which were very new for me. She was always
reachable by her mobile phone or e-mail. As Prof. Terri Hoare was lecturer for the
Data Mining subject and my research was in the same field, I learned a lot from her
lectures and followed her suggestions during the Dissertation.
Also, I would like to thank Amy Hodler, AI and Analytics Program Manager at
Neo4j, for providing the use cases for my research. She provided her support
throughout the dissertation phase. It gave me the opportunity to work on complex
and challenging tasks which was a great learning process for me.
Next, I would also like to thank the Research Methodology Professor, Dr. Shahram
Sazi Azizi, who is the lecturer for Statistics and Research Methods for Masters
Degree at Dublin Business School for providing the necessary knowledge on how to
carry the Research work from start to the end and what all factors to be considered
while doing the research and writing Dissertation. Also, I would like to thank Dr.
Alan Graham, Professor at Dublin Business School, for giving lectures on Writing
for Graduate Studies in the course, which helped me to improve my academic
writing and Mr. Trevor Haugh, Assistant Librarian at Dublin Business School for
providing lectures and guidance on Referencing.
Finally, I thank my parents for supporting me throughout my studies. I also like to
thank my brother, my sister-in-law, my wife and my daughter for supporting and
encouraging me to perform well in studies as well in the process of Dissertation. At
last, I am grateful to the God for the good health and well-being that were necessary
to complete this dissertation.
Thank you.
Amit Kumar

4
Abstract
Recommendation Systems play a very important role in our lives in the modern era.
With the advent of Big Data in recent years, an enormous amount of information (in
both structured and un structured data formats) is being generated every second from
various data sources. Recommendation Systems are very helpful for generating
meaningful insights from massive amounts of data. Slower batch approaches are
enhanced by real time recommendations enabled by storing data in a graph database
platform. This dissertation aims to build and implement a real time recommendation
system using different graph algorithms in Neo4j, the current leader in graph
operational database management systems. The requirements or use cases for this
research were proposed by the AI and Analytics Team of Neo4j, for their ongoing
research and development activities. Various research papers were studied to get an
overview of various graph algorithms currently used in recommendation systems in
graph databases. A customized graph data model was implemented to provide
solutions for the research questions. Cypher, the Neo4j query language was used to
implement a selection of recommendation graph algorithms on this data model. The
graph algorithms used were Overlap Similarity, Cosine Similarity and PageRank.
For providing a comparison between traditional and graph databases, FP-Growth, a
traditional Association Rule Algorithm, was implemented using Rapid Miner, a
leading Data Mining Tool, showcasing a particular use case using a traditional
approach. A Python Script was developed to prepare the data for loading to the
customized graph data model. Also, a data profiling or statistical analysis was
performed on the loaded data providing a thorough analysis of the structure, contents
and meta data of the loaded data. Graph analytics were only been introduced for an
operational graph database management system in the fourth quarter of 2017. The
results obtained from this research highlight the enormous potential for real time
recommendations using the algorithms of a graph database platform like Neo4j.
Keywords: graph databases, graph algorithms, overlap similarity, cosine similarity,
pagerank, neo4j, fp-growth, recommendation systems, python, cypher, rapid miner,
association rules, graph data model, real time
5
Contents
List of Tables……………………………………………………………………….8
List of Figures………………………………………………………………………8
Chapter One……………………………………………………………………….10
1.1 Introduction…………………………………………………………………...10
1.2 Roadmap for the Dissertation…………………………………………………12
1.3 Scope and limitations of research……………………………………………..14
1.4 Major Contributions for the study…………………………………………….15
Chapter Two………………………………………………………………………16
Literature Review…………………………………………………………………16
2.1 Introduction…………………………………………………………………...16
2.2 Background and Context of Research………………………………………...16
2.2.1 History of Graph Databases…………………………………………………16
2.2.2 Overview of Graph Databases………………………………………………17
2.2.3 Overview of different types of NoSQL databases…………………………..18
2.2.4 Overview of Neo4j as Graph Database……………………………………..19
2.2.5 Comparison between RDBMS and Graph Databases (Neo4j) ……………..22
2.2.6 Overview of Recommendation Systems…………………………………….22
2.2.7 Overview of Previous Research Papers……………………………………..23
2.2.8 Overview of Graph Algorithms Used in Neo4j……………………………..29
2.2.9 Overview of Association Rules – FP-Growth………………………………32
Chapter Three……………………………………………………………………..35
Methodology………………………………………………………………………35
3.1 Introduction…………………………………………………………………...35

6
3.2 Research Strategy……………………………………………………………..35
3.3 Research Methodology………………………………………………………..35
3.4 Data Collection Method……………………………………………………….37
3.5 Data Sampling………………………………………………………………...38
3.6 Methodological Assumptions…………………………………………………38
3.7 Research Methods…………………………………………………………….38
3.8 Research Architecture and Design……………………………………………39
3.9 Conclusion…………………………………………………………………….39
Chapter Four………………………………………………………………………40
Artifact Design and Development………………………………………………...40
4.1 Introduction…………………………………………………………………...40
4.2 Business Case Overview……………………………………………………...40
4.3 Data Set Description………………………………………………………….40
4.4 Software, Programming Languages and Tools Used………………………....43
4.5 Building of the Graph Data Model……………………………………………43
4.6 Use Cases Development Process Overview…………………………………..45
4.7 Conclusion…………………………………………………………………….46
Chapter Five………………………………………………………………………47
Proposed Solutions & Findings / Data Analysis………………………………….47
5.1 Introduction…………………………………………………………………...47
5.2 Proposed Solutions & Findings / Data Analysis……………………………...47
5.2.1 Business Scenario 1 for Use Case 1………………………………………..48
5.2.2 Business Scenario 2 for Use Case 1………………………………………..50
5.2.3 Business Scenario 3 for Use Case 1………………………………………..52
5.2.4 Business Scenario 4 for Use Case 1………………………………………...54

7
5.2.5 Business Scenario 1 for Use Case 2………………………………………...56
5.2.6 Business Scenario 2 for Use Case 2………………………………………...58
5.2.7 Business Scenario 3 for Use Case 2………………………………………...60
5.3 Data Profiling or Statistical Analysis for Graph Database (Neo4j) …………..61
5.4 Conclusion…………………………………………………………………….70
Chapter Six………………………………………………………………………..71
Discussion…………………………………………………………………………72
Chapter Seven……………………………………………………………………..73
Conclusions and Recommendations………………………………………………73
Bibliography………………………………………………………………………74
Appendices………………………………………………………………………..77
Appendix A……………………………………………………………………….77
Appendix B……………………………………………………………………….83
Appendix C……………………………………………………………………….93
Appendix D………………………………………………………………………97
Appendix E………………………………………………………………………100
Appendix F………………………………………………………………………104
Appendix G………………………………………………………………………106
Appendix H………………………………………………………………………109
Appendix I……………………………………………………………………….111
Appendix J……………………………………………………………………….116
Appendix K………………………………………………………………………131
Glossary of terms………………………………………………………………...134

8
List of Tables
Table 4.3.1: Structure of business.json……………………………………………41
Table 4.3.2: Structure of review.json……………………………………………..41
Table 4.3.3: Structure of user.json………………………………………………..42
List of Figures
Figure 2.2.4.1: Neo4j Desktop Interface………………………………………….20
Figure 2.2.4.2: Neo4j Desktop Starting the Server……………………………….20
Figure 2.2.4.3: Neo4j Desktop Plugins Installation………………………………21
Figure 2.2.4.4: Neo4j Desktop Web Browser Interface for writing and executing
Cypher Queries……………………………………………………………………21
Figure 3.3.1: Phases of CRISM-DM Reference Model. (Shearer, 2000, p. 14) …36
Figure 3.8.1: Architecture Design Diagram of the Research……………………..39
Figure 4.5.1: Graph Data Model Build from Yelp Dataset for the research……...44
Figure 4.6.1: Neo4j Desktop Configuration Settings…………………………......45
Figure 5.2.1.1: Cypher Code for First Use Case (Scenario 1) ……………………48
Figure 5.2.1.2: Output for First Use Case (Scenario 1) …………………………..49
Figure 5.2.2.1: Cypher Code for First Use Case (Scenario 2) ……………………50
Figure 5.2.2.2: Output for First Use Case (Scenario 2) …………………………..51
Figure 5.2.3.1: Cypher Code for First Use Case (Scenario 3) ……………………52
Figure 5.3.2.2: Output for First Use Case (Scenario 3) …………………………..53
Figure 5.2.4.1: Cypher Code for First Use Case (Scenario 4……………………..54
Figure 5.2.4.2: Output for First Use Case (Scenario 4) …………………………..55
Figure 5.2.5.1: Cypher Code for Second Use Case (Scenario 1) ………………...56
Figure 5.2.5.2: Output for Second Use Case (Scenario 1) ……………………….57

9
Figure 5.2.6.1: Cypher Code for Second Use Case (Scenario 2) ………………...58
Figure 5.2.6.2: Output for Second Use Case (Scenario 2) ……………………….59
Figure 5.2.7.1: Cypher Code for Second Use Case (Scenario 3) ………………...60
Figure 5.2.7.2: Output for Second Use Case (Scenario 3) ……………………….61

10
Chapter One
1.1 Introduction
In the recent couple of years, we have seen there had been large inventions and
innovations going on in the field of Data Science or Data Analytics platform, due to
sudden overload of information which gets generated from various data sources.
This data overload is sometimes referred as “Big Data”. For doing processing,
manipulation and management of Big Data, we have lots of databases. Databases
can be broadly divided into two categories namely Relational Databases (RDBMS)
and Non-Relational or NoSQL Databases. It is observed that RDBMS is not suitable
for handling Big Data as compared with NoSQL databases since RDBMS has some
serious constraints to process Big Data. Recently in last some years, under NoSQL
databases, Graph Databases have emerged as one of the key databases for storing
data which contains data with relationships. Since the advent of social networking
websites like Facebook, LinkedIn, Instagram and E-commerce websites like
Amazon, eBay, Walmart, Flipkart, Snapdeal, etc., graph databases have become the
industry standard. “Graph databases are a powerful optimized technology that link
billions of pieces of connected data to help create new sources of value for customers
and increase operational agility for customer service. After all, customers are people
– and people are shaped by their relationships. Because graph databases track
connections among entities and offer links to get more detailed information, they are
well-suited for scenarios in which relationships are important, such as cybersecurity,
social network analysis, eCommerce recommendations, dependence analysis, and
predictive analytics” (Forrester May 28, 2015). As per the recent Gartner & Forrester
Report 2018, almost 70 percent of the companies worldwide are either moved to or
planning to move to Graph databases.
Under the Graph Platform being built for Graph Databases, Graph analytics
uncovers the essence of real-world networks through their connections. Businesses
use these insights to model processes and make valuable predictions about how
things such as information or failures spread; the flow and capacity to transport
resources; and influences on group dynamics and resiliency. Forecasting complex
network behavior and appropriately prescribing action, is immensely valuable for
breakthroughs across science and business as well as a safeguard against
vulnerabilities. In general, graph analytics plays a very vital and important role for
revealing hidden meaning to drive discovery for new information. (‘Graph and
Machine Learning Algorithms’, no date)
11
In the recent years, real time recommendation systems have gained massive
popularity and importance. In the e-commerce domain, the users or customers wants
to get relevant suggestions and recommendations for the different products they wish
to buy. Real time recommendation systems provide the users with all the necessary
information. These systems help in finding and generating the personal interests of
every user logged into their system.
Research Questions
Research Question primarily focuses on how to build the real time recommendation
systems in Graph database by implementing different graph algorithms. The Graph
database to be used in this research would be Neo4j which is one of the largest used
graph databases currently and is considered as the leader in Graph Analytics domain.
The requirements which are the research questions for this research are given by the
AI & Analytics team of Neo4j for their ongoing research, training and development
activities.
The two use cases or requirements given by Neo4j are as follows:
1) Making group recommendations for a "night out" with multiple activities that
could encompass multiple friends/spouse/dietary preferences etc.
2) Evaluating whether some businesses have ripple effects for an area. For
example, do certain types of businesses (or particular ones) tend to bring in
other business. Which ones are critical to the overall economic health of a
region?
Research Objectives
Research Objective focusses to find the most feasible solution for the above two
requirements by using the hidden power of Neo4j which acts as a Graph Database
and Cypher Query Language which acts as the query language for Neo4j. I would
be leveraging different Graph Algorithms in my research for building real time
recommendation system on actual real time use cases given by Neo4j. I would
further be doing deep dive analysis into the area of graph analytics by providing
comprehensive and detailed statistics on graph database.

12
Hypothesis to be tested
The main hypothesis to be tested is that by using the graph algorithms available
recently on Graph database platforms (Neo4j), we can build real time
recommendation systems that are scalable, robust, non-memory constrained and
easily deployed on current versions of cloud environments/infrastructures. In effect,
these implementations can be applied in Big Data environments.
I have chosen the above research topic since I am very much interested in the domain
of Graph database (Neo4j) and I wanted to experiment on the various graph
algorithms for building the real time recommendation systems currently used
extensively across industries. I found this topic very exciting in my taught masters
semesters and hence wanted to develop a specialized focus in this area.
Conclusion
I want to conclude by saying that I have explained the research questions, research
objectives, hypothesis to be tested and the reasons for choosing the relevant topic
for my research.
1.2 Roadmap for the Dissertation
The Dissertation is categorized into various chapters as described below.
Chapter two contains the literature review as given below:
Literature theme one describes the history of graph databases. Under this section,
the evolution of the graph databases is discussed.
Literature theme two describes an overview of the graph databases. It includes the
inner working, architecture and importance of the graph database.
Literature theme three describes an overview of different types of NoSQL databases.
Under this section, four major types of NoSQL databases which are popular today
are explained namely Key-Values Stores, Document Databases, Column Family
Stores and Graph Databases.
Literature theme four describes an overview of Neo4j as Graph Database. It includes
the basic architecture for nodes and relationships that needs to be created in Neo4j.
The use of Cypher query language is explained which helps in writing the database
queries in Neo4j. Additionally, it shows the Neo4j Desktop Interface and the Neo4j
Web Browser Interface.

13
Literature theme five describes the comparison between RDBMS and Graph
Databases (Neo4j). Under this section, the traditional relational database is
compared with graph database. The advantages and disadvantages for both types of
databases is explained.
Literature theme six describes an overview of Recommendation Systems. It includes
the importance and the areas in which recommendation systems plays a key role.
Literature theme seven describes an overview of the previous research papers. Under
this section, the study of various research papers was carried out which suggested
the various graph algorithms that had been implemented in the graph database
(especially Neo4j) for building a real time recommendation system. Also, algorithms
developed for graph database in general for recommendations, were also studied.
Every research paper used some model and approach for development, which was
very informative.
Literature theme eight describes an overview of the Graph Algorithms used in
Neo4j. Under this section, the details of three graph algorithms namely PageRank,
Overlap Similarity and Cosine Similarity are mentioned. These algorithms were
implemented as part of the research work completed.
Literature theme nine describes an overview of the Association Rules namely FP-
Growth. It includes the description for association rules and FP-Growth (Frequent
Pattern-Growth) which comes under the category of Unsupervised Learning. FP-
Growth is implemented using named Rapid Miner, a leading Data Mining Tool. This
is done to show the difference between the traditional approach and graph approach,
in the scenario that data analysis can be done on a tree structure for both.
Chapter three contains the research methodology and methods in which I had
explained how I have chosen the research hypothesis, research strategy, data
collection method, data sampling, methodological assumptions and research
architecture and design.
Chapter four contains artifact design and development. It includes details for
business case overview, data set description, software, programming languages and
tools used, building of the graph model and use case development process overview.
Chapter five contains data analysis and findings from the research. It includes the
proposed solutions for both the use cases or requirements given by Neo4j. Different
scenarios for each use case with a detailed analysis on the cypher queries and
output/results are explained. Also, an overview of data profiling or statistical
14
analysis for the Yelp dataset in graph database (Neo4j) is provided, which gives
thorough analysis of the structure, contents and meta data of the data source.
Chapter six contains the in-depth discussion of the research. It shows the objectives
of the research and how those objectives were completed with the help of adopted
research methodology and methods. It also details the various limitations and
proposes areas for future research.
Chapter seven contains the summarization of the artifact design and development
process. It also provides some recommendations for the future for this research.
1.3 Scope and limitations of research
The scope of the research can be described using following points:
• To design the Graph Model for the different use cases that need to be
implemented in Neo4j using Cypher Query Language.
• To load the relative file format (csv or json) into Neo4j.
• To create the nodes and relationships & add then into Neo4j using Cypher
Query Language.
• To find the proposed solutions for the research questions.
• To implement different graph algorithms in Neo4j using Cypher Query
Language for building recommendation systems.
• To write Python Script which converts JSON file into CSV file format which
could be used in Neo4j for data loading.
• To provide Statistics or Data Profiling on Neo4j for the dataset by leveraging
graph analytics.
The limitation of the research can be described using following points:
• Due to memory constraints on own laptop (4 GB RAM) and DBS OpenStack
(8 GB RAM), realistic development and testing was performed on sampled
data.
• Cloud Environments were investigated and would be a logical step for future
research.
15
1.4 Major Contributions for the study
My research will provide a foundation for the future masters students who want to
do research in the area of Graph Database (Neo4j) and Graph Analytics. I have
implemented a graph data model and associated graph algorithms for building a real
time recommendation system for the different business use cases proposed by Neo4j.
This research area falls under the category of newly evolving technologies since
Graph algorithms were launched by Neo4j only a year ago. In my literature review,
I found very few implementations on Graph algorithms in Neo4j. Hence, my
research would be very valuable for any industry, domain or business area that has
either moved to or is planning to move to a Graph database platform (Neo4j). In a
world of networked data, the use of graph databases and associated graph analytics
will become increasingly important. In addition, real time recommendations will
become increasingly important in a fast paced and continuously changing world.

16
Chapter Two
Literature Review
2.1 Introduction
In the literature review, I would be doing a comprehensive literature review on some
of the important research papers being published for Yelp dataset and other online
sources. Based on this previous literature review, I would like to propose the
solutions for the two use cases or requirements given by Neo4j.
The following section will provide the history of graph databases, an overview of
different types of NoSQL databases, overview of Neo4j as Graph Database,
Comparison between Relational Data Base Management Systems (RDBMS) and
Graph Databases and lastly an overview of previous research papers written for
YELP Open Source Dataset and other online sources which had built a real time
recommendation system using graph databases with the implementation of any
graph algorithms or any other algorithms/methods/techniques, that had been applied
to any of the industries or domains in the past couple of years. Also, research papers
specific to graph database are studied to get an overall general idea that would help
in my research process.
2.2 Background and Context of Research
2.2.1 History of Graph Databases
The evolution of graph database started in the mid-1960s when Navigational
databases like IBM’s IMS supported tree-like structures in its hierarchical model,
but the strict tree structure could be circumvented with virtual records. (‘Graph
database’, 2018)
In the late 1960s, structures for graphs could be represented in network model
databases. CODASYL, which had created COBOL in 1959, defined the Network
Database Language in 1969. (‘Graph database’, 2018)
In the mid-1980s, labeled graphs could be represented in graph database like creating
a Logical Data Model. (‘Graph database’, 2018)
Major enhancements in graph databases happened in the early 1990s which further
progressed in the late 1990s with options to index the web pages. (‘Graph database’,
2018)

17
In the mid-late 2000s, graph databases like Neo4j and Oracle Spatial and Graph were
introduced with the features of Atomicity, Consistency, Isolation and Durability
(ACID). (‘Graph database’, 2018)
In the 2010s, the graph databases which were commercial and contains ACID
capabilities and that could be scaled horizontally were introduced. Additionally,
SAP HANA introduced in-memory and columnar technologies to graph databases.
Also, in the 2010s, multi-model databases which supported graph models (and other
models such as relational database or document-oriented database) were introduced,
such as OrientDB, ArangoDB and MarkLogic. By this time, different types of graph
databases have become popular, which were providing a lot of features, especially
in the domain for social network analysis since a lot of social media companies came
into existence which were using graph databases. (‘Graph database’, 2018)
2.2.2 Overview of Graph Databases
In simple terms, a graph database is a database designed to treat the relationships
between data as equally important to the data itself. It is intended to hold data without
constricting it to a pre-defined model. Instead, the data is stored like we first draw it
out – showing how each individual entity connects with or is related to others.
(‘What is a Graph Database?’, no date)
We live in a connected world! There are no isolated pieces of information, but rich,
connected domains all around us. Only a database that natively embraces
relationships can store, process, and query connections efficiently. While other
databases compute relationships at query time through expensive JOIN operations,
a graph database stores connection alongside the data in the model. (‘What is a Graph
Database?’, no date)
Accessing nodes and relationships in a native graph database is an efficient,
constant-time operation and allows you to quickly traverse millions of connections
per second per core. (‘What is a Graph Database?’, no date)
Independent of the total size of your dataset, graph databases excel at managing
highly-connected data and complex queries. With only a pattern and a set of starting
points, graph databases explore the neighboring data around those initial starting
points — collecting and aggregating information from millions of nodes and
relationships — and leaving any data outside the search perimeter untouched.
(‘What is a Graph Database?’, no date)

18
2.2.3 Overview of different types of NoSQL databases
NoSQL (also termed as Not Only SQL) is a general term which comprises different
databases and data stores that do not follow the Relational Data Base Management
Systems (RDBMS) model for data storage and are used to store any type of
unstructured or semi-structured data of any format. NoSQL databases are used for
handling and processing for massive amount of data, where the data sets could be in
millions or even billions. These types of databases provide the required performance,
scalability to expand, extremely robust and flexibility for any type of modern
applications used in organizations. Also, the processing time taken by the query to
fetch the results is also less as compared to relational data model. (Škrášek, 2015,
pp. 9)
There are broadly four categories of NoSQL databases as explained below:
Key-Values Stores
Key-Values Stores is considered as one of the simplest forms of NoSQL databases.
The main objective is to make the data available in a very quick fashion by accessing
the data with their unique key. There is no schema created for the data which is
stored. The data is stored in the format of attribute name or key together with its
corresponding value. The well-known databases which fall under this category are
Redis, RocksDB (by Facebook), Riak, Amazon SimpleDB and Oracle BDB. The
practical use cases for key-values stores are caching of contents and storage of logs.
(Škrášek, 2015, pp. 10)
Document Databases
Document databases does the pairing for each key with the complex data structure
called document. The documents can contain many different key-value pairs or even
the nested documents. The stored values do not follow any strict schema structure.
In JSON format, the documents (or values) are usually stored. The well-known
databases which fall under this category are CouchDB and MongoDB. The practical
use cases for Document Databases is data storage for any type of web applications.
(Škrášek, 2015, pp. 10)
Column Family Stores
Column Family Stores (also called Wide-column stores) are used to store and do
processing for very huge amounts of data, which are horizontally distributed across
multiple machines. The data is stored in the form of tuples, where the mapping of a
19
key is done to a corresponding value that represents a set of columns. Further, each
and every column contains a column name, a value and a timestamp. The well-
known databases which fall under this category are Cassandra (by Facebook) and
Apache HBase (Hadoop database). (Škrášek, 2015, pp. 10)
Graph Databases
Graph databases provides a graph model which is totally flexible, robust and capable
to scale up across multiple machines. The graph model designed basically works on
the nodes which are connected through different relationships. Different types of
applications which come under Graph Databases are Social Networking and
Recommendations, Security and Access Control, Network and Cloud Management,
Master Data Management and Bioinformatics. The well-known databases which fall
under this category are Neo4j, InfoGrid, Infinite Graph, Apache Giraph, DEX and
OrientDB. (Škrášek, 2015, pp. 10)
2.2.4 Overview of Neo4j as Graph Database
Neo4j is a graph database which follows NoSQL principles such as flexible schema
and scaling support. Neo4j provides ACID transactions reliability, which is not a
common feature for any NoSQL databases. It is multi-relational and works on the
Property Graph Model. Under this model, we have nodes, relationships and
properties. It comes with its own declarative query language named as Cypher and
is written using the Java language. It provides a browser interface so that querying
can be done using Cypher. After running of any Cypher query, the results are
returned in the form of graph visualizations in the interface. The results of the query
can also be shown in tabular format. The main disadvantage of graph visualization
is that it is limited to 300 nodes with their relationships as per the current version of
Neo4j. We can also save all the Cypher queries as Favorites for future use. I have
chosen Neo4j for my research since it provides many capabilities that the traditional
relational databases cannot provide. (Škrášek, 2015, pp. 10)

20
FIGURE 2.2.4.1: NEO4J DESKTOP INTERFACE.
FIGURE 2.2.4.2: NEO4J DESKTOP STARTING THE SERVER.

21
FIGURE 2.2.4.3: NEO4J DESKTOP PLUGINS INSTALLATION.
FIGURE 2.2.4.4: NEO4J DESKTOP WEB BROWSER INTERFACE FOR WRITING AND EXECUTING CYPHER
QUERIES.

22
2.2.5 Comparison between RDBMS and Graph Databases (Neo4j)
In Relational Data Base Management System, data is stored using highly structured
format in tables with predetermined columns of specific types and many rows of
those defined type of information. The tables in the database are linked through
Primary Key – Foreign Key Relationships. On the other hand, in the case of Graph
Databases, data storage is highly unstructured. It is having various nodes which are
connected by meaningful relationships.
In relational database, we have the concept of Entity-Relationship Model whereas in
graph database, we have a Graph Data Model.
In relational database, the storage capacity is limited whereas in graph database, we
can store any amount of data.
In relational database, the performance of queries degrades with increase of multiple
JOIN statements whereas in graph database, the query performance is always very
fast due to index free adjacency.
In relational database, we have SQL as the query language whereas in graph
database, we have Cypher as the query language for Neo4j.
In relational database, index scanning is done to look up rows in tables and join them
with rows from other tables whereas in graph database, it uses indexes to find the
starting points for a query.
In relational database, intuitiveness, speed and flexibility is less as compared to
graph database.
After analyzing the above comparison, I can conclude that Neo4j as a graph database
outperforms the relational database on many points, thus making an ideal choice for
my implementation in this research.
2.2.6 Overview of Recommendation Systems
In the recent years, due to the sudden increase in the volume of data which gets
generated from various data sources, it has become very difficult for the user to
choose the best choice from a huge list of options. To find a feasible solution,
recommendation systems played a very important role. Recommendation systems
are systems designed to make user experience better in the context of choosing a
possibility or option. Their goal is to generate meaningful recommendations to
groups of users. (Škrášek, 2015, pp. 2)

23
The recommendation systems are utilized in a variety of areas including movies,
music, news, books, research articles, search queries, social tags, and products in
general. There are also recommendation systems for experts, collaborators, jokes,
restaurants, garments, financial services, life insurance, romantic partners (online
dating) and twitter pages. (‘Recommender System’, no date)
In general, recommender systems may be categorized into three basic areas:
collaborative filtering, content-based filtering, and knowledge-based filtering.
Collaborative filtering (CF) is a recommendation technique that tries to predict
ratings of unrated items and then choose items with the highest predicted ratings. CF
recognizes two basic attitudes: finding the nearest neighbors and model-based
technique which utilizes latent factors and matrix factorization. Collaborative
filtering can be done as a use case for user–user or item–item filtering. (Škrášek,
2015, pp. 3)
Content-based recommendations are based on a comparison of the items’ attributes.
This recommender system depends on users’ preferences or reuse attributes of the
current item to recommend similar items. These recommendations are usually
obvious and not unexpected - recommended items are similar. However, content-
based recommendations could also bring unexpected results since some attributes
may not be obvious but still essential for the recommender system. Content-based
algorithms mainly use manually created item annotations and attributes, but it is also
possible to use some automatic techniques (for instance color detection, etc.).
(Škrášek, 2015, pp. 4)
Knowledge-based recommender systems use user defined preferences and match
them to the corresponding items. Such systems must solve same problems that arise
in Collaborative filtering (insufficient amount of data) or Content-based filtering
(similar item does not necessarily mean a correct prediction). Knowledge-based
systems are mainly suitable for one-time expensive purchases – a computer or car
purchase. (Škrášek, 2015, pp. 5)
2.2.7 Overview of Previous Research Papers
In the research paper named “Social Network Recommendation using Graph
Databases” recommendation systems was initially emerged in the early 1990s,
where the first systems were designed as manual and allowed users to ask the system
for other users’ preferences / actions. Such systems required the user’s effort and
ability to express their intentions. This system of recommendations was termed as
24
Collaborative filtering; which means that the results are based on the behavior or
opinion of other users. One of the first recommender systems was developed by a
research group from the department of computer science and engineering at the
University of Minnesota named GroupsLens. It used a Collaborative filtering
technique to recommend unread Usenet articles. Users were asked to give a rating;
the system also tracked their other observable actions. Also, other recommender
systems’ development followed for various domains, e.g. Ringo for music, BellCore
Video Recommender for movies, or Jester for jokes. In the late 1990s, the first
commercial systems were started and the most well-known of these was Amazon’s
recommender system, which was based on client’s data such as users’ purchases and
browsing history. In the same way, different e-commerce systems quickly followed
the new trend since recommender systems were essential for increasing the sales and
revenue figures of the company. From the year 2000, a new era for research began
due to rapid commercialization and increased data availability. (Škrášek, 2015, pp.
1-44)
The objective of this research was to design the friend recommender system for the
social site signaly.cz. Signaly.cz was not having any recommender system and does
not contain tools for better interaction with newly registered users. The research
describes the development of the friend recommender system based on the Neo4j
graph database. The recommender system uses users’ mutual friendships, group
memberships, and attendance at events as data-source for the friend
recommendations. The recommender widget that was created suggests users for
befriending, allows for skipping a particular recommendation, and continuously
refreshes its recommendations. The used algorithms in this research were “Mutual
friendships”, “Mutual membership in groups”, “Mutual attendance at events” and
“Users with the most friends”. (Škrášek, 2015, pp. 1-44)
In the research paper named “Implementing a Recommender system with graph
database”, the author proposes to build a recommendation system for any type of
ecommerce platforms using graph database using Neo4j. The use cases for both
content-based (or item to item) recommendation and collaborative filtering (or user
to user) recommendation had been implemented using Cypher query language. The
data model build is a Graph data model and database comprises of a fictional online
movie store which only contains a total of 10 movies and 10 users which is very
small. There were four nodes and four relationships. The graph algorithms
implemented in this paper are Cosine Similarity and Minimum Spanning Tree to
generate recommendations as per the given use cases. The main goal of this research

25
paper provides that Neo4j could provide feasible solutions for the emerging problem
of Big Data and the implementation of graph algorithms used provides very useful
and interesting insights for generating recommendations in any type of ecommerce
platform. (Cung, H and Jedidi, M ,2014, pp. 1-26)
In the research paper given by “A graph based recommender system for digital
library”, the author proposes to build a recommendation system which uses
combination of both content based and collaborative approaches (which is a hybrid
approach) using graph based model in the context of an online Chinese bookstore.
The main objective or aim for this research was to answer these two questions:
Which one is better in terms of performance – A hybrid recommendation approach
and a purely content-based approach or a purely collaborative approach? and Effect
of recommendation results for high-degree association is higher than low-degree
association? Precision and recall were used for measuring the effectiveness. For this
case study, algorithm named Hopfield net algorithm was used to check high-degree
book-book, user-user and book-user associations. The Hopfield algorithm (or
Hopfield Net) performs a parallel relaxation search, in which the nodes are activated
in parallel and activation values from different sources are combined for each
individual node. The neighboring nodes are traversed in order until the activation
levels of nodes in the network converge. As per the current model, the weighted
network of books and customers can be taken as interconnections of neurons and
synapses in the Hopfield net algorithm, where neurons represent books or customers
and synapses represent weighted links between pairs of books and customers. This
algorithm will stop when there is no significant difference in terms of results between
two iterations. The testing for the system resulted in the improvement with respect
to precision and recall but no significant improvement was found by checking the
high-degree associations. The database used in this research was Microsoft SQL
Server. The Hopfield algorithm was implemented as SQL Server stored procedures.
(Huang, Z. Chung, W. Ong, T. & Chen, H. ,2002, pp. 65-73)
In the research paper given by “Flexible recommender systems based on graphs”,
the author proposes to build a flexible recommender system based on graph oriented
databases being developed by the company named Kernix. The approach provides a
flexible framework which allows to handle a variety of entities of interest and
enables to design rich strategies in order to compute recommendations for various
use cases. Firstly, for the use case of a graph-based Collaborative Filtering
recommender system, a movie recommender system based on the ML-100k dataset
is built. It was noted that this model doesn’t have any training phase as machine-

26
learning based approaches requires so it was well suited for cases of fast
addition/deletion of entities and evolution of their connections. Secondly, a hybrid
recommender system was built for one of the customers, in which the company
proposes to ease interactions between individuals and professionals through “do it
yourself” workshops. The goal for this use case was to integrate to the website of
this company an engine recommending workshops to users. In order to calculate the
recommendation of workshops, combination of the three strategies was done based
on the same graph structure. One advantage of this approach was that it was very
flexible schemes of computation and combination of recommendation based on the
same graph structure. Also, the engine lies on the synchronized usage of a Neo4j
database and a MongoDB database. The Neo4j technology is made for storing data
structured as graph and requesting it with the Cypher language. MongoDB, a
document-oriented database, is used in order to store potentially large content
associated with each entity (the descriptions of the workshops in the previous use
case for instance), whereas the graph database is not really suited for this
functionality. The connectors to Neo4j and MongoDB are also available. All these
features allow the application to process data collection and processing, writing to
the databases and requesting them to serve recommendations. The goal of this paper
was to elaborate the way company named Kernix builds recommender engine based
on a graph database. (Pellegrino, J., 2017, pp. 1-4.)
In the research paper given by “A Recommendation Engine based on Social
Metrics”, the author had presented the approach for a graph-based recommendation
model that takes advantage of social metrics and recommends points of interest to
users in a smart city. The proposed model expresses the semantics of relationships
that exist between users and points of interest through terms that define a profile for
the items. This enhanced approach, using particularly flow centralities, considers
semantic predominance of terms for defining and exploiting the relationships among
user profile preferences as well as the descriptive characteristics of points of interest.
Recommendations can then be extracted based on the knowledge represented in the
graph. In order to validate the recommendation model, the recommendation engine
was implemented and has shown that interesting recommendations could be
suggested to users, considering not only their preferences, but also taking into
account suggestions coming out from preferences of other members of the social
network related to them by the friendship relationship. The implementation of the
recommendation engine was a difficult task because of the data volume and the
complexity of required calculations to evaluate flow centralities and semantic

27
predominance. This difficulty not only raised new questions but also opened
interesting opportunities for dealing with performance issues. Preliminary results
were presented, showing that the use of social metrics in any real recommendation
system must include a specialized component for solving distributed and concurrent
processing tasks. (Cervantes1 et al., 2015, pp. 1-16)
In the research paper given by “Graph based Collaborative Ranking”, the author had
proposed how a graph-based framework can be designed and used to address the
shortcomings of current neighbor-based collaborative ranking algorithms. For this
purpose, he suggested that modeling the preference data as a new tri-partite graph
structure and then exploring it can help us to capture the different kinds of relations
existing in a ranking preference dataset (e.g. users’ similarities, items’ similarities,
etc.). They also proposed a random-walk approach to make recommendation based
on the proposed structure. The experimental results showed significant improvement
of the suggested framework, GRank over other state-of-the-art graph-based and
neighbor-based collaborative ranking methods. It seems that the graph-based
approach of GRank can be useful both in sparse and dense data sets. In the case of
dense data sets, GRank can form the neighborhoods more precisely, by exploring
different paths that exist among entities. In the case of sparse data sets, the users
rarely have common pairwise comparisons and direct neighborhoods are usually
very small, it can still traverse the edges to find farther neighbors and use their
information as well for recommendation. The proposed graph structure has been
mainly used here for finding closeness between users and items, but it can also be
used for other purposes like finding clusters of similar users and similar items, and
to discover correlated preferences. (Shams, B. and Haratizadeh, S., 2017, pp. 1-30)
In the research paper given by “Aspect Based Recommendations: Recommending
Items with the Most Valuable Aspects Based on User Reviews”, the author presented
a method that identifies the most valuable user-controlled aspects of possible user
experiences of the items and recommends the items together with suggestions to
consume those most valuable aspects. The paper makes the following contributions.
Firstly, it proposed a novel approach to enhance the functionality of recommender
systems by recommending not only the item itself but also some positive aspects of
the item to further enhance user experiences with the item. Secondly, in this paper
they developed a method Sentiment Utility Logistic Model (SULM) for identifying
the most valuable aspects of future user experiences that is based on the sentiment
analysis of user reviews. Finally, they tested the method on actual reviews across
three real-life applications and showed that the proposed method performed well on

28
these applications in the following sense. Recommendations of a set of valuable
aspects worked well as those users who followed our recommendations rated their
experiences significantly higher than those who followed the baseline
recommendations. The proposed method also managed to predict the unknown
ratings of the reviews at the level commensurate with the state-of-the-art HFT
model. In addition, it also predicted the set of aspects that the user would mention in
a possible future review of an item at the level of the state-of the-art LRPPM.
Overall, SULM provides recommendations not only to the users but it also
recommends valuable aspects of user experiences to the mangers of the
establishments that can help them to provide better services to the users. (Bauman,
K., Liu, B. and Tuzhilin, A., 2017, pp. 1-9)
In the research paper given by “A Clustering Approach for Personalizing Diversity
in Collaborative Recommender Systems”, the author proposes in this research was
to evaluate the hypothesis that users’ propensity towards diversity varies greatly and
that the diversity of recommendation lists should be consistent with the level of user
interest in diverse recommendations. They proposed a pre-filtering clustering
approach to group users which are having similar levels of tolerance for diversity.
Firstly, they had proposed a method for personalizing diversity by performing
collaborative filtering independently on different segments of users based on the
degree of diversity in their profiles. Secondly, they investigate the accuracy-diversity
tradeoffs using the proposed method across different user segments. As part of this
evaluation they proposed new metrics which were taken from information retrieval,
helped us measure the effectiveness of our approach in providing diversity
personalization. The experimental evaluation was based on two different datasets:
MovieLens movie ratings, and Yelp restaurant reviews. (Eskandanian, F., Mobasher,
B. and Burke, R, 2017, pp. 1-10)
In the research paper given by “Recommendation in Heterogeneous Information
Networks with Implicit User Feedback”, the author studied the entity
recommendation problem in heterogeneous information networks. They proposed to
combine various relationship information from the network with user feedback to
generate high quality recommendation results. The major challenge of building
recommender systems in heterogeneous information networks is to systematically
define features to represent the different types of relationships between entities and
learn the importance of each relationship type. In the proposed framework, they first
used meta-path-based latent features to represent the connectivity between users and
items along different paths in the related information network. They then define a

29
recommendation model with such latent features and use Bayesian ranking
optimization techniques to estimate the model. Different types of studies show that
this approach outperforms several widely employed implicit feedback entity
recommendation techniques. Empirical studies were carried on two real-world
datasets, IMDB-MovieLens100K and Yelp. The different methods used in this
research are Popularity, Co-Click, NMF, Hybrid-SVM and HeteRec. (Yu et al.,
2013, pp. 1-4)
In the research paper given by “Leveraging Meta-path-based Context for Top-N
Recommendation with A Neural Co-Attention Model”, the author proposed a novel
deep neural network model with the co-attention mechanism for top-N
recommendation in HIN. They elaborately designed a three-way neural interaction
model by explicitly incorporating meta-path-based context. To build the meta-path-
based context, they used a priority-based sampling technique to select high-quality
path instances. The model learned effective representations for users, items and
meta-path-based context for implementing a powerful interaction function. The co-
attention mechanism mutually improved the representations for meta-path-based
context, users and items. Extensive experimental results have shown the superiority
of this model in both recommendation effectiveness and interpretability. They
believe the proposed three-way neural interaction model provides a promising
approach to utilize HIN information for the improvement of recommender systems.
Currently, this approach can effectively select high-quality path instances and learn
the attention weights of meta-paths. (Hu, B., Shi, C., Zhao, W. and Yu, P., 2018, pp.
1-10)
2.2.8 Overview of Graph Algorithms Used in Neo4j
The Graph Algorithms developed by the open source developer community of Neo4j
are used to calculate metrics for graphs, nodes or relationships. The algorithms
reveal the hidden patterns and structures in the connected data around community
detection, centrality and path finding with a core set of tested and supported
algorithms. Many graph algorithms are iterative approaches that frequently traverse
the graph for the computation using random walks, breadth-first or depth-first
searches, or pattern matching. The algorithms provide valuable and key insights on
relevant entities in the graph (centralities, ranking), or inherent structures like
communities (community-detection, graph-partitioning, clustering). (‘Chapter 1.
Introduction’, no date)

30
There are mainly four categories for graph algorithms in Neo4j which are defined as
follows:
• Centralities – The algorithms under Centralities are used to determine the
importance of distinct nodes in a network.
• Community Detection – The algorithms under Community Detection are used
to check how a group is clustered or partitioned, as well as its tendency to
strengthen or break apart.
• Path Finding – The algorithms under Path Finding are used to find the shortest
path or evaluate the availability and quality of routes.
• Similarity – The algorithms under Similarity are used to find the similarity of
nodes.
The PageRank Algorithm
PageRank is an algorithm that measures the transitive influence or connectivity of
nodes. It can be computed by either iteratively distributing one node’s rank
(originally based on degree) over its neighbors or by randomly traversing the graph
and counting the frequency of hitting each node during these walks. It comes under
the category of Centrality algorithms. (‘4.1 The PageRank algorithm’, no date)
PageRank is named after Google co-founder Larry Page, and is used to rank websites
in Google’s search results. It counts the number, and quality, of links to a page which
determines an estimation of how important the page is. The underlying assumption
is that pages of importance are more likely to receive a higher volume of links from
other pages. (‘4.1 The PageRank algorithm’, no date)
PageRank as defined by the original Google paper as below:
where,
• we assume that a page A has pages T1 to Tn which point to it.
• d is a dampling factor whose value can be set between 0 and 1.
• C(A) is defined as the number of links that goes out of page A.
The Overlap Similarity Algorithm
Overlap Similarity computes the overlap or similarity between two given sets of
data. It is mathematically defined as the size of the intersection of two sets divided

31
by the size of the smaller of the two sets. The library contains both functions and
procedures for finding similarity between two sets of data, in which the datasets can
be smaller or bigger. (‘7.4 The Overlap Similarity algorithm’, no date)
The formula for calculating Overlap Similarity is as below:
The Cosine Similarity Algorithm
Cosine Similarity can be defined as the cosine of the angle between two n-
dimensional vectors which are in n-dimensional space. Simultaneously, it is also the
dot product of two vectors divided by the product of two vectors lengths or
magnitudes. The values range from -1 to 1 where -1 denotes perfectly dissimilar and
1 denotes perfectly similar. The library contains both functions and procedures for
finding similarity between two sets of data, in which the datasets can be smaller or
bigger. The lists should contain some overlapping items when we call this function.
On the other hand, the procedures require the same length lists for all the items. (‘7.2
The Cosine Similarity algorithm’, no date)
The formula for calculating Cosine Similarity is as below:
The above three graph algorithms are used in the development of the proposed
artifact for this research. I have used these graph algorithms to showcase the hidden
power of graph analytics in graph databases like Neo4j.
32
2.2.9 Overview of Association Rules – FP-Growth
Association Rules is a very important Unsupervised Learning which is used to find
relationships between two item sets. Association Rules measure the strength of co-
occurrence between one item with another. The aim is not to predict occurrence but
to find usable patterns in the cooccurrence of the items. Widely used in retail analysis
of transactions, recommendation engines and online clickstream analysis across
pages. A popular application of the technique is “market basket analysis” which
finds co-occurrences of one retail item with another item within the same retail
purchase transaction. A retailer can take advantage of this association for bundle
pricing, product placement, and even shelf optimisation within the store layout.
(Kotu and Deshpande, 2015)
The key input is the list of past transactions with product information. From this we
can determine the most frequent product pairs above a significance threshold. The
result is a rule that says, “if product A is purchased, there is an increased likelihood
that product B will be purchased”. (Kotu and Deshpande, 2015)
For association analysis the data must be prepared in Clickstream format for
analysis.
The Frequent Pattern (FP)-Growth algorithm uses a special graph data structure
called FP-Tree. An FP-Tree can be thought of as a transformation of the data set into
graph format. Rather than the generate and test approach used in Apriori algorithm,
FP-Growth first generates the FP-Tree and uses this compressed tree to generate the
frequent item sets. The efficiency of the FP-Growth algorithm depends on how much
compression can be achieved in generating the FP-Tree. (Kotu and Deshpande,
2015)
I have used FP-Growth Algorithm to show the difference between a Traditional
Approach which is implemented using a Data Mining Tool like RapidMiner with the
graph algorithms used in Neo4j, which is one of the leaders in graph databases
currently for building a real time recommendation system. The results suggest that
Graph Algorithms of Neo4j are much better than FP-Growth Algorithm when we
checked with the application for recommendation systems for both.
The different concepts used in Association Rules are:
Frequent Item Set

33
Frequent patterns are patterns (e.g. item sets, sub-sequences, or substructures) that
occur frequently in a dataset. A set of items, such as milk and bread, that appear
frequently together in a transaction data set is a Frequent Item Set. (Kotu and
Deshpande, 2015)
Support of an Item
The relative frequency of an occurrence of an item set in the transaction set. (Kotu
and Deshpande, 2015)
Support of a Rule
A measure of how all the items in a rule are represented in overall transactions. The
support measure for a rule indicates whether a rule is worth considering. (Kotu and
Deshpande, 2015)
Confidence of a Rule
Measures the likelihood of occurrence of the consequent of the rule out of all the
transactions that contain the antecedent of the rule. Confidence provides the
reliability measure of the rule. (Kotu and Deshpande, 2015)
Lift of a Rule
Lift is the ratio of observed support with what is expected if antecedent and
consequent were completely independent. Lift values closer to 1 mean the
antecedent and consequent of the rules are independent, and the rule is not
interesting. The higher (above 1) the value of lift, the more interesting the rules are.
(Kotu and Deshpande, 2015)

34
Conviction of a Rule
The Conviction of the rule 𝑿 → 𝒀 is the ratio of the expected frequency of 𝑿
occurring in spite of 𝒀 and the observed frequency of incorrect predictions.
Conviction takes into account the direction of the rule. The conviction of (𝑿 → 𝒀)
is not the same as the conviction of (𝒀 → 𝑿). (Kotu and Deshpande, 2015)
For example {milk, bread} -> {butter} Conviction = 1.2 is interpreted as the rule
will be correct 20% more often than if by random chance.

35
Chapter Three
Research Methodology and Methods
3.1 Introduction
This section provides an overview of the research methodology and research
methods used for the artifact development of this research. The artifact will be
containing the proposed solutions for the two use cases that had been proposed by
Neo4j. This section also describes the data collection and data analysis methods. It
also contains the research architecture and design.
3.2 Research Strategy
For carrying out the research work on my chosen area, I did a thorough analysis of
the different research papers published on Yelp dataset and other online sources to
get an understanding of the work that had been done till date. Since, my research
questions involves detailed technical understanding of Neo4j & Cypher query
language, I did a thorough learning through various online websites. I also worked
on the implementation of Python Script and Rapid Miner Tool for doing relevant
tasks.
3.3 Research Methodology
The research methodology used in this research is CRISP-DM methodology.
CRISP-DM stands for Cross-Industry Standard Process for Data Mining. It is purely
non-proprietary, documented and freely available data mining model. It was
developed with the help of various industry leaders with input from more than 200
data mining users and data mining tools and service providers; CRISP-DM is an
industry-, tool-, and application neutral model. This model encourages best practices
and offers organizations the structure needed to realize better and faster results from
data mining. (Shearer, 2000, p. 13)
There are mainly six phases in the CRISP-DM Model namely Business
Understanding, Data Understanding, Data Preparation, Modeling, Evaluation and
Deployment. These phases provide an efficient road map for various organizations
to understand the whole data mining process model and help in the planning and
implementation of data mining project. (Shearer, 2000, p. 14)

36
FIGURE 3.3.1: PHASES OF CRISM-DM REFERENCE MODEL. (SHEARER, 2000, P. 14)
Phase 1: Business Understanding
This phase is one of the most important and initial phases of any data mining project.
In this phase, the main objective is to understand the project objectives from a
business standpoint and this information gets converted into a data mining problem
definition and finally develop a plan build to get the project objectives. This phase
has following major steps like Determining business objectives, Assessing the
situation, Determining the data mining goals and Producing the Project Plan.
(Shearer, 2000, p. 14)
Under this phase, I tried to understand the business perspective for the two use cases
that were given for implementation. It required me to investigate into some of the
newly introduced Graph Algorithms by Neo4j and develop a real time
recommendation system. After this phase, I decided on the business objectives and
came up with a Detailed Project Plan for this research.
Phase 2: Data Understanding
This phase has following major steps like Collection of initial data, Description of
data, Exploration of data and Verification of data quality. (Shearer, 2000, p. 15)
37
Under this phase, I tried to understand the structure and details of open source Yelp
dataset which contains json files.
Phase 3: Data Preparation
This phase has following major steps like Selection of data, Cleansing of data,
Construction of data, Integration of data and Formatting of data. (Shearer, 2000, p.
16)
Under this phase, I implemented the Python Script for providing conversion of JSON
files into corresponding CSV files.
Phase 4: Modeling
This phase has following major steps like Selection of the modeling technique,
Generation of test design, Creation of models and Assessment of models. (Shearer,
2000, p. 17)
Under this phase, I created the Graph Data Model for the research. The different
Cypher queries were developed and executed for finding the proposed solutions of
the two use cases.
Phase 5: Evaluation
This phase has following major steps like Evaluation of results, Process Review and
Determination of next steps. (Shearer, 2000, p. 17)
Under this phase, I had done the detailed data analysis on graphs for the cypher
queries that were written to provide solutions for my research questions.
Phase 6: Deployment
This phase has following major steps like Plan Deployment, Plan Monitoring and
Maintenance, Production of the final report and Review of the Project. (Shearer,
2000, p. 18)
Under this phase, I have done the artifact deployment on my local machine. I could
not deploy on any Cloud Environments due to time constraints in this research.
3.4 Data Collection Method
Secondary data collection method was used in the research to do the implementation
technically. I have taken the dataset from Open Source Yelp website
(https://www.yelp.com/dataset/download) – Yelp Data Set.

38
3.5 Data Sampling
Since Yelp dataset is a big dataset, I used the initial 10,000 rows each for all the
JSON Files for the technical implementation.
3.6 Methodological Assumptions
While working on the proposed solutions of the two use cases, I made following
methodological assumptions:
• Sample of the Open Source Yelp dataset is taken for the development of the
artifact, since there were memory constraints for loading a big dataset. A
sample of initial 10,000 rows individually from business.json, user.json and
review.json were taken when loading the Yelp dataset.
• Development is done only for loading of all the json files loading but not for
the loading of the csv files, since there were technical challenges to do the
conversion of review.json and user.json into its corresponding csv file format.
The main challenge was that of memory error and some data of both json files
were not formatted correctly.
• Sample data is created on top of the existing database to showcase the power
of graph algorithm named Cosine Similarity Algorithm. This was done since
there was no proper and adequate data in the database which could be used to
show the results.
• For Rapid Miner implementation, CSV file was created in the format which
could be used by using the corresponding steps in data mining process.
• The implementation is done locally on the machine. It could not be deployed
into any of the Cloud Infrastructure/ Environments due to time constraints for
the research.
3.7 Research Methods
For the purpose of this research, I have used both Qualitative and Quantitative
Research Methods. The qualitative methods were used in answering the questions
like How a particular business is linked to a particular category, how a particular
business is linked to a particular city and how a particular user is linked to another
user? The quantitative methods were used to find the different types of metrics for
the given two use cases. With the help of the quantitative methods, I was able to
perform the detailed graph analysis on Neo4j and the produced results were very
intuitive, insightful and helpful for the purpose of this research.

39
3.8 Research Architecture and Design
FIGURE 3.8.1: ARCHITECTURE DESIGN DIAGRAM OF THE RESEARCH.
The above diagram shows the overall architecture design diagram for the research.
It shows the detailed data pipeline or data flow used in the research.
3.9 Conclusion
This section provided an overview of the research methodology, research methods,
data collection and data sampling methods. It also provided the research architecture
and design used in this research.

40
Chapter Four
Artefact Design and Development
4.1 Introduction
This section provides the full technical details and implementation which was
carried out for the Artifact design and development for this research. The main
outcome for this section is to lay the initial foundation for finding the feasible
solutions for the two use cases or requirements given by Neo4j.
4.2 Business Case Overview
The business use cases provided by Neo4j has given me the opportunity to work on
some challenging and complex requirements.
The two business use cases or requirements given by Neo4j are as follows:
1) Making group recommendations for a "night out" with multiple activities that
could encompass multiple friends/spouse/dietary preferences etc.
2) Evaluating whether some businesses have ripple effects for an area. For
example, do certain types of businesses (or particular ones) tend to bring in
other business. Which ones are critical to the overall economic health of a
region?
The objective of the first use case is to provide group recommendations for a “night
out” which will include multiple activities and could include multiple friends with
dietary preferences or spouse with dietary preferences.
The objective of the second use case is to find the most important and influential
businesses in a particular area. Also, to find whether certain types of businesses (or
particular ones) tend to bring in other business.
4.3 Data Set Description
The dataset for this research has been taken from the following open source Yelp
website: (https://www.yelp.com/dataset/download)
Yelp.com has been running the Yelp Dataset challenge since 2013; a competition
that encourages people to explore and research Yelp’s open dataset. As of Round 10
of the challenge, the dataset contained:
• almost 5 million reviews
41
• over 1.1 million users
• over 150,000 businesses
• 12 metropolitan areas
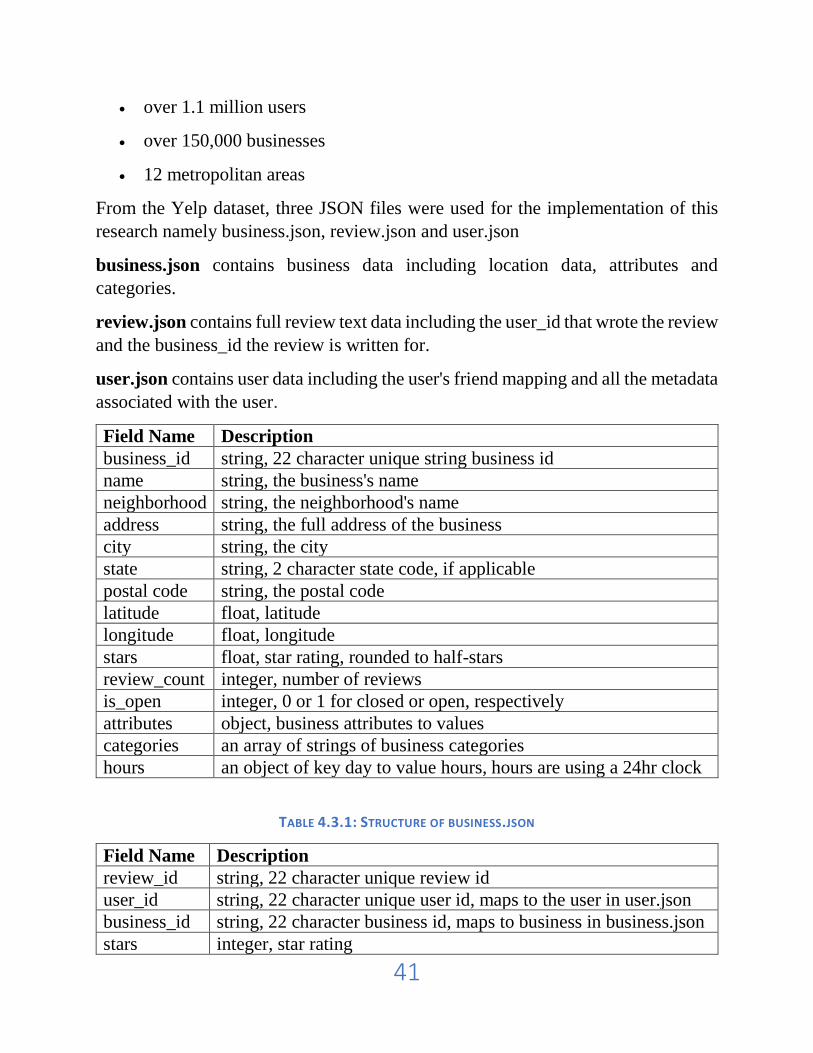
From the Yelp dataset, three JSON files were used for the implementation of this
research namely business.json, review.json and user.json
business.json contains business data including location data, attributes and
categories.
review.json contains full review text data including the user_id that wrote the review
and the business_id the review is written for.
user.json contains user data including the user's friend mapping and all the metadata
associated with the user.
Field Name Description
business_id string, 22 character unique string business id
name string, the business's name
neighborhood string, the neighborhood's name
address string, the full address of the business
city string, the city
state string, 2 character state code, if applicable
postal code string, the postal code
latitude float, latitude
longitude float, longitude
stars float, star rating, rounded to half-stars
review_count integer, number of reviews
is_open integer, 0 or 1 for closed or open, respectively
attributes object, business attributes to values
categories an array of strings of business categories
hours an object of key day to value hours, hours are using a 24hr clock
TABLE 4.3.1: STRUCTURE OF BUSINESS.JSON
Field Name Description
review_id string, 22 character unique review id
user_id string, 22 character unique user id, maps to the user in user.json
business_id string, 22 character business id, maps to business in business.json
stars integer, star rating

42
date string, date formatted YYYY-MM-DD
text string, the review itself
useful integer, number of useful votes received
funny integer, number of funny votes received
cool integer, number of cool votes received
TABLE 4.3.2: STRUCTURE OF REVIEW.JSON
Field Name Description
user_id string, 22 character unique user id, maps to the user in
user.json
name string, the user's first name
review_count integer, the number of reviews they've written
yelping_since string, when the user joined Yelp, formatted like YYYY-
MM-DD
friends array of strings, an array of the user's friend as user_ids
useful integer, number of useful votes sent by the user
funny integer, number of funny votes sent by the user
cool integer, number of cool votes sent by the user
fans integer, number of fans the user has
elite array of integers, the years the user was elite
average_stars float, average rating of all reviews
compliment_hot integer, number of hot compliments received by the user
compliment_more integer, number of more compliments received by the user
compliment_profile integer, number of profile compliments received by the user
compliment_cute integer, number of cute compliments received by the user
compliment_list integer, number of list compliments received by the user
compliment_note integer, number of note compliments received by the user
compliment_plain integer, number of plain compliments received by the user
compliment_cool integer, number of cool compliments received by the user
compliment_funny integer, number of funny compliments received by the user
compliment_writer integer, number of writer compliments received by the user
compliment_photos integer, number of photo compliments received by the user
TABLE 4.3.3: STRUCTURE OF USER.JSON
43
4.4 Software, Programming Languages and Tools Used
The database used in this research is Neo4j which is one of the leading graph
databases currently. The query language used is Cypher Query Language which is
the query language for Neo4j.
The programming language used in this research is Python. It is used to do the
implementation for the conversion of json files to csv files format. In Neo4j, I load
both json and csv files so that I can do some analysis on the data.
I would also be using the data mining tool, Rapid Miner for demonstrating a more
traditional approach to building recommendation engines. Through this, I will show
the Association Rules between different categories by using FP-Growth Algorithm.
The main objective for this implementation is to show the difference between
Traditional Approach and Graph Database Analytics in terms of building real time
recommendation systems.
4.5 Building of the Graph Data Model
Since, the database used in this research is Graph Database, the data model used is
the Graph Data Model. The overall graph model build for this research is shown
below:

44
FIGURE 4.5.1: GRAPH DATA MODEL BUILD FROM YELP DATASET FOR THE RESEARCH.
In the above graph model, the circle elements denote the nodes and arrows between
two nodes denote the relationships. The nodes being created are Business, User,
Review, Category, City and Game. The relationships being created are REVIEWS,
IN_CATEGORY, IN_CITY, WROTE, FRIENDS, SPOUSE and LIKES.
The nodes and relationships created are as follows:
((User) – [:LIKES] –> (Game)
(User) – [:FRIENDS] –> (User)
(User) – [:SPOUSE] -> (User)
(User) – [:WROTE] –> (Review)
(Review) – [:REVIEWS] –> (Business)
(Business) – [:IN_CATEGORY] –> (Category)
(Business) – [:IN_CITY] -> (City)

45
4.6 Use Cases Development Process Overview
This section describes the initial technical overview for doing implementation for
both the use cases that have been developed in this research.
Neo4j Configuration:
The following statements are added in the Neo4j Configuration file:
dbms.security.procedures.unrestricted=apoc.*,algo.*
apoc.import.file.enabled=true
FIGURE 4.6.1: NEO4J DESKTOP CONFIGURATION SETTINGS.
Steps in the Development Process:
Step 1: Loading of business.json into Neo4j and creating the nodes and relationships
for the database. Some of the fields like attributes, hours, business_id, categories,
address, postal_code and city are taken out from the json structure while creating the
database structure since we don’t want to load these fields.
The relationship structure between Business and Category is created to design a
graph in which business will be connected to its relevant categories.
Step 2: Loading of user.json in Neo4j and creating the nodes and relationships for
the database. Some of the fields like friends and user_id is taken out from the json

46
structure while creating the database structure since we don’t want to load these
fields.
The relationship structure between User and different user is created to design a
graph in which one user will be connected to other users through friend’s
relationship. In this way, we are creating a User’s Social Network in which users
form a friend’s network.
Step 3: Loading of review.json in Neo4j and creating the nodes and relationships for
the database. Some of the fields like business_id, user_id and review_id is taken
out from the json structure while creating the database structure since we don’t want
to load these fields.
The relationship structure between User and Review is created to design a graph in
which user will be connected to different reviews.
The relationship structure between Review and Business is created to design a graph
in which review will be connected to different business.
Step 4: Loading of business.json into Neo4j and creating the nodes and relationships
for the database.
The relationship structure between Business and City is created to design a graph in
which business will be connected to its relevant cities.
Step 5: Python script is written for the conversion of different json files to its
corresponding csv files, which could be consumed for loading of the files into Neo4j.
4.7 Conclusion
The above section provides the overview of the initial development process for
loading of the various json files and creating the nodes and relationships structure in
Neo4j with the help of Cypher Query Language. The development of both the use
cases is explained in detail in the next chapter.
47
Chapter Five
Proposed Solutions & Data Analysis/Findings
5.1 Introduction
This chapter describes the Findings obtained from the research and how they were
used for progressing in the research work. It proposes the feasible solution for the
two business use cases provided by Neo4j It also provides information on Data
Analysis done on the Open Source Yelp Dataset in terms of recommendation
systems.
5.2 Proposed Solutions & Findings / Data Analysis
When I started the research, with the study on previous work and research papers, I
found that there were very few papers which implemented the concept of Graph
Algorithms for building a real time recommendation system in Graph Database
(especially Neo4j). Every research paper was having some advantages as well as
some disadvantages. In one of the research papers, the development was done on a
very small scale by taking just a small dataset to showcase the power of graph
algorithms in Neo4j. Furthermore, this area of research is very new and currently
evolving and the graph algorithms introduced by Neo4j is just a year ago, there is
tremendous scope for development for many use cases in Graph Database across any
industry domains.
With the help of my research, I tried to find the hidden layers of Graph Database
(especially Neo4j). I worked for the implementation of some graph algorithms like
PageRank, Overlap Similarity and Cosine Similarity for the building of a real time
recommendation system in Neo4j.
The proposed solution for the first use case is as follows:

48
5.2.1 Business Scenario 1 for Use Case 1:
FIGURE 5.2.1.1: CYPHER CODE FOR FIRST USE CASE (SCENARIO 1).
The above cypher query first selects the user who has a FRIENDS relationship with
another user. Here, I have provided the user ids for both the users. Then, do a full
graph traversal from node User to node Category. Then, check for the condition for
review stars which are greater than 4 and category name should start with the text
“Restau”. Finally, the query will return 10 records containing First User, Second
User, Business Name, Category Name and Review Stars. In this query, the real time
recommendation system for User’s Friends with Dietary Preferences that can come
for a “night out” is developed.

49
Output
FIGURE 5.2.1.2: OUTPUT FOR FIRST USE CASE (SCENARIO 1).
The above output shows fields like First User, Second User, Business Name,
Category Name and Review Stars. The output provides the information that if
Daipayan is Friend of Andy, then the choices of Daipayan with the condition for
review stars which are greater than 4 and category name should start with the text
“Restau”, would be same for Andy as well. It means that we are providing a real
time recommendation for Andy based on its friends relationship with Daipayan. The
above query took 49 milliseconds to process the results from the database.

50
5.2.2 Business Scenario 2 for Use Case 1:
FIGURE 5.2.2.1: CYPHER CODE FOR FIRST USE CASE (SCENARIO 2).
The above cypher query first selects the user who has a FRIENDS relationship with
another user. Here, I have provided the user ids for both the users. Then, do a full
graph traversal from node User to node Category. Then, check for the condition for
review stars which are greater than 4 and category name should contain the text
“Mexican”. Finally, the query will return 10 records containing First User, Second
User, Business Name, Category Name and Review Stars. In this query, the real time
recommendation system for User’s Friends with Dietary Preferences that can come
for a “night out” is developed. Here, I am taking the Dietary Preferences as
“Mexican”.

51
Output
FIGURE 5.2.2.2: OUTPUT FOR FIRST USE CASE (SCENARIO 2).
The above output shows fields like First User, Second User, Business Name,
Category Name and Review Stars. The output provides the information that if
Daipayan is Friend of Andy, then the choices of Daipayan with the condition for
review stars which are greater than 4 and category name should contain the text
“Mexican”, would be same for Andy as well. It means that we are providing a real
time recommendation for Andy based on its friends relationship with Daipayan. The
above query took 244 milliseconds to process the results from the database.
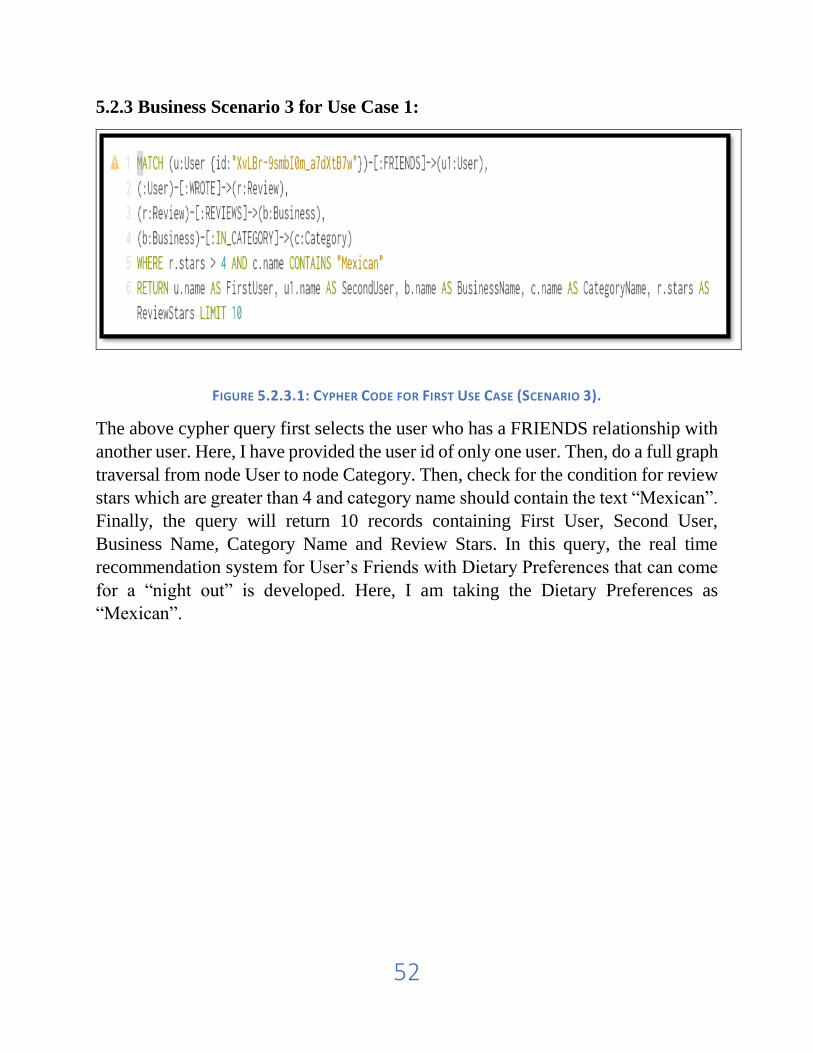
52
5.2.3 Business Scenario 3 for Use Case 1:
FIGURE 5.2.3.1: CYPHER CODE FOR FIRST USE CASE (SCENARIO 3).
The above cypher query first selects the user who has a FRIENDS relationship with
another user. Here, I have provided the user id of only one user. Then, do a full graph
traversal from node User to node Category. Then, check for the condition for review
stars which are greater than 4 and category name should contain the text “Mexican”.
Finally, the query will return 10 records containing First User, Second User,
Business Name, Category Name and Review Stars. In this query, the real time
recommendation system for User’s Friends with Dietary Preferences that can come
for a “night out” is developed. Here, I am taking the Dietary Preferences as
“Mexican”.

53
Output
FIGURE 5.3.2.2: OUTPUT FOR FIRST USE CASE (SCENARIO 3).
The above output shows fields like First User, Second User, Business Name,
Category Name and Review Stars. The output provides the information that if
Daipayan is Friend of Mitch, then the choices of Daipayan with the condition for
review stars which are greater than 4 and category name should contain the text
“Mexican”, would be same for Mitch as well. It means that we are providing a real
time recommendation for Mitch based on its friends relationship with Daipayan.
Here, other users also share same type of dietary preference like Mexican as
Daipayan. The above query took 81 milliseconds to process the results from the
database.
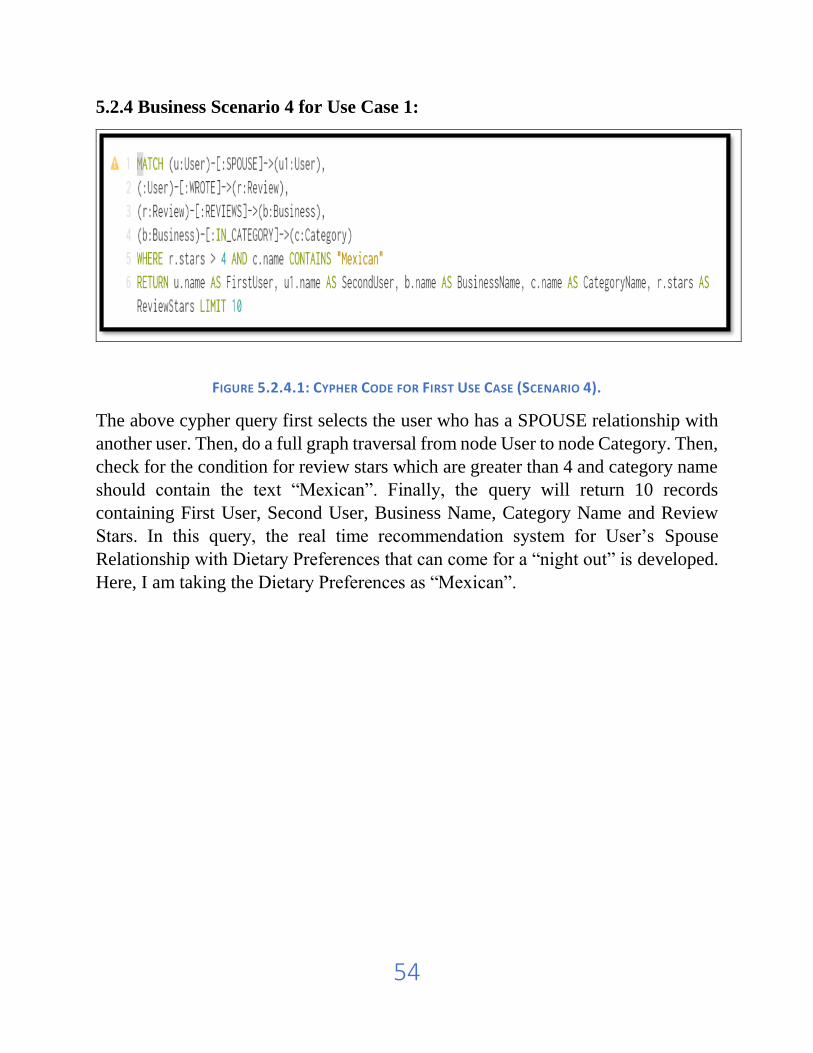
54
5.2.4 Business Scenario 4 for Use Case 1:
FIGURE 5.2.4.1: CYPHER CODE FOR FIRST USE CASE (SCENARIO 4).
The above cypher query first selects the user who has a SPOUSE relationship with
another user. Then, do a full graph traversal from node User to node Category. Then,
check for the condition for review stars which are greater than 4 and category name
should contain the text “Mexican”. Finally, the query will return 10 records
containing First User, Second User, Business Name, Category Name and Review
Stars. In this query, the real time recommendation system for User’s Spouse
Relationship with Dietary Preferences that can come for a “night out” is developed.
Here, I am taking the Dietary Preferences as “Mexican”.

55
Output
FIGURE 5.2.4.2: OUTPUT FOR FIRST USE CASE (SCENARIO 4).
The above output shows fields like First User, Second User, Business Name,
Category Name and Review Stars. The output provides the information that if
Daipayan is having a Spouse Relationship with Andrea, then the choices of
Daipayan with the condition for review stars which are greater than 4 and category
name should contain the text “Mexican”, would be same for Andrea as well. It means
that we are providing a real time recommendation for Andrea based on its spouse
relationship with Daipayan. The above query took 90 milliseconds to process the
results from the database.

56
The proposed solution for second use is as follows:
5.2.5 Business Scenario 1 for Use Case 2:
FIGURE 5.2.5.1: CYPHER CODE FOR SECOND USE CASE (SCENARIO 1).
The above cypher query will run an Overlap Similarity Algorithm on the Open
Source Yelp dataset. This algorithm computes the overlap between two sets of data.
I am initially trying to fetch from the database the list of businesses which are in
some corresponding categories. Then, I am calling the Overlap Similarity Algorithm
which takes streaming data. The data is collected in two sets of business and category
with their corresponding ids and finally stored as a Map structure in data field, which
has been passed as argument to the Overlap Similarity Algorithm.
Next, I am returning a stream of node pairs which the Business Names as item1 &
item2, along with their intersection and overlap similarities. Also, count1 & count2
provides the total count for businesses for both node pairs. Finally, Overlap
Similarities is listed in descending order & result list is limited to 25 records.
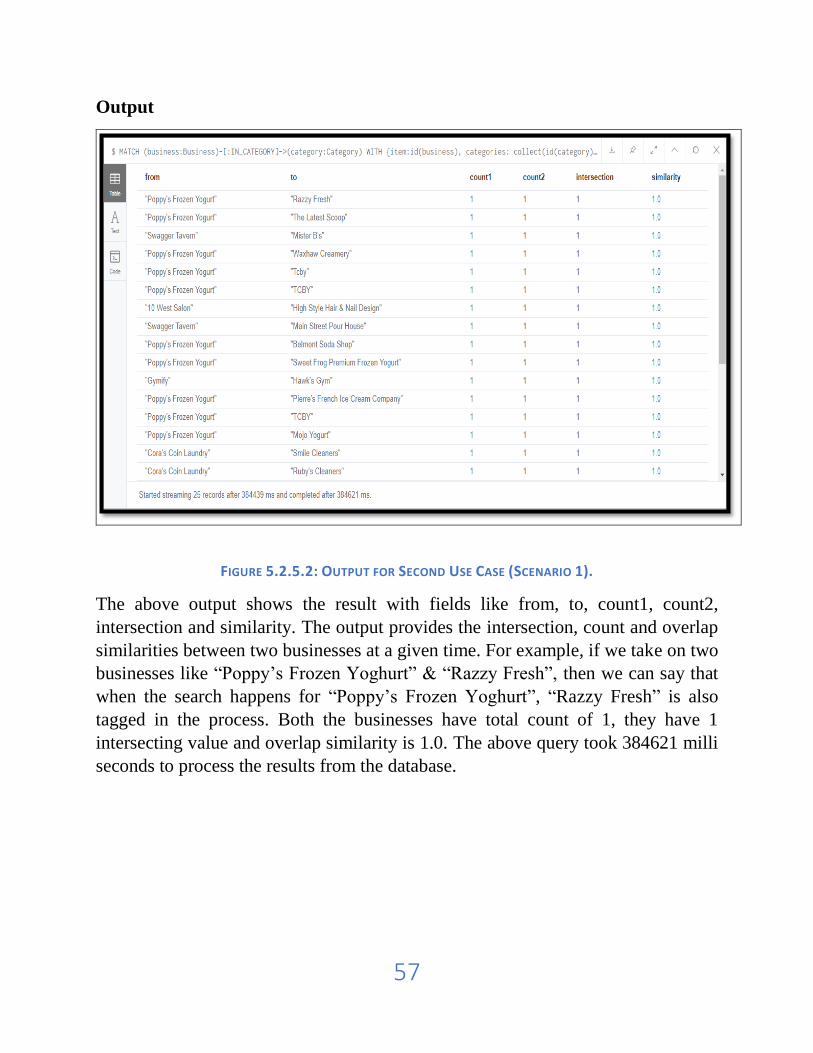
57
Output
FIGURE 5.2.5.2: OUTPUT FOR SECOND USE CASE (SCENARIO 1).
The above output shows the result with fields like from, to, count1, count2,
intersection and similarity. The output provides the intersection, count and overlap
similarities between two businesses at a given time. For example, if we take on two
businesses like “Poppy’s Frozen Yoghurt” & “Razzy Fresh”, then we can say that
when the search happens for “Poppy’s Frozen Yoghurt”, “Razzy Fresh” is also
tagged in the process. Both the businesses have total count of 1, they have 1
intersecting value and overlap similarity is 1.0. The above query took 384621 milli
seconds to process the results from the database.

58
5.2.6 Business Scenario 2 for Use Case 2:
FIGURE 5.2.6.1: CYPHER CODE FOR SECOND USE CASE (SCENARIO 2).
The above cypher query initially performs a full graph traversal from node Review
to node City. Then, check for the condition for review stars which are greater than
3. Then, total count of reviews and average of review stars is calculated. Finally, the
query will return 10 records containing Business Name, Category Name, City Name,
Total Reviews, Review Stars and Average Rating. The output is order by Total
Reviews in descending order.

59
Output
FIGURE 5.2.6.2: OUTPUT FOR SECOND USE CASE (SCENARIO 2).
The above output shows fields like Business Name, Category Name, City Name,
Total Reviews, Review Stars and Average Rating The output provides the list of top
ten businesses with the condition that review stars are greater than 3. It also lists the
corresponding Category Names & City Names for those businesses. In the above
list, “Cashbah” is positioned at Number 1 Business, having the highest number of
Total Reviews of 3 followed by “Passport Photo” which has also same number of
Total Reviews. The above query took 98 milliseconds to process the results from the
database.

60
5.2.7 Business Scenario 3 for Use Case 2:
FIGURE 5.2.7.1: CYPHER CODE FOR SECOND USE CASE (SCENARIO 3).
The above cypher query will run the PageRank Algorithm on the Open Source Yelp
dataset.
In the PageRank Algorithm, I am calling in the PageRank function, the business
which are linked to corresponding category and returning Node’s name as Business
Name and Page Rank Score for each business scanned in the database. The output is
displayed in descending order by score and it is limited to 100 records.

61
Output
FIGURE 5.2.7.2: OUTPUT FOR SECOND USE CASE (SCENARIO 3).
The output provides the list of business and page rank score. A higher PageRank
Score indicates that business is having more degree centralities than other business.
It also provides that these businesses are more popular than others and could be
easily used in recommendations. The above query took 122 milliseconds to process
the results from the database.
5.3 Data Profiling or Statistical Analysis for Graph Database (Neo4j)
This section provides the data profiling or statistical analysis for the graph database
(Neo4j). It will provide a list of cypher queries used for performing data profiling
statistical data analysis in Neo4j. Through data profiling which is one of the
extensive used methodology in the relational database space, we can easily analysis
for the structure, contents and meta data of the data source. Since, Neo4j is one of
the best databases in terms of connected data and handles massive amount of data,
data profiling will provide us better knowledge of the underlying data, hidden
patterns can be identified, and the query performance could also be enhanced to a
much higher level.

62
To show the graph data model
CALL db.schema()
Show existing constrains and indexes
:schema

63
Show the types of relationships
CALL db.relationshipTypes()
Show all labels or types of nodes
CALL db.labels()

64
Count all the nodes
MATCH (n) RETURN count(n)
MATCH (n:Business) RETURN
count(n)
MATCH (n:Category) RETURN
count(n)
MATCH (n:Review) RETURN count(n)
MATCH (n:User) RETURN count(n)
MATCH (n:City) RETURN count(n)
MATCH (n:Game) RETURN
count(n)

65
Count all the relationships
MATCH ()-[r]->() RETURN count(*)
MATCH (:Business)-
[:IN_CATEGORY]->(:Category)
RETURN count(*)
MATCH (:Business)-[:IN_CITY]-
(:City) RETURN count(*)
MATCH (:Review)-[:REVIEWS]-
>(:Business) RETURN count(*)
MATCH (:User)-[:WROTE]-
>(:Review) RETURN count(*)
MATCH (:User)-[:LIKES]->(:Game)
RETURN count(*)
MATCH (:User)-[:FRIENDS]-
>(:User) RETURN count(*)
MATCH (:User)-[:SPOUSE]->(:User)
RETURN count(*)

66
Show data storage sizes
:sysinfo
Count nodes by their labels/types
MATCH (n) RETURN labels(n) AS NodeType, count(n) AS NumberOfNodes

67
Lists all properties of a node
MATCH (b:Business) RETURN keys(b) LIMIT 1
Lists all properties of a relationship
MATCH ()-[t:IN_CATEGORY]->() RETURN keys(b) LIMIT 1
Calculate the uniqueness of a property
MATCH (b:Business)
RETURN count(DISTINCT b.name) AS DistinctName,
count(b.name) AS TotalUser,
100*count(DISTINCT b.name)/count(b.name) AS Uniqueness
Calculate Min, Max, Average and Standard Deviation of the values of a
property
MATCH (r:Review)
RETURN min(r.stars) AS MinStars,
max(r.stars) AS MaxStars,

68
avg(r.stars) AS AvgStars,
stDev(r.stars) AS StdDevStars
Count relationships by type
MATCH (u)-[r]-() with type(r) as RelationshipName,
count(r) as RelationshipNumber
RETURN RelationshipName, RelationshipNumber

69
List all the nodes and relationships as well as properties of each
CALL apoc.meta.data()
Lists statistics of nodes and relationships
CALL apoc.meta.stats()

70
Lists meta data for all node labels, relationship types and properties
CALL apoc.meta.schema()
5.4 Conclusion
I can conclude by saying that the Findings obtained from the research has been
explained in a detailed manner. It proposes the feasible solution for the two business
use cases provided by Neo4j. Thorough data analysis is done using the Open Source
Yelp Dataset with the objective to showcase the technical implementation of
different Graph Algorithms for building a real time recommendation system in
Neo4j. Also, a comprehensive data profiling or statistical analysis of the graph
database (Neo4j) for the Yelp Dataset as per the Graph Data Model is explained. It
provided good insights in the database. The remaining implementation for the use
cases is explained in Appendices.

71
Chapter Six
Discussion
This chapter discusses the objectives of the research and how those objectives were
completed with the help of adopted research methodology and methods. It also
details the various pros and cons of the research done.
The primary objective of the research was to find the proposed solutions for the two
use cases or requirements given by Neo4j. The use cases involved to build a real
time recommendation system using the different graph algorithms in Neo4j. Since,
the graph algorithms were only recently introduced by Neo4j in Q4 2017, I firstly
tried to get some basic technical understanding of the working of these graph
algorithms and Cypher Query Language for writing the cypher queries in Neo4j.
With the help of the previous existing research papers, I got a detailed understanding
on the implementation of graph algorithms in Neo4j for building a real time
recommendation system implemented to date. In these papers, I analyzed the graph
algorithms that were used for solving a complex business problem and identified a
list of graph algorithms that could be implemented to provide solutions for the
research requirements.
The database selected for carrying on this research was Neo4j, since it is considered
as the leader in graph databases currently.
I investigated datasets on which I could apply my research. I decided on the Open
Source Yelp Dataset as it provided a suitable business domain on which to apply the
Graph Analytics required for real time recommendations. The dataset was also
suitably large.
On the Yelp dataset, I started my work by considering some basic cypher queries.
Then, gradually progressed to some moderate queries that involved the loading of
the three json files and the creation of nodes and relationships in Neo4j. Then, I
considered the application of the selected graph algorithms and was able to get some
interesting and valuable insights for the purpose of the research.
While working on the research, the methodological assumptions being described in
previous chapter were being taken into consideration.
The Graph Data Model was built as part of the Modelling process. On top of this
Graph Data Model, the different cypher queries were executed.

72
The proposed solutions for the two use cases with different scenarios were developed
and executed. For the purpose of real time recommendations, three graph algorithms
namely Overlap Similarity, Cosine Similarity and PageRank were implemented. The
results provided by theses algorithms were intuitive and interesting for any user or
business. Since, real time recommendation systems plays a very important role for
the success in terms of revenue growth for any company; the results generated with
the help of different graph algorithms were really very helpful and provided a much
deeper insights in the graph databases. The proposed solutions can be implemented
across any types of business or domain that is using a graph database like Neo4j.
Lastly, I want to conclude by saying that there were some limitations which I faced
in the whole research process. The first limitation was the size of the dataset used.
The main issue was Memory Constraint. I therefore used a Data Sampling
Technique, in which I have taken limited number of records for each JSON file for
loading into Neo4j. The second limitation was to provide deployment in a Cloud
Environment. The main issue was the Time Constraint. I therefore restricted my
research to development and deployment on my local machine. The third limitation
was the loading of CSV files into Neo4j. I developed a Python Script for the
conversion of JSON Files to corresponding CSV Files. The file conversion worked
for business.json, but there were issues for review.json and user.json. The main issue
was the formatting of review.json and user.json resulting from the anonymization
process applied. Also, while loading these files in Python, a memory error was
generated due to the size of both files. As a result, I did the development by loading
the JSON files only.

73
Chapter Seven
Conclusions and Recommendations
This chapter concludes the research work and provides some recommendations for
the future for this research.
It can be seen from the literature review how the studies on the previous research
work helped in gaining an understanding of the graph algorithms that had been
implemented before for different business use cases. The main research emphasis
was on real time recommendation systems. Also, different graph databases in the
previous research provided valuable information but were having some limitations.
For the technical development of the use cases, a Graph Data Model was built; and
the various Cypher queries were written and executed. Finally, the artifact which
contains the proposed solutions of the two requirements was developed. The graph
algorithms implemented provided a much deeper insight into the domain of graph
databases. The results of the different queries were very helpful in providing a real
time recommendation system for any type of business.
As a future recommendation, the implementation for both the use cases can be
deployed in a Cloud Environment, so that the database (Neo4j) can be accessed from
anywhere, with the option of real time access. The Full Yelp Dataset can be loaded
into Cloud Environment, which removes the issue of the Memory limitation
experienced in my local machine development. This research can further be
extended by the implementation of more graph algorithms for various business use
cases, since the number of use cases that could be developed using the Yelp Dataset
is endless and there are huge possibilities in finding new, innovative and intuitive
use cases for Neo4j users.

74
Bibliography
• Bauman, K., Liu, B. and Tuzhilin, A., (2017), “Aspect Based
Recommendations: Recommending Items with the Most Valuable Aspects
Based on User Reviews” pp. 1-9 Available at:
https://www.cs.uic.edu/~liub/publications/FINAL_aspect_recommendations.
pdf (Accessed: 22 Oct 2018).
• Cervantes1, O., Guti´errez1, F., Guti´errez1, E., S´anchez1, A., Rizwan2, M.
and Wanggen2, W. (2015) “A Recommendation Engine based on Social
Metrics” pp. 1-16 Available at: http://ceur-ws.org/Vol-1630/paper2.pdf
(Accessed: 25 Sept 2018).
• ‘Chapter 1. Introduction’, no date. Available at:
https://neo4j.com/docs/graph-algorithms/current/introduction/#introduction-
algorithms (Accessed: 13 Dec 2018)
• Cung, H and Jedidi, M (2014) Implementing a Recommender system with
graph database.” pp. 1-26 Available at:
https://diuf.unifr.ch/main/is/sites/diuf.unifr.ch.main.is/files/documents/stude
nt-projects/Group_3_Cung_Jedidi.pdf (Accessed: 27 Oct 2018).
• Eskandanian, F., Mobasher, B. and Burke, R, (2017), “A Clustering Approach
for Personalizing Diversity in Collaborative Recommender Systems” pp. 1-
10 Available at: http://scds.cdm.depaul.edu/wp-
content/uploads/2017/05/SOCRS_2017_paper_2.pdf (Accessed: 2 Oct
2018).
• ‘Graph and Machine Learning Algorithms’, no date. Available at:
https://neo4j.com/graph-machine-learning-algorithms/ (Accessed: 10 Dec
2018)
• ‘Graph database’ (2018) Available at:
https://en.wikipedia.org/wiki/Graph_database (Accessed: 12 Dec 2018)
• Hu, B., Shi, C., Zhao, W. and Yu, P., (2018), “Leveraging Meta-path based
Context for Top-N Recommendation with A Neural Co-Attention Model”, pp.
1-10) Available at: http://shichuan.org/doc/47.pdf (Accessed: 13 Nov 2018).
• Huang, Z. Chung, W. Ong, T. & Chen, H. (2002) "A Graph-based
Recommender System for Digital Library" pp. 65-73 Available at:
https://www.researchgate.net/publication/220923824_A_graph-
based_recommender_system_for_digital_library (Accessed: 9 Sept 2018).
• Kotu, V. and Deshpande, B. (2015) ‘Predictive Analytics and Data Mining’

75
• ‘neo4j-contrib / neo4j-graph-algorithms’, no date. Available at:
https://github.com/neo4j-contrib/neo4j-graph-
algorithms/blob/3.4/algo/src/main/java/org/neo4j/graphalgo/PageRankProc.j
ava (Accessed: 24 Dec 2018)
• ‘neo4j-contrib / neo4j-graph-algorithms’, no date. Available at:
https://github.com/neo4j-contrib/neo4j-graph-
algorithms/blob/3.4/algo/src/main/java/org/neo4j/graphalgo/similarity/Overl
apProc.java (Accessed: 25 Dec 2018)
• ‘neo4j-contrib / neo4j-graph-algorithms’, no date. Available at:
https://github.com/neo4j-contrib/neo4j-graph-
algorithms/blob/3.4/algo/src/main/java/org/neo4j/graphalgo/similarity/Cosin
eProc.java (Accessed: 26 Dec 2018)
• Pellegrino, J., (2017) “Flexible recommender systems based on graphs” pp.
1-4 Available at: https://hal.archives-ouvertes.fr/hal-01640313/document
(Accessed: 15 Sept 2018).
• ‘Recommender System’, no date. Available at:
https://en.wikipedia.org/wiki/Recommender_system (Accessed: 25 Sept
2018)
• Shams, B. and Haratizadeh, S., (2017) “Graph based Collaborative Ranking”,
pp. 1-30 Available at: https://arxiv.org/ftp/arxiv/papers/1604/1604.03147.pdf
(Accessed: 25 Oct 2018).
• Shearer, C. (2000) 'Journal of Data Warehousing' pp. 13-18.
• Skrasek, J. (2015) "Social Network Recommendation using Graph Databases"
pp. 1-44 Available at: https://is.muni.cz/th/gdt3y/thesis.pdf (Accessed: 25
Sept 2018)
• ‘7.2 The Cosine Similarity algorithm’, no date. Available at:
https://neo4j.com/docs/graph-algorithms/current/algorithms/similarity-
cosine/ (Accessed: 16 Dec 2018)
• ‘7.4 The Overlap Similarity algorithm’, no date. Available at:
https://neo4j.com/docs/graph-algorithms/current/algorithms/similarity-
overlap/ (Accessed: 15 Dec 2018)
• ‘4.1 The PageRank algorithm’, no date. Available at:
https://neo4j.com/docs/graph-algorithms/current/algorithms/page-rank/
(Accessed: 14 Dec 2018)
• ‘What is a Graph Database?’, no date. Available at:
https://neo4j.com/developer/graph-database/ (Accessed: 3 Dec 2018)

76
• Yu, X., Ren, X., Sun, Y., Sturt, B., Khandelwal, U., Gu, Q., Norick, B. and
Han, J. (2013), “Recommendation in Heterogeneous Information Networks
with Implicit User Feedback”, pp. 1-4 Available at:
http://hanj.cs.illinois.edu/pdf/recsys13_xyu.pdf (Accessed: 13 Oct 2018).
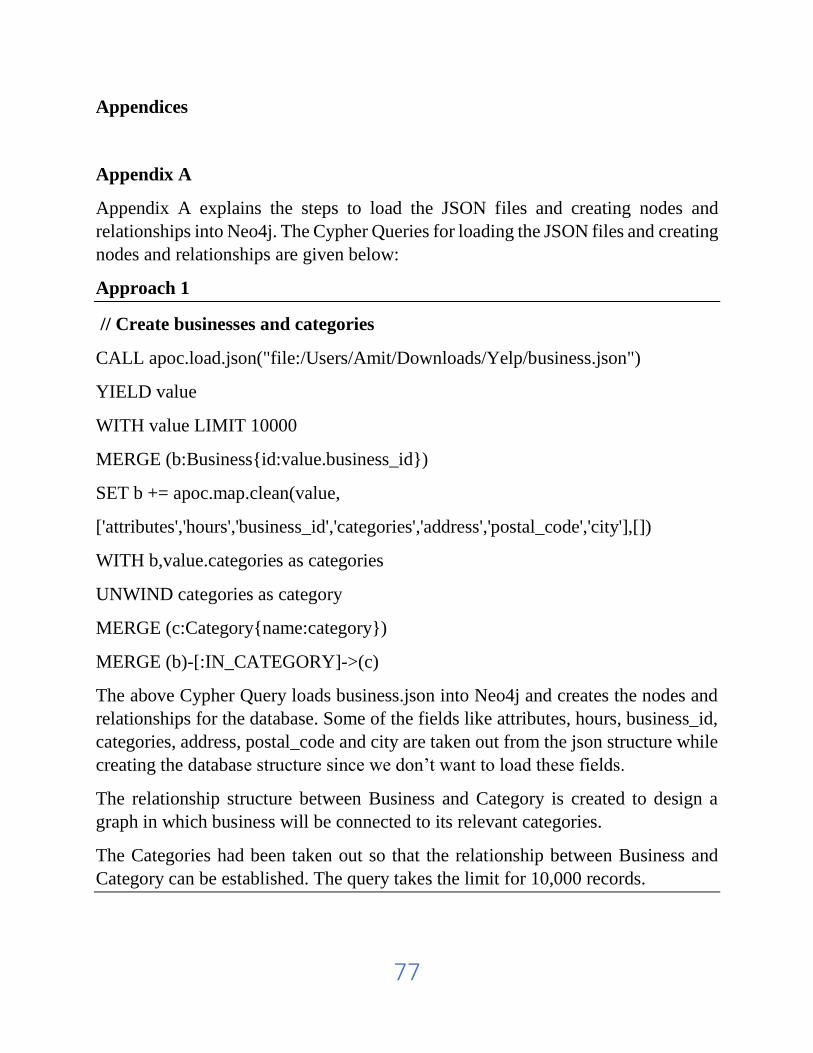
77
Appendices
Appendix A
Appendix A explains the steps to load the JSON files and creating nodes and
relationships into Neo4j. The Cypher Queries for loading the JSON files and creating
nodes and relationships are given below:
Approach 1
// Create businesses and categories
CALL apoc.load.json("file:/Users/Amit/Downloads/Yelp/business.json")
YIELD value
WITH value LIMIT 10000
MERGE (b:Business{id:value.business_id})
SET b += apoc.map.clean(value,
['attributes','hours','business_id','categories','address','postal_code','city'],[])
WITH b,value.categories as categories
UNWIND categories as category
MERGE (c:Category{name:category})
MERGE (b)-[:IN_CATEGORY]->(c)
The above Cypher Query loads business.json into Neo4j and creates the nodes and
relationships for the database. Some of the fields like attributes, hours, business_id,
categories, address, postal_code and city are taken out from the json structure while
creating the database structure since we don’t want to load these fields.
The relationship structure between Business and Category is created to design a
graph in which business will be connected to its relevant categories.
The Categories had been taken out so that the relationship between Business and
Category can be established. The query takes the limit for 10,000 records.

78
// Create users
CALL apoc.load.json('file:/Users/Amit/Downloads/Yelp/user.json')
YIELD value
WITH value LIMIT 10000
MERGE (u:User {id:value.user_id})
SET u += apoc.map.clean(value, ['friends','user_id'],[])
WITH u, value.friends as friends
UNWIND friends as friend
MERGE (u1:User {id:friend})
MERGE (u)-[:FRIENDS]-(u1)
The above Cypher Query loads user.json in Neo4j and creates the nodes and
relationships for the database. Some of the fields like friends and user_id is taken
out from the json structure while creating the database structure since we don’t want
to load these fields.
The relationship structure between User and different user is created to design a
graph in which one user will be connected to other users through friend’s
relationship. In this way, we are creating a User’s Social Network in which users
form a friend’s network. The query takes the limit for 10,000 records.
// Create reviews
CALL apoc.load.json('file:/Users/Amit/Downloads/Yelp/review.json')
YIELD value
WITH value LIMIT 10000
MERGE (b:Business {id:value.business_id})
MERGE (u:User {id:value.user_id})
MERGE (r:Review {id:value.review_id})
MERGE (u)-[:WROTE]->(r)
MERGE (r)-[:REVIEWS]->(b)

79
SET r += apoc.map.clean(value, ['business_id','user_id','review_id'],[])
The above Cypher Query loads review.json in Neo4j and creates the nodes and
relationships for the database. Some of the fields like business_id, user_id and
review_id is taken out from the json structure while creating the database structure
since we don’t want to load these fields.
The relationship structure between User and Review is created to design a graph in
which user will be connected to different reviews.
The relationship structure between Review and Business is created to design a graph
in which review will be connected to different business. The query takes the limit
for 10,000 records.
// Create cities
CALL apoc.load.json('file:/Users/Amit/Downloads/Yelp/business.json')
YIELD value
WITH value LIMIT 10000
MERGE (b:Business{id:value.business_id})
WITH b,value.city as city
MERGE (c:City {name:city})
MERGE (b)-[:IN_CITY]->(c)
The above Cypher Query loads business.json into Neo4j and creating the nodes and
relationships for the database.
The relationship structure between Business and City is created to design a graph in
which business will be connected to its relevant cities. The query takes the limit for
10,000 records.
Approach 2
The below cypher queries provide more efficient ways as compared to the previous
queries since these queries are run in a batch mode with batch size of 500 records.
The limitations of above approach are we are running everything Single threaded
and Transaction state must fit in RAM. In the below approach, we are splitting up a
transaction into batches and running those batches in parallel. This helps in
drastically reducing the execution time for these queries.

80
// Create business nodes using apoc.periodic.iterate
CALL apoc.periodic.iterate(
"CALL apoc.load.json('file:/Users/Amit/Downloads/Yelp/business.json')
YIELD value
WITH value LIMIT 10000
RETURN value",
"MERGE (b:Business {id:value.business_id})
SET b += apoc.map.clean(value,
['attributes','hours','business_id','categories','address','postal_code','city'],
[])",
{iterateList: true, batchSize:500, parallel: true})
// Create categories nodes with relationship with business nodes using
apoc.periodic.iterate
CALL apoc.periodic.iterate(
"CALL apoc.load.json('file:/Users/Amit/Downloads/Yelp/business.json')
YIELD value
WITH value LIMIT 10000
RETURN value",
"MATCH (b:Business{id:value.business_id})
WITH b,value.categories as categories
UNWIND categories as category
MERGE (c:Category {name:category})
MERGE (b)-[:IN_CATEGORY]->(c)",
{iterateList: true, batchSize:500})
// Create users nodes using apoc.periodic.iterate
CALL apoc.periodic.iterate(
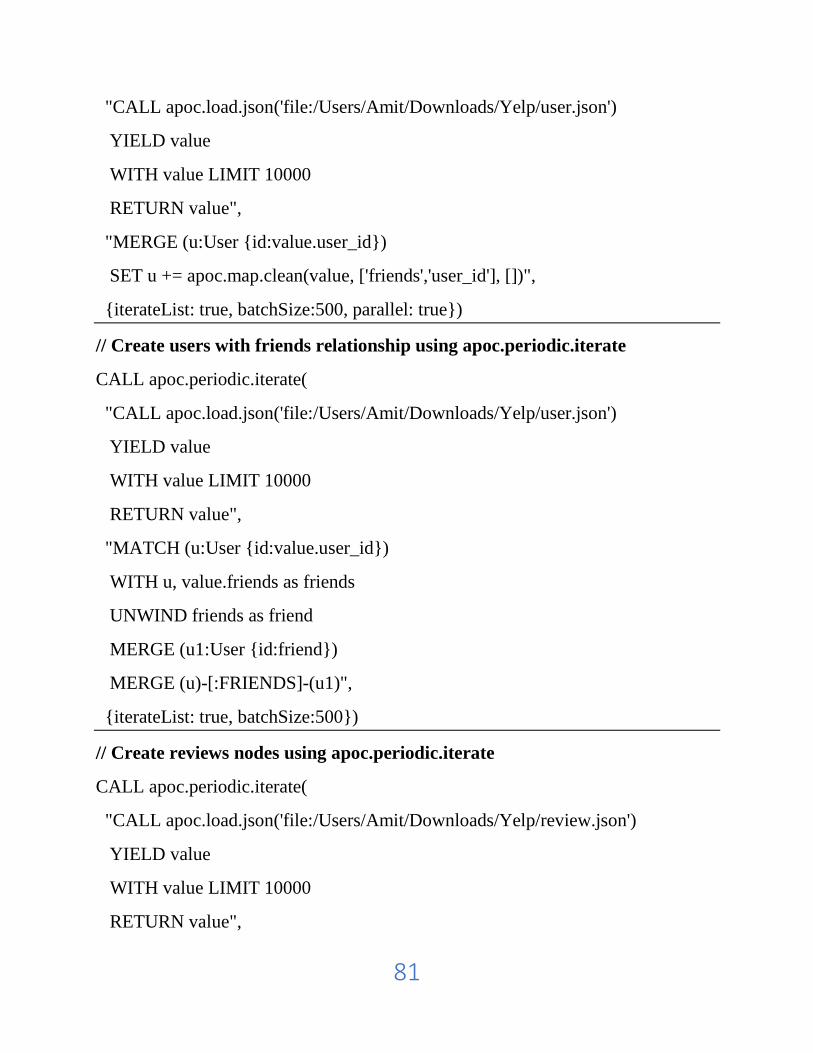
81
"CALL apoc.load.json('file:/Users/Amit/Downloads/Yelp/user.json')
YIELD value
WITH value LIMIT 10000
RETURN value",
"MERGE (u:User {id:value.user_id})
SET u += apoc.map.clean(value, ['friends','user_id'], [])",
{iterateList: true, batchSize:500, parallel: true})
// Create users with friends relationship using apoc.periodic.iterate
CALL apoc.periodic.iterate(
"CALL apoc.load.json('file:/Users/Amit/Downloads/Yelp/user.json')
YIELD value
WITH value LIMIT 10000
RETURN value",
"MATCH (u:User {id:value.user_id})
WITH u, value.friends as friends
UNWIND friends as friend
MERGE (u1:User {id:friend})
MERGE (u)-[:FRIENDS]-(u1)",
{iterateList: true, batchSize:500})
// Create reviews nodes using apoc.periodic.iterate
CALL apoc.periodic.iterate(
"CALL apoc.load.json('file:/Users/Amit/Downloads/Yelp/review.json')
YIELD value
WITH value LIMIT 10000
RETURN value",

82
"MERGE (b:Business {id:value.business_id})
MERGE (u:User {id:value.user_id})
MERGE (r:Review {id:value.review_id})",
{iterateList: true, batchSize:500, parallel: true})
// Create relationship between users nodes and reviews nodes & reviews nodes
and business nodes using apoc.periodic.iterate
CALL apoc.periodic.iterate(
"CALL apoc.load.json('file:/Users/reAmit/Downloads/Yelp/review.json')
YIELD value
WITH value LIMIT 10000
RETURN value",
"MATCH (b:Business {id:value.business_id})
MATCH (u:User {id:value.user_id})
MATCH (r:Review {id:value.review_id})
MERGE (u)-[:WROTE]->(r)
MERGE (r)-[:REVIEWS]->(b)
SET r += apoc.map.clean(value, ['business_id','user_id','review_id'], [])",
{iterateList: true, batchSize:500})
// Create cities nodes with relationship with business nodes using
apoc.periodic.iterate
CALL apoc.periodic.iterate(
"CALL apoc.load.json('file:/Users/Amit/Downloads/Yelp/business.json')
YIELD value
WITH value LIMIT 10000
RETURN value",
"MATCH (b:Business{id:value.business_id})

83
WITH b,value.cities as cities
MERGE (c:City {name:city})
MERGE (b)-[:IN_CITY]->(c)",
{iterateList: true, batchSize:500})
Appendix B
Appendix B outlines the cypher queries written for proposing the solutions for First
Use Case provided by Neo4j. It provides the different scenarios for the use case.
// Below data structure is created to generate meaningful graph structure.
// FRIENDS relationship is created between users on top of existing graph data
model.
MATCH (n:User {id:"XvLBr-9smbI0m_a7dXtB7w"}), (m:User
{id:"QPT4Ud4H5sJVr68yXhoWFw"}) MERGE (n)-[r:FRIENDS]->(m)
MATCH (n:User {id:"XvLBr-9smbI0m_a7dXtB7w"}), (m:User
{id:"i5YitlHZpf0B3R0s_8NVuw"}) MERGE (n)-[r:FRIENDS]->(m)
MATCH (n:User {id:"XvLBr-9smbI0m_a7dXtB7w"}), (m:User
{id:"s4FoIXE_LSGviTHBe8dmcg"}) MERGE (n)-[r:FRIENDS]->(m)
MATCH (n:User {id:"XvLBr-9smbI0m_a7dXtB7w"}), (m:User
{id:"ZcsZdHLiJGVvDHVjeTYYnQ"}) MERGE (n)-[r:FRIENDS]->(m)
MATCH (n:User {id:"XvLBr-9smbI0m_a7dXtB7w"}), (m:User
{id:"h3p6aeVL7vrafSOM50SsCg"}) MERGE (n)-[r:FRIENDS]->(m)
MATCH (n:User {id:"XvLBr-9smbI0m_a7dXtB7w"}), (m:User
{id:"EbJMotYYkq-iq-v1u8wCYA"}) MERGE (n)-[r:FRIENDS]->(m)
MATCH (n:User {id:"XvLBr-9smbI0m_a7dXtB7w"}), (m:User
{id:"nnB0AE1Cxp_0154xkhXelw"}) MERGE (n)-[r:FRIENDS]->(m)
MATCH (n:User {id:"XvLBr-9smbI0m_a7dXtB7w"}), (m:User
{id:"XoEnrhtJc2pcdlQ09d8Oug"}) MERGE (n)-[r:FRIENDS]->(m)

84
// SPOUSE relationship is created between different users on top of existing graph
data model.
MATCH (n:User {id:"XvLBr-9smbI0m_a7dXtB7w"}), (m:User
{id:"SgYDjNCecPidsRB_su5-tw"}) MERGE (n)-[r:SPOUSE]->(m)
MATCH (n:User {id:"XvLBr-9smbI0m_a7dXtB7w"}), (m:User
{id:"QDQTMYp2NocktWN5fHwfIg"}) MERGE (n)-[r:SPOUSE]->(m)
MATCH (n:User {id:"i5YitlHZpf0B3R0s_8NVuw"}), (m:User
{id:"AUWHIxgZuL2h4svVLdUZaA"}) MERGE (n)-[r:SPOUSE]->(m)
MATCH (n:User {id:"s4FoIXE_LSGviTHBe8dmcg"}), (m:User
{id:"jlCxOfVf_Ff4YgGov8Tm1g"}) MERGE (n)-[r:SPOUSE]->(m)
MATCH (n:User {id:"ZcsZdHLiJGVvDHVjeTYYnQ"}), (m:User
{id:"9u9a9JakFNHZksptLKPUrw"}) MERGE (n)-[r:SPOUSE]->(m)
MATCH (n:User {id:"h3p6aeVL7vrafSOM50SsCg"}), (m:User
{id:"NfE1uHFWzzMyXkgBeEuR1A"}) MERGE (n)-[r:SPOUSE]->(m)
MATCH (n:User {id:"EbJMotYYkq-iq-v1u8wCYA"}), (m:User
{id:"RiBVI6UgLjfpA4EQ1SWDzA"}) MERGE (n)-[r:SPOUSE]->(m)
MATCH (n:User {id:"nnB0AE1Cxp_0154xkhXelw"}), (m:User {id:"kPAyx-
80ZIFKVy6uQ71I6Q"}) MERGE (n)-[r:SPOUSE]->(m)

85
Cypher Query 1 for Use Case 1:
MATCH (u:User {id:"XvLBr-9smbI0m_a7dXtB7w"})-[:FRIENDS]->(u1:User),
(:User)-[:WROTE]->(r:Review),
(r:Review)-[:REVIEWS]->(b:Business),
(b:Business)-[:IN_CATEGORY]->(c:Category)
RETURN u.name AS FirstUser, u1.name AS SecondUser, b.name AS
BusinessName, c.name AS CategoryName, r.stars AS ReviewStars LIMIT 10
Output
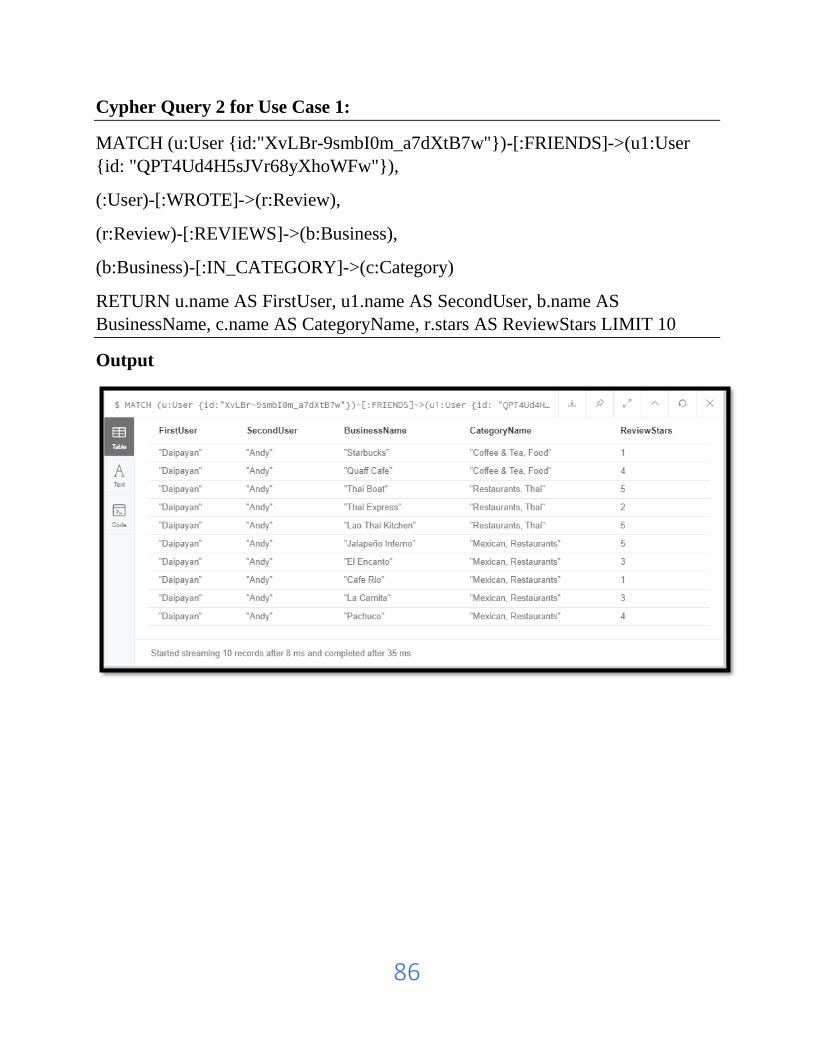
86
Cypher Query 2 for Use Case 1:
MATCH (u:User {id:"XvLBr-9smbI0m_a7dXtB7w"})-[:FRIENDS]->(u1:User
{id: "QPT4Ud4H5sJVr68yXhoWFw"}),
(:User)-[:WROTE]->(r:Review),
(r:Review)-[:REVIEWS]->(b:Business),
(b:Business)-[:IN_CATEGORY]->(c:Category)
RETURN u.name AS FirstUser, u1.name AS SecondUser, b.name AS
BusinessName, c.name AS CategoryName, r.stars AS ReviewStars LIMIT 10
Output

87
Cypher Query 3 for Use Case 1:
MATCH (u:User {id:"XvLBr-9smbI0m_a7dXtB7w"})-[:FRIENDS]->(u1:User
{id: "QPT4Ud4H5sJVr68yXhoWFw"}),
(:User)-[:WROTE]->(r:Review),
(r:Review)-[:REVIEWS]->(b:Business),
(b:Business)-[:IN_CATEGORY]->(c:Category)
WHERE r.stars > 4 AND c.name=~'Restau.*'
RETURN u.name AS FirstUser, u1.name AS SecondUser, b.name AS
BusinessName, c.name AS CategoryName, r.stars AS ReviewStars LIMIT 10
Output

88
Cypher Query 4 for Use Case 1:
MATCH (u:User {id:"XvLBr-9smbI0m_a7dXtB7w"})-[:FRIENDS]->(u1:User
{id: "QPT4Ud4H5sJVr68yXhoWFw"}),
(:User)-[:WROTE]->(r:Review),
(r:Review)-[:REVIEWS]->(b:Business),
(b:Business)-[:IN_CATEGORY]->(c:Category)
WHERE r.stars > 4 AND c.name=~'Restau.*'
RETURN u.name AS FirstUser, u1.name AS SecondUser, b.name AS
BusinessName, c.name AS CategoryName LIMIT 10
Output

89
Cypher Query 5 for Use Case 1:
MATCH (u:User {id:"XvLBr-9smbI0m_a7dXtB7w"})-[:FRIENDS]->(u1:User
{id: "QPT4Ud4H5sJVr68yXhoWFw"}),
(:User)-[:WROTE]->(r:Review),
(r:Review)-[:REVIEWS]->(b:Business),
(b:Business)-[:IN_CATEGORY]->(c:Category)
WHERE r.stars > 4 AND c.name=~'Restau.*'
RETURN u.name AS FirstUser, u1.name AS SecondUser, b.name AS
BusinessName, c.name AS CategoryName, r.stars AS ReviewStars LIMIT 10
Output

90
Cypher Query 6 for Use Case 1:
MATCH (u:User {id:"XvLBr-9smbI0m_a7dXtB7w"})-[:FRIENDS]->(u1:User
{id: "QPT4Ud4H5sJVr68yXhoWFw"}),
(:User)-[:WROTE]->(r:Review),
(r:Review)-[:REVIEWS]->(b:Business),
(b:Business)-[:IN_CATEGORY]->(c:Category)
WHERE r.stars > 4 AND c.name CONTAINS "Mexican"
RETURN u.name AS FirstUser, u1.name AS SecondUser, b.name AS
BusinessName, c.name AS CategoryName, r.stars AS ReviewStars LIMIT 10
Output

91
Cypher Query 7 for Use Case 1:
// For Spouse
MATCH (u:User)-[:SPOUSE]->(u1:User),
(:User)-[:WROTE]->(r:Review),
(r:Review)-[:REVIEWS]->(b:Business),
(b:Business)-[:IN_CATEGORY]->(c:Category)
WHERE r.stars > 4 AND c.name CONTAINS "Mexican"
RETURN u.name AS FirstUser, u1.name AS SecondUser, b.name AS
BusinessName, c.name AS CategoryName, r.stars AS ReviewStars LIMIT 10
Output

92
Cypher Query 8 for Use Case 1:
MATCH (u:User)-[:SPOUSE]->(u1:User),
(:User)-[:WROTE]->(r:Review),
(r:Review)-[:REVIEWS]->(b:Business),
(b:Business)-[:IN_CATEGORY]->(c:Category)
WHERE r.stars > 4 AND c.name=~'Restau.*'
RETURN u.name AS FirstUser, u1.name AS SecondUser, b.name AS
BusinessName, c.name AS CategoryName, r.stars AS ReviewStars LIMIT 10
Output

93
Appendix C
Appendix C outlines the cypher queries written for proposing the solutions for
Second Use Case provided by Neo4j. It provides the different scenarios for the use
case.
Cypher Query 1 for Use Case 2:
MATCH (business:Business)-[:IN_CATEGORY]->(category:Category)
WITH {item:id(business), categories: collect(id(category))} as userData
With collect(userData) as data
CALL algo.similarity.overlap.stream(data)
YIELD item1,item2, count1,count2, intersection, similarity
RETURN algo.getNodeById(item1).name AS from,
algo.getNodeById(item2).name AS to,
count1, count2, intersection, similarity
ORDER BY similarity DESC
LIMIT 25

94
Output

95
Cypher Query 2 for Use Case 2:
MATCH (review:Review)-[:REVIEWS]->(business:Business),
(business)-[:IN_CATEGORY]->(c:Category),
(business)-[:IN_CITY]->(cc:City)
WHERE review.stars > 3
WITH business, count(*) AS TotalReviews, avg(review.stars) AS averageRating,
review.stars AS ReviewStars,c.name AS CategoryName, cc.name AS CityName
ORDER BY TotalReviews DESC LIMIT 10
RETURN business.name AS BusinessName, CategoryName, CityName,
TotalReviews, ReviewStars, apoc.math.round(averageRating,2) AS AverageRating
Output
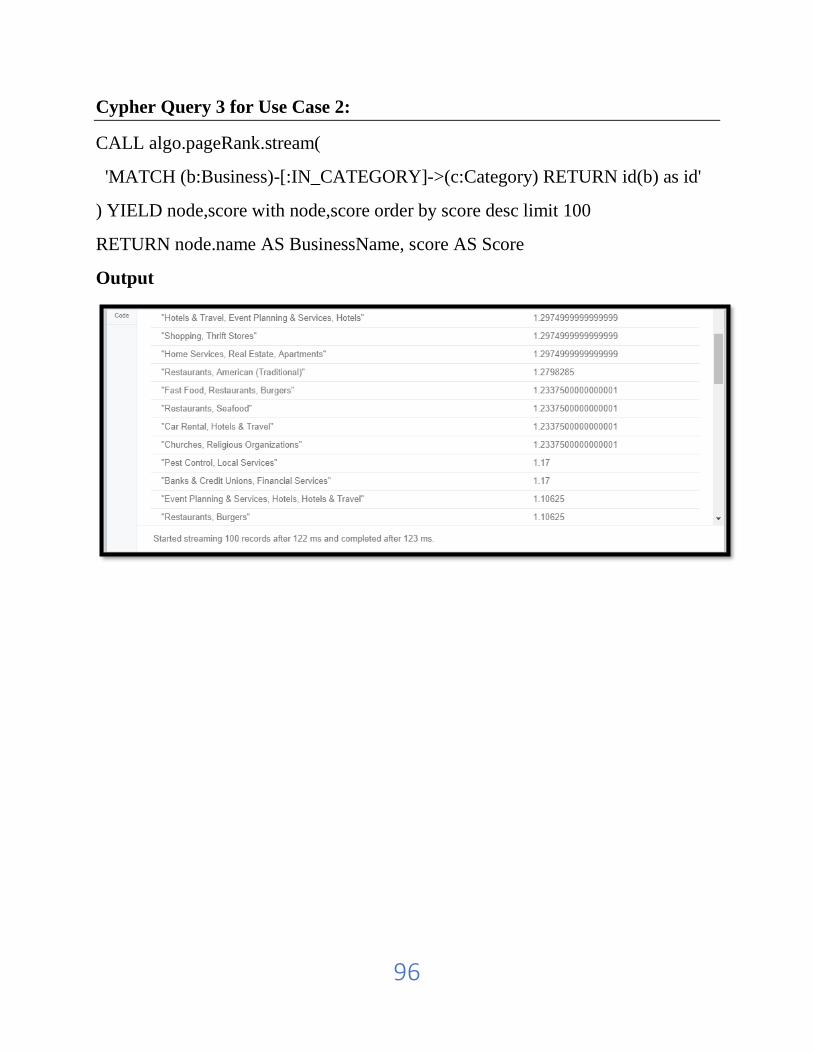
96
Cypher Query 3 for Use Case 2:
CALL algo.pageRank.stream(
'MATCH (b:Business)-[:IN_CATEGORY]->(c:Category) RETURN id(b) as id'
) YIELD node,score with node,score order by score desc limit 100
RETURN node.name AS BusinessName, score AS Score
Output

97
Appendix D
Appendix D outlines the basic cypher queries written for the loading of the three
JSON files.
// Loading user.json
CALL apoc.load.json("file:/Users/Amit/Downloads/YelpDataset/user.json")
YIELD value AS user
RETURN user
LIMIT 10
Output

98
// Loading business.json
CALL apoc.load.json("file:/Users/Amit/Downloads/YelpDataset/business.json")
YIELD value AS business
RETURN business
LIMIT 10
Output

99
// Loading review.json
CALL apoc.load.json("file:/Users/Amit/Downloads/YelpDataset/review.json")
YIELD value AS review
RETURN review
LIMIT 10
Output

100
Appendix E
Appendix E provides an overview for the load of CSV files and creating nodes and
relationships into Neo4j. These queries demonstrate the load of CSV files but were
not implemented in the research due to some limitations. The Cypher Queries for
loading the CSV files and creating nodes and relationships are given below:
Cypher Query 1:
// Loading business.csv
LOAD CSV WITH HEADERS FROM "file:///C:/business.csv" AS business
WITH business
RETURN business
LIMIT 10
Output

101
Cypher Query 2:
// Loading review.csv
LOAD CSV WITH HEADERS FROM "file:///C:/review.csv" AS review
WITH review
RETURN review
LIMIT 10
Output

102
Cypher Query 3:
// Loading user.csv
LOAD CSV WITH HEADERS FROM "file:///C:/user.csv" AS user
WITH user
RETURN user
LIMIT 10
Output

103
Cypher Query 4:
// Loading business.csv and create business nodes
LOAD CSV WITH HEADERS FROM "file:///C:/business.csv" AS row
WITH row LIMIT 10000
MERGE (b:Business {business_id: row.business_id})
ON CREATE SET b.name = row.name
Cypher Query 5:
// Loading user.csv and create user nodes
LOAD CSV WITH HEADERS FROM "file:///C:/user.csv" AS row
WITH row LIMIT 10000
MERGE (b:User {user_id: row.user_id})
ON CREATE SET b.name = row.name
Cypher Query 6:
// Loading review.csv and create review nodes and create relationship between
user & review and review & business
LOAD CSV WITH HEADERS FROM "file:///C:/review.csv" AS row
MATCH (u:User {user_id: row.user_id})
MATCH (b:Business {business_id: row.business_id})
CREATE (r:Review {review_id: row.review_id})
SET r.stars = row.stars, r.text = row.text
CREATE (u)-[:WROTE]->(r)
CREATE (r)-[:REVIEW_OF]->(b)

104
Appendix F
Appendix F describes the cypher queries written for the creation of nodes and
relationships for businesses and categories on top of the existing graph data model.
It also shows the Cypher query for implementation of Overlap Similarity Algorithm
which describes the intersection, count and overlap similarities between two
categories at a given time. It acts as a use case for building a real time
recommendation system in which we are finding recommendations for categories.
MATCH (american:Business {name:'American Cake House Ltd'}),
(mexican:Category {name: "Mexican"}) MERGE (american)-
[r:IN_CATEGORY]->(mexican)
MATCH (american:Business {name:'American Cake House Ltd'}),
(bakeries:Category {name: "Bakeries"}) MERGE (american)-
[r:IN_CATEGORY]->(bakeries)
MATCH (american:Business {name:'American Cake House Ltd'}), (thai:Category
{name: "Thai"}) MERGE (american)-[r:IN_CATEGORY]->(thai)
MATCH (american:Business {name:'American Cake House Ltd'}),
(icecream:Category {name: "Ice Cream"}) MERGE (american)-
[r:IN_CATEGORY]->(icecream)
MATCH (british:Business {name:'British Cake House Ltd'}), (mexican:Category
{name: "Mexican"}) MERGE (british)-[r:IN_CATEGORY]->(mexican)
MATCH (british:Business {name:'British Cake House Ltd'}), (thai:Category
{name: "Thai"}) MERGE (british)-[r:IN_CATEGORY]->(thai)
MATCH (indian:Business {name:'Indian Cake House Ltd'}), (mexican:Category
{name: "Mexican"}) MERGE (indian)-[r:IN_CATEGORY]->(mexican)
MATCH (indian:Business {name:'Indian Cake House Ltd'}), (bakeries:Category
{name: "Bakeries"}) MERGE (indian)-[r:IN_CATEGORY]->(bakeries)
MERGE (indian:Business {name:'Indian Cake House Ltd'}), (icecream:Category
{name: "Ice Cream"}) MERGE (indian)-[r:IN_CATEGORY]->(icecream)

105
Cypher Query showing Overlap Similarity Algorithm:
MATCH (business:Business)-[:IN_CATEGORY]->(category:Category)
WITH {item:id(category), categories: collect(id(business))} as userData
With collect(userData) as data
CALL algo.similarity.overlap.stream(data)
YIELD item1,item2, count1,count2, intersection, similarity
RETURN algo.getNodeById(item1).name AS from,
algo.getNodeById(item2).name AS to,
count1, count2, intersection, similarity
ORDER BY similarity DESC
LIMIT 25
Output

106
Appendix G
Appendix G describes the cypher queries written for the creation of nodes and
relationships for user and game. The relationship created between user and its
preferred game is defined as (User)-[:LIKES]-(Game). This implementation is done
as a separate use case to demonstrate Cosine Similarity Algorithm.
It also shows the Cypher query for implementation of Cosine Similarity Algorithm
which describes the similarities between two categories at a given time. It acts as a
use case for building a real time recommendation system in which we are finding
recommendations for two users who have most similar taste for same game.
CREATE (george:User {name: "George"})
CREATE (john:User {name: "John"})
CREATE (gary:User {name: "Gary"})
CREATE (stephen:User {name: "Stephen"})
CREATE (joe:User {name: "Joe"})
CREATE (cricket:Game {name: "Cricket"})
CREATE (football:Game {name: "Football"})
CREATE (Cycling:Game {name: "Cycling"})
CREATE (tabletennis:Game {name: "Table Tennis"})
CREATE (shooting:Game {name: "Shooting"})
CREATE (kabadi:Game {name: "Kabadi"})
CREATE (boxing:Game {name: "Boxing"})
CREATE (badminton:Game {name: "Badminton"})
CREATE (Polo:Game {name: "Polo"})
MATCH (george:User {name: "George"}), (cricket:Game {name: "Cricket"})
MERGE (george)-[r:LIKES {score: 9}]->(cricket)
MATCH (george:User {name: "George"}), (football:Game {name: "Football"})
MERGE (george)-[r:LIKES {score: 7}]->(football)

107
MATCH (george:User {name: "George"}), (Cycling:Game {name: "Cycling"})
MERGE (george)-[r:LIKES {score: 8}]->(cycling)
MATCH (george:User {name: "George"}), (tabletennis:Game {name: "Table
Tennis"}) MERGE (george)-[r:LIKES {score: 7}]->(tabletennis)
MATCH (george:User {name: "George"}), (shooting:Game {name: "Shooting"})
MERGE (george)-[r:LIKES {score: 5}]->(shooting)
MATCH (george:User {name: "George"}), (kabadi:Game {name: "Kabadi"})
MERGE (george)-[r:LIKES {score: 3}]->(kabadi)
MATCH (george:User {name: "George"}), (boxing:Game {name: "Boxing"})
MERGE (george)-[r:LIKES {score: 6}]->(boxing)
MATCH (john:User {name: "John"}), (badminton:Game {name: "Badminton"})
MERGE (john)-[r:LIKES {score: 5}]->(badminton)
MATCH (john:User {name: "John"}), (football:Game {name: "Football"})
MERGE (john)-[r:LIKES {score: 9}]->(football)
MATCH (john:User {name: "John"}), (shooting:Game {name: "Shooting"})
MERGE (john)-[r:LIKES {score: 7}]->(shooting)
MATCH (gary:User {name: "Gary"}), (badminton:Game {name: "Badminton"})
MERGE (gary)-[r:LIKES {score: 4}]->(badminton)
MATCH (gary:User {name: "Gary"}), (football:Game {name: "Football"})
MERGE (gary)-[r:LIKES {score: 9}]->(football)
MATCH (gary:User {name: "Gary"}), (shooting:Game {name: "Shooting"})
MERGE (gary)-[r:LIKES {score: 2}]->(shooting)
MATCH (gary:User {name: "Gary"}), (cricket:Game {name: "Cricket"}) MERGE
(gary)-[r:LIKES {score: 6}]->(cricket)
MATCH (stephen:User {name: "Stephen"}), (Polo:Game {name: "Polo"})
MERGE (stephen)-[r:LIKES {score: 6}]->(polo)
MATCH (stephen:User {name: "Stephen"}), (football:Game {name: "Football"})
MERGE (stephen)-[r:LIKES {score: 3}]->(football)
MATCH (stephen:User {name: "Stephen"}), (tabletennis:Game {name: "Table
Tennis"}) MERGE (stephen)-[r:LIKES {score: 5}]->(tabletennis)

108
MATCH (joe:User {name: "Joe"}), (Polo:Game {name: "Polo"}) MERGE (joe)-
[r:LIKES {score: 9}]->(polo)
MATCH (joe:User {name: "Joe"}), (kabadi:Game {name: "Kabadi"}) MERGE
(joe)-[r:LIKES {score: 6}]->(kabadi)
MATCH (joe:User {name: "Joe"}), (cricket:Game {name: "Cricket"}) MERGE
(joe)-[r:LIKES {score: 4}]->(cricket)
Cypher Query showing Cosine Similarity Algorithm:
MATCH (u:User), (g:Game)
OPTIONAL MATCH (u)-[likes:LIKES]->(g)
WITH {item:id(u), weights: collect(coalesce(likes.score, 0))} as userData
WITH collect(userData) as data
CALL algo.similarity.cosine.stream(data)
YIELD item1, item2, count1, count2, similarity
RETURN algo.getNodeById(item1).name AS from,
algo.getNodeById(item2).name AS to, similarity
ORDER BY similarity DESC LIMIT 10
Output

109
Appendix H
Appendix H describes the Python Script written for the conversion of JSON files
into corresponding CSV files. I have used PyCharm Community Edition as the IDE
for this development.
# Converting Business JSON file into CSV file
import json
import csv
YELP_BUSINESS_FILE = "C:/Users/Amit/Downloads/YelpNew/business.json"
with open(YELP_BUSINESS_FILE, "r", encoding='utf-8') as file:
with open(YELP_BUSINESS_FILE + '.csv', 'w', encoding='utf-8') as csvfile:
writer = csv.writer(csvfile, escapechar='\\', quotechar='"',
quoting=csv.QUOTE_ALL)
writer.writerow(json.loads(file.readline()).keys())
for line in file:
l = []
item = json.loads(line)
for k,i in item.items():
# Represent a list of items as a semicolon delimitted string
if type(i) == list:
l.append(';'.join(i))
# Aggressive quoting and escape char handling
if type(i) == str:
l.append(i.replace('"', '').replace('\\', ''))
else:
l.append(i)
writer.writerow(l)
The above Python Script takes the business.json file and convert it to
business.json.csv file.
# Converting User JSON file into CSV file
import json
import csv
YELP_USER_FILE = "C:/Users/Amit/Downloads/YelpNew/user.json"
with open(YELP_USER_FILE, "r", encoding='utf-8') as file:
with open(YELP_USER_FILE + '.csv', 'w', encoding='utf-8') as csvfile:
writer = csv.writer(csvfile, escapechar='\\', quotechar='"', quoting=csv.QUOTE_ALL)
writer.writerow(json.loads(file.readline()).keys())
for line in file:
l = []
item = json.loads(line)
for k,i in item.items():
# Represent a list of items as a semicolon delimitted string
if type(i) == list:
l.append(';'.join(i))
# Aggressive quoting and escape char handling
if type(i) == str:
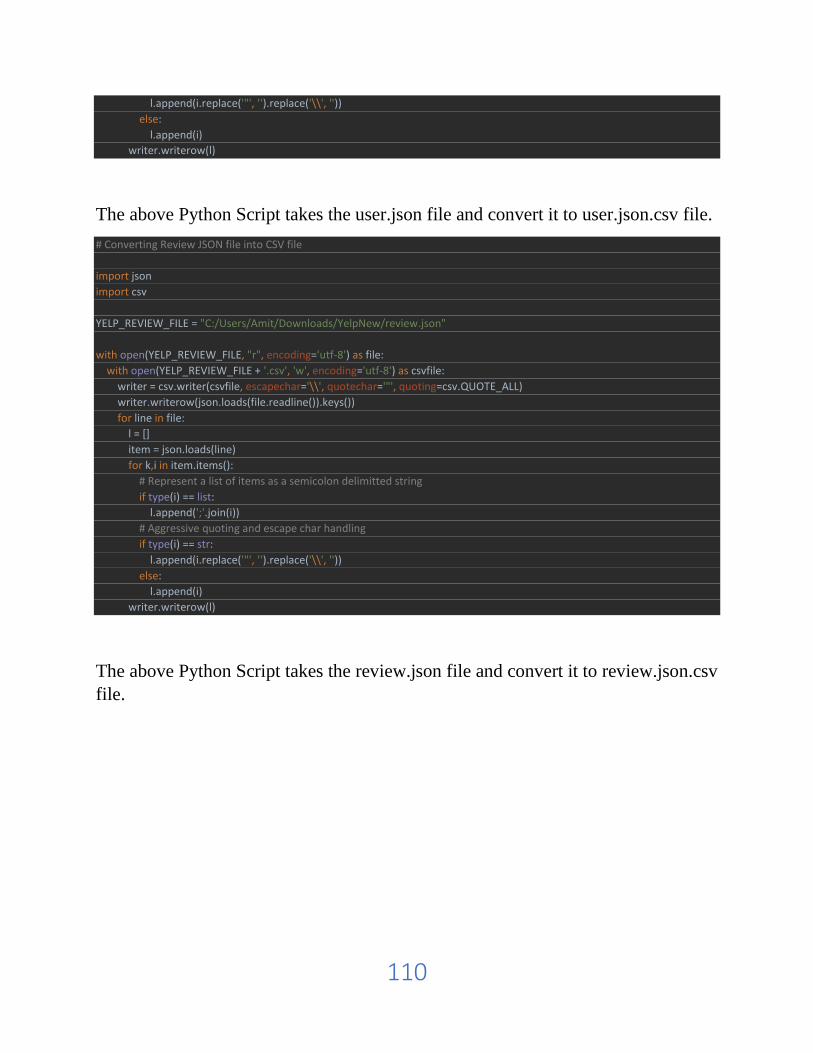
110
l.append(i.replace('"', '').replace('\\', ''))
else:
l.append(i)
writer.writerow(l)
The above Python Script takes the user.json file and convert it to user.json.csv file.
# Converting Review JSON file into CSV file
import json
import csv
YELP_REVIEW_FILE = "C:/Users/Amit/Downloads/YelpNew/review.json"
with open(YELP_REVIEW_FILE, "r", encoding='utf-8') as file:
with open(YELP_REVIEW_FILE + '.csv', 'w', encoding='utf-8') as csvfile:
writer = csv.writer(csvfile, escapechar='\\', quotechar='"', quoting=csv.QUOTE_ALL)
writer.writerow(json.loads(file.readline()).keys())
for line in file:
l = []
item = json.loads(line)
for k,i in item.items():
# Represent a list of items as a semicolon delimitted string
if type(i) == list:
l.append(';'.join(i))
# Aggressive quoting and escape char handling
if type(i) == str:
l.append(i.replace('"', '').replace('\\', ''))
else:
l.append(i)
writer.writerow(l)
The above Python Script takes the review.json file and convert it to review.json.csv
file.
111
Appendix I
Appendix I describes the implementation of the traditional model which can be used
for providing recommendations for a business case. The use case is developed using
the data mining tool named RapidMiner using the Association Rules. The
Association Rules taken for doing modelling and analysis as part of this research is
FP Growth.
Association Rules measure the strength of co-occurrence between one item with
another. The aim is not to predict occurrence but to find usable patterns in the
cooccurrence of the items. Widely used in retail analysis of transactions,
recommendation engines and online clickstream analysis across pages. (Kotu and
Deshpande, 2015)
The aim of the use case is to find the association rules for different categories with
the purpose of providing meaningful recommendations for a user. The Categories
were taken from business.csv file and created as a separate file named as
categories.csv. The resulting file named category.csv is then modified with the
headers as the Individual Category Name and each row data will show whether a
specific category is present in that row for categories.csv file. If category is present,
we have put it as 1 otherwise 0.
The FP-Growth Algorithm can be implemented for the mentioned use case as below:
Step 1 – Data Preparation
The input grid should have binomial (true or false) data with items in the columns
and each transaction as a row. Integer format data were converted to binomial using
Numerical to Binomial.
Step 2 – Modelling and Parameters
FP-Growth (Min Support = 0.2)

112
Step 3 – Create Association Rules
Create Association Rules (Criterion – confidence, Min Confidence = 0.5)
The RapidMiner Process for this use case is shown below:

113
Step 4 – Interpreting Results
The above output shows the Numerical to Binomial Conversion for the ExampleSet.
The above output shows the different Association Rules that have been generated as
per the FP-Growth Algorithm. It provides that the confidence value for category
American (Traditional) and Mocktail is 0.500 which means that if the user likes
American (Traditional), they will also like Mocktail and the confidence of the
occurrence of both is 0.500. In other words, it acta as a recommendation for different

114
categories that the user can like. In the same way, the association rules for other
categories are created.
The above output shows the Association Rules as a Graph View.

115
The above output provides the values for Support, Confidence, LaPlace, Gain, p-s,
Lift and Conviction for the six Premises and Conclusion. Here, Premises and
Conclusion are the different categories.
The above output shows the Frequent Sets (FP-Growth) for different categories. It
shows the Support value for each category in descending order. American
(Traditional) is having the highest Support value followed by Indian, Cocktail and
Chinese. Total number of Sets is 25 and Total Maximum Size is 2.
116
Appendix J
Appendix J contains the Java Code Implementation for PageRank Algorithm,
Overlap Similarity Algorithm and Cosine Similarity Algorithm.
Java Code for PageRank Algorithm
package org.neo4j.graphalgo;
import org.neo4j.graphalgo.api.Graph;
import org.neo4j.graphalgo.api.GraphFactory;
import org.neo4j.graphalgo.api.HugeGraph;
import org.neo4j.graphalgo.core.GraphLoader;
import org.neo4j.graphalgo.core.ProcedureConfiguration;
import org.neo4j.graphalgo.core.utils.Pools;
import org.neo4j.graphalgo.core.utils.ProgressTimer;
import org.neo4j.graphalgo.core.utils.TerminationFlag;
import org.neo4j.graphalgo.core.utils.paged.AllocationTracker;
import org.neo4j.graphalgo.core.write.Exporter;
import org.neo4j.graphalgo.impl.pagerank.PageRankResult;
import org.neo4j.graphalgo.impl.Algorithm;
import org.neo4j.graphalgo.impl.pagerank.PageRankAlgorithm;
import org.neo4j.graphalgo.results.PageRankScore;
import org.neo4j.graphdb.Direction;
import org.neo4j.graphdb.Node;
import org.neo4j.kernel.api.KernelTransaction;
import org.neo4j.kernel.internal.GraphDatabaseAPI;
import org.neo4j.logging.Log;
import org.neo4j.procedure.Context;
import org.neo4j.procedure.Description;
117
import org.neo4j.procedure.Mode;
import org.neo4j.procedure.Name;
import org.neo4j.procedure.Procedure;
import java.util.ArrayList;
import java.util.List;
import java.util.Map;
import java.util.stream.IntStream;
import java.util.stream.LongStream;
import java.util.stream.Stream;
public final class PageRankProc {
public static final String CONFIG_DAMPING = "dampingFactor";
public static final Double DEFAULT_DAMPING = 0.85;
public static final Integer DEFAULT_ITERATIONS = 20;
public static final String DEFAULT_SCORE_PROPERTY = "pagerank";
public static final String CONFIG_WEIGHT_KEY = "weightProperty";
@Context
public GraphDatabaseAPI api;
@Context
public Log log;
@Context
public KernelTransaction transaction;
@Procedure(value = "algo.pageRank", mode = Mode.WRITE)
@Description("CALL algo.pageRank(label:String, relationship:String, " +
"{iterations:5, dampingFactor:0.85, weightProperty: null, write: true,
writeProperty:'pagerank', concurrency:4}) " +

118
"YIELD nodes, iterations, loadMillis, computeMillis, writeMillis,
dampingFactor, write, writeProperty" +
" - calculates page rank and potentially writes back")
public Stream<PageRankScore.Stats> pageRank(
@Name(value = "label", defaultValue = "") String label,
@Name(value = "relationship", defaultValue = "") String relationship,
@Name(value = "config", defaultValue = "{}") Map<String, Object>
config) {
ProcedureConfiguration configuration =
ProcedureConfiguration.create(config);
final String weightPropertyKey =
configuration.getString(CONFIG_WEIGHT_KEY, null);
PageRankScore.Stats.Builder statsBuilder = new
PageRankScore.Stats.Builder();
AllocationTracker tracker = AllocationTracker.create();
final Graph graph = load(label, relationship, tracker,
configuration.getGraphImpl(), statsBuilder, configuration, weightPropertyKey);
if(graph.nodeCount() == 0) {
graph.release();
return Stream.of(statsBuilder.build());
}
TerminationFlag terminationFlag = TerminationFlag.wrap(transaction);
PageRankResult scores = evaluate(graph, tracker, terminationFlag,
configuration, statsBuilder, weightPropertyKey);
log.info("PageRank: overall memory usage: %s", tracker.getUsageString());
write(graph, terminationFlag, scores, configuration, statsBuilder);
return Stream.of(statsBuilder.build());

119
}
@Procedure(value = "algo.pageRank.stream", mode = Mode.READ)
@Description("CALL algo.pageRank.stream(label:String, relationship:String, "
+ "{iterations:20, dampingFactor:0.85, weightProperty: null, concurrency:4}) " +
"YIELD node, score - calculates page rank and streams results")
public Stream<PageRankScore> pageRankStream(
@Name(value = "label", defaultValue = "") String label,
@Name(value = "relationship", defaultValue = "") String relationship,
@Name(value = "config", defaultValue = "{}") Map<String, Object>
config) {
ProcedureConfiguration configuration =
ProcedureConfiguration.create(config);
final String weightPropertyKey =
configuration.getString(CONFIG_WEIGHT_KEY, null);
PageRankScore.Stats.Builder statsBuilder = new
PageRankScore.Stats.Builder();
AllocationTracker tracker = AllocationTracker.create();
final Graph graph = load(label, relationship, tracker,
configuration.getGraphImpl(), statsBuilder, configuration, weightPropertyKey);
if(graph.nodeCount() == 0) {
graph.release();
return Stream.empty();
}
TerminationFlag terminationFlag = TerminationFlag.wrap(transaction);
PageRankResult scores = evaluate(graph, tracker, terminationFlag,
configuration, statsBuilder, weightPropertyKey);
log.info("PageRank: overall memory usage: %s", tracker.getUsageString());
if (graph instanceof HugeGraph) {

120
HugeGraph hugeGraph = (HugeGraph) graph;
return LongStream.range(0, hugeGraph.nodeCount())
.mapToObj(i -> {
final long nodeId = hugeGraph.toOriginalNodeId(i);
return new PageRankScore(
nodeId,
scores.score(i)
);
});
}
return IntStream.range(0, Math.toIntExact(graph.nodeCount()))
.mapToObj(i -> {
final long nodeId = graph.toOriginalNodeId(i);
return new PageRankScore(
nodeId,
scores.score(i)
);
});
}
private Graph load(
String label,
String relationship,
AllocationTracker tracker,
Class<? extends GraphFactory> graphFactory,
PageRankScore.Stats.Builder statsBuilder,

121
ProcedureConfiguration configuration,
String weightPropertyKey) {
GraphLoader graphLoader = new GraphLoader(api, Pools.DEFAULT)
.init(log, label, relationship, configuration)
.withAllocationTracker(tracker)
.withOptionalRelationshipWeightsFromProperty(weightPropertyKey,
configuration.getWeightPropertyDefaultValue(0.0));
Direction direction = configuration.getDirection(Direction.OUTGOING);
if (direction == Direction.BOTH) {
graphLoader.asUndirected(true);
} else {
graphLoader.withDirection(direction);
}
try (ProgressTimer timer = statsBuilder.timeLoad()) {
Graph graph = graphLoader.load(graphFactory);
statsBuilder.withNodes(graph.nodeCount());
return graph;
}
}
private PageRankResult evaluate(
Graph graph,
AllocationTracker tracker,
TerminationFlag terminationFlag,
ProcedureConfiguration configuration,
PageRankScore.Stats.Builder statsBuilder,
String weightPropertyKey) {

122
double dampingFactor = configuration.get(CONFIG_DAMPING,
DEFAULT_DAMPING);
int iterations = configuration.getIterations(DEFAULT_ITERATIONS);
final int batchSize = configuration.getBatchSize();
final int concurrency =
configuration.getConcurrency(Pools.getNoThreadsInDefaultPool());
log.debug("Computing page rank with damping of " + dampingFactor + " and
" + iterations + " iterations.");
List<Node> sourceNodes = configuration.get("sourceNodes", new
ArrayList<>());
LongStream sourceNodeIds =
sourceNodes.stream().mapToLong(Node::getId);
PageRankAlgorithm prAlgo;
if(weightPropertyKey != null) {
final boolean cacheWeights = configuration.get("cacheWeights", false);
prAlgo = PageRankAlgorithm.weightedOf(
tracker,
graph,
dampingFactor,
sourceNodeIds,
Pools.DEFAULT,
concurrency,
batchSize,
cacheWeights);
} else {
prAlgo = PageRankAlgorithm.of(
tracker,

123
graph,
dampingFactor,
sourceNodeIds,
Pools.DEFAULT,
concurrency,
batchSize);
}
Algorithm<?> algo = prAlgo
.algorithm()
.withLog(log)
.withTerminationFlag(terminationFlag);
statsBuilder.timeEval(() -> prAlgo.compute(iterations));
statsBuilder
.withIterations(iterations)
.withDampingFactor(dampingFactor);
final PageRankResult pageRank = prAlgo.result();
algo.release();
graph.release();
return pageRank;
}
private void write(
Graph graph,
TerminationFlag terminationFlag,
PageRankResult result,
ProcedureConfiguration configuration,
124
final PageRankScore.Stats.Builder statsBuilder) {
if (configuration.isWriteFlag(true)) {
log.debug("Writing results");
String propertyName =
configuration.getWriteProperty(DEFAULT_SCORE_PROPERTY);
try (ProgressTimer timer = statsBuilder.timeWrite()) {
Exporter exporter = Exporter
.of(api, graph)
.withLog(log)
.parallel(Pools.DEFAULT, configuration.getConcurrency(),
terminationFlag)
.build();
result.export(propertyName, exporter);
}
statsBuilder
.withWrite(true)
.withProperty(propertyName);
} else {
statsBuilder.withWrite(false);
}
}
}
(‘neo4j-contrib / neo4j-graph-algorithms’, no date)

125
Java Code for Overlap Similarity Algorithm
package org.neo4j.graphalgo.similarity;
import org.neo4j.graphalgo.core.ProcedureConfiguration;
import org.neo4j.procedure.Description;
import org.neo4j.procedure.Mode;
import org.neo4j.procedure.Name;
import org.neo4j.procedure.Procedure;
import java.util.List;
import java.util.Map;
import java.util.stream.Stream;
public class OverlapProc extends SimilarityProc {
@Procedure(name = "algo.similarity.overlap.stream", mode = Mode.READ)
@Description("CALL algo.similarity.overlap.stream([{item:id, targets:[ids]}],
{similarityCutoff:-1,degreeCutoff:0}) " +
"YIELD item1, item2, count1, count2, intersection, similarity - computes
overlap similarities")
public Stream<SimilarityResult> similarityStream(
@Name(value = "data", defaultValue = "null") List<Map<String,Object>>
data,
@Name(value = "config", defaultValue = "{}") Map<String, Object>
config) {
SimilarityComputer<CategoricalInput> computer = (decoder, s, t, cutoff) ->
s.overlap(cutoff, t);
ProcedureConfiguration configuration =
ProcedureConfiguration.create(config);
CategoricalInput[] inputs = prepareCategories(data,
getDegreeCutoff(configuration));

126
return topN(similarityStream(inputs, computer, configuration, () -> null,
getSimilarityCutoff(configuration), getTopK(configuration)),
getTopN(configuration));
}
@Procedure(name = "algo.similarity.overlap", mode = Mode.WRITE)
@Description("CALL algo.similarity.overlap([{item:id, targets:[ids]}],
{similarityCutoff:-1,degreeCutoff:0}) " +
"YIELD p50, p75, p90, p99, p999, p100 - computes overlap similarities")
public Stream<SimilaritySummaryResult> overlap(
@Name(value = "data", defaultValue = "null") List<Map<String, Object>>
data,
@Name(value = "config", defaultValue = "{}") Map<String, Object>
config) {
SimilarityComputer<CategoricalInput> computer = (decoder, s, t, cutoff) ->
s.overlap(cutoff, t);
ProcedureConfiguration configuration =
ProcedureConfiguration.create(config);
CategoricalInput[] inputs = prepareCategories(data,
getDegreeCutoff(configuration));
double similarityCutoff = getSimilarityCutoff(configuration);
Stream<SimilarityResult> stream = topN(similarityStream(inputs, computer,
configuration, () -> null, similarityCutoff, getTopK(configuration)),
getTopN(configuration));
boolean write = configuration.isWriteFlag(false) && similarityCutoff > 0.0;
return writeAndAggregateResults(configuration, stream, inputs.length, write,
"NARROWER_THAN");
}
}
127
(‘neo4j-contrib / neo4j-graph-algorithms’, no date)
Java Code for Cosine Similarity Algorithm
package org.neo4j.graphalgo.similarity;
import org.neo4j.graphalgo.core.ProcedureConfiguration;
import org.neo4j.procedure.Description;
import org.neo4j.procedure.Mode;
import org.neo4j.procedure.Name;
import org.neo4j.procedure.Procedure;
import java.util.Map;
import java.util.function.Supplier;
import java.util.stream.Stream;
public class CosineProc extends SimilarityProc {
@Procedure(name = "algo.similarity.cosine.stream", mode = Mode.READ)
@Description("CALL algo.similarity.cosine.stream([{item:id,
weights:[weights]}], {similarityCutoff:-1,degreeCutoff:0}) " +
"YIELD item1, item2, count1, count2, intersection, similarity - computes
cosine distance")
// todo count1,count2 = could be the non-null values, intersection the values
where both are non-null?
public Stream<SimilarityResult> cosineStream(
@Name(value = "data", defaultValue = "null") Object rawData,
@Name(value = "config", defaultValue = "{}") Map<String, Object>
config) throws Exception {
ProcedureConfiguration configuration =
ProcedureConfiguration.create(config);

128
Double skipValue = configuration.get("skipValue", null);
WeightedInput[] inputs = prepareWeights(rawData, configuration,
skipValue);
double similarityCutoff = similarityCutoff(configuration);
int topN = getTopN(configuration);
int topK = getTopK(configuration);
SimilarityComputer<WeightedInput> computer =
similarityComputer(skipValue);
return generateStream(configuration, inputs, similarityCutoff, topN, topK,
computer);
}
@Procedure(name = "algo.similarity.cosine", mode = Mode.WRITE)
@Description("CALL algo.similarity.cosine([{item:id, weights:[weights]}],
{similarityCutoff:-1,degreeCutoff:0}) " +
"YIELD p50, p75, p90, p99, p999, p100 - computes cosine similarities")
public Stream<SimilaritySummaryResult> cosine(
@Name(value = "data", defaultValue = "null") Object rawData,
@Name(value = "config", defaultValue = "{}") Map<String, Object>
config) throws Exception {
ProcedureConfiguration configuration =
ProcedureConfiguration.create(config);
Double skipValue = configuration.get("skipValue", null);
WeightedInput[] inputs = prepareWeights(rawData, configuration,
skipValue);
double similarityCutoff = similarityCutoff(configuration);
int topN = getTopN(configuration);
int topK = getTopK(configuration);
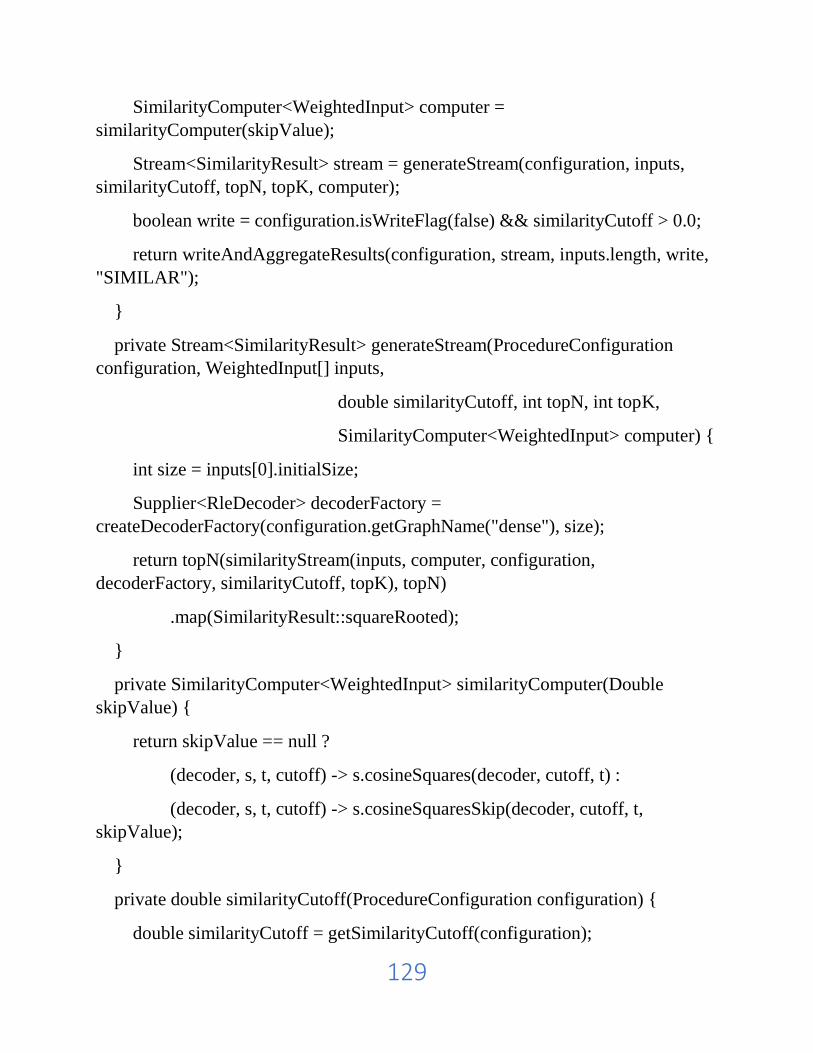
129
SimilarityComputer<WeightedInput> computer =
similarityComputer(skipValue);
Stream<SimilarityResult> stream = generateStream(configuration, inputs,
similarityCutoff, topN, topK, computer);
boolean write = configuration.isWriteFlag(false) && similarityCutoff > 0.0;
return writeAndAggregateResults(configuration, stream, inputs.length, write,
"SIMILAR");
}
private Stream<SimilarityResult> generateStream(ProcedureConfiguration
configuration, WeightedInput[] inputs,
double similarityCutoff, int topN, int topK,
SimilarityComputer<WeightedInput> computer) {
int size = inputs[0].initialSize;
Supplier<RleDecoder> decoderFactory =
createDecoderFactory(configuration.getGraphName("dense"), size);
return topN(similarityStream(inputs, computer, configuration,
decoderFactory, similarityCutoff, topK), topN)
.map(SimilarityResult::squareRooted);
}
private SimilarityComputer<WeightedInput> similarityComputer(Double
skipValue) {
return skipValue == null ?
(decoder, s, t, cutoff) -> s.cosineSquares(decoder, cutoff, t) :
(decoder, s, t, cutoff) -> s.cosineSquaresSkip(decoder, cutoff, t,
skipValue);
}
private double similarityCutoff(ProcedureConfiguration configuration) {
double similarityCutoff = getSimilarityCutoff(configuration);

130
// as we don't compute the sqrt until the end
if (similarityCutoff > 0d) similarityCutoff *= similarityCutoff;
return similarityCutoff;
}
}
(‘neo4j-contrib / neo4j-graph-algorithms’, no date)

131
Appendix K
This contains the Description of all the Folders and Files that have been written for
the Artifact Development for Masters Dissertation.
Read Me or Help File Name: Dissertation Readme File
Folder Name: Neo4j Cypher Queries
1) File Name: Proposed Solution for Use Case 1
This file contains the Cypher Script for proposed solution for use case 1 in Neo4j
Folder Name: Neo4j Cypher Queries
2) File Name: Proposed Solution for Use Case 2
This file contains the Cypher Script for proposed solution for use case 2 in Neo4j
Folder Name: Neo4j Cypher Queries
3) File Name: Loading JSON Files into Neo4j
This file contains Cypher Script for loading the JSON Files into Neo4j. After that,
nodes and relationships are created.
Folder Name: Neo4j Cypher Queries
4) File Name: Loading of JSON files
This file contains Cypher Script to only load the JSON Files into Neo4j.
Folder Name: Neo4j Cypher Queries
5) File Name: Loading of CSV Files
This file contains Cypher Script to load the CSV Files into Neo4j. After that, nodes
and relationships are created.

132
Folder Name: Neo4j Cypher Queries
6) File Name: Overlap Similarity Algorithm
This file contains Cypher Script to demonstrate the functionality of Overlap
Similarity Algorithm in Neo4j.
Folder Name: Neo4j Cypher Queries
7) File Name: Cosine Similarity Algorithm
This file contains Cypher Script to demonstrate the functionality of Cosine
Similarity Algorithm in Neo4j.
Folder Name: Python Scripts
8) File Name: jsonToCsvForUser.py
This file contains the Python Script to convert user.json to user.csv
Folder Name: Python Scripts
9) File Name: jsonToCsvForReview.py
This file contains the Python Script to convert review.json to review.csv
Folder Name: Python Scripts
10) File Name: jsonToCsvForBusiness.py
This file contains the Python Script to convert business.json to business.csv
Folder Name: Rapid Miner Process
11) File Name: Category.csv

133
This file contains the Categories that have been created for showing Association
Rule (FP-Growth).
Folder Name: Rapid Miner Process
12) File Name: Association Process.rmp
This file contains the implementation for Association Rule (FP-Growth) for
Categories in Rapid Miner.
Folder Name: Java Codes for Graph Algorithms
13) File Name: Java Code for Cosine Similarity Algorithm
This file contains the Java code for Cosine Similarity Algorithm
Folder Name: Java Codes for Graph Algorithms
14) File Name: Java Code for Overlap Similarity Algorithm
This file contains the Java code for Overlap Similarity Algorithm
Folder Name: Java Codes for Graph Algorithms
15) File Name: Java Code for PageRank Algorithm
This file contains the Java code for PageRank Algorithm
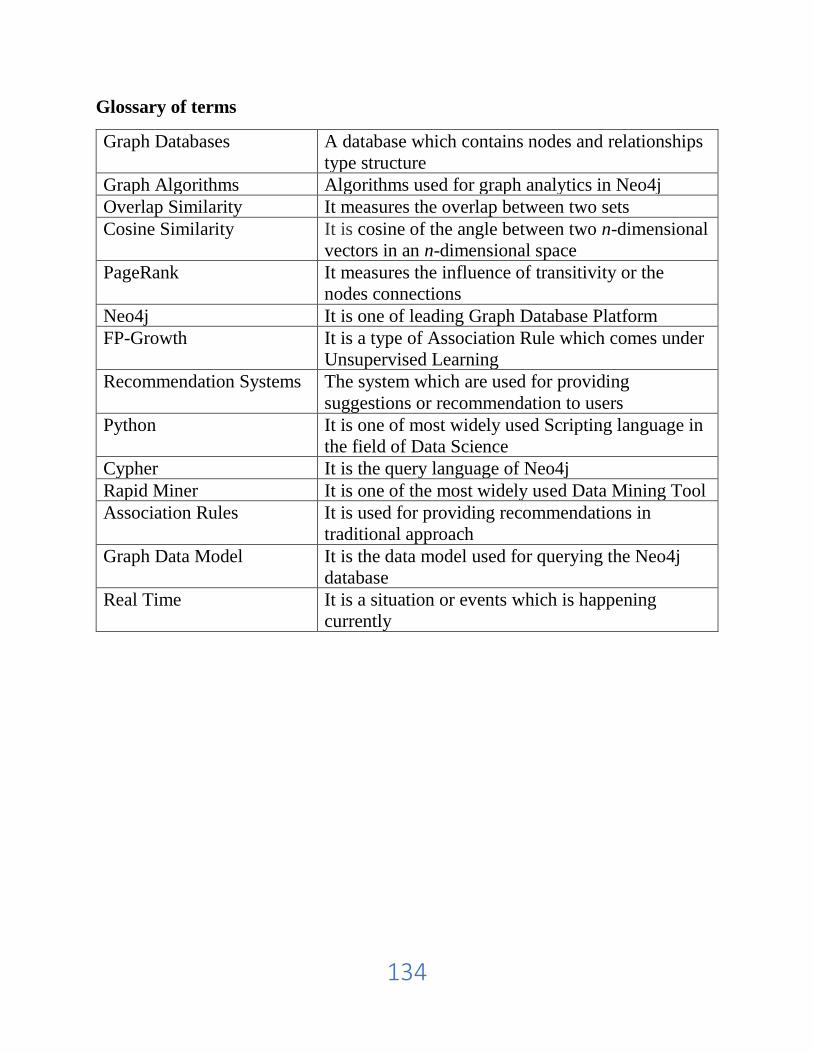
134
Glossary of terms
Graph Databases A database which contains nodes and relationships
type structure
Graph Algorithms Algorithms used for graph analytics in Neo4j
Overlap Similarity It measures the overlap between two sets
Cosine Similarity It is cosine of the angle between two n-dimensional
vectors in an n-dimensional space
PageRank It measures the influence of transitivity or the
nodes connections
Neo4j It is one of leading Graph Database Platform
FP-Growth It is a type of Association Rule which comes under
Unsupervised Learning
Recommendation Systems The system which are used for providing
suggestions or recommendation to users
Python It is one of most widely used Scripting language in
the field of Data Science
Cypher It is the query language of Neo4j
Rapid Miner It is one of the most widely used Data Mining Tool
Association Rules It is used for providing recommendations in
traditional approach
Graph Data Model It is the data model used for querying the Neo4j
database
Real Time It is a situation or events which is happening
currently