implementing transport policies and programmes toward ... · ministry of transport (mot), ......
TRANSCRIPT
issued without formal editing
ENGLISH ONLY
UNITED NATIONS CENTRE FOR REGIONAL DEVELOPMENT In collaboration with Ministry of Environment and Renewable Energy (MERE), Government of Sri Lanka Ministry of Transport (MOT), Government of Sri Lanka Ministry of the Environment, Government of Japan, and Clean Air Asia (CAA)
EIGHTH REGIONAL ENVIRONMENTALLY SUSTAINABLE TRANSPORT (EST)
FORUM IN ASIA, 19-21 NOVEMBER, 2014, COLOMBO, SRI LANKA
Implementing Transport Policies and Programmes toward Realizing “Bali Vision Three Zeros - Zero Congestion, Zero Pollution, and Zero Accidents towards Next
Generation Transport Systems in Asia”
(Background Paper for Plenary Session 1 of the Programme)
Final Draft, December 2014 incorporate with input from the Eighth Regional EST Forum in Asia
------------------------------------- This background paper has been prepared by Mr. Todd Litman, for the Eighth Regional EST Forum in Asia. The views expressed herein are those of the author only and do not necessarily reflect the views of the United Nations.
Toward Next-Generation Transport Systems in Asia Eighth Regional EST Forum in Asia – 2014
Contents Executive Summary ................................................................................................................................. 5 Introduction ............................................................................................................................................ 7
New Challenges and Opportunities for Asian Cities ............................................................................................. 7 Asia’s Growing Urbanization and Affluence ........................................................................................................ 8
Sustainable Transport Planning Concepts .............................................................................................. 14 Impact Analysis ..................................................................................................................................... 18
Traffic and Parking Congestion ......................................................................................................................... 18 Accident Reductions ......................................................................................................................................... 22 Emission Reductions......................................................................................................................................... 26 Other Planning Objectives ................................................................................................................................ 29
Efficient Land Development ........................................................................................................... 29 Infrastructure Savings .................................................................................................................... 30 Consumer Savings and Affordability ............................................................................................... 30 Improve Mobility Options for Non-drivers (Basic Mobility) ............................................................. 30 Improve Public Fitness and Health ................................................................................................. 30 Improve User Convenience and Comfort........................................................................................ 30 Support Strategic Land Use Development Objectives (Reduced Sprawl) ......................................... 30 Support Economic Development .................................................................................................... 30
Comprehensive Benefit Analysis ....................................................................................................................... 33
Principles for More Efficient Urban Transportation ................................................................................ 34 Policies for More Efficient Urban Transportation ................................................................................... 38
Institutional Reforms ........................................................................................................................................ 38 Transport Finance Reforms............................................................................................................................... 38 Improve Resource-Efficient Modes ................................................................................................................... 39 Pricing Reforms ................................................................................................................................................ 40 TDM Programs ................................................................................................................................................. 41 Smart Growth Development Policies ................................................................................................................ 41 Freight Transport ............................................................................................................................................. 41 Vehicle Improvements ..................................................................................................................................... 42
Examples ............................................................................................................................................... 43 People’s Republic of China ............................................................................................................................... 43 Guangzhou ....................................................................................................................................................... 43 Hangzhou ......................................................................................................................................................... 43 India ................................................................................................................................................................ 43 South Korea ..................................................................................................................................................... 44 London............................................................................................................................................................. 45 Mexico City ...................................................................................................................................................... 45 New York ......................................................................................................................................................... 45 Seoul ................................................................................................................................................................ 45 Singapore ......................................................................................................................................................... 46
Conclusions and Recommendations ...................................................................................................... 47 References ............................................................................................................................................ 49 Appendix I ............................................................................................................................................. 57 Appendix II ............................................................................................................................................ 59
2
Toward Next-Generation Transport Systems in Asia Eighth Regional EST Forum in Asia – 2014
Foreword The future is in our hands! Asian countries are currently in a period of rapid population growth and economic development. Many families that previously lived in villages and worked as farmers are moving to cities to take jobs in factories and offices. This transformation affects every aspect of our economies and our lives. Our goal as policy makers is to identify ways to maximize the overall benefits, so these new urban residents can lead successful, healthy and happy lives. We know that this is possible. Examples around the world demonstrate that cities can support economic development and a high quality of life. This is what we call sustainable development. These trends will provide many benefits but also present significant challenges. Rapidly developing countries will face fewer problems caused by poverty but more problems caused by affluence, including increased traffic congestion, accident risk and pollution problems, and the increasing financial demands of a modern industrialized society. In a bold response, the Bali Declaration signed at the 2013 Regional Environmentally Sustainable Transport (EST) Forum in Asia established ambitious goals: zero congestion, zero traffic deaths and zero pollution emissions. Now is the time to establish a strategy for achieving these goals. This Backgrounder investigates these issues. It examines current demographic and economic trends that affect urban travel demands (the amount that people want to travel), identifies current policies and planning practices that unintentionally encourage inefficient, unsustainable travel activity, and therefore the potential savings and benefits of policies which create more efficient and equitable transportation systems. This is not to suggest that there is a single set of policy reforms that should be imposed everywhere. Instead, it identifies a menu of strategies which policy makers can consider as possible solutions to the various transport problems they face. This is an exciting opportunity. By implementing smart urban transport policies we can create a legacy of truly sustainable cities for future generations. Postscript – December 2014 The Eighth Regional Environmentally Sustainable Transport (EST) Forum In Asia held November 19-21 in Colombo, Sri Lanka was an interesting and important conference. It provided an opportunity for participants to share information on sustainable transport policies and build new relationships for cooperation. On the last day, conference delegates approved a unanimous statement, Colombo Declaration For the Promotion of Next Generation Low Carbon Transport Solutions in Asia, which is included in this Backgrounder as Appendix II. This document provides further evidence of a deep commitment to sustainable transport by Asian
3

Toward Next-Generation Transport Systems in Asia Eighth Regional EST Forum in Asia – 2014
Abbreviations and Acronyms BRT = Bus Rapid Transit CBD = Central Business District CO2 = Carbon dioxide GDP = Gross Domestic Product HOV = High Occupancy Vehicle ITDP = Institute for Transportation and Development Policy NGO = Nongovernmental organization NMT = Nonmotorized Transport (also called “active transport”) OECD = Organisation for Economic Co-operation and Development PM10 = Fine-grained Particulate Matter TDM = Transportation Demand Management TOD = Transit-Oriented Development UGB = Urban Growth Boundary UNCRD = United Nations Centre for Regional Development
4
Toward Next-Generation Transport Systems in Asia Eighth Regional EST Forum in Asia – 2014
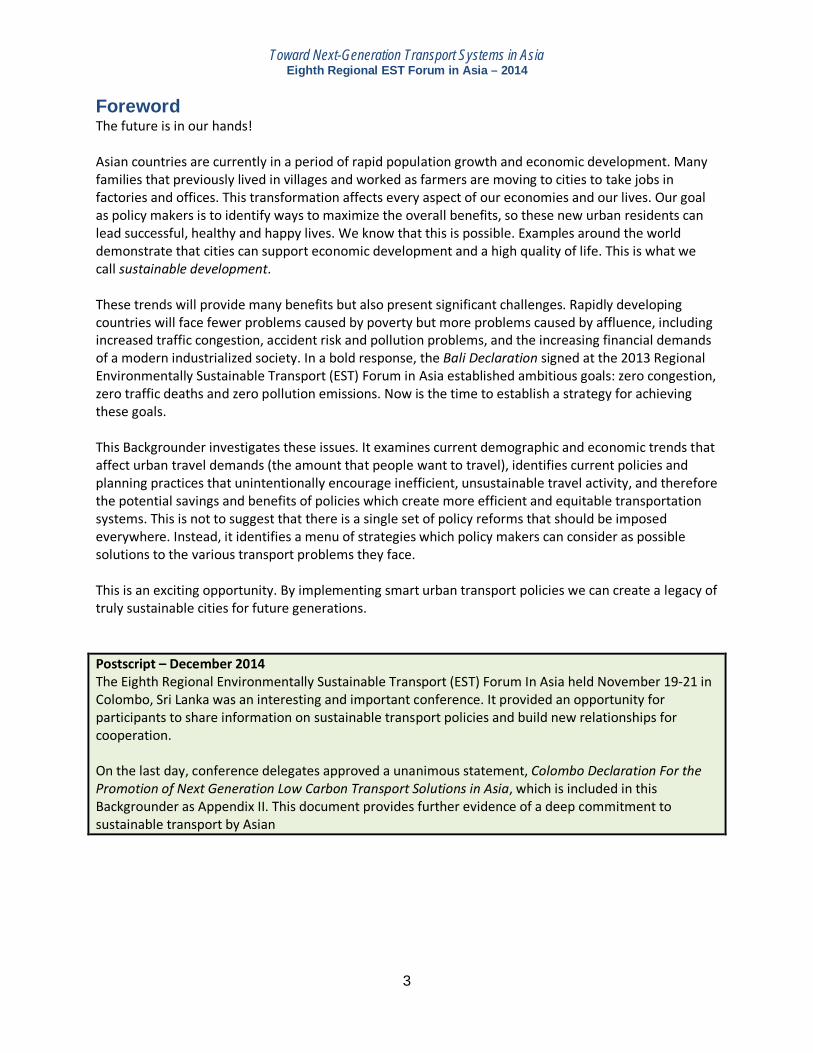
Executive Summary Asian cities are at a crossroads. According to projections, during the next three decades Asian cities will more than double in population and residents will become about five times wealthier. How cities respond will have huge economic, social and environmental impacts. If current policies continue, rapid urbanization and economic development will result in severe traffic congestion, accident and pollution problems, and impose huge financial costs on households, businesses and governments. This will reduce economic progress and degrade the quality of life for billions of urban residents. These problems can be avoided. A set of strong policy reforms can transform congested, dangerous and polluted, car-dominated cities into efficient, equitable and livable, human-oriented cities where residents lead productive, healthy and enjoyable lives. This transformation will only occur if everybody, including poor, middle-class and wealthy residents, understand the severity of problems caused by unrestrained vehicle traffic, and have a clear vision of a more sustainable future. It is in everybody’s interest to limit urban motor vehicle travel to what roadway systems can efficiently accommodate.
Figure ES-1 World Urbanization
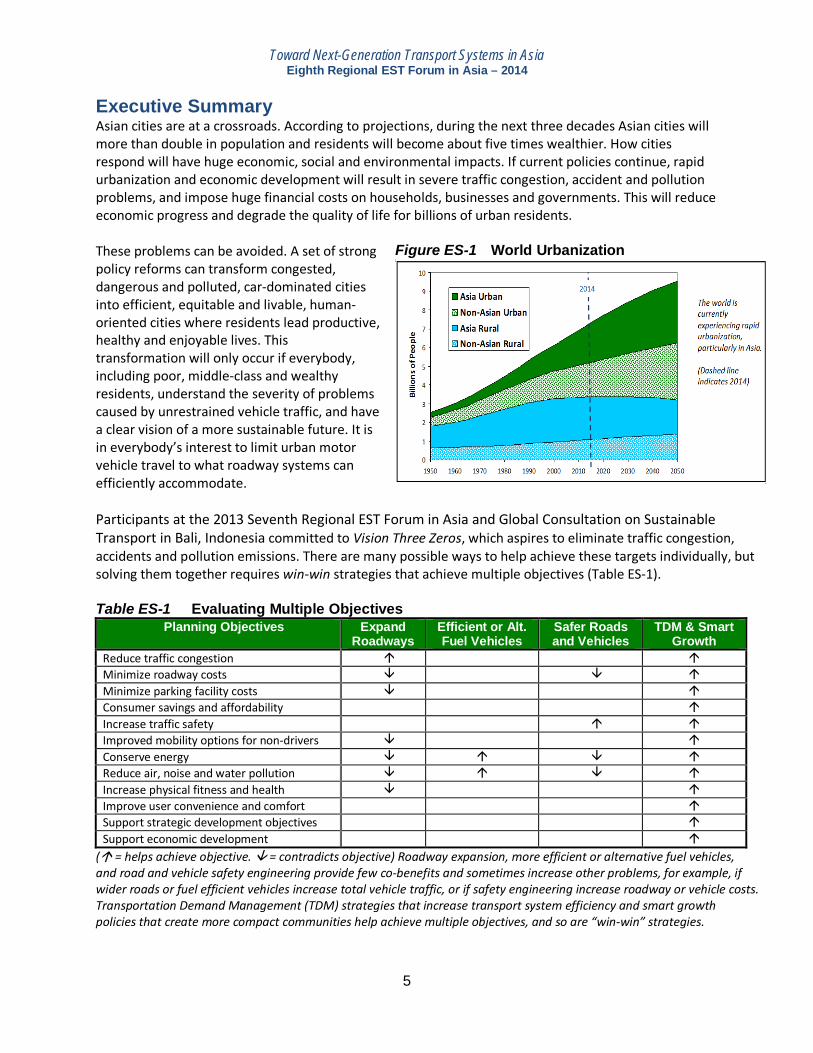
Participants at the 2013 Seventh Regional EST Forum in Asia and Global Consultation on Sustainable Transport in Bali, Indonesia committed to Vision Three Zeros, which aspires to eliminate traffic congestion, accidents and pollution emissions. There are many possible ways to help achieve these targets individually, but solving them together requires win-win strategies that achieve multiple objectives (Table ES-1). Table ES-1 Evaluating Multiple Objectives
Planning Objectives Expand Roadways
Efficient or Alt. Fuel Vehicles
Safer Roads and Vehicles
TDM & Smart Growth
Reduce traffic congestion Minimize roadway costs Minimize parking facility costs Consumer savings and affordability Increase traffic safety Improved mobility options for non-drivers Conserve energy Reduce air, noise and water pollution Increase physical fitness and health Improve user convenience and comfort Support strategic development objectives Support economic development
( = helps achieve objective. = contradicts objective) Roadway expansion, more efficient or alternative fuel vehicles, and road and vehicle safety engineering provide few co-benefits and sometimes increase other problems, for example, if wider roads or fuel efficient vehicles increase total vehicle traffic, or if safety engineering increase roadway or vehicle costs. Transportation Demand Management (TDM) strategies that increase transport system efficiency and smart growth policies that create more compact communities help achieve multiple objectives, and so are “win-win” strategies.
5

Toward Next-Generation Transport Systems in Asia Eighth Regional EST Forum in Asia – 2014
The key is to apply avoid-shift-improve principles, which encourage residents to choose the most efficient travel option for each trip: walking and cycling for local errands, public transit for travel on major urban corridors, and cars when they are most efficient overall, considering all impacts. This does not eliminate car travel altogether, but does require policies that favor resource-efficient modes using a Sustainable Transport Hierarchy (Figure ES-2). Figure ES-2 Sustainable Transport Hierarchy
This Backgrounder identifies 53 specific polices to help achieve Bali Three Zeros Vision. These include:
• Institutional Reforms • Transport Finance Reforms • Pricing Reforms • TDM Programs • Smart Growth Development Policies • Freight Transport • Vehicle Improvements
There are several ways to justify these policies. They help solve urban transport problems and achieve planning objectives such as reduced traffic congestion, accidents and pollution problems. They reflect market principles including consumer sovereignty, efficient pricing. They support sustainable development which balances economic, social and environmental goals. They reflect equity principles by providing basic mobility to physically, economically and socially disadvantaged people, and ensuring that non-drivers receive a fair share of public resources such as road space. We now have good examples of cities that have successfully implemented strong transportation demand management policies. These have proven effective at reducing congestion, accidents and pollution problems, as well as increasing affordability, public fitness and economic development. To succeed they require an integrated program that includes improvements to resource-efficient modes (walking, cycling and public transport), incentives to use the most efficient mode for each trip, and smart growth development policies that create accessible and multi-modal communities. Every city is unique, so each city will need to select the most suitable combination of strategies based on its geographic, demographic and economic conditions.
6
Toward Next-Generation Transport Systems in Asia Eighth Regional EST Forum in Asia – 2014
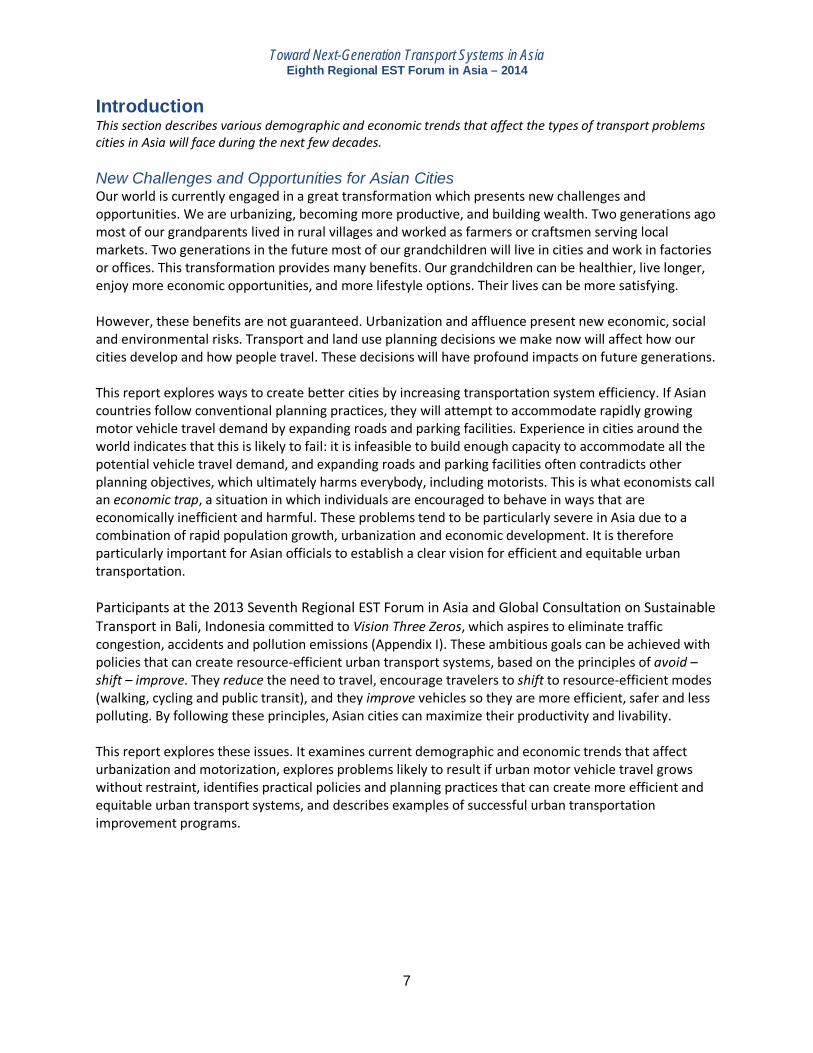
Introduction This section describes various demographic and economic trends that affect the types of transport problems cities in Asia will face during the next few decades. New Challenges and Opportunities for Asian Cities Our world is currently engaged in a great transformation which presents new challenges and opportunities. We are urbanizing, becoming more productive, and building wealth. Two generations ago most of our grandparents lived in rural villages and worked as farmers or craftsmen serving local markets. Two generations in the future most of our grandchildren will live in cities and work in factories or offices. This transformation provides many benefits. Our grandchildren can be healthier, live longer, enjoy more economic opportunities, and more lifestyle options. Their lives can be more satisfying. However, these benefits are not guaranteed. Urbanization and affluence present new economic, social and environmental risks. Transport and land use planning decisions we make now will affect how our cities develop and how people travel. These decisions will have profound impacts on future generations. This report explores ways to create better cities by increasing transportation system efficiency. If Asian countries follow conventional planning practices, they will attempt to accommodate rapidly growing motor vehicle travel demand by expanding roads and parking facilities. Experience in cities around the world indicates that this is likely to fail: it is infeasible to build enough capacity to accommodate all the potential vehicle travel demand, and expanding roads and parking facilities often contradicts other planning objectives, which ultimately harms everybody, including motorists. This is what economists call an economic trap, a situation in which individuals are encouraged to behave in ways that are economically inefficient and harmful. These problems tend to be particularly severe in Asia due to a combination of rapid population growth, urbanization and economic development. It is therefore particularly important for Asian officials to establish a clear vision for efficient and equitable urban transportation. Participants at the 2013 Seventh Regional EST Forum in Asia and Global Consultation on Sustainable Transport in Bali, Indonesia committed to Vision Three Zeros, which aspires to eliminate traffic congestion, accidents and pollution emissions (Appendix I). These ambitious goals can be achieved with policies that can create resource-efficient urban transport systems, based on the principles of avoid – shift – improve. They reduce the need to travel, encourage travelers to shift to resource-efficient modes (walking, cycling and public transit), and they improve vehicles so they are more efficient, safer and less polluting. By following these principles, Asian cities can maximize their productivity and livability. This report explores these issues. It examines current demographic and economic trends that affect urbanization and motorization, explores problems likely to result if urban motor vehicle travel grows without restraint, identifies practical policies and planning practices that can create more efficient and equitable urban transport systems, and describes examples of successful urban transportation improvement programs.
7
Toward Next-Generation Transport Systems in Asia Eighth Regional EST Forum in Asia – 2014
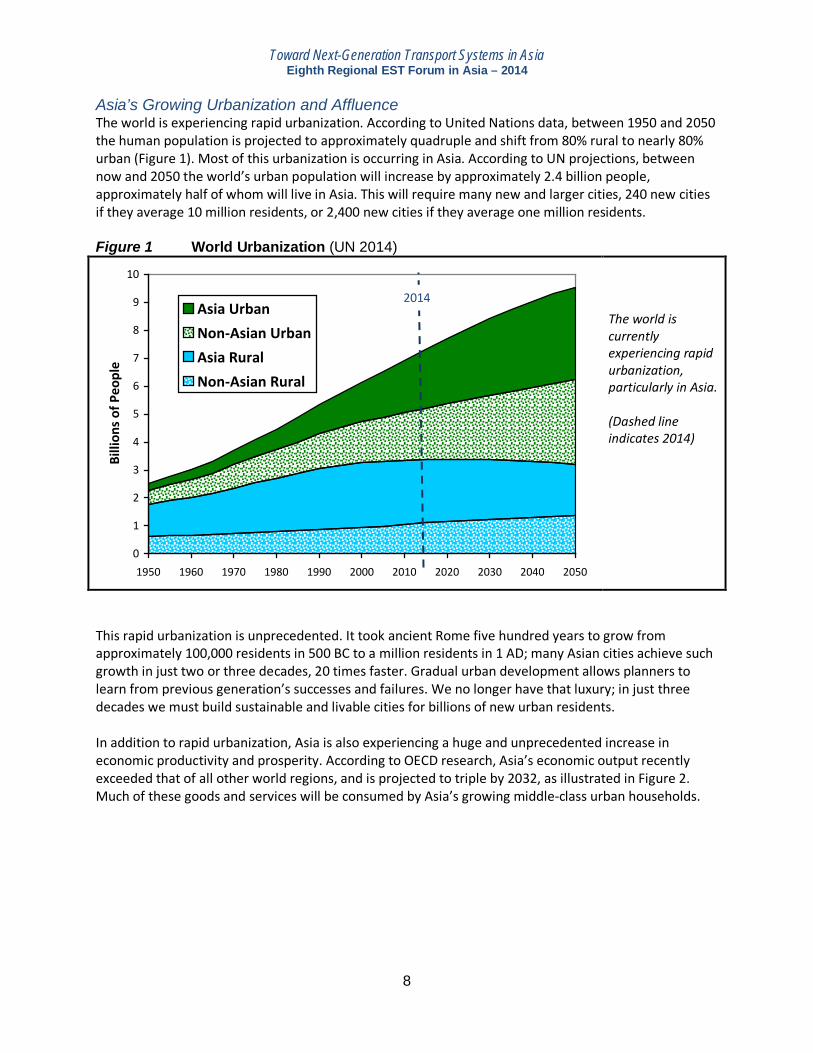
Asia’s Growing Urbanization and Affluence The world is experiencing rapid urbanization. According to United Nations data, between 1950 and 2050 the human population is projected to approximately quadruple and shift from 80% rural to nearly 80% urban (Figure 1). Most of this urbanization is occurring in Asia. According to UN projections, between now and 2050 the world’s urban population will increase by approximately 2.4 billion people, approximately half of whom will live in Asia. This will require many new and larger cities, 240 new cities if they average 10 million residents, or 2,400 new cities if they average one million residents. Figure 1 World Urbanization (UN 2014)
0
1
2
3
4
5
6
7
8
9
10
1950 1960 1970 1980 1990 2000 2010 2020 2030 2040 2050
Billi
ons o
f Peo
ple
Asia UrbanNon-Asian UrbanAsia RuralNon-Asian Rural
The world is currently experiencing rapid urbanization, particularly in Asia. (Dashed line indicates 2014)
This rapid urbanization is unprecedented. It took ancient Rome five hundred years to grow from approximately 100,000 residents in 500 BC to a million residents in 1 AD; many Asian cities achieve such growth in just two or three decades, 20 times faster. Gradual urban development allows planners to learn from previous generation’s successes and failures. We no longer have that luxury; in just three decades we must build sustainable and livable cities for billions of new urban residents. In addition to rapid urbanization, Asia is also experiencing a huge and unprecedented increase in economic productivity and prosperity. According to OECD research, Asia’s economic output recently exceeded that of all other world regions, and is projected to triple by 2032, as illustrated in Figure 2. Much of these goods and services will be consumed by Asia’s growing middle-class urban households.
2014
8

Toward Next-Generation Transport Systems in Asia Eighth Regional EST Forum in Asia – 2014
Figure 2 Asia Productivity Growth (Kharas 2010)
Asia’s Gross Domestic Product (GDP) is projected to increase approximately six-fold between now and 2032, making it the world’s leading producer of goods and services. Many of these goods will be consumed by Asian urban households.
The number of Asian middle-class households is projected to increase six fold during the next sixteen years, from 525 million in 2009 up to 3,228 million 2030. By then, approximately two-thirds of all the world’s middle-class households will reside in Asia, as indicated in figures 3 and 4. This will affect demands for consumer goods, including transport and housing. Low-income households travel primarily by walking, cycling and basic (often uncomfortable) public transit services, and live in basic housing, often located in unplanned neighborhoods that lack utilities and services. Middle-class households can purchase non-essential goods including motor vehicles (motorcycles and cars), more comfortable public transit (uncrowded and air conditioned buses and trains), and planned housing with better services. Figure 3 Numbers of Middle Class People (Kharas 2010)
0
500
1,000
1,500
2,000
2,500
3,000
3,500
2009 2020 2030
Mill
ions
of P
eopl
e
Asia Pacific
North America
Europe
Central & SouthAmericaMiddle East &North AfricaSub-SaharanAfrica
The number and share of middle-class households in Asia is projected to increase six fold between now and 2030. Middle-class households can purchase non-essential goods, including motor vehicles.
9

Toward Next-Generation Transport Systems in Asia Eighth Regional EST Forum in Asia – 2014
Figure 4 Shares of Global Middle Class Consumption, 2000-2050 (Kharas 2010)
This combination of population and income growth is projected to significantly increase Asia’s share of global consumption. Asia is projected to have about two-thirds of total middle-class spending by 2050. This could significantly increase in motor vehicle ownership.
As more households attain middle-class incomes, vehicle ownership tends to increase, a trend called motorization. Vehicle ownership rates eventually saturate, sometimes called peak car, as illustrated in Figure 5. Urban transport and land use policies affect these saturation levels. In affluent European and Asian countries, vehicle ownership peaks at 400 to 600 vehicles per 1,000 residents, far lower than in the U.S., due in part to policies that affect the quality of transport options, the price of driving, and neighborhood design. The level at which vehicle ownership saturates in developing Asian countries will have significant economic, social and environmental implications (Wang, Teter and Sperling 2011). Figure 5 Vehicle Ownership Versus Income (Goldemberg 2011, based on IPCC 2010)
As countries become wealthier and household incomes grow, vehicle ownership rates tend to increase until they saturate. Public policies determine this level of saturation.
10

Toward Next-Generation Transport Systems in Asia Eighth Regional EST Forum in Asia – 2014
Vehicle ownership rates also vary significantly between cities, due to variations in their transport and land use policies. Cities with automobile-oriented development policies have more than 500 vehicles per 1,000 residents, twice the rate as occurs in similarly affluent cities that have transportation demand management and smart growth policies, as illustrated in Figure 6. Asian cities such as Hong Kong, Tokyo and Singapore are particularly successful at minimizing automobile ownership. Figure 6 Car Ownership Versus GDP Per Capita (Di 2013)
Urban vehicle ownership tends to increase with wealth, but the statistical relationship is weak (R2 = 0.1797). Many affluent cities, including Hong Kong, Singapore, Tokyo and New York, have less than 300 vehicles per 1,000 residents (blue circle). These can be a model for developing cities. Note that “cars” excludes light trucks-vans and sport utility vehicles (which are a major share of motor vehicles in North American cities such as New York) and motorcycles (which are a major share of motor vehicles in Asian cities).
Efficient urbanization tends to support economic, social and environmental objectives. City residents tend to have better education and health, higher incomes, plus lower per capita energy consumption and pollution emissions, as illustrated in Figure 7. Figure 7 Emissions and Incomes For Selected Countries and Cities (UNEP 2011, p. 463)
Urban residents tend to have better education and health, and higher incomes but lower per capita carbon emissions. This indicates the potential economic and environmental benefits of urbanization. More sustainable urban development policies can increase these benefits – many of the policies recommended in this report support economic development while reducing energy consumption and pollution emissions.
11
Toward Next-Generation Transport Systems in Asia Eighth Regional EST Forum in Asia – 2014
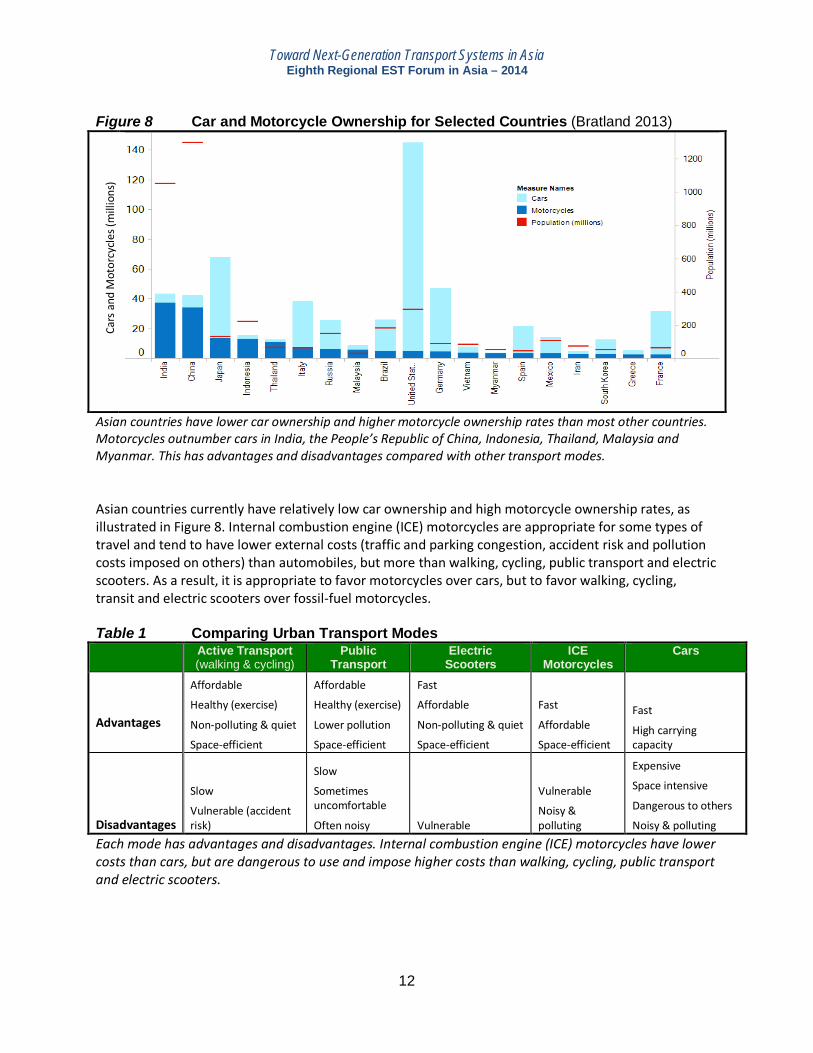
Figure 8 Car and Motorcycle Ownership for Selected Countries (Bratland 2013)
C
ars a
nd M
otor
cycle
s (m
illio
ns)
Asian countries have lower car ownership and higher motorcycle ownership rates than most other countries. Motorcycles outnumber cars in India, the People’s Republic of China, Indonesia, Thailand, Malaysia and Myanmar. This has advantages and disadvantages compared with other transport modes. Asian countries currently have relatively low car ownership and high motorcycle ownership rates, as illustrated in Figure 8. Internal combustion engine (ICE) motorcycles are appropriate for some types of travel and tend to have lower external costs (traffic and parking congestion, accident risk and pollution costs imposed on others) than automobiles, but more than walking, cycling, public transport and electric scooters. As a result, it is appropriate to favor motorcycles over cars, but to favor walking, cycling, transit and electric scooters over fossil-fuel motorcycles. Table 1 Comparing Urban Transport Modes
Active Transport (walking & cycling)
Public Transport
Electric Scooters
ICE Motorcycles
Cars
Advantages
Affordable
Healthy (exercise)
Non-polluting & quiet
Space-efficient
Affordable
Healthy (exercise)
Lower pollution
Space-efficient
Fast
Affordable
Non-polluting & quiet
Space-efficient
Fast
Affordable
Space-efficient
Fast
High carrying capacity
Disadvantages
Slow
Vulnerable (accident risk)
Slow
Sometimes uncomfortable
Often noisy Vulnerable
Vulnerable
Noisy & polluting
Expensive
Space intensive
Dangerous to others
Noisy & polluting Each mode has advantages and disadvantages. Internal combustion engine (ICE) motorcycles have lower costs than cars, but are dangerous to use and impose higher costs than walking, cycling, public transport and electric scooters.
12
Toward Next-Generation Transport Systems in Asia Eighth Regional EST Forum in Asia – 2014
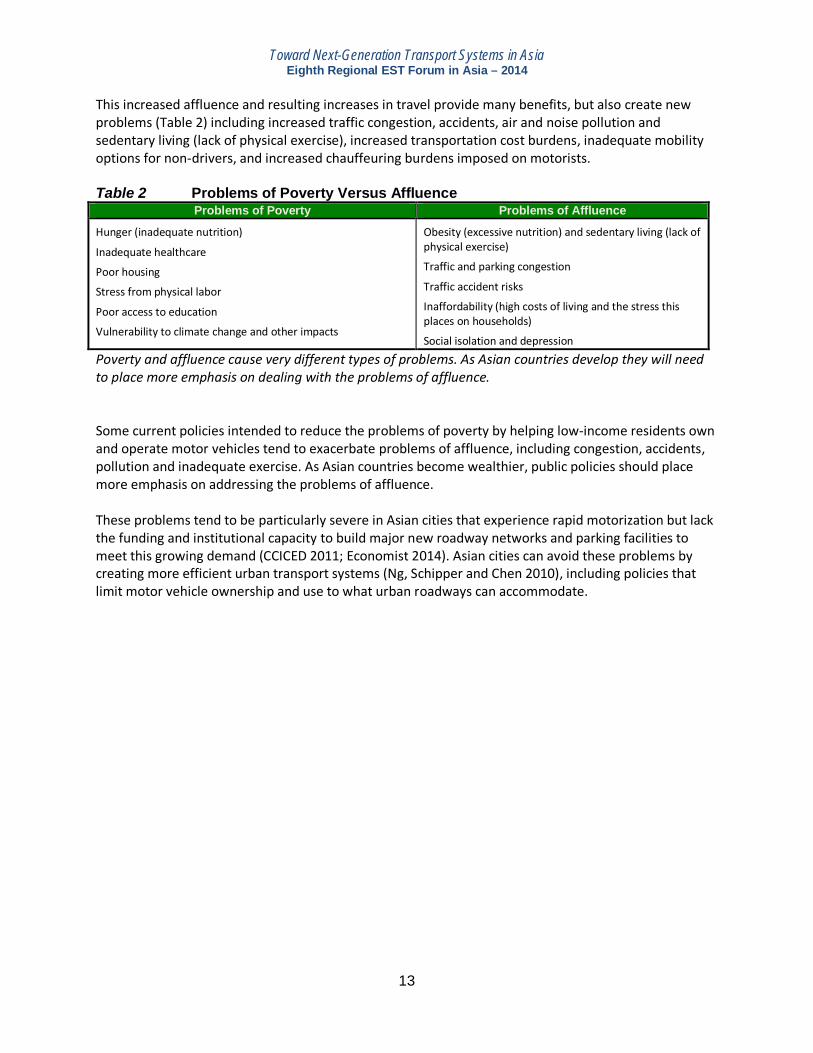
This increased affluence and resulting increases in travel provide many benefits, but also create new problems (Table 2) including increased traffic congestion, accidents, air and noise pollution and sedentary living (lack of physical exercise), increased transportation cost burdens, inadequate mobility options for non-drivers, and increased chauffeuring burdens imposed on motorists. Table 2 Problems of Poverty Versus Affluence
Problems of Poverty Problems of Affluence
Hunger (inadequate nutrition)
Inadequate healthcare
Poor housing
Stress from physical labor
Poor access to education
Vulnerability to climate change and other impacts
Obesity (excessive nutrition) and sedentary living (lack of physical exercise)
Traffic and parking congestion
Traffic accident risks
Inaffordability (high costs of living and the stress this places on households)
Social isolation and depression Poverty and affluence cause very different types of problems. As Asian countries develop they will need to place more emphasis on dealing with the problems of affluence. Some current policies intended to reduce the problems of poverty by helping low-income residents own and operate motor vehicles tend to exacerbate problems of affluence, including congestion, accidents, pollution and inadequate exercise. As Asian countries become wealthier, public policies should place more emphasis on addressing the problems of affluence. These problems tend to be particularly severe in Asian cities that experience rapid motorization but lack the funding and institutional capacity to build major new roadway networks and parking facilities to meet this growing demand (CCICED 2011; Economist 2014). Asian cities can avoid these problems by creating more efficient urban transport systems (Ng, Schipper and Chen 2010), including policies that limit motor vehicle ownership and use to what urban roadways can accommodate.
13
Toward Next-Generation Transport Systems in Asia Eighth Regional EST Forum in Asia – 2014
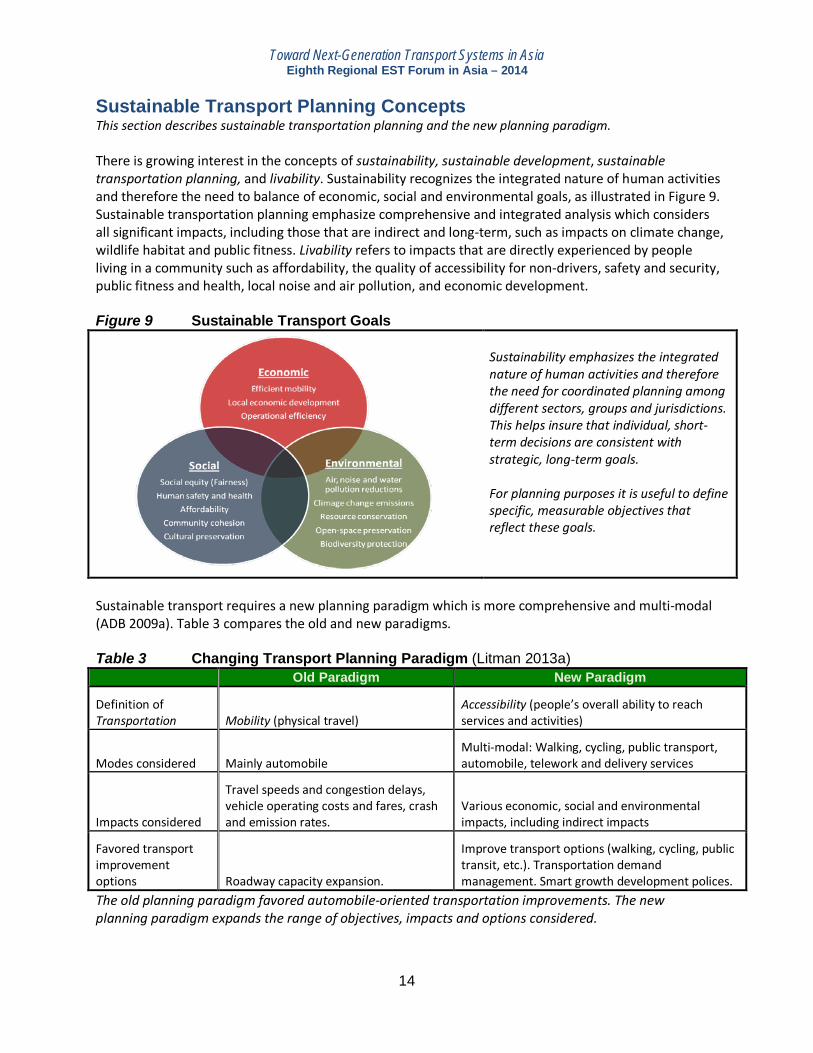
Sustainable Transport Planning Concepts This section describes sustainable transportation planning and the new planning paradigm. There is growing interest in the concepts of sustainability, sustainable development, sustainable transportation planning, and livability. Sustainability recognizes the integrated nature of human activities and therefore the need to balance of economic, social and environmental goals, as illustrated in Figure 9. Sustainable transportation planning emphasize comprehensive and integrated analysis which considers all significant impacts, including those that are indirect and long-term, such as impacts on climate change, wildlife habitat and public fitness. Livability refers to impacts that are directly experienced by people living in a community such as affordability, the quality of accessibility for non-drivers, safety and security, public fitness and health, local noise and air pollution, and economic development. Figure 9 Sustainable Transport Goals
Sustainability emphasizes the integrated nature of human activities and therefore the need for coordinated planning among different sectors, groups and jurisdictions. This helps insure that individual, short-term decisions are consistent with strategic, long-term goals. For planning purposes it is useful to define specific, measurable objectives that reflect these goals.
Sustainable transport requires a new planning paradigm which is more comprehensive and multi-modal (ADB 2009a). Table 3 compares the old and new paradigms. Table 3 Changing Transport Planning Paradigm (Litman 2013a)
Old Paradigm New Paradigm
Definition of Transportation Mobility (physical travel)
Accessibility (people’s overall ability to reach services and activities)
Modes considered Mainly automobile Multi-modal: Walking, cycling, public transport, automobile, telework and delivery services
Impacts considered
Travel speeds and congestion delays, vehicle operating costs and fares, crash and emission rates.
Various economic, social and environmental impacts, including indirect impacts
Favored transport improvement options Roadway capacity expansion.
Improve transport options (walking, cycling, public transit, etc.). Transportation demand management. Smart growth development polices.
The old planning paradigm favored automobile-oriented transportation improvements. The new planning paradigm expands the range of objectives, impacts and options considered.
14
Toward Next-Generation Transport Systems in Asia Eighth Regional EST Forum in Asia – 2014
The new paradigm expands the range of impacts, objectives and options considered in transport planning. Figure 9 identifies various planning goals. For planning purposes it is useful to identify specific, measurable objectives that reflect progress toward these goals, such as those identified in Table 4. For example, if “efficient mobility” is a goal then reducing traffic and parking congestion, and minimizing road and parking facility costs are planning objectives. Table 4 Evaluating Multiple Objectives
Goals Planning Objectives
Efficient mobility Reduce traffic congestion Minimize road and parking facility costs
Social equity Consumer savings and affordability (reduce costs to lower-income households) Improved mobility options for non-drivers
Human safety and health Increase traffic safety (reduce accidents) Increase physical fitness and health
Livability Improve traveler convenience and comfort Support economic development
Environmental quality Reduce air, noise and water pollution Support strategic land development objectives (more compact, “smart growth”) Conserve energy and other natural resources
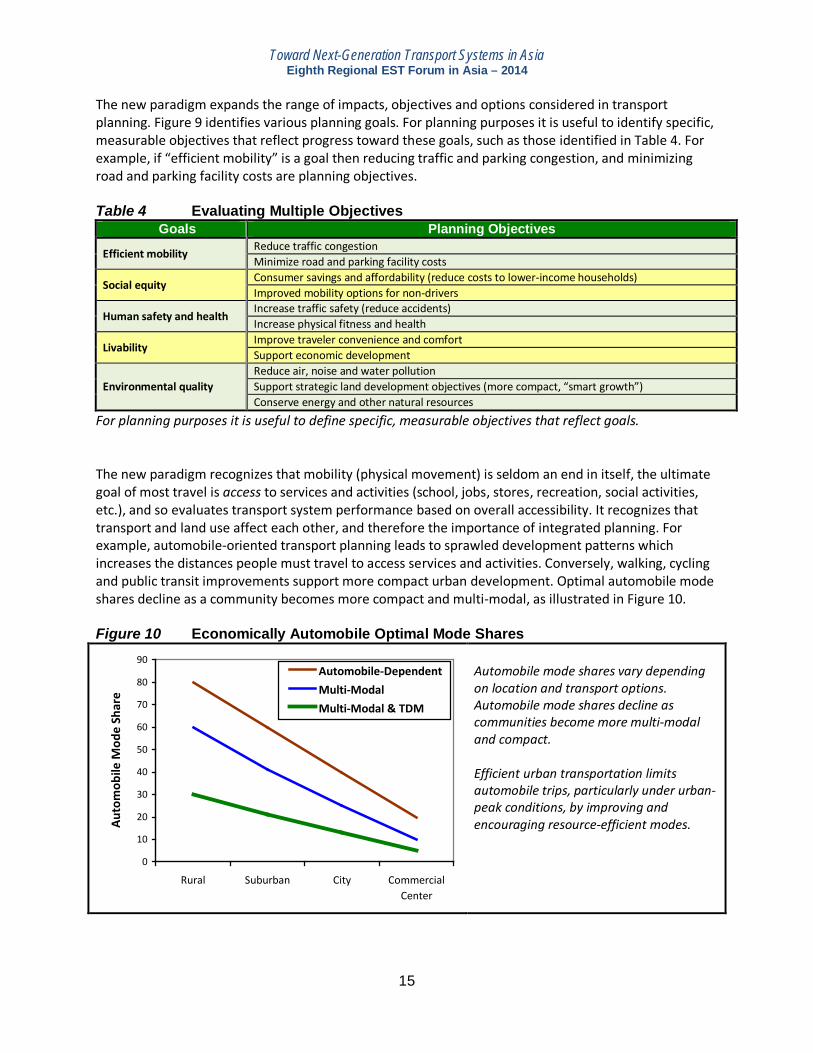
For planning purposes it is useful to define specific, measurable objectives that reflect goals. The new paradigm recognizes that mobility (physical movement) is seldom an end in itself, the ultimate goal of most travel is access to services and activities (school, jobs, stores, recreation, social activities, etc.), and so evaluates transport system performance based on overall accessibility. It recognizes that transport and land use affect each other, and therefore the importance of integrated planning. For example, automobile-oriented transport planning leads to sprawled development patterns which increases the distances people must travel to access services and activities. Conversely, walking, cycling and public transit improvements support more compact urban development. Optimal automobile mode shares decline as a community becomes more compact and multi-modal, as illustrated in Figure 10. Figure 10 Economically Automobile Optimal Mode Shares
0
10
20
30
40
50
60
70
80
90
Rural Suburban City CommercialCenter
Auto
mob
ile M
ode
Shar
e
Automobile-DependentMulti-ModalMulti-Modal & TDM
Automobile mode shares vary depending on location and transport options. Automobile mode shares decline as communities become more multi-modal and compact. Efficient urban transportation limits automobile trips, particularly under urban-peak conditions, by improving and encouraging resource-efficient modes.
15
Toward Next-Generation Transport Systems in Asia Eighth Regional EST Forum in Asia – 2014
This new planning paradigm gives more consideration to Transportation Demand Management (TDM) and smart growth strategies which reduce total vehicle travel and encourage use of more-efficient modes. TDM includes a wide range of strategies, such as those in Table 5. Table 5 Transportation Demand Management Strategies (VTPI 2004) Improves Transport Options Pricing Incentives More Accessible Land
Use Development Implementation
Programs
Public transit improvements (more and faster service, more comfortable stations and vehicles, etc.)
Walking and cycling improvements (better sidewalks, crosswalks, bike lanes, bike parking, etc.)
Rideshare programs
Flextime and Telework
Carsharing and bikesharing
Efficient parking pricing
Road tolls
Congestion pricing (road tolls with higher rates during peak periods)
Reduced fuel subsidies and increased fuel taxes
Distance-based insurance premiums and registration fees
Smart growth policies (encourage more compact, mixed, infill development)
Parking management
Transit oriented development
Streetscaping and traffic calming
Commute trip reduction programs
School and campus transport management
Freight transport management
Tourist transport management
User information and marketing programs.
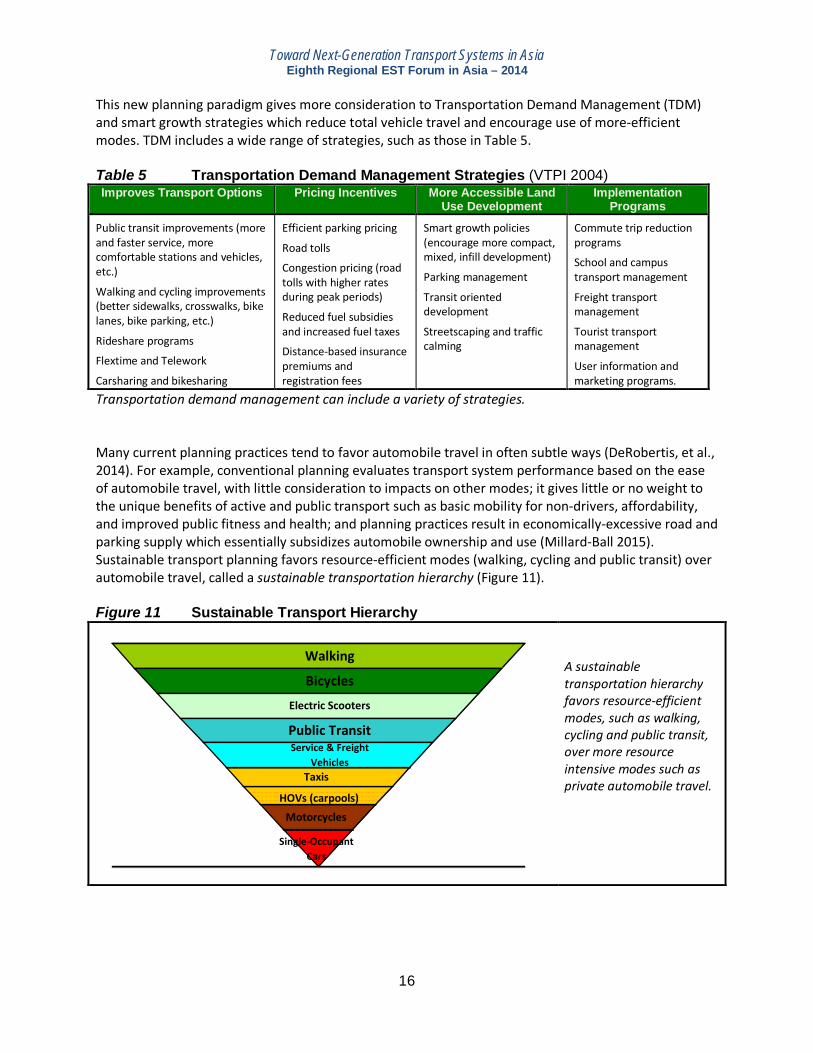
Transportation demand management can include a variety of strategies. Many current planning practices tend to favor automobile travel in often subtle ways (DeRobertis, et al., 2014). For example, conventional planning evaluates transport system performance based on the ease of automobile travel, with little consideration to impacts on other modes; it gives little or no weight to the unique benefits of active and public transport such as basic mobility for non-drivers, affordability, and improved public fitness and health; and planning practices result in economically-excessive road and parking supply which essentially subsidizes automobile ownership and use (Millard-Ball 2015). Sustainable transport planning favors resource-efficient modes (walking, cycling and public transit) over automobile travel, called a sustainable transportation hierarchy (Figure 11). Figure 11 Sustainable Transport Hierarchy
Walking
Bicycles
Electric Scooters
Public TransitService & Freight
VehiclesTaxis
HOVs (carpools)
Motorcycles
Single-Occupant Cars
A sustainable transportation hierarchy favors resource-efficient modes, such as walking, cycling and public transit, over more resource intensive modes such as private automobile travel.
16

Toward Next-Generation Transport Systems in Asia Eighth Regional EST Forum in Asia – 2014
Because conventional planning favors motor vehicle transport and gives little consideration to other modes, it can create a self-reinforcing cycle of expanded roadways, increased vehicle traffic, reduced travel options, and sprawled development patterns, as illustrated in Figure 12. This cycle increases urban transport problems which ultimately harms everybody. Conventional planning tends to only implement TDM solutions when roadway expansion is infeasible. Sustainable transport planning reverses this pattern; it implements TDM strategies as much as possible and only expands roads and parking facilities if TDM solutions are inadequate. Figure 12 From Conventional to Sustainable Transport Planning
Conventional Planning Sustainable Transport Planning
Conventional planning creates a self-reinforcing cycle that increases automobile travel. Sustainable transport planning supports multiple modes, which create more diverse and efficient transport systems. This does not mean that sustainable transport planning eliminates automobile travel altogether, since some trips are most efficiently made by private cars, but a transport system becomes more efficient and sustainable if public policies encourage travelers to use the most resource-efficient mode for each trip. The following section describes specific strategies that cities can use to improve resource-efficient transportation and limit automobile traffic to optimal levels.
Reduced vehicle ownership
Improved walking, cycling
and public transit
conditions
Shifts to walking, cycling and
public transit
Smaller roads and parking
facilities, more investment in other modes
Expanded roads and parking
facilities
Shifts to motor vehicle travel
Increased vehicle ownership and
traffic
Less convenient walking, cycling
and public transit.
17

Toward Next-Generation Transport Systems in Asia Eighth Regional EST Forum in Asia – 2014
Impact Analysis This section identifies factors that affect traffic congestion and accidents. It evaluates various ways to achieve the Three Zero targets and other transport planning objectives. Traffic and Parking Congestion Congestion can be evaluated in various ways that can lead to very different conclusions about its magnitude and the effectiveness of potential solutions (Litman 2013b; Wallis and Lupton 2013). Commonly-used indicators such as roadway level-of-service and the Travel Time Index, reflect congestion intensity, the delay motorists experience during peak periods. They do not account for congestion exposure, the amount people travel by automobile during peak periods, and so they do not account for the congestion avoided when travelers shift from driving to other modes, or from more compact development which reduces travel distances. Per capita congestion costs is a better indicator for evaluating multi-modal and transportation demand management strategies because it recognizes the congestion reduction benefits of mode shifting and more compact development. More comprehensive and multi-modal transport planning expands the scope of potential solutions to congestion problems to include transportation demand management and smart growth policies. Figure 13 Measuring Congestion (Litman 2013b)
Commonly used congestion indicators such as the TomTom Traffic Index and the Travel Time Index measure congestion intensity – the delays motorists experience during peak period. They do not account for exposure – the amount that people must drive during peak periods – and so do not account for the congestion avoided when travelers use alternative modes rather than drive. Per capita congestion costs are a better indicator of overall congestion problems since it accounts for both congestion intensity and exposure.
As cities grow in size and density the number of potential vehicle trips per square-kilometer increases exponentially, so large cities are vulnerable to congestion. Although details vary, cities tend to experience significant traffic and parking congestion problems when ownership rates exceed about 200 vehicles per 1,000 residents. In most cities traffic congestion maintains equilibrium; it increases to the point that residents forego some potential peak-period vehicle trips. For example, if roads are uncongested you might drive across town for errands or commuting, but if congestion is severe you choose a closer destination, shift mode, or wait until rush hour is over. Under those conditions, roadway expansion provides little long-term congestion reduction because the additional capacity is soon filled with latent demand. Durable congestion reductions require changing the point of equilibrium by discouraging automobile travel and encouraging use of space-efficient travel modes, particularly public transit.
18
Toward Next-Generation Transport Systems in Asia Eighth Regional EST Forum in Asia – 2014
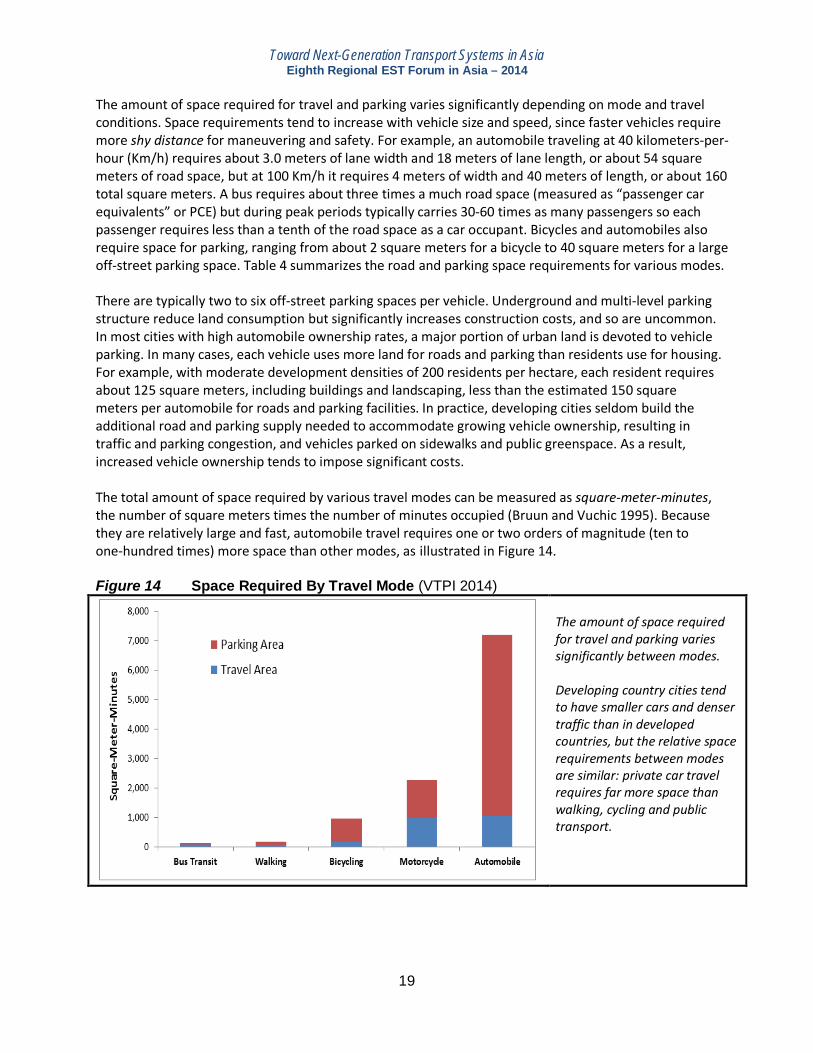
The amount of space required for travel and parking varies significantly depending on mode and travel conditions. Space requirements tend to increase with vehicle size and speed, since faster vehicles require more shy distance for maneuvering and safety. For example, an automobile traveling at 40 kilometers-per-hour (Km/h) requires about 3.0 meters of lane width and 18 meters of lane length, or about 54 square meters of road space, but at 100 Km/h it requires 4 meters of width and 40 meters of length, or about 160 total square meters. A bus requires about three times a much road space (measured as “passenger car equivalents” or PCE) but during peak periods typically carries 30-60 times as many passengers so each passenger requires less than a tenth of the road space as a car occupant. Bicycles and automobiles also require space for parking, ranging from about 2 square meters for a bicycle to 40 square meters for a large off-street parking space. Table 4 summarizes the road and parking space requirements for various modes. There are typically two to six off-street parking spaces per vehicle. Underground and multi-level parking structure reduce land consumption but significantly increases construction costs, and so are uncommon. In most cities with high automobile ownership rates, a major portion of urban land is devoted to vehicle parking. In many cases, each vehicle uses more land for roads and parking than residents use for housing. For example, with moderate development densities of 200 residents per hectare, each resident requires about 125 square meters, including buildings and landscaping, less than the estimated 150 square meters per automobile for roads and parking facilities. In practice, developing cities seldom build the additional road and parking supply needed to accommodate growing vehicle ownership, resulting in traffic and parking congestion, and vehicles parked on sidewalks and public greenspace. As a result, increased vehicle ownership tends to impose significant costs. The total amount of space required by various travel modes can be measured as square-meter-minutes, the number of square meters times the number of minutes occupied (Bruun and Vuchic 1995). Because they are relatively large and fast, automobile travel requires one or two orders of magnitude (ten to one-hundred times) more space than other modes, as illustrated in Figure 14. Figure 14 Space Required By Travel Mode (VTPI 2014)
The amount of space required for travel and parking varies significantly between modes. Developing country cities tend to have smaller cars and denser traffic than in developed countries, but the relative space requirements between modes are similar: private car travel requires far more space than walking, cycling and public transport.
19
Toward Next-Generation Transport Systems in Asia Eighth Regional EST Forum in Asia – 2014
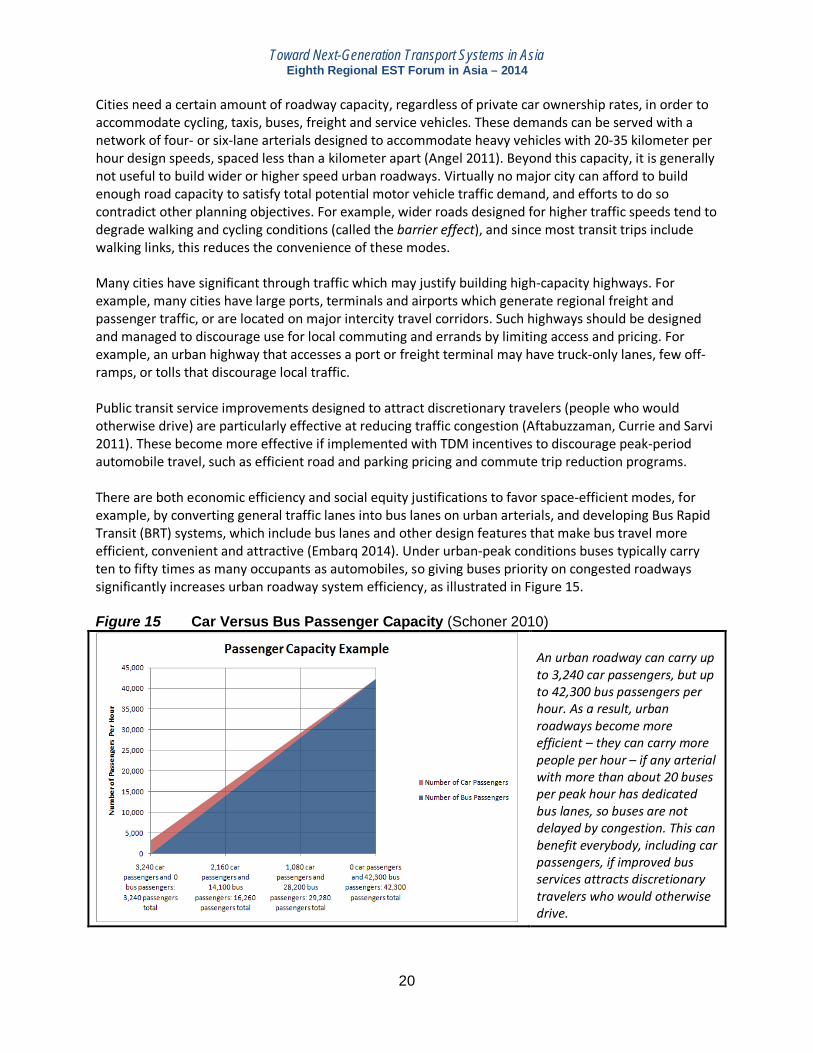
Cities need a certain amount of roadway capacity, regardless of private car ownership rates, in order to accommodate cycling, taxis, buses, freight and service vehicles. These demands can be served with a network of four- or six-lane arterials designed to accommodate heavy vehicles with 20-35 kilometer per hour design speeds, spaced less than a kilometer apart (Angel 2011). Beyond this capacity, it is generally not useful to build wider or higher speed urban roadways. Virtually no major city can afford to build enough road capacity to satisfy total potential motor vehicle traffic demand, and efforts to do so contradict other planning objectives. For example, wider roads designed for higher traffic speeds tend to degrade walking and cycling conditions (called the barrier effect), and since most transit trips include walking links, this reduces the convenience of these modes. Many cities have significant through traffic which may justify building high-capacity highways. For example, many cities have large ports, terminals and airports which generate regional freight and passenger traffic, or are located on major intercity travel corridors. Such highways should be designed and managed to discourage use for local commuting and errands by limiting access and pricing. For example, an urban highway that accesses a port or freight terminal may have truck-only lanes, few off-ramps, or tolls that discourage local traffic. Public transit service improvements designed to attract discretionary travelers (people who would otherwise drive) are particularly effective at reducing traffic congestion (Aftabuzzaman, Currie and Sarvi 2011). These become more effective if implemented with TDM incentives to discourage peak-period automobile travel, such as efficient road and parking pricing and commute trip reduction programs. There are both economic efficiency and social equity justifications to favor space-efficient modes, for example, by converting general traffic lanes into bus lanes on urban arterials, and developing Bus Rapid Transit (BRT) systems, which include bus lanes and other design features that make bus travel more efficient, convenient and attractive (Embarq 2014). Under urban-peak conditions buses typically carry ten to fifty times as many occupants as automobiles, so giving buses priority on congested roadways significantly increases urban roadway system efficiency, as illustrated in Figure 15. Figure 15 Car Versus Bus Passenger Capacity (Schoner 2010)
An urban roadway can carry up to 3,240 car passengers, but up to 42,300 bus passengers per hour. As a result, urban roadways become more efficient – they can carry more people per hour – if any arterial with more than about 20 buses per peak hour has dedicated bus lanes, so buses are not delayed by congestion. This can benefit everybody, including car passengers, if improved bus services attracts discretionary travelers who would otherwise drive.
20
Toward Next-Generation Transport Systems in Asia Eighth Regional EST Forum in Asia – 2014
Described differently, it is unfair that bus passengers, who require minimal road space, are delayed by congestion caused by the much greater road space requirements of private automobile. Bus lanes allow bus passengers to avoid congestion caused by motorists. Active transport (walking and cycling) improvements can also help reduce congestion. Where walking and cycling conditions are very poor, some people will drive for very short trips, for example, to cross a busy arterial or from one parking lot to another. These short trips add friction to traffic, particularly where they enter or exit driveways. Most public transit trips include walking and cycling links, so improving these modes can increase transit travel. The following strategies have proven effective at reducing congestion problems (GIZ 2013; Grant, et al. 2011; Litman 2013b).
1. Improve space-efficient modes. Improve walking and cycling conditions, more frequent and faster public transit services, more comfortable and attractive transit vehicles and stations, lower transit fares, more convenient user information and fare payment systems, and better integration between modes (such as bike parking and rental services at transit stations).
2. Give space-efficient modes priority in traffic. Implement grade-separated rail lines, Bus Rapid Transit (BRT) systems, bus lanes and transit priority traffic signal systems. This makes public transit relatively fast compared with peak-period automobile travel.
3. Apply congestion pricing (road tolls and parking fees that are higher during peak periods). This is the most efficient way to reduce congestion. This also provides revenue.
4. Implement other transport pricing reforms that reduce vehicle travel (road tolls, parking fees, parking cash-out, fuel price increases, distance-based insurance). These also provide revenue and help achieve other planning objectives such as traffic safety and pollution reductions.
5. Discourage vehicle ownership. Some cities use regulations to limit vehicle ownership including lotteries, auctions and high vehicle purchase taxes and registration fees.
6. Implement commute trip reduction programs. Commute trip reduction programs encourage employers to help their employees use alternative modes when traveling to work. Some jurisdictions mandate participation by larger employers (typically those with more than 50 employees located in urban areas), or offer incentives such as reduced parking requirements.
7. Create more accessible, multi-modal neighborhoods. Residents of more compact, walkable and transit-oriented neighborhoods tend to generate fewer vehicle trips and therefore less traffic congestion than in automobile-dependent areas.
8. Use marketing methods to promote space-efficient modes. In many cities, walking, cycling and public transit are stigmatized (they are considered inferior). As a result, many people drive, even for trips that could be efficiently made by other modes, for status sake. Marketing techniques can be used to promote walking, cycling and public transit as productive, healthy and enjoyable modes suitable for successful people.
21

Toward Next-Generation Transport Systems in Asia Eighth Regional EST Forum in Asia – 2014
Accident Reductions As with congestion, traffic accidents can be evaluated in various ways that result in very different conclusions about the nature of this risk and the effectiveness of potential safety strategies. Traffic safety experts often use distance-based units (crashes as per 100 million vehicle-miles or billion vehicle-kilometers), which ignores the additional crashes caused by increased vehicle travel and the safety benefits provided by vehicle travel reduction strategies. Measuring crash rates per capita, as with other health risks, recognizes the safety benefits of vehicle travel reduction strategies. Figure 16 Road Traffic Deaths Per 100,000 Population, 2010 (WHO 2012)
Per capita traffic fatality rates tend to be highest in low-income countries and decline with development. Asian countries have moderate to high rates.
Traffic casualty rates (injuries and deaths) tend to be highest in lower-income countries and decline as countries develop. Asian countries have moderate to high traffic fatality rates, as illustrated in figures 16 and 17. Crash rates will probably decline as Asian countries develop economically, but the speed and amount they decline will depend on their overall transport policies (Welle 2014). Figure 17 Traffic Death Rates For Selected Cities (Welle 2014)
0 5 10 15 20 25 30 35 40
JaipurChennai
DelhiPune
GuadalajaraIndore
LeonCuritiba
ShanghaiCuidad de
JohannesburgSao Paulo
Belo HorizonteBengaluru
KalkataRio de Janeiro
MontevidioLima
AtlantaMumbai
Porto AlegreSurat
RacifeBogota
AhmadabadLos Angeles
ChicagoWashington
New YorkAmsterdam
ParisLondon
Hong KongToykoBerlin
Stockholm
Traffic Deaths Per 100,000 Residents
AsianSouth AmericanAfricanNorth AmericanEuropean
Urban traffic fatality rates vary from under 2 to more than 30 deaths per 100,000 residents. Asian cities currently have relatively high rates, which is typical for lower-income countries. As they develop economically traffic fatality rates are likely to decline. The lowest fatality rates occur in affluent, transit-oriented cities that also apply TDM strategies to limit automobile traffic, such as Berlin, Hong Kong, London, Stockholm and Tokyo. This is how Asian cities can best achieve Zero Accident targets.
22

Toward Next-Generation Transport Systems in Asia Eighth Regional EST Forum in Asia – 2014
The number of crash casualties that occur in a community depend on the crash rates per kilometer and the number of kilometers driven, as illustrated in Table 6. Most traffic safety programs focus on crash rates per kilometer, for example, by improving drivers’ skills and caution, vehicle quality, roadway quality and reducing traffic speeds. However, policies that affect the amount that people drive in a community are equally important in determining the number of crashes that occur in a community. As a result, policies and planning practices that increase total vehicle travel tend to increase crashes, while vehicle travel reduction strategies tend to increase traffic safety. Table 6 Factors Affecting Traffic Casualty Rates Per-kilometer Crash Rates X Number of Kilometers Driven = Total Crashes Factors:
• Driver skill and caution • Vehicle quality • Road conditions • Traffic speeds
• Quality of alternative modes • Urban density and mix • Vehicle ownership • Road, parking and fuel prices
Total crashes in a community are affected by factors which influence per-kilometer crash rates and the total number of kilometers driven in a community. Among economically developed countries there is a strong positive relationship between per capita vehicle travel and traffic deaths, as illustrated in Figure 18. Figure 18 Vehicle Mileage and Traffic Fatality Rates In OECD Countries (OECD Data)
R2 = 0.6405
0
2
4
6
8
10
12
14
16
0 5,000 10,000 15,000 20,000 25,000
Annual Vehicle Kilometers Per Capita
Traf
fic F
atal
ities
Per
100
,000
Pop
.
CanadaDenmarkGermanyIcelandItalyJapanNetherlandsNorwaySwedenSwitzerlandUnited KingdomUnited States
Among economically developed countries there is a strong positive relationship between per capita vehicle travel and traffic deaths. This indicates that policies that increase vehicle travel are likely to increase accidents and TDM policies which reduce vehicle travel can provide significant safety benefits.
23

Toward Next-Generation Transport Systems in Asia Eighth Regional EST Forum in Asia – 2014
Figure 19 Vehicle Mileage and Traffic Fatality Rates Urban Areas (EMBARQ 2012)
As per capita vehicle travel increases in a city total (pedestrian, cyclist, public transit and automobile passenger) traffic fatalities also increase. This provides more evidence that vehicle travel reduction strategies provide traffic safety benefits.
There are similar variations in fatality rates between cities. Traffic fatalities tend to increase significantly with more vehicle travel and decline with increased transit travel, as illustrated in figures 19 and 20. Figure 20 Traffic Fatalities Vs. Transit Travel (Kenworthy and Laube 2000)
R2 = 0.34670
5
10
15
20
25
0 1,000 2,000 3,000 4,000
Annual Per Capita Transit Passenger-Miles
Traf
fic F
atal
ities
Per
100
,000
Pop
ulat
ion
Northern EuropeSouthern EuropeUSCanadaAustralia
Each dot represents a city. Per capita crash rates decline with increased transit ridership. Several factors help explain this effect. Transit travel has about a tenth the traffic casualty rate per kilometer as automobile travel, and many factors that encourage transit travel (better walking and cycling conditions, lower traffic speeds, more compact and mixed development) also help increase traffic safety. In addition, efforts to reduce higher risk driving (by people impaired by alcohol, drugs and dementia) are more successful if travelers have good alternatives to driving.
Various studies using a variety of analysis methods and data sets indicate that increasing transit travel tends to provide proportionately larger reductions in traffic risks, so each one-point increase in transit mode share reduces total traffic casualties several percent (Duduta, et al. 2012; Stimpson, et al. 2014). Several factors help explain these effects (Litman and Fitzroy 2013). Transit passengers have less than a
24
Toward Next-Generation Transport Systems in Asia Eighth Regional EST Forum in Asia – 2014
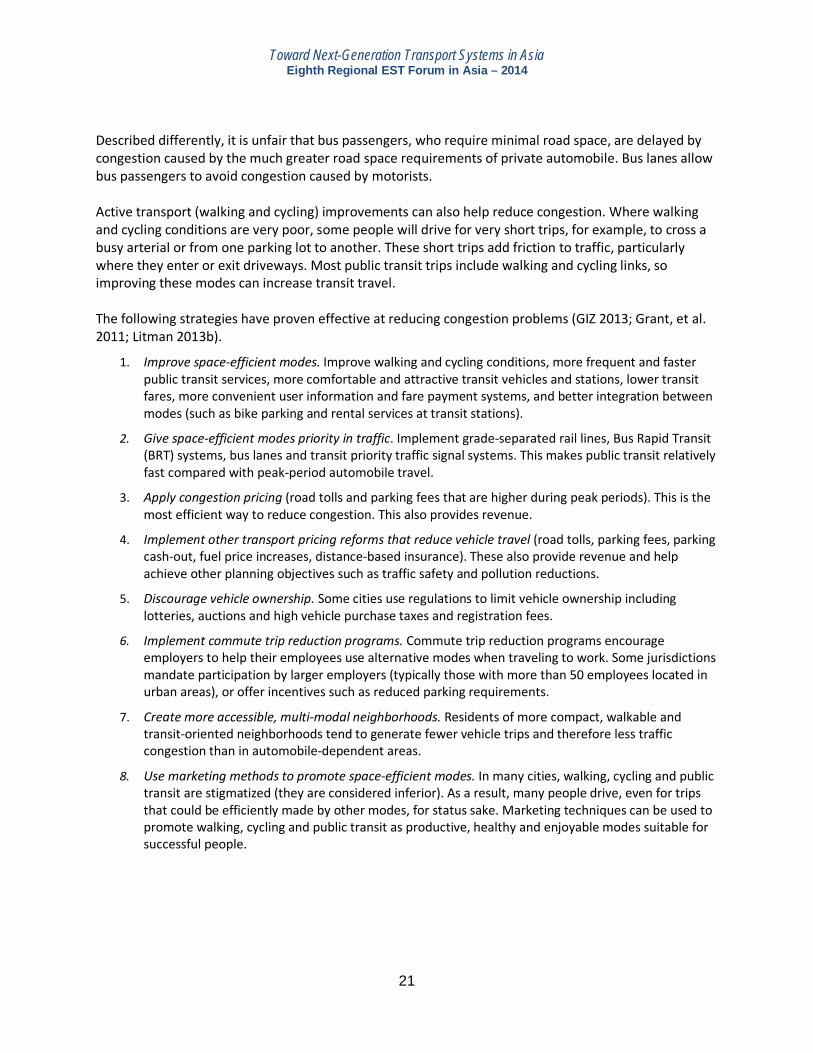
tenth the per-kilometer crash injury rates as automobile occupants. Transport and land use conditions that encourage transit travel, such as good walking and cycling conditions, compact development and lower traffic speeds, also tend to increase traffic safety (Ewing and Hamidi 2014). Higher-risk groups, such as people impaired by alcohol, drugs or dementia, are more likely to reduce driving if they have suitable alternatives, so efforts to reduce higher-risk driving, such as graduated licenses and anti-drunk driving campaigns, are more effective if implemented with public transit improvements. Since most casualty crashes involve multiple vehicles, even responsible drivers who always observe traffic laws and never use transit benefit from transit improvements that reduce total vehicle traffic and higher-risk driving, and therefore their risk of being the victim of other drivers’ mistakes. Most developing country cities have high traffic fatality rates, more than 20 deaths per 100,000 residents, which decline as they develop and implement conventional traffic safety policies such as seat belt and helmet requirements, and impaired driving reduction programs. These strategies usually reduce fatality rates by half, to 10-20 deaths per 100,000, which is typical for affluent, automobile-dependent cities. More compact, multi-modal cities can achieve much greater fatality reductions. If implemented with vehicle travel reduction policies, such as road pricing, they often achieving less than 3 deaths per 100,000 residents, as indicated in Figure 21. This indicates that the Zero Death target can be achieved if Asian cities implement strong policies that create compact, multi-modal communities and reduce vehicle travel. This approach requires a new traffic safety paradigm since most current traffic safety programs ignore the traffic safety benefits of transit and TDM strategies (WHO 2013). Figure 21 Traffic Deaths Trends
Developing country cities typically have 20-30 traffic deaths per 100,000 residents. Affluent, automobile-dependent cities typically have 10-20, transit-oriented cities typically have 5-10, and affluent transit-oriented cities with transportation demand management programs typically have 1.5-4 deaths per 100,000 residents. Although Asian cities’ traffic fatality rates are likely to decline as they develop and implement standard traffic safety policies, achieving the Zero Death target will require transit-oriented communities with strong TDM policies that reduce per capita vehicle travel.
25

Toward Next-Generation Transport Systems in Asia Eighth Regional EST Forum in Asia – 2014
Emission Reductions Motor vehicles produce a variety of harmful pollutants, as summarized in Table 7. Some have local effects, so where they are emitted significantly affects their impacts. For example, carbon monoxide and particulates cause health problems to people immediately downwind of major roadways. Other pollutants, such as ozone and greenhouse gases, have regional and global impacts, so where they are emitted has little impact on the severity of damages they cause. Table 7 Vehicle Pollutants (Litman 2009)
Emission Description Sources Harmful Effects Scale
Carbon dioxide (CO2) A product of combustion. Fuel production and tailpipes. Climate change Global
Carbon monoxide (CO) A toxic gas caused by incomplete combustion. Tailpipes
Human health, climate change Very local
CFCs and HCFC A class of durable chemicals. Air conditioners and industrial activities.
Ozone depletion, climate change Global
Fine particulates (PM10; PM2.5) Inhaleable particles.
Tailpipes, brake lining, road dust, etc.
Human health, aesthetics
Local and Regional
Road dust (non-tailpipe particulates)
Dust particles created by vehicle movement.
Vehicle use, brake linings, tire wear.
Human health, aesthetics Local
Lead Element used in older fuel additives.
Fuel additives and batteries.
Human health, ecological damages Local
Methane (CH4) A flammable gas. Fuel production and tailpipes. Climate change Global
Nitrogen oxides (NOx) and nitrous oxide (N2O).
Various compounds, some are toxic, all contribute to ozone. Tailpipes.
Human health, ozone precursor, ecological damage.
Local and Regional
Ozone (O2)
Major urban air pollutant caused by NOx and VOCs combined in sunlight. NOx and VOC
Human health, plants, aesthetics. Regional
Sulfur oxides (SOx) Lung irritant and acid rain. Diesel vehicle tailpipes. Human health and ecological damage
Local and Regional
VOC (volatile organic hydrocarbons)
Various hydrocarbon (HC) gasses.
Fuel production, storage & tailpipes.
Human health, ozone precursor.
Local and Regional
Toxics (e.g. benzene) Toxic and carcinogenic VOCs. Fuel production and tailpipes. Human health risks Very local
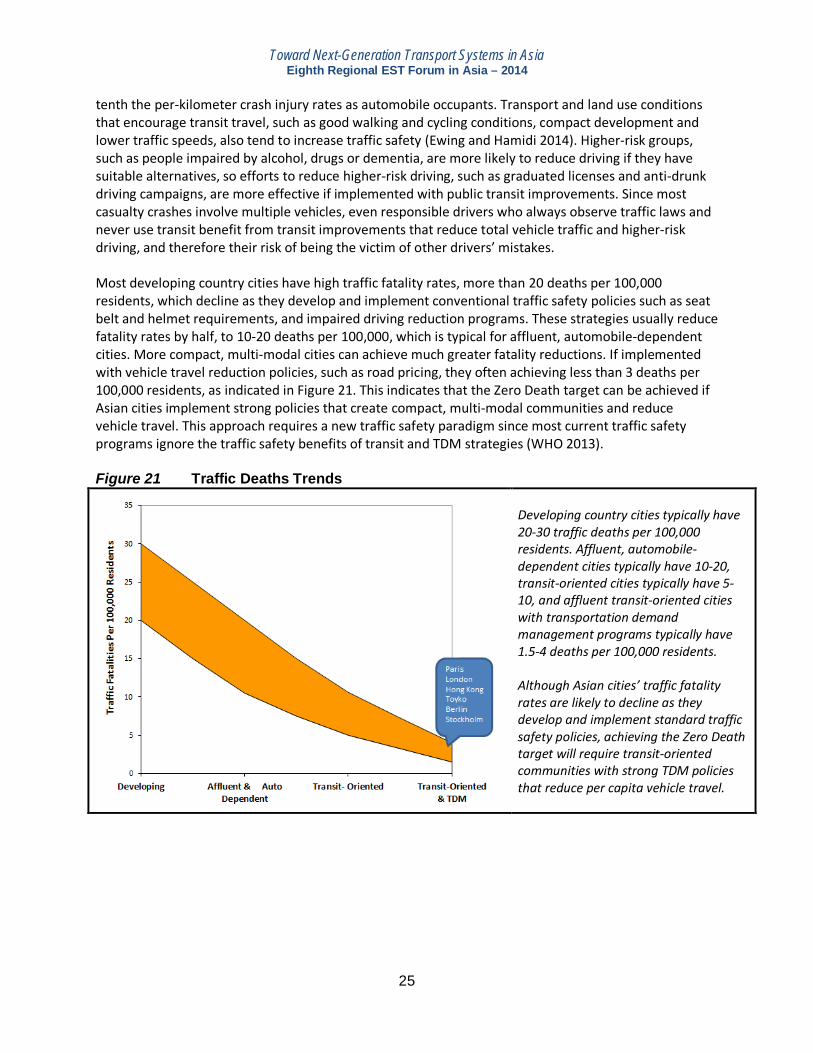
This table summarizes various types of motor vehicle pollution emissions and their impacts. Motor vehicle use is a major contributor to both local and global pollution emissions. Asia is now the largest carbon dioxide emitter and these emissions are increasing rapidly (Figure 22). In 2009, transport was responsible for 23% of global GHG emissions but this portion is predicted to increase significantly if motor vehicle travel increases substantially in developing countries (IPCC 2013). In 2006, Asia accounted for 19% of total worldwide transport–sector related CO2 emissions, and if growth rates continue, by 2030 Asia’s share of total worldwide transport–sector carbon emissions is projected increase to 31% (ADB 2010). Many emission reduction strategies reduce both greenhouse gases (GHGs) and local pollutants (West, et al. 2013). Increased urban densities can increase residents’ exposure to some local pollutants, for example if the number of people who live, work and travel on roadways with high internal-combustion-engine vehicles increases.
26
Toward Next-Generation Transport Systems in Asia Eighth Regional EST Forum in Asia – 2014
Figure 22 Energy-Caused Carbon Dioxide Emissions By Region (BP 2014)
Asia is now the largest carbon dioxide emitter. If current trends continue these emissions are projected to increase rapidly.
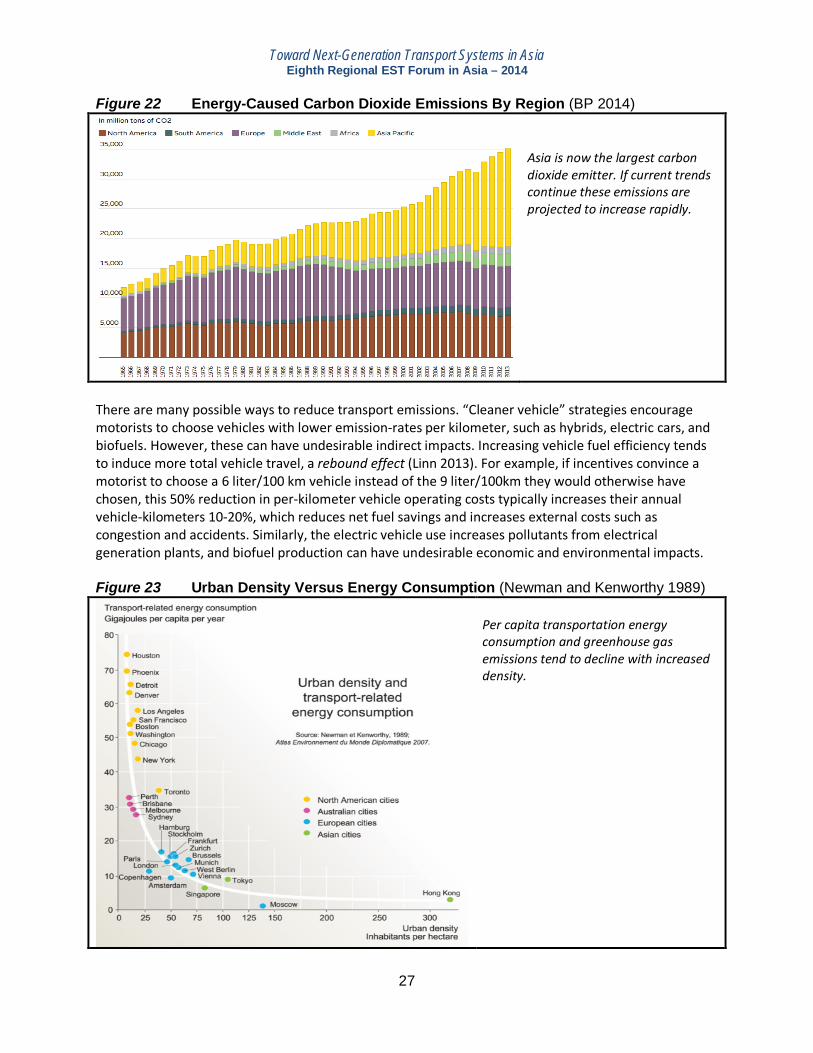
There are many possible ways to reduce transport emissions. “Cleaner vehicle” strategies encourage motorists to choose vehicles with lower emission-rates per kilometer, such as hybrids, electric cars, and biofuels. However, these can have undesirable indirect impacts. Increasing vehicle fuel efficiency tends to induce more total vehicle travel, a rebound effect (Linn 2013). For example, if incentives convince a motorist to choose a 6 liter/100 km vehicle instead of the 9 liter/100km they would otherwise have chosen, this 50% reduction in per-kilometer vehicle operating costs typically increases their annual vehicle-kilometers 10-20%, which reduces net fuel savings and increases external costs such as congestion and accidents. Similarly, the electric vehicle use increases pollutants from electrical generation plants, and biofuel production can have undesirable economic and environmental impacts. Figure 23 Urban Density Versus Energy Consumption (Newman and Kenworthy 1989)
Per capita transportation energy consumption and greenhouse gas emissions tend to decline with increased density.
27
Toward Next-Generation Transport Systems in Asia Eighth Regional EST Forum in Asia – 2014
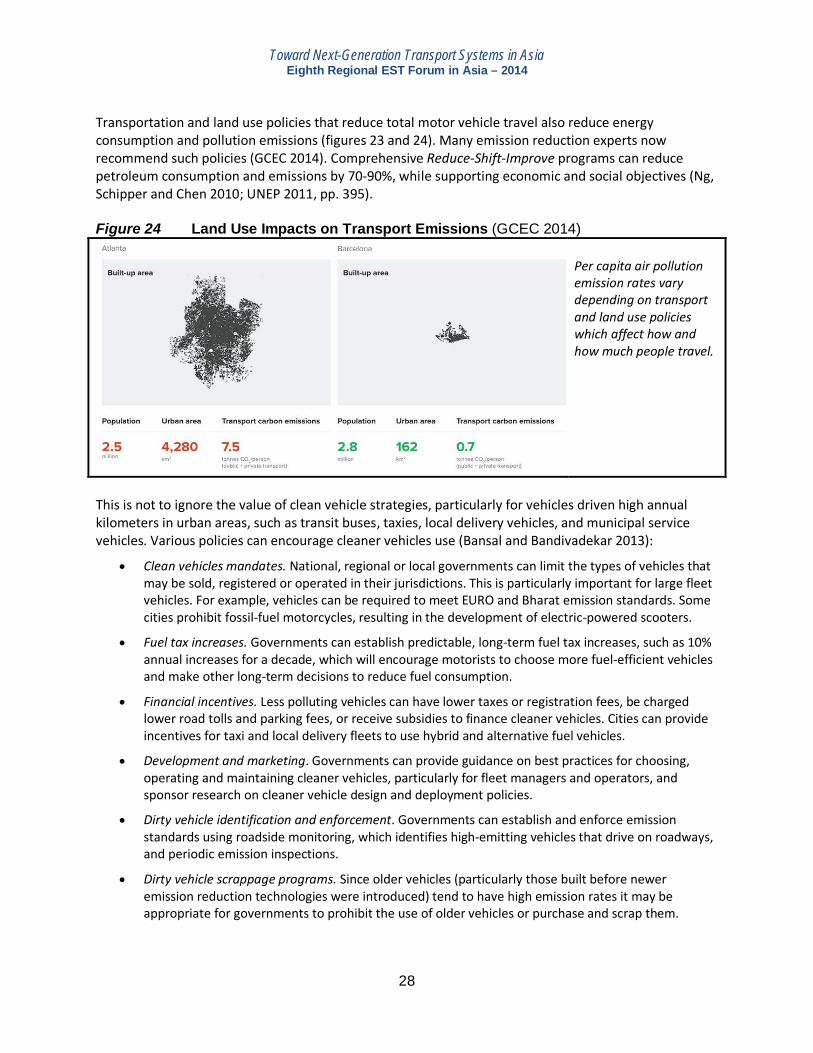
Transportation and land use policies that reduce total motor vehicle travel also reduce energy consumption and pollution emissions (figures 23 and 24). Many emission reduction experts now recommend such policies (GCEC 2014). Comprehensive Reduce-Shift-Improve programs can reduce petroleum consumption and emissions by 70-90%, while supporting economic and social objectives (Ng, Schipper and Chen 2010; UNEP 2011, pp. 395). Figure 24 Land Use Impacts on Transport Emissions (GCEC 2014)
Per capita air pollution emission rates vary depending on transport and land use policies which affect how and how much people travel.
This is not to ignore the value of clean vehicle strategies, particularly for vehicles driven high annual kilometers in urban areas, such as transit buses, taxies, local delivery vehicles, and municipal service vehicles. Various policies can encourage cleaner vehicles use (Bansal and Bandivadekar 2013):
• Clean vehicles mandates. National, regional or local governments can limit the types of vehicles that may be sold, registered or operated in their jurisdictions. This is particularly important for large fleet vehicles. For example, vehicles can be required to meet EURO and Bharat emission standards. Some cities prohibit fossil-fuel motorcycles, resulting in the development of electric-powered scooters.
• Fuel tax increases. Governments can establish predictable, long-term fuel tax increases, such as 10% annual increases for a decade, which will encourage motorists to choose more fuel-efficient vehicles and make other long-term decisions to reduce fuel consumption.
• Financial incentives. Less polluting vehicles can have lower taxes or registration fees, be charged lower road tolls and parking fees, or receive subsidies to finance cleaner vehicles. Cities can provide incentives for taxi and local delivery fleets to use hybrid and alternative fuel vehicles.
• Development and marketing. Governments can provide guidance on best practices for choosing, operating and maintaining cleaner vehicles, particularly for fleet managers and operators, and sponsor research on cleaner vehicle design and deployment policies.
• Dirty vehicle identification and enforcement. Governments can establish and enforce emission standards using roadside monitoring, which identifies high-emitting vehicles that drive on roadways, and periodic emission inspections.
• Dirty vehicle scrappage programs. Since older vehicles (particularly those built before newer emission reduction technologies were introduced) tend to have high emission rates it may be appropriate for governments to prohibit the use of older vehicles or purchase and scrap them.
28

Toward Next-Generation Transport Systems in Asia Eighth Regional EST Forum in Asia – 2014
Other Planning Objectives Although the Bali Vision Zero focuses on three primary goals – reducing traffic congestion, accidents and pollution – there are other planning objectives to consider when evaluating potential transport policies. Efficient Land Development Urban residents’ per capita land consumption can vary by two orders of magnitude, from less than 5 residents per hectare in sprawled neighborhoods to more than 500 residents per hectare in very high density neighborhoods. Reducing per capita land consumption preserves farmlands and ecological functions such as wildlife habitat and groundwater recharge, providing various economic, social and environmental benefits. Optimal urban densities vary depending on specific conditions. Cities surrounded by lower-value land may expand along major development corridors, provided they maintain at least 30 residents per hectare in order to support efficient transit and other public services. However, many cities are geographically constrained or surrounded by lands that have high agriculture or ecological values, and so should develop at higher densities (Litman 2014). Figure 25 illustrates the amount of land that would be consumed (or, perhaps a better term is “directly impacted”) to accommodate the projected 1.2 billion new Asian urban residents at various development densities. At the low densities common in American cities (5-10 residents per hectare), new urban development will consume more land than the total area of many Asian countries. Land consumption is greatly reduced with the moderate densities (50-100 residents per hectare) common in European cities. The very high densities found in some Asian cities (more than 150 residents per hectare) are probably not needed everywhere, but may be appropriate in some geographically-constrained cities. Figure 25 Total Land Consumption for 1.2 billion New Asian Urban Residents
0
500,000
1,000,000
1,500,000
2,000,000
2,500,000
5 10 20 40 80 160 320Residents Per Hectare
Squa
re K
ilom
eter
s
Egypt
Indonisia
MadagascarJapan
Bangladesh
America Europe Asia This graph shows the square kilometers of land consumed to accommodate 1.2 billion new Asian urban residents at various densities compared with the total land area of some Asian countries.
29

Toward Next-Generation Transport Systems in Asia Eighth Regional EST Forum in Asia – 2014
Infrastructure Savings Roads and parking facilities are expensive to build and operate. For example, building and operating urban highways typically costs $50-$1.00 per additional peak-period vehicle-kilometer accommodated, and an urban parking space typically costs $10-20 per day in total costs, so a 20-kilometer automobile commute requires $20-40 in infrastructure costs. Walking, cycling, ridesharing and transit costs are generally much lower. As a result, vehicle travel reduction strategies can provide substantial savings. Consumer Savings and Affordability Motor vehicles are expensive to own and use. Improving affordable modes (walking, cycling and public transit), and providing appropriate, lower-priced housing in accessible, multi-modal neighborhoods tends to provide financial savings and increase consumer affordability. Improve Mobility Options for Non-drivers (Basic Mobility) In most communities a significant portion of the population cannot drive, due to physical, economic or social constraints, and so rely on walking, cycling, public transport and taxi services. Improving these modes, and ensuring that they accommodate physically and economically disadvantaged people, such as wheelchair users and impoverished people, helps achieve social equity objectives (Arora and Tiwari 2007). It also indirectly benefits motorists by reducing traffic problems, chauffeuring burdens, and supporting economic development. For example, improving basic mobility between businesses and low-income neighborhoods can help businesses attract more employees. Improve Public Fitness and Health Public health professionals are increasingly concerned that urban residents fail to exercise enough to be healthy. Although there are many ways to exercise, including organized sports and working out at a gym, few people can maintain such activities throughout their lives. The most effective way to increase community exercise by currently sedentary and overweight people is to encourage regular walking and cycling for transport and recreation. Residents of walkable and bikeable communities are more likely to achieve physical fitness and weight targets then those who live in automobile dependent communities. Improve User Convenience and Comfort Many TDM strategies improve the convenience and comfort of alternative modes. Improving sidewalks and crosswalks, paths, bike lanes and parking facilities and traffic calming improve walking and cycling conditions. Bus priority lanes, more comfortable bus stops and transit stations, more convenient payment systems and improved user information enhance transit travel. This directly benefits users of these modes, in addition to the external benefits that result if these improvements attract travelers who would otherwise drive. Support Strategic Land Use Development Objectives (Reduced Sprawl) Many jurisdictions have strategic land use development objectives such as to preserve wildlife habitat and farmlands, create more compact and accessible communities, increase affordable housing, redevelop older neighborhoods, and reduce impervious surface area. Transport policies that encourage walking, cycling and public transit tend to support these objectives by encouraging compact, infill development and discouraging sprawl. Support Economic Development Economic development refers to progress toward a community’s goals for employment, incomes, productivity, business activity, land development and tax revenue. Transport policies can affect economic development in many ways: more efficient transport tends to increase productivity, more
30
Toward Next-Generation Transport Systems in Asia Eighth Regional EST Forum in Asia – 2014
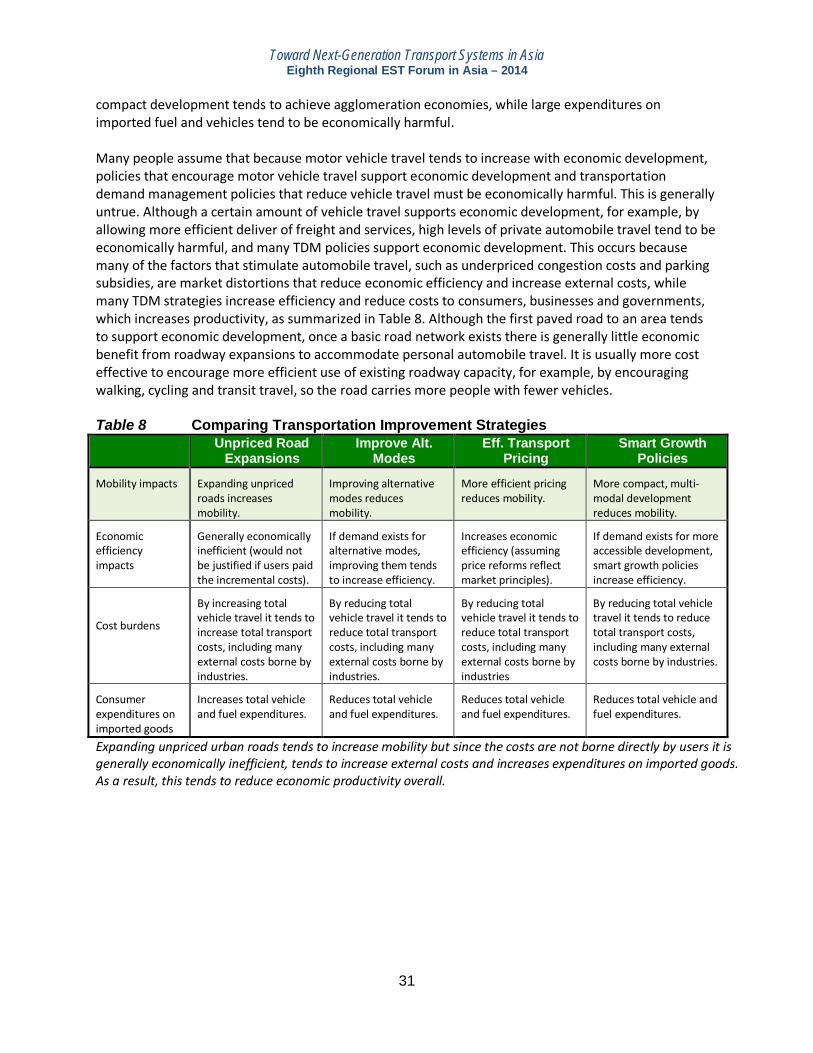
compact development tends to achieve agglomeration economies, while large expenditures on imported fuel and vehicles tend to be economically harmful. Many people assume that because motor vehicle travel tends to increase with economic development, policies that encourage motor vehicle travel support economic development and transportation demand management policies that reduce vehicle travel must be economically harmful. This is generally untrue. Although a certain amount of vehicle travel supports economic development, for example, by allowing more efficient deliver of freight and services, high levels of private automobile travel tend to be economically harmful, and many TDM policies support economic development. This occurs because many of the factors that stimulate automobile travel, such as underpriced congestion costs and parking subsidies, are market distortions that reduce economic efficiency and increase external costs, while many TDM strategies increase efficiency and reduce costs to consumers, businesses and governments, which increases productivity, as summarized in Table 8. Although the first paved road to an area tends to support economic development, once a basic road network exists there is generally little economic benefit from roadway expansions to accommodate personal automobile travel. It is usually more cost effective to encourage more efficient use of existing roadway capacity, for example, by encouraging walking, cycling and transit travel, so the road carries more people with fewer vehicles. Table 8 Comparing Transportation Improvement Strategies
Unpriced Road Expansions
Improve Alt. Modes
Eff. Transport Pricing
Smart Growth Policies
Mobility impacts Expanding unpriced roads increases mobility.
Improving alternative modes reduces mobility.
More efficient pricing reduces mobility.
More compact, multi-modal development reduces mobility.
Economic efficiency impacts
Generally economically inefficient (would not be justified if users paid the incremental costs).
If demand exists for alternative modes, improving them tends to increase efficiency.
Increases economic efficiency (assuming price reforms reflect market principles).
If demand exists for more accessible development, smart growth policies increase efficiency.
Cost burdens
By increasing total vehicle travel it tends to increase total transport costs, including many external costs borne by industries.
By reducing total vehicle travel it tends to reduce total transport costs, including many external costs borne by industries.
By reducing total vehicle travel it tends to reduce total transport costs, including many external costs borne by industries
By reducing total vehicle travel it tends to reduce total transport costs, including many external costs borne by industries.
Consumer expenditures on imported goods
Increases total vehicle and fuel expenditures.
Reduces total vehicle and fuel expenditures.
Reduces total vehicle and fuel expenditures.
Reduces total vehicle and fuel expenditures.
Expanding unpriced urban roads tends to increase mobility but since the costs are not borne directly by users it is generally economically inefficient, tends to increase external costs and increases expenditures on imported goods. As a result, this tends to reduce economic productivity overall.
31

Toward Next-Generation Transport Systems in Asia Eighth Regional EST Forum in Asia – 2014
Empirical evidence indicates that among otherwise similar cities, those that are more compact and multi-modal tend to be more economically productive than those that are more sprawled and automobile-dependent (Melo, Graham and Noland 2009). Figure 26 shows that among U.S. states, those with lower per capita vehicle mileage tend to be more productive than those with less vehicle travel. Figure 26 Per Capita GDP and VMT For U.S. States (VTPI 2009)
R2 = 0.2923
$0
$10,000
$20,000
$30,000
$40,000
$50,000
$60,000
0 5,000 10,000 15,000 20,000Per Capita Annual Mileage (2005)
Per C
apita
Ann
ual G
DP
(200
4)
Per capita economic productivity increases as vehicle travel declines. (Each dot is a U.S. state.)
Figure 27 shows that per capita GDP increases with fuel prices, particularly among oil importing countries (“Oil Consumers”). This suggests that high fuel prices (and therefore, high vehicle operating costs) can increase rather than reduce productivity. Figure 27 GDP Versus Fuel Prices, Countries (Metschies 2009)
R2 = 0.0338
R2 = 0.3157
$0.00
$0.25
$0.50
$0.75
$1.00
$1.25
$1.50
$1.75
$0 $20,000 $40,000 $60,000
Average Annual GDP
Gas
olin
e Pr
ices
Per
Lite
r - 2
004
Oil Consumers
Oil Producers
Linear (OilProducers)
Linear (OilConsumers)
Economic productivity tends to increase with higher fuel prices, indicating that substantial increases in vehicle fees can be achieved without reducing overall economic productivity.
This and other research indicate that policies which increase transport system efficiency by improving resource-efficient modes and applying more efficient pricing encourage economic development, particularly in countries that import petroleum and motor vehicles.
32
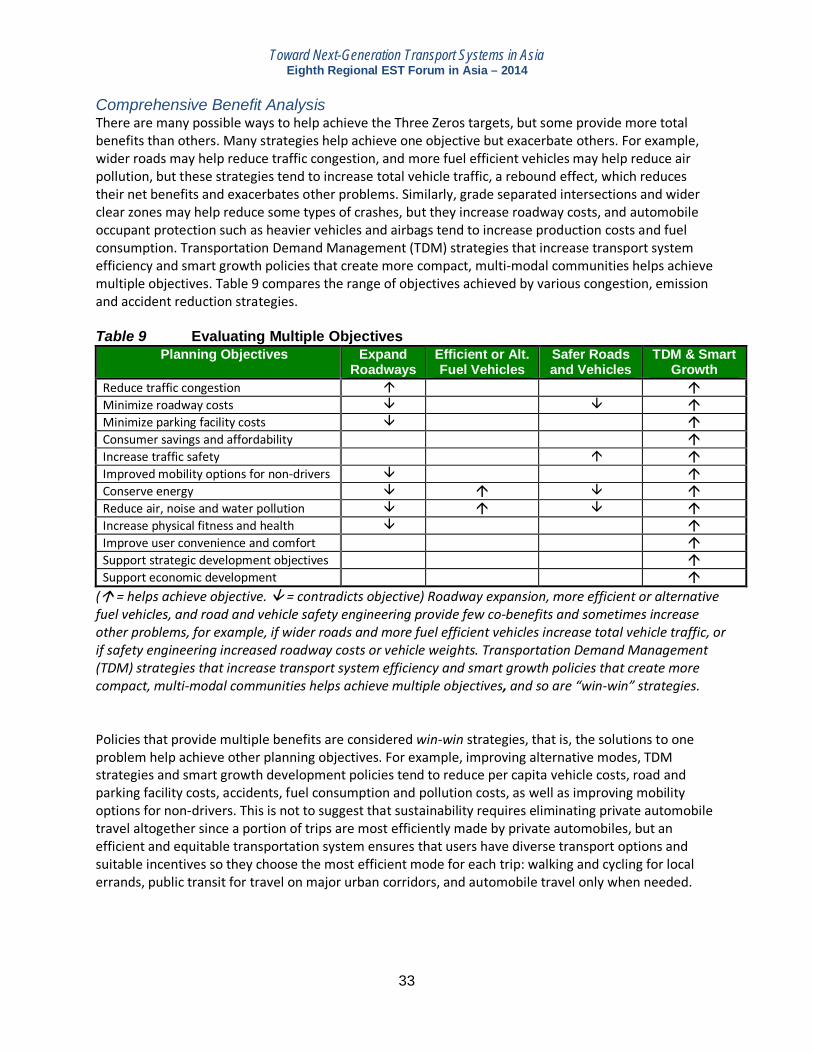
Toward Next-Generation Transport Systems in Asia Eighth Regional EST Forum in Asia – 2014
Comprehensive Benefit Analysis There are many possible ways to help achieve the Three Zeros targets, but some provide more total benefits than others. Many strategies help achieve one objective but exacerbate others. For example, wider roads may help reduce traffic congestion, and more fuel efficient vehicles may help reduce air pollution, but these strategies tend to increase total vehicle traffic, a rebound effect, which reduces their net benefits and exacerbates other problems. Similarly, grade separated intersections and wider clear zones may help reduce some types of crashes, but they increase roadway costs, and automobile occupant protection such as heavier vehicles and airbags tend to increase production costs and fuel consumption. Transportation Demand Management (TDM) strategies that increase transport system efficiency and smart growth policies that create more compact, multi-modal communities helps achieve multiple objectives. Table 9 compares the range of objectives achieved by various congestion, emission and accident reduction strategies. Table 9 Evaluating Multiple Objectives
Planning Objectives Expand Roadways
Efficient or Alt. Fuel Vehicles
Safer Roads and Vehicles
TDM & Smart Growth
Reduce traffic congestion Minimize roadway costs Minimize parking facility costs Consumer savings and affordability Increase traffic safety Improved mobility options for non-drivers Conserve energy Reduce air, noise and water pollution Increase physical fitness and health Improve user convenience and comfort Support strategic development objectives Support economic development
( = helps achieve objective. = contradicts objective) Roadway expansion, more efficient or alternative fuel vehicles, and road and vehicle safety engineering provide few co-benefits and sometimes increase other problems, for example, if wider roads and more fuel efficient vehicles increase total vehicle traffic, or if safety engineering increased roadway costs or vehicle weights. Transportation Demand Management (TDM) strategies that increase transport system efficiency and smart growth policies that create more compact, multi-modal communities helps achieve multiple objectives, and so are “win-win” strategies. Policies that provide multiple benefits are considered win-win strategies, that is, the solutions to one problem help achieve other planning objectives. For example, improving alternative modes, TDM strategies and smart growth development policies tend to reduce per capita vehicle costs, road and parking facility costs, accidents, fuel consumption and pollution costs, as well as improving mobility options for non-drivers. This is not to suggest that sustainability requires eliminating private automobile travel altogether since a portion of trips are most efficiently made by private automobiles, but an efficient and equitable transportation system ensures that users have diverse transport options and suitable incentives so they choose the most efficient mode for each trip: walking and cycling for local errands, public transit for travel on major urban corridors, and automobile travel only when needed.
33

Toward Next-Generation Transport Systems in Asia Eighth Regional EST Forum in Asia – 2014
Principles for More Efficient Urban Transportation This section describes general principles for more efficient transport and community development. To be efficient and equitable a transport system should reflect the following economic principles:
1. Consumer sovereignty. Cities should provide diverse transport options so consumers can choose the
best one for each trip. For example, a transport system is more efficient if travelers who prefer walking, cycling and transit travel have those options available. Similarly, cities should provide diverse location options, for example, by ensuring that affordable housing is available in urban neighborhoods so more people can live near where they work.
2. Cost-based pricing. Efficiency requires that prices (what users pay to consume a good) reflect the full costs of producing that good unless a subsidy is justified for some reason. This tests user’s willingness-to-pay, which ensures that society does not bear two dollars of costs to accommodate a vehicle trip that users only consider worth one dollar, for example, if commuters drive when roads and parking are subsidized, but would otherwise choose more resource-efficient modes. Table 10 indicates the efficient pricing of various transport costs.
Table 10 Efficient Pricing Of Various Transport Costs (Metschies 2013)
Cost Pricing Method How Calculated
Congestion Time and location based vehicle fees or road tolls.
Prices are higher under congested conditions. Price to reduce traffic volume to optimum flow.
Roadway costs Road tolls or weight-distance fees. Cost allocation applied to all roadway costs, including traffic services, rent and taxes on roadway land.
Accident risk Distance-based fees. Insurance premiums should be prorated by annual mileage and increased to account for uncompensated accident costs.
Parking Use time and location based fees to charge users directly for parking.
Fees set to recover parking facility costs and maintain 85% maximum occupancy during peak periods.
Pollution Emissions
Time and location based fees (if possible) or distance-based fee.
A vehicle’s emission rate (such as grams per mile) times regional pollution unit costs (such as cents per gram).
Fuel externalities Fuel tax.
External costs of producing, importing and consuming fuel, including greenhouse gas emissions.
General taxes General sales and property taxes. General taxes should be applied in addition to any special vehicle and fuel taxes and fees.
This table describes the appropriate way to price various transport costs.
Similarly, sprawled development imposes various external economic and environmental costs, including displaced wildlife habitat and farmland, increased costs of providing utilities and public services, and increased transportation costs (Ewing and Hamidi 2014; Litman 2014b). Efficient development charges residents for any additional costs of choosing a sprawled home location.
3. Strategic planning. A basic principle of good planning is that individual, short-term decisions should
be consistent with strategic, long-term goals (SUTP 2013). This means, for example, that transport planning decisions should help support social equity objectives (e.g., helping physically, economically and socially disadvantaged people), health objectives (e.g., increased physical activity and fitness), and environmental objectives (reduced pollution and land consumption).
34

Toward Next-Generation Transport Systems in Asia Eighth Regional EST Forum in Asia – 2014
Current transportation policies often violate these principles: many planning and investment practices favor automobile travel over other modes, vehicle travel is underpriced, and transport and land use planning are often uncoordinated. These distortions result in economically excessive motor vehicle travel. The efficient amount of urban automobile travel is the amount that consumers would choose if they had diverse transport options (good walking and cycling conditions, good public transit services, appropriate housing options in accessible, multi-modal neighborhoods), with efficient pricing of roads, parking, fuel and vehicle insurance. These distortions have cumulative impacts. For example, underpricing road use not only increases traffic congestion, it also exacerbates parking, accidents and pollution problems, while underpriced parking increases traffic congestion. Described more positively, correcting market distortions can provide multiple benefits: more efficient road pricing not only reduces traffic congestion, it also helps reduce parking, accident and pollution problems; and more efficient parking pricing is an effective way to help reduce traffic congestion. Table 11 summarizes various market principles, distortions and reforms needed to create more efficient and equitable transport systems, and their estimated impacts on motor vehicle travel. Table 11 Market Principles, Distortions and Reforms
Market Requirements
Current Distortions Reforms Vehicle Travel Impacts
Transport options. Consumers need viable transportation and location choices.
In many communities, non-automobile travel options are inconvenient, uncomfortable and poorly integrated.
Apply least-cost planning. Improve alternative modes, connection between modes, and information about those options.
Least-cost planning and related reforms are estimated to reduce automobile travel 10-30%.
Optimal Planning. Policies and planning practices should not arbitrarily favor certain goods or groups.
Many public policies (taxes, regulations, etc.) and planning practices favor motor vehicle travel over alternatives.
Apply more neutral policies and least-cost transport planning practices.
More neutral policies and planning practices are estimated to reduce automobile travel 5-10%.
Efficient pricing. Prices should reflect production costs unless a subsidy is specifically justified.
Transport in general, and driving in particular, is underpriced. Many costs are either fixed or external.
Charge directly for roads and parking, distance-based insurance and registration fees and emissions.
Efficient pricing is estimated to reduce automobile travel 20-40%.
This table summarizes optimal market requirements, current distortions, reforms and their travel impacts. Advocates sometimes argue that market distortions, such as vehicle fuel subsidies, unpriced roads and parking, are justified on social equity grounds, in order to make automobile travel affordable to lower-income residents. This is generally untrue, since lower-income people ultimately bear the resulting costs. Roads and parking facilities are never really free, residents either pay directly through user fees, or indirectly, through general taxes and building rents. For example, financing urban highways through general taxes, and incorporating parking into building expenses forces residents to bear their costs regardless of whether or not they use those facilities. Paying directly is more efficient and equitable. Since lower-income households own fewer motor vehicles and drive less on urban highways, this tends to be regressive (poorer households pay a greater portion of their income than higher-income
35
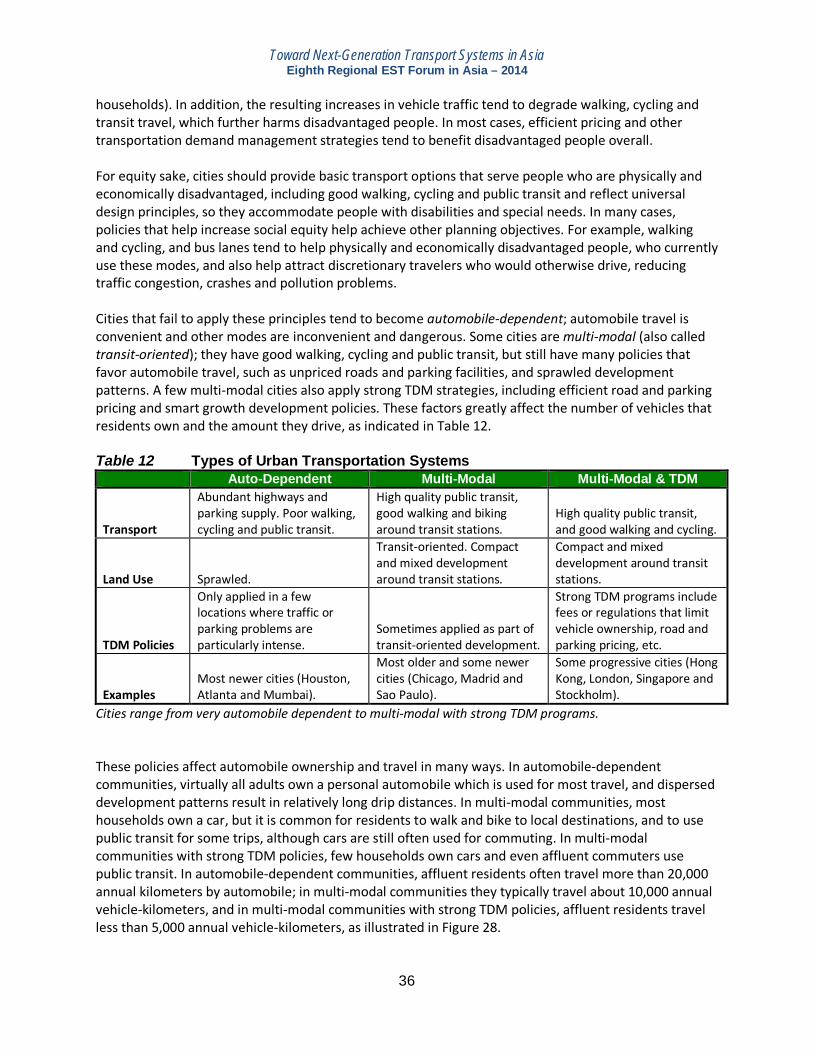
Toward Next-Generation Transport Systems in Asia Eighth Regional EST Forum in Asia – 2014
households). In addition, the resulting increases in vehicle traffic tend to degrade walking, cycling and transit travel, which further harms disadvantaged people. In most cases, efficient pricing and other transportation demand management strategies tend to benefit disadvantaged people overall. For equity sake, cities should provide basic transport options that serve people who are physically and economically disadvantaged, including good walking, cycling and public transit and reflect universal design principles, so they accommodate people with disabilities and special needs. In many cases, policies that help increase social equity help achieve other planning objectives. For example, walking and cycling, and bus lanes tend to help physically and economically disadvantaged people, who currently use these modes, and also help attract discretionary travelers who would otherwise drive, reducing traffic congestion, crashes and pollution problems. Cities that fail to apply these principles tend to become automobile-dependent; automobile travel is convenient and other modes are inconvenient and dangerous. Some cities are multi-modal (also called transit-oriented); they have good walking, cycling and public transit, but still have many policies that favor automobile travel, such as unpriced roads and parking facilities, and sprawled development patterns. A few multi-modal cities also apply strong TDM strategies, including efficient road and parking pricing and smart growth development policies. These factors greatly affect the number of vehicles that residents own and the amount they drive, as indicated in Table 12. Table 12 Types of Urban Transportation Systems
Auto-Dependent Multi-Modal Multi-Modal & TDM
Transport
Abundant highways and parking supply. Poor walking, cycling and public transit.
High quality public transit, good walking and biking around transit stations.
High quality public transit, and good walking and cycling.
Land Use Sprawled.
Transit-oriented. Compact and mixed development around transit stations.
Compact and mixed development around transit stations.
TDM Policies
Only applied in a few locations where traffic or parking problems are particularly intense.
Sometimes applied as part of transit-oriented development.
Strong TDM programs include fees or regulations that limit vehicle ownership, road and parking pricing, etc.
Examples Most newer cities (Houston, Atlanta and Mumbai).
Most older and some newer cities (Chicago, Madrid and Sao Paulo).
Some progressive cities (Hong Kong, London, Singapore and Stockholm).
Cities range from very automobile dependent to multi-modal with strong TDM programs. These policies affect automobile ownership and travel in many ways. In automobile-dependent communities, virtually all adults own a personal automobile which is used for most travel, and dispersed development patterns result in relatively long drip distances. In multi-modal communities, most households own a car, but it is common for residents to walk and bike to local destinations, and to use public transit for some trips, although cars are still often used for commuting. In multi-modal communities with strong TDM policies, few households own cars and even affluent commuters use public transit. In automobile-dependent communities, affluent residents often travel more than 20,000 annual kilometers by automobile; in multi-modal communities they typically travel about 10,000 annual vehicle-kilometers, and in multi-modal communities with strong TDM policies, affluent residents travel less than 5,000 annual vehicle-kilometers, as illustrated in Figure 28.
36
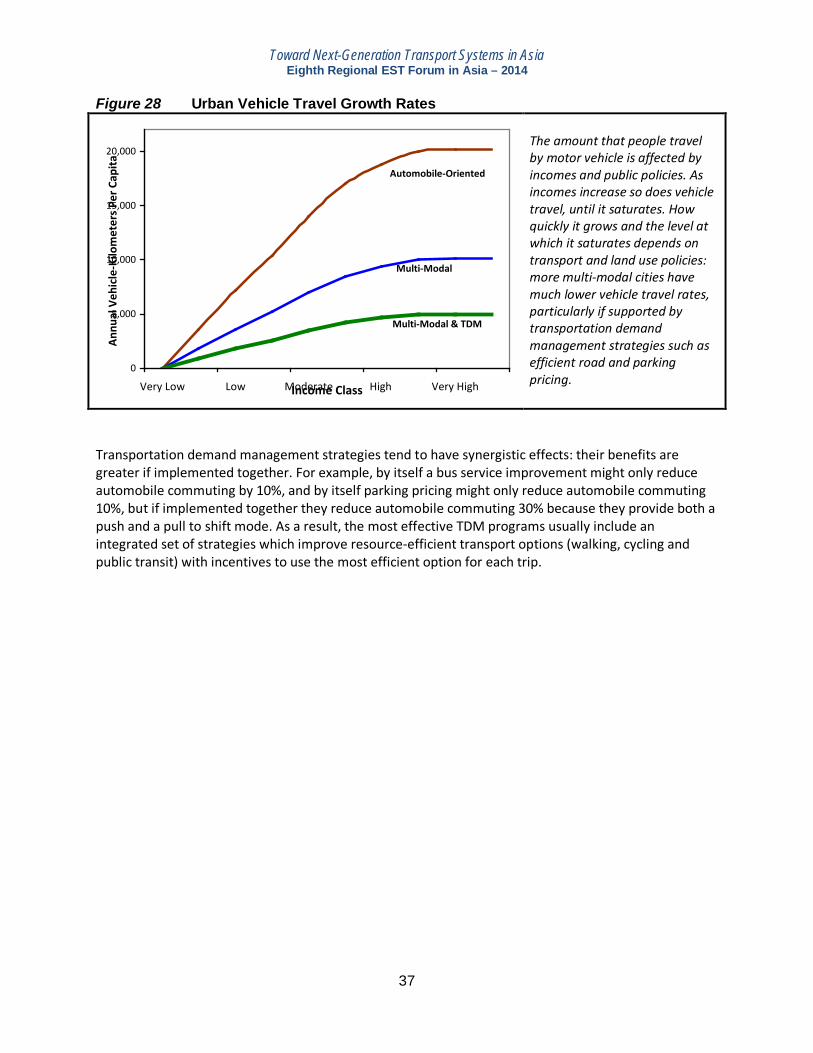
Toward Next-Generation Transport Systems in Asia Eighth Regional EST Forum in Asia – 2014
Figure 28 Urban Vehicle Travel Growth Rates
0
5,000
10,000
15,000
20,000
Very Low Low Moderate High Very HighIncome Class
Annu
al V
ehic
le-K
ilom
eter
s Per
Cap
ita
Automobile-Oriented
Multi-Modal
Multi-Modal & TDM
The amount that people travel by motor vehicle is affected by incomes and public policies. As incomes increase so does vehicle travel, until it saturates. How quickly it grows and the level at which it saturates depends on transport and land use policies: more multi-modal cities have much lower vehicle travel rates, particularly if supported by transportation demand management strategies such as efficient road and parking pricing.
Transportation demand management strategies tend to have synergistic effects: their benefits are greater if implemented together. For example, by itself a bus service improvement might only reduce automobile commuting by 10%, and by itself parking pricing might only reduce automobile commuting 10%, but if implemented together they reduce automobile commuting 30% because they provide both a push and a pull to shift mode. As a result, the most effective TDM programs usually include an integrated set of strategies which improve resource-efficient transport options (walking, cycling and public transit) with incentives to use the most efficient option for each trip.
37
Toward Next-Generation Transport Systems in Asia Eighth Regional EST Forum in Asia – 2014
Policies for More Efficient Urban Transportation This section describes policies to help create more efficient transport systems and sustainable communities. Institutional Reforms These reforms provide a foundation for more efficient and sustainable urban transportation.
1. Integrated planning. As much as possible, integrate transportation and land use planning, and integrate the planning of multiple modes and jurisdictions, so all components of the transport system work together.
2. Multi-modal planning. Transport planning should recognize the roles that different modes play in an efficient and equitable transport system, and therefore the importance of creating a diverse transport system with good walking, cycling, public transit, taxi and delivery services.
3. Complete streets policies. Establish complete streets policies which ensure that streets are designed to accommodate diverse users and uses, including walking, cycling, automobile, public transit, plus business activities and residents located near the roadway.
4. Comprehensive analysis. Policy and project evaluations should consider all impacts and objectives.
5. Least-cost funding. Transportation funding should be allocated to the most cost effective solution, taking into account all impacts, including alternative modes and demand management strategies.
6. Targets. Establish specific targets for system development and performance including sidewalk, road and public transit service supply; vehicle ownership and use; traffic speeds, accidents, energy consumption and pollution emissions; walking and cycling activity; affordability; and the quality of mobility for disadvantaged people.
7. Professional development. Transportation professionals, including planners, engineers and designers, need to learn new concepts and skills in order to implement many of these policies. In developed countries, transport agencies and professional organizations often sponsor professional development programs, including conferences, workshops and webinars to help share such information. Such programs are less common but badly needed in Asian countries.
8. Transportation management associations and parking management programs. Create local organizations which implement TDM policies and programs in a specific area, such as a commercial district, medical center or shopping center.
9. Performance evaluation. Establish comprehensive performance indicators, and establish programs to collect necessary information. For example, collect data and regularly report vehicle ownership, travel activity, travel speeds, congestion delay, multi-modal level-of-service, roadway and parking facility conditions and traffic accidents in each neighborhood and corridor.
Transport Finance Reforms
10. Allocate federal and provincial/state funding based on sustainability principles: funding should favor resource-efficient modes (walking, cycling and public transit), and reward local governments for implementing TDM strategies such as congestion pricing and smart growth development policies.
11. Develop sustainable local transport funding options including road and parking fees, local fuel taxes, land value capture, special tax districts, and per-space parking facility property taxes.
12. Allocate funding using “fix-it-first” priorities, so operations and maintenance are fully funded before capacity expansion projects.
38
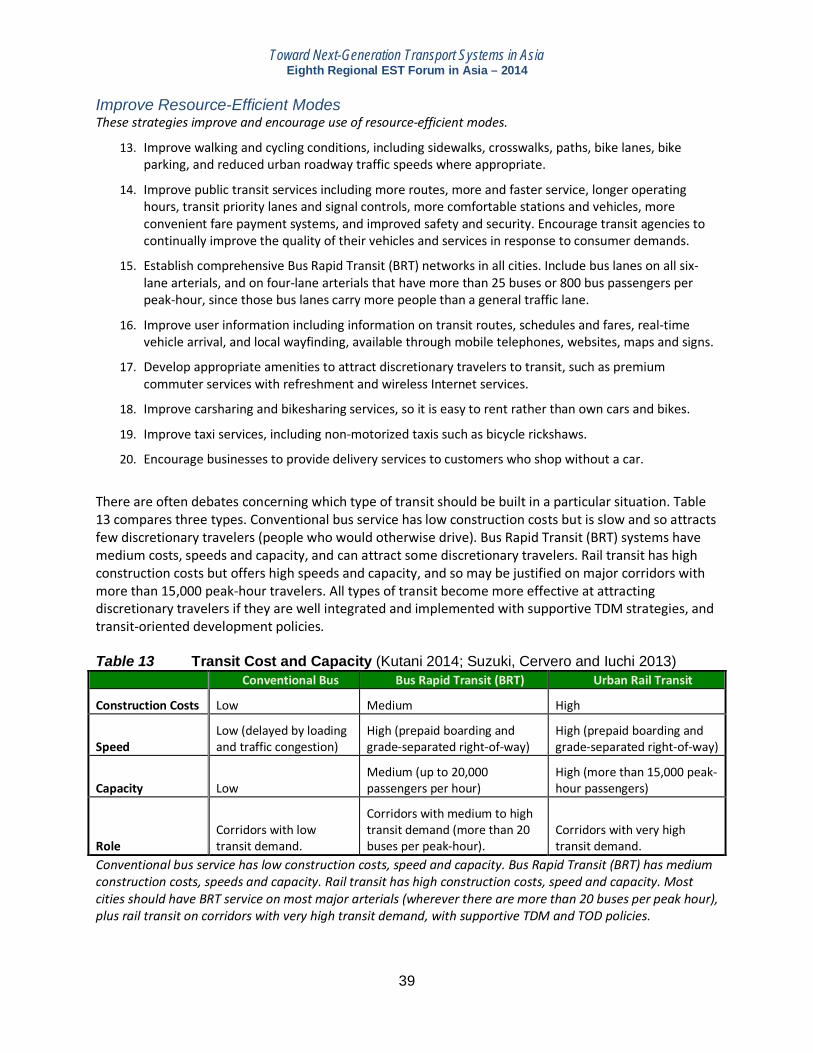
Toward Next-Generation Transport Systems in Asia Eighth Regional EST Forum in Asia – 2014
Improve Resource-Efficient Modes These strategies improve and encourage use of resource-efficient modes.
13. Improve walking and cycling conditions, including sidewalks, crosswalks, paths, bike lanes, bike parking, and reduced urban roadway traffic speeds where appropriate.
14. Improve public transit services including more routes, more and faster service, longer operating hours, transit priority lanes and signal controls, more comfortable stations and vehicles, more convenient fare payment systems, and improved safety and security. Encourage transit agencies to continually improve the quality of their vehicles and services in response to consumer demands.
15. Establish comprehensive Bus Rapid Transit (BRT) networks in all cities. Include bus lanes on all six-lane arterials, and on four-lane arterials that have more than 25 buses or 800 bus passengers per peak-hour, since those bus lanes carry more people than a general traffic lane.
16. Improve user information including information on transit routes, schedules and fares, real-time vehicle arrival, and local wayfinding, available through mobile telephones, websites, maps and signs.
17. Develop appropriate amenities to attract discretionary travelers to transit, such as premium commuter services with refreshment and wireless Internet services.
18. Improve carsharing and bikesharing services, so it is easy to rent rather than own cars and bikes.
19. Improve taxi services, including non-motorized taxis such as bicycle rickshaws.
20. Encourage businesses to provide delivery services to customers who shop without a car.
There are often debates concerning which type of transit should be built in a particular situation. Table 13 compares three types. Conventional bus service has low construction costs but is slow and so attracts few discretionary travelers (people who would otherwise drive). Bus Rapid Transit (BRT) systems have medium costs, speeds and capacity, and can attract some discretionary travelers. Rail transit has high construction costs but offers high speeds and capacity, and so may be justified on major corridors with more than 15,000 peak-hour travelers. All types of transit become more effective at attracting discretionary travelers if they are well integrated and implemented with supportive TDM strategies, and transit-oriented development policies. Table 13 Transit Cost and Capacity (Kutani 2014; Suzuki, Cervero and Iuchi 2013)
Conventional Bus Bus Rapid Transit (BRT) Urban Rail Transit
Construction Costs Low Medium High
Speed Low (delayed by loading and traffic congestion)
High (prepaid boarding and grade-separated right-of-way)
High (prepaid boarding and grade-separated right-of-way)
Capacity Low Medium (up to 20,000 passengers per hour)
High (more than 15,000 peak-hour passengers)
Role Corridors with low transit demand.
Corridors with medium to high transit demand (more than 20 buses per peak-hour).
Corridors with very high transit demand.
Conventional bus service has low construction costs, speed and capacity. Bus Rapid Transit (BRT) has medium construction costs, speeds and capacity. Rail transit has high construction costs, speed and capacity. Most cities should have BRT service on most major arterials (wherever there are more than 20 buses per peak hour), plus rail transit on corridors with very high transit demand, with supportive TDM and TOD policies.
39
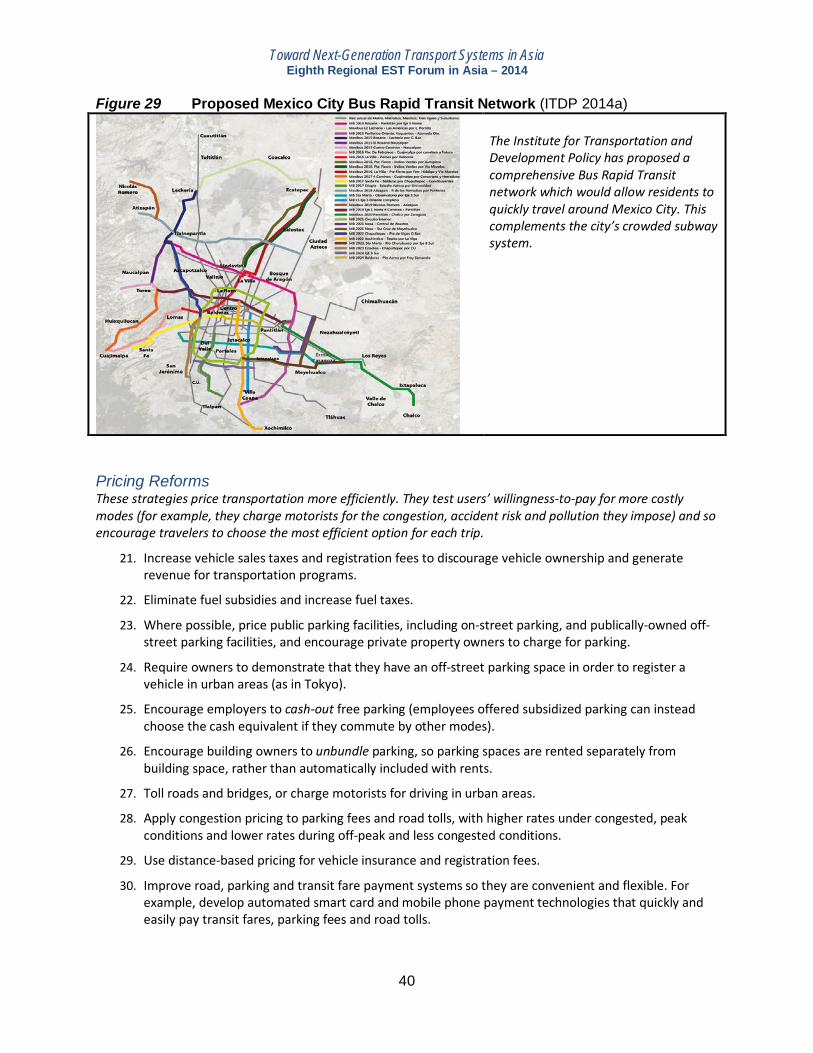
Toward Next-Generation Transport Systems in Asia Eighth Regional EST Forum in Asia – 2014
Figure 29 Proposed Mexico City Bus Rapid Transit Network (ITDP 2014a)
The Institute for Transportation and Development Policy has proposed a comprehensive Bus Rapid Transit network which would allow residents to quickly travel around Mexico City. This complements the city’s crowded subway system.
Pricing Reforms These strategies price transportation more efficiently. They test users’ willingness-to-pay for more costly modes (for example, they charge motorists for the congestion, accident risk and pollution they impose) and so encourage travelers to choose the most efficient option for each trip.
21. Increase vehicle sales taxes and registration fees to discourage vehicle ownership and generate revenue for transportation programs.
22. Eliminate fuel subsidies and increase fuel taxes.
23. Where possible, price public parking facilities, including on-street parking, and publically-owned off-street parking facilities, and encourage private property owners to charge for parking.
24. Require owners to demonstrate that they have an off-street parking space in order to register a vehicle in urban areas (as in Tokyo).
25. Encourage employers to cash-out free parking (employees offered subsidized parking can instead choose the cash equivalent if they commute by other modes).
26. Encourage building owners to unbundle parking, so parking spaces are rented separately from building space, rather than automatically included with rents.
27. Toll roads and bridges, or charge motorists for driving in urban areas.
28. Apply congestion pricing to parking fees and road tolls, with higher rates under congested, peak conditions and lower rates during off-peak and less congested conditions.
29. Use distance-based pricing for vehicle insurance and registration fees.
30. Improve road, parking and transit fare payment systems so they are convenient and flexible. For example, develop automated smart card and mobile phone payment technologies that quickly and easily pay transit fares, parking fees and road tolls.
40
Toward Next-Generation Transport Systems in Asia Eighth Regional EST Forum in Asia – 2014
TDM Programs These programs provide incentives and support for more efficient transport.
31. Implement commute trip reduction and school transport management programs.
32. Implement TDM marketing programs which identify travelers’ needs and preferences, and uses this information to design and promote efficient transport systems.
33. Reform current parking policies which require high levels of parking to be provided in buildings or which encourage free or cheap parking.
34. Implement parking management programs, particularly in large commercial centers and other locations with severe parking problems.
35. Integrate traffic safety and TDM programs. For example, traffic safety programs should target risks to pedestrians, cyclists and public transit passengers, and efforts to discourage impaired and distracted driving should include improvements to alternative modes.
Smart Growth Development Policies These policies create more compact, accessible, multi-modal communities.
36. Establish strategic local and regional development plans which identify where and when development should occur. Use these plans to determine when arterial roadways and urban utility networks should be expanded.
37. Develop “urban villages,” compact, mixed residential communities where commonly-used services (shops, schools, healthcare clinics, parks, recreation centers, religious buildings, and public transit) are located within convenient walking and cycling distances of homes.
38. Develop attractive urban neighborhoods that include sufficient openspace such as parks, trails, recreation centers, plazas, and other community centers.
39. Reduce restrictions on density, building heights and setback.
40. Reduce or eliminate minimum parking requirements. Develop parking management plans which encourage efficient use of parking facilities, including sharing and pricing.
41. Apply location-based pricing, with development and utility fees, and tax rates which reflect the lower costs of providing public services in more compact locations.
42. Provide diverse housing options in compact, transit-oriented neighborhoods, including housing that accommodates people with low incomes, disabilities, large families and other special needs.
43. Develop sustainable municipal funding systems that encourage efficient development and ensure that cities will be able to provide services.
Freight Transport
44. Improve rail and marine infrastructure to make these modes more competitive with trucking.
45. Use road pricing and regulations to favor freight vehicles on major urban roadways.
46. Develop intermodal freight transport plans to improve freight transport efficiency, including development of intermodal terminals.
47. Encourage use of low-polluting urban delivery vehicles, including hybrid and electric vehicles.
41
Toward Next-Generation Transport Systems in Asia Eighth Regional EST Forum in Asia – 2014
Vehicle Improvements
48. Regulations. Establish emission standards for vehicles sold, registered or operated in the city. Standards can be particularly strict for fleets such as buses, taxis, freight, and service vehicles. For example, urban buses and trucks can be required to meet EURO VI heavy vehicle emission standards.
49. Incentives. Less polluting vehicles can have lower taxes or registration fees, or receive subsidies to finance cleaner vehicles, such as hybrid and alternative fuel vehicles.
50. Fuel tax increases. Establish predictable, long-term fuel tax increases, such as 10% annual increases for a decade, which will encourage motorists to choose more fuel-efficient vehicles and make other long-term decisions to reduce fuel consumption.
51. Development and marketing. Provide guidance on best practices for choosing, operating and maintaining cleaner vehicles, particularly for fleet managers and operators, and sponsor research on cleaner vehicle design and deployment policies.
52. Dirty vehicle identification and enforcement. Use roadside monitoring and periodic vehicle inspections (such as annual) to identify high-emitting vehicles that require repair or scrappage.
53. Dirty vehicle scrappage programs. Since older vehicles (particularly those built before newer emission reduction technologies were introduced) tend to have high emission rates it may be appropriate for governments to prohibit the use of older vehicles or purchase and scrap them.
42
Toward Next-Generation Transport Systems in Asia Eighth Regional EST Forum in Asia – 2014
Examples This section describes examples of cities that are implementing more sustainable transport policies. People’s Republic of China Transit Metropolis is a national program that aims to promote high quality transit services and transit-oriented development in Chinese cities. Under the Transport Development Plan released in 2011, Transit Metropolis development will begin in 30 cities by 2015. Currently, six cities (Beijing, Shanghai, Tianjin, Guangzhou, Shenzhen, and Nanjing) have metro rail systems, and this is expected to increase significantly, with 158 new rail lines with a total length of more than 6,100 km planned in 10 Chinese cities (Beijing, Shanghai, Tianjin, Guangzhou, Shenzhen, Nanjing, Wuhan, Zhengzhou, Hefei, and Guiyang) by 2020 (Peng, Son and Lu 2012). Seventeen cities currently have or are building BRT systems, and there are plans to develop such systems in other Chinese cities. Starting in the 1990s, many PRC cities began to prohibit gasoline-powered motorcycles, which lead to the development of high-quality electric bicycles (e-bikes) and scooters (ADB 2009b). China is now the world’s largest producer, exporter and consumer of these vehicles. Some Chinese cities also limit car ownership. Starting in 2010, Beijing adopted a new license plate “lottery” system to restrict the number of new car purchases to only 240,000 in 2011, about a third of the number registered in 2010. Guangzhou Guangzhou’s BRT network has 47 lines, many of which operate on bus-only lanes, and carries 850,000 daily passengers. This is the first large capacity BRT system outside South America. In 2010 Guangzhou also launched a bike sharing system with 5,000 bikes and 113 stations, primarily along the BRT corridor, making Guangzhou one of the ten largest bike sharing systems worldwide. The city is building bike lanes on major roadways. It also opened the Donghaochong greenway, a 4km off-street bikeway and walkway combined with parks, plazas and children’s playgrounds. This is part of a comprehensive plan to develop dozens of kilometers of high quality greenways throughout the city. Hangzhou In 2008, Hangzhou, China established a public bicycle programme that integrates with the public transit network (ICLIE 2011). Docking stations for public bicycles were placed near transit stations. Since the programme began, the use of public bicycles has increased. In 2013, the system averaged 325,000 daily trips, and bicycle mode share from 34% in 2008 to 43% in 2011. India Public transport in Indian cities has not expanded to serve the rapid increases in demand during the past few decades, leading to crowding and unreliability, resulting in declining modal share, which contributes to severe urba traffic congestion. In 2012, India’s National Transport Development Policy Committee produced a comprehensive urban transport policy which identifies strategic goals, objectives, policy reforms and professional capacity building needed to create more efficient and equitable transport systems (NTDPC 2012). The plan emphasizes the need to Avoid, Shift and Improve urban transport systems. It aims for public transport mode share to increase to 60% of motorized trips. To accomplish these goals the policy promotes bus and non-motorized priority systems, road and parking pricing reforms, vehicle use restrictions and commute trip reduction programs. Ahmedabad, Jaipur, Vizag, Pune and Delhi have BRT systems, and in 2011, nine Indian cities received federal funds for new BRT projects (Mahadevia, Joshi and Datey 2013). New BRT systems have proven to be very successful in Indian cities (EMBARQ India 2014).
43

Toward Next-Generation Transport Systems in Asia Eighth Regional EST Forum in Asia – 2014
In 2014, the City of Chennai Corporation Council adopted a progressive policy that makes non-motorized transport, a planning priority. The policy aims to arrest the current decline in walking and cycling in the city by creating safe and pleasant network of footpaths, cycle tracks, greenways and other NMT facilities. The City has set ambitious goals: by 2018, it plans to build safe and continuous footpaths on at least 80% of all streets, increase the share of walking and cycling trips to over 40%, and eliminate pedestrian and cyclist deaths. The policy mandates that a minimum of 60% of the City’s transport budget will be allocated to construct and maintain NMT infrastructure. India also has several non-governmental organizations (NGOs) that are working to support sustainable urban transportation. The Institute for Transportation and Development Policy published the, Better Street, Better Cities: A Guide To Street Design In Urban India (ITDP 2011), which provides detailed information on complete streets planning suitable for Asian cities. The Centre for Science and Environment, a network of professionals interested in environmental and sustainable development issues located in New Delhi, sponsors research on transport and land use policy reform to create more efficient, equitable and livable cities. The Tata Energy Research Institute is the largest sustainable development research institution located in the developing world. South Korea South Korea is implementing several transport policy reforms that support sustainable transport, which they call Green Growth, as summarized in Table 14. Table 14 Strategy and Policies for Low-carbon Green Growth (KOTI 2011) Strategy Core Policies
Expanding green transportation capital
• A rail-centered transportation system • Bicycle infrastructure •Green logistics • Green airports
Creating green transportation cities
• High-density mixed-use urban development around KTX stations • Public transit-oriented compact cities • Green pedestrian space
Enhancing transportation demand management
• Congestion pricing (Eco-pass) • Compulsory implementation of congestion management programs • Transport carbon emissions evaluation and emissions charging systems
Securing green lifestyle support system
• Income tax deduction for public transit expenses •Green car insurance • Promotion of bicycle use • Promotion of environmentally-friendly cars
Developing and applying green technology development and application
• Green power plants using transportation facilities • Bike rapid transit • Wireless power supply-based transportation systems • Smart grids • Intelligent bicycles • U-Transportation
Consolidating the foundation for green transportation promotion
• Improving transportation investment evaluation systems • Green transportation development evaluation system
Promoting South-North green transport • Inter-Korean peace waterway South Korea has established “Green Growth” policies that help support economic development and environmental quality.
44
Toward Next-Generation Transport Systems in Asia Eighth Regional EST Forum in Asia – 2014
London Since 2003 the city of London has charged a fee for driving private vehicles in central business district during weekdays, in order to reduce traffic congestion and raise revenues for transport improvements. This has reduced car traffic by 30% and total motor vehicle travel by 12%, which has reduced crashes by 28%, and pedestrian crash injuries by 6%. Despite considerable controversy the program was implemented without major problems, and has substantially reduced traffic congestion, improved bus and taxi service, and is generating revenues. Vehicle travel speeds have increased, bus transit service has improved, while accidents and air pollution have declined in the city center. Public acceptance has grown and there is now support to expand the program to other parts of London. In 2004 Mayor Livingstone was reelected, largely due to the success of the congestion pricing program. Mexico City To create a vision of a more efficient transportation system in one of the world’s largest cities, the Institute for Transportation and Development Policy developed a comprehensive proposal to build new integrated public transport routes throughout Mexico City urban region (ITDP 2014). This concept would expand the two current BRT routes to 31 and add nearly 500 additional kilometers, providing the benefits of BRT to 7.5 million new passengers daily. This plan could be implemented quickly and with modest costs compared with highway or subway system expansions. To complement these efforts, Mexico City is also developing bike lanes and bikeshare systems, implementing parking policy reforms, and supporting transit-oriented development. New York In 2008 the New York City Department of Transportation released Sustainable Streets, the agency's strategic plan. Since then New York City has implemented numerous roadway design changes to make the city safer, more efficient and livable, including wider sidewalks, bus and bike lanes, and lower traffic speeds. The plan includes new performance indicators which show that these design changes have significantly reduced crashes, improved retail activity, and in many cases have increased travel speeds. Seoul In 2004, the then city mayor (later President of South Korea) Myun-Bak Lee initiated policy reforms that have made the transport system more efficient and the city more livable. These included integrated planning and fares among buses, rails, and subways, development of a BRT network, as well as cycling and pedestrian improvements that provide a good example for other Asian cities. It also eliminated a major highway which bisected downtown Seoul, and built a greenway walking trail along the Cheonggyecheon River (see Figure 30). Before the reform, a number of private companies, with uncoordinated operations in terms of routes, schedules, or other services, managed bus services in Seoul. The Seoul metropolitan government was responsible only for determining fares. As a result, buses competed at the profitable routes, provided poor service quality, and frequently caused accidents. Such poor service quality deteriorated the city dwellers’ confidence in buses, increased reliance on passenger vehicles, worsened congestion, and increased illegal parking and accidents. Of course, these factors resulted in air quality problems and wasteful energy use.
45

Toward Next-Generation Transport Systems in Asia Eighth Regional EST Forum in Asia – 2014
Figure 30 Seoul City Center Transformation
The Cheonggyecheon River in Seoul before (left) and after (right). This highway removal was possible because the new Bus Rapid Transit system reduced car traffic. These changes resulted in a more efficient and livable city. Singapore Soon after it was founded in 1965, the city-state of Singapore established a cohesive, long-term urban plan, based on “people-centered” principles, which organized the city into districts connected by a high capacity mass transit system. These included historic and lower-density openspace districts, and new, high-density, mixed-use residential districts. The city also recruits top staff and established world-class research institutes, including the Land Transport Authority Academy. To achieve these goals, Singapore implemented bold policies including vehicle registration quotas and city-wide dynamic congestion pricing. This means that when congestion increases, so does the fee. This keeps the freeways flowing smoothly at 35-65 km/hr. and other roads at 20-30 km/hr. Revenues from the vehicle registration and congestion pricing fees are used to improve and maintain Singapore’s world class transit system, which includes a combination of heavy rail, light rail and high-quality buses. The current metro network is 178 km and the city plans to double this to 360 km by 2030, meaning 80% of households would be within a ten-minute walk of a railway station. The city-state also has plans to add bus lanes and signal priority systems, and electrify the vehicle fleet to reduce local air pollution emissions. For pedestrians and bikers, the city will extend shaded walkways and bikeways. Singapore aims to achieve 70% of trips by public transport by 2020, and provide 0.8 hectares of green park space for every 1,000 residents by 2030.
46

Toward Next-Generation Transport Systems in Asia Eighth Regional EST Forum in Asia – 2014
Conclusions and Recommendations Asian cities are at a crossroads. According to projections, during the next three decades Asian cities will more than double in population and residents will become about five times wealthier. How cities respond will have huge economic, social and environmental impacts. If current policies continue, rapid urbanization and economic development will result in severe traffic and parking congestion, accident risk, air and noise pollution. This will reduce economic progress and degrade the quality of life for billions of urban residents. These problems can be avoided. A set of strong policy reforms can transform congested, dangerous, polluted, car-dominated cities into efficient, equitable and very livable, human-oriented cities where residents lead productive, healthy and enjoyable lives. This transformation will only occur if everybody, including poor, middle-class and wealthy residents, understands the severity of the risks they face from unrestrained vehicle traffic, and develop a clear vision of the more livable future provided by sustainable transport policy reforms. Motor vehicles are resource intensive: they are costly to own and operate, require more space and energy, and impose more congestion, accident and pollution costs than other travel modes. As a result, the number of vehicles that a city can efficiently absorb is limited. Beyond about 200 vehicles per 1,000 residents, automobile problems become significant and the quality of other modes (walking, cycling and public transit) deteriorates. In large cities it is impossible to build enough roadway capacity to accommodate all potential travel demand, and doing so contradicts other planning objectives. Even affluent countries with huge road-building budgets are unable to avoid urban vehicle traffic problems, developing countries must use smarter, more integrated solutions. As Asian households become wealthier, vehicle travel demand will grow. To individuals, owning and traveling by automobile often makes sense since it enhances their convenience and status, but if every urban household purchases a car and drives for most trips, the system will fail for everybody. Not only do motorists face severe traffic and parking congestion, but the streets become dangerous for pedestrians and cyclists, and bus service becomes inefficient. It is in everybody’s interest to limit urban motor vehicle travel to what roadway systems can efficiently accommodate. The key is to apply avoid-shift-improve principles, which encourage residents to choose the most efficient travel option for each trip: walking and cycling for local errands, public transit for travel on major urban corridors, and automobile travel when they are truly most efficient overall. During the Seventh Regional EST Forum in Asia and Global Consultation on Sustainable Transport held 2013 in Bali, Indonesia, Asian countries committed to the Vision Zero, which aspires to eliminate traffic congestion, accidents and pollution emissions. Although there are many possible ways to achieve these targets individually, some strategies solve one problem but exacerbate others. Solving all these problems together requires win-win strategies which achieve multiple objectives. This involves:
• Improve resource-efficient transport modes, including walking, cycling and public transport.
• Implement transportation demand management strategies which encourage travelers to use the most efficient mode for each trip, considering all impacts.
• Use smart growth development policies to create compact, multi-modal communities.
• Improve vehicle performance, so motor vehicles are safer and less polluting.
47
Toward Next-Generation Transport Systems in Asia Eighth Regional EST Forum in Asia – 2014
There are several ways to justify these policy reforms. They help solve the most severe traffic problems facing Asian cities. They reflect market principles including consumer sovereignty, efficient pricing, and consistency between short-term decisions and strategic, long-term goals. They support sustainable development which balances economic, social and environmental goals. They reflect equity principles by providing basic mobility to physically, economically and socially disadvantaged people, and ensuring that non-drivers receive a fair share of public resources such as road space. We have good examples of cities that have successfully implemented strong transportation demand management (TDM) policies. These have proven effective at reducing congestion, accidents and pollution problems, as well as increasing affordability, public fitness and economic development. To succeed they require an integrated program of improvements to resource-efficient modes (walking, cycling and public transport), incentives and smart growth development policies. Every city is unique, so each city will need to select the most suitable combination of strategies based on its geographic, demographic and economic conditions. Postscript – December 2014 The Eighth Regional Environmentally Sustainable Transport (EST) Forum In Asia held November 19-21 in Colombo, Sri Lanka was an interesting and important conference. It provided an opportunity for participants to share information on sustainable transport policies and build new relationships for cooperation. On the last day, conference delegates approved a unanimous statement, Colombo Declaration For the Promotion of Next Generation Low Carbon Transport Solutions in Asia, which is included in this Backgrounder as Appendix II. This document provides further evidence of a deep commitment to sustainable transport by Asian
48

Toward Next-Generation Transport Systems in Asia Eighth Regional EST Forum in Asia – 2014
References
ADB (2009a), Changing Course: A New Paradigm for Sustainable Urban Transport, Asian Development Bank (www.adb.org); at www.adb.org/Documents/Books/Paradigm-Sustainable-Urban-Transport/new-paradigm-transport.pdf. ADB (2009b), Electric Bikes In The People’s Republic Of China: Impact On The Environment And Prospects For Growth, Asian Development Bank (www.adb.org); at www.understandchinaenergy.org/wp-content/uploads/2014/01/Electric-Bikes-PRC-Impact-on-Environment-Prospects-Growth-2009.pdf. ADB (2010), Reducing Carbon Emissions from Transport Projects, Asian Development Bank (www.adb.org); at www.asiandevbank.org/Documents/Evaluation/Knowledge-Briefs/REG/EKB-REG-2010-16.pdf and www.adb.org/evaluation/reports/ekb-carbon-emissions-transport.asp. Md Aftabuzzaman, Graham Currie and Majid Sarvi (2011), “Exploring The Underlying Dimensions Of Elements Affecting Traffic Congestion Relief Impact Of Transit,” Cities, Vol. 28, Is. 1 (www.sciencedirect.com/science/journal/02642751), February, Pages 36-44. Anvita Arora and Geetam Tiwari (2007), A Handbook for Socio-economic Impact Assessment (SEIA) of Future Urban Transport (FUT) Projects, Transportation Research and Injury Prevention Program (TRIPP), Indian Institute of Technology (http://tripp.iitd.ernet.in); at http://tripp.iitd.ernet.in/publications/paper/SEIA_handbook.pdf. Asian Co-benefits Partnership (http://www.cobenefit.org ) is a coalition that supports mainstreaming co-benefits into sectorial development plans, policies and projects in Asia. Bali Declaration (2013), Bali Declaration on Vision Three Zeros - Zero Congestion, Zero Pollution, and Zero Accidents towards Next Generation Transport Systems in Asia, Seventh Regional EST Forum in Asia. Gaurav Bansal and Anup Bandivadekar (2013), Overview Of India’s Vehicle Emissions Control Program Past Successes And Future Prospects, International Council on Clean Transportation (www.theicct.org); at www.theicct.org/sites/default/files/publications/ICCT_IndiaRetrospective_2013.pdf. Paul Barter (2010), Parking Policy in Asian Cities, Asian Development Bank (www.adb.org); at http://beta.adb.org/publications/parking-policy-asian-cities. Also see www.slideshare.net/PaulBarter/barter-for-adb-transport-forum-2010. Beijing Transport Demand Management (www.tdm-beijing.org) aims to identify and evaluate suitable non-technical measures to reducing vehicle traffic and associated pollution emissions. Daniel Bongardt, Dominik Schmid, Cornie Huizenga and Todd Litman (2011), Sustainable Transport Evaluation: Developing Practical Tools for Evaluation in the Context of the CSD Process, Commission on BP (2014), BP Statistical Review of World Energy, British Petroleum (www.bp.com); at www.bp.com/content/dam/bp/pdf/Energy-economics/statistical-review-2014/BP-statistical-review-of-world-energy-2014-full-report.pdf. Sustainable Development, United Nations Department Of Economic And Social Affairs (www.un.org); at www.un.org/esa/dsd/resources/res_pdfs/csd-19/Background%20Paper%2010%20-%20transport.pdf.
49

Toward Next-Generation Transport Systems in Asia Eighth Regional EST Forum in Asia – 2014
Booz Allen Hamilton (2014), Sustainability as an Organizing Principle for Transportation Agencies, Strategic Issues Facing Transportation Volume 4, NCHRP 750, TRB (www.trb.org); at http://onlinepubs.trb.org/onlinepubs/nchrp/nchrp_rpt_750v4.pdf. Dennis Bratland (2013), Bar Graph of Cars, Motorcycles and Population, Wikipedia (http://en.wikipedia.org); at http://en.wikipedia.org/wiki/File:Bar_of_cars_motorcycles_population.png. Eric Bruun and Vukan Vuchic (1995), “The Time-Area Concept: Development, Meaning and Applications,” Transportation Research Record 1499, TRB (www.trb.org), pp. 95-104 Charlotte Kendra G. Castillo, Deejay Cromwell Sanqui, May Ajero and Cornie Huizenga (2007), The Co-Benefits of Responding to Climate Change: Status in Asia, Work Assignment No. 417, Co-benefits Coordinator in Asia Project, Clean Air Asia (http://cleanairinitiative.org); at http://cleanairinitiative.org/portal/system/files/documents/Co-benefits_of_responding_in_Asia_-_Status_in_Asia_2007.pdf. CCAP (2005), Transportation Emissions Guidebook: Land Use, Transit & Transportation Demand Management, Center of Clean Air Policy (www.ccap.org/guidebook). CCAP (2010), Data & Capacity Needs for Transportation NAMAs, Center for Clean Air Policy (www.ccap.org); at www.ccap.org/index.php?component=programs&id=35. Climate Works (2014), Climate-Smart Development: Adding Up The Benefits Of Actions That Help Build Prosperity, End Poverty And Combat Climate Change, Climate Works Foundation (www.climateworks.org) and World Bank (www.worldbank.org); at http://tinyurl.com/msbxdkk. Michelle DeRobertis, John Eells, Joseph Kott, and Richard W. Lee (2014), “Changing the Paradigm of Traffic Impact Studies: How Typical Traffic Studies Inhibit Sustainable Transportation,” ITE Journal (www.ite.org), May, pp. 30-35; at http://tinyurl.com/oc3l8h5. Pan Di (2013), “Key Transport Statistics of World Cities,” JOURNEYS, September, pp. 105-112; at www.lta.gov.sg/ltaacademy/doc/13Sep105-Pan_KeyTransportStatistics.pdf. Tina Duong (2014), What If There Was No Need For Cars In The World’s Biggest Cities?, The City Fix (http://thecityfix.com); at http://thecityfix.com/blog/car-free-city-human-centered-design-ideo-tina-duong. Nicolae Duduta, Claudia Adriazola, Carsten Wass, Dario Hidalgo, Luis Antonio Lindau (2012), Traffic Safety on Bus Corridors: Guidelines For Integrating Pedestrian And Traffic Safety Into The Planning, Design, And Operation Of BRT, Busways and Bus Lanes, EMBARQ (www.embarq.org); at http://tinyurl.com/lg2cdk6. Liisa Ecola, et al. (2014), The Future of Driving in Developing Countries, RAND Institute for Mobility Research (www.ifmo.de); at www.ifmo.de/tl_files/publications_content/2014/ifmo_2014_BRIC_automobility_en.pdf.
50

Toward Next-Generation Transport Systems in Asia Eighth Regional EST Forum in Asia – 2014
EMBARQ (www.embarq.org) promotes environmentally and financially sustainable transport solutions to improve quality of life in cities. EMBARQ India (2014), Bus Karo 2.0 – Case Studies from India, EMBARQ India (www.embarq.org); at www.embarq.org/research/publication/bus-karo-2-case-studies-india. EPOMM (European Program for Mobility Management) (www.eu-portal.ne) describes various European transportation demand management programs. EST Forum (2013), Bali Declaration on Vision Three ZEROs - Zero Congestion, Zero Pollution, and Zero Accidents: Towards Next Generation Transport Systems in Asia, Seventh Regional EST Forum in Asia, 23-25 April 2013, Bali, Indonesia; at http://tinyurl.com/kycet68. Reid Ewing and Shima Hamidi (2014), Measuring Urban Sprawl and Validating Sprawl Measures, Metropolitan Research Center at the University of Utah for the National Cancer Institute, the Brookings Institution and Smart Growth America (www.smartgrowthamerica.org); at www.arch.utah.edu/cgi-bin/wordpress-metroresearch. FHWA (2012), Integrating Demand Management into the Transportation Planning Process: A Desk Reference, Office of Operations, Federal Highway Administration (http://ops.fhwa.dot.gov); at http://ops.fhwa.dot.gov/publications/fhwahop12035/fhwahop12035.pdf. Lawrence D. Frank, et al. (2010), “Carbonless Footprints: Promoting Health and Climate Stabilization Through Active Transportation,” Preventive Medicine, Vol. 50, Supplement 1, pp. S99-S105; at www.activelivingresearch.org/resourcesearch/journalspecialissues. GCEC (2014), “Cities: Engines of National and Global Growth,” Better Growth, Better Climate, Global Commission on the Economy and Climate (http://newclimateeconomy.net). GIZ (2013), Sustainable Transportation: A Sourcebook for Policy-Makers in Developing Countries, (www.sutp.org), by the Sustainable Urban Transport Project – Asia (www.sutp-asia.org) and Deutsche Gesellschaft fur Internationale Zusammenarbeit (www.giz.de). Michael Grant, et al. (2011), Congestion Management Process: A Guidebook, DTFH61-09-Q-00083, Federal Highway Administration (www.fhwa.dot.gov); at www.fhwa.dot.gov/planning/congestion_management_process/cmp_guidebook/cmpguidebk.pdf Ralph Hall (2006), Understanding and Applying the Concept of Sustainable Development to Transportation Planning and Decision-Making in the U.S., PhD Dissertation, Massachusetts Institute of Technology (http://esd.mit.edu/students/esdphd/dissertations/hall_ralph.pdf). ICLEI (various years), Case Studies, (www.iclei.org/resources/publications/iclei-case-studies.html) ICLEI (2011), “Hangzhou, China: The World’s Largest Bike Sharing Program”, EcoMobility, ICLEI – Local Governments for Sustainability; at www.ecomobility.org/fileadmin/template/project_templates/ecomobility/files/ Publications/Case_stories_EcoMobility_Hangzhau_PDF_print.pdf
51
Toward Next-Generation Transport Systems in Asia Eighth Regional EST Forum in Asia – 2014
IGES (2011), Mainstreaming Transport Co-Benefits Approach: A Guide To Evaluating Transport Projects, Institute for Global Environmental Strategies (www.iges.or.jp); at www.iges.or.jp/en/cp/pdf/co-benefits/Transport%20Co-benefits%20Guidelines.pdf. Institute for Transportation and Development Policy (www.itdp.org) promotes socially equitable and environmentally sustainable transportation policies and projects worldwide. IPCC (2010), IPCC Fourth Assessment Report, Working Group III: Chapter 5, Intergovernmental Panel on Climate Change (www.eoearth.org/profile/IPCC), at www.eoearth.org/view/article/153711. IPCC (2014), Climate Change 2014: Mitigation Of Climate Change, Working Group III: Chapter 8 - Transport, Intergovernmental Panel on Climate Change (http://mitigation2014.org/report), at http://tinyurl.com/m4b8uf8. iRAP (regularly updated) International Transport Statistics Database (www.iraptranstats.net), by the Transport Statistics Programme, funding by the FIA Foundation for the Automobile and Society, provides a wide selection of transport statistics. ITDP (2014a), ITDP Mexico Proposes 29 New BRT Routes That Would Change The Lives Of Millions, Institute for Transportation and Development Policy (www.itdp.org); at www.itdp.org/itdp-mexico-proposes-29-new-brt-routes-that-would-change-the-lives-of-millions. ITDP (2014b), Best Practice in National Support for Urban Transportation, Institute for Transportation and Development Policy (www.itdp.org); at http://tinyurl.com/n4euxdu. ITDP (2014c), Chennai Adopts NMT Policy: A Quantum Leap Towards Safer Streets, Institute for Transportation and Development Policy (www.itdp.org); at http://itdp.in/chennai-adopts-nmt-policy-a-quantum-leap-towards-safer-streets. Robert Joumard and Henrik Gudmundsson (2010), Indicators Of Environmental Sustainability In Transport: An Interdisciplinary Approach To Methods, INRETS (http://hal.archives-ouvertes.fr/hal-00492823/fr); at http://cost356.inrets.fr/pub/reference/reports/Indicators_EST_May_2010.pdf. Santhosh Kodukula (2011), Raising Automobile Dependency: How to Break the Trend?, GIZ Sustainable Urban Transport Project (www.sutp.org); at www.sutp.org/dn.php?file=TD-RAD-EN.pdf. Homi Kharas (2010), The Emerging Middle Class In Developing Countries, Working Paper 285, OECD Development Centre (www.oecd.org); at www.oecd.org/dev/44457738.pdf. KOTI (2011), Toward an Integrated Green Transportation System in Korea, Korea Transport Institute (http://english.koti.re.kr). Ichiro Kutani (2014), Improving Energy Efficiency In The Transport Sector Through Smart Development, Economic Research Institute for ASEAN and East Asia (www.eria.org); at www.eria.org/RPR-FY2013-27.pdf. James Leather (2009), Rethinking Transport and Climate Change, Asian Development Bank (www.adb.org); at http://tinyurl.com/lfokgke.
52
Toward Next-Generation Transport Systems in Asia Eighth Regional EST Forum in Asia – 2014
Joshua Linn (2013), The Rebound Effect for Passenger Vehicles, Discussion Paper 13-19, Resources for the Future (www.rff.org); at www.rff.org/RFF/Documents/RFF-DP-13-19.pdf. Todd Litman (2011), Well Measured: Developing Indicators for Comprehensive and Sustainable Transport Planning, VTPI (www.vtpi.org); at www.vtpi.org/wellmeas.pdf. Todd Litman (2013a), “The New Transportation Planning Paradigm,” ITE Journal (www.ite.org), Vo. 83, No. 6, pp. 20-28; at http://digitaleditions.sheridan.com/publication/?i=161624. Todd Litman (2013b), “Smarter Congestion Relief In Asian Cities: Win-Win Solutions To Urban Transport Problems,” Transport and Communications Bulletin for Asia and the Pacific, No. 82 (www.unescap.org/publications/detail.asp?id=1581 ); at www.unescap.org/ttdw/Publications/TPTS_pubs/bulletin82/b82_Chapter1.pdf. Todd Litman (2013c), Toward More Comprehensive and Multi-modal Transport Evaluation, VTPI (www.vtpi.org); at www.vtpi.org/comp_evaluation.pdf; summarized in JOURNEYS, September 2013, pp. 50-58 (www.ltaacademy.gov.sg/journeys.htm); at www.ltaacademy.gov.sg/doc/13Sep050-Litman_ComprehensiveAndMultimodal.pdf. Todd Litman (2014), Analysis of Public Policies That Unintentionally Encourage and Subsidize Urban Sprawl, Victoria Transport Policy Institute (www.vtpi.org), supporting paper commissioned by LSE Cities (www.lsecities.net) at the London School of Economics and Political Science, on behalf of the Global Commission on the Economy and Climate (www.newclimateeconomy.net) for the New Climate Economy Cities Program. Todd Litman and Steven Fitzroy (2012), Safe Travels: Evaluating Mobility Management Traffic Safety Impacts, VTPI (www.vtpi.org); at www.vtpi.org/safetrav.pdf. Peter Mackie and Tom Worsley (2013) International Comparisons of Transport Appraisal Practice, Institute for Transport Studies (www.its.leeds.ac.uk) for the UK Department for Transport; at www.gov.uk/government/publications/international-comparisons-of-transport-appraisal-practice. Darshini Mahadevia, Rutul Joshi and Abhijit Datey (2013), Low-Carbon Mobility in India and the Challenges of Social Inclusion: Bus Rapid Transit (BRT) Case Studies in India, CEPT University Centre for Urban Equity (http://cept.ac.in/178/center-for-urban-equity-cue-), United Nations Environmental Program; at www.unep.org/transport/lowcarbon/Pdf's/BRT_Casestudies_India_fullreport.pdf. Patricia C. Melo, Daniel J. Graham, and Robert B. Noland (2009), “A Meta-Analysis Of Estimates Of Urban Agglomeration Economies,” Regional Science and Urban Economics, Vol. 39/3, May, pp. 332-342; at www.sciencedirect.com/science/article/pii/S0166046208001269. Gerhard Metschies (2009), International Fuel Prices, German Agency for Technical Cooperation (www.giz.de); at www.gtz.de/en/themen/29957.htm. Gerhard Metschies (2013), International Fuel Prices, German Agency for Technical Cooperation (www.giz.de); at www.giz.de/expertise/html/4282.html.
53
Toward Next-Generation Transport Systems in Asia Eighth Regional EST Forum in Asia – 2014
Adam Millard-Ball (2015), “Phantom Trips: Overestimating the Traffic Impacts of New Development,” Journal of Transport and Land Use (www.jtlu.org); at http://people.ucsc.edu/~adammb/publications/Millard-Ball_2015_Phantom_Trips_preprint.pdf; summary at www.accessmagazine.org/articles/fall-2014/phantom-trips. Wei-Shiuen Ng, Lee Schipper and Yang Chen (2010), “China Motorization Trends: New Directions for Crowded Cities,” The Journal of Transport and Land Use, Vol. 3, No. 3 [Winter 2010] pp. 5–25 (doi: 10.5198/jtlu.v3i3.151); at www.jtlu.org/index.php/jtlu/article/view/151. Noxon Associates (2011), Transportation Demand Management for Canadian Communities: A Guide to Understanding, Planning and Delivering TDM Programs, Noxon Associates (www.noxonassociates.com/guide.html) for Transport Canada (www.tc.gc.ca); at www.tc.gc.ca/media/documents/programs/tdme.pdf. Enrique Peñalosa (2005), “The Role Of Transport In Urban Development Policy,” Sustainable Transport: A Sourcebook for Policy-makers in Developing Cities, published by the Sustainable Urban Transport Project – Asia (www.sutp.org/download/sourcebookhome.php) and Deutsche Gesellschaft fur Technische Zusammenarbeit (www.gtz.de). Zhong-Ren Peng, Jian (Daniel) Sun, and Qing-Chang Lu (2012), “China’s Public Transportation: Problems, Policies, and Prospective of Sustainability,” ITE Journal (www.ite.org), Vol. 82, No. 5, May, pp. 36-41; at www.ite.org/membersonly/itejournal/pdf/2012/JB12EA36.pdf. SADoT (2003), Key Results Of The National Household Travel Survey: The First South African National Household Travel Survey 2003, South Africa Department of Transport (www.transport.gov.za); at www.arrivealive.co.za/document/household.pdf. SANDAG (2012), Integrating Transportation Demand Management Into the Planning and Development Process: A Reference for Cities, iCommute (www.icommutesd.com), San Diego Regional Planning and HNTB; at www.icommutesd.com/documents/TDMStudy_May2012_webversion_000.pdf. Jessica Schoner (2010), Passenger Capacity Example, Wikimedia Commons; at http://commons.wikimedia.org/wiki/File:Passenger_capacity_jschoner.png. SLoCaT (2014), Statement On Sustainable, Low Carbon Transport From Slocat And Bridging The Gap Partnerships, Sustainable Low Carbon Transportation (www.slocat.net); at www.slocat.net/sites/default/files/statement_on_sustainable_low_carbon_transport_june_12_bonn.pdf. Jim P. Stimpson, et al. (2014), “Share of Mass Transit Miles Traveled and Reduced Motor Vehicle Fatalities in Major Cities of the United States,” Journal of Urban Health: Bulletin of the New York Academy of Medicine, (doi:10.1007/s11524-014-9880-9); at http://link.springer.com/article/10.1007%2Fs11524-014-9880-9. Frederik Strompen, Todd Litman and Daniel Bongardt (2012), Reducing Carbon Emissions Through TDM Strategies - A Review of International Examples, Transportation Demand Management in Beijing (http://tdm-beijing.org) GIZ and the Beijing Transportation Research Centre; at http://tdm-beijing.org/files/International_Review.pdf; summary at http://tdm-beijing.org/files/International_Review_Executive_Summary.pdf.
54
Toward Next-Generation Transport Systems in Asia Eighth Regional EST Forum in Asia – 2014
SUTP (2014), Urban Mobility Plans – National Approaches and Local Practice, Sustainable Urban Transportation Project (www.sutp.org); at www.sutp.org/files/TD13_UMP_final.pdf. Hiroaki Suzuki, Robert Cervero and Kanako Iuchi (2013), Transforming Cities with Transit: Transit and Land-Use Integration for Sustainable Urban Development, World Bank (www.worldbank.org); at https://openknowledge.worldbank.org/handle/10986/12233. UN (2014), World Urbanization Prospects, United Nations Department of Economic and Social Affairs (http://esa.un.org); at http://esa.un.org/unpd/wup/index.htm. UNEP (2011), “Transport” and “Cities,” chapters in Towards a Green Economy: Investing In Energy and Resource Efficiency (www.unep.org/greeneconomy/GreenEconomyReport), United Nations Environment Programme (www.unep.org); at www.unep.org/greeneconomy/Portals/88/documents/ger/12.0_Cities.pdf. UNESCAP (2014), Promoting Sustainable and Inclusive Transportation Systems, United Nations Economic and Social Council (www.unescap.org); at www.unescap.org/sites/default/files/pre-ods/CTR-4-5E-Promoting%20sustainable%20and%20inclusive%20transport%20systems.pdf. UITP (2005), Mobility In Cities Database, International Association of Public Transport (www.uitp.org); at www.uitp.org/publications/MCD2-order. UITP (2012), Better Urban Mobility in Developing Countries: Problems, Solutions and Good Practices, International Association of Public Transport (www.uitp.org); at www.uitp.org/publications/brochures/Dev-Countries-uk.pdf. VREF (2012), The FUT Programme, Volvo Research and Education Foundation (www.vref.se); at www.vref.se/download/18.5a77b0b513540402a9cc5a/vref_10years_low.pdf. VTPI (2009), Urban Transportation Performance Spreadsheet, Victoria Transport Policy Institute, (www.vtpi.org/Transit2009.xls). VTPI (2013), Online TDM Encyclopedia, Victoria Transport Policy Institute (www.vtpi.org/tdm). VTPI (2014), Transport Land Requirements Spreadsheet, Victoria Transport Policy Institute (www.vtpi.org); at www.vtpi.org/Transport_Land.xls. Ian Wallis and David Lupton (2013), The Costs Of Congestion Reappraised, Report 489, New Zealand Transport Agency (www.nzta.govt.nz); at www.nzta.govt.nz/resources/research/reports/489/docs/489.pdf. Ben Welle (2014), Safer Cities for the Asian Century, The City Fix (http://thecityfix.com); at http://thecityfix.com/blog/safer-cities-asian-century-road-traffic-fatalities-transport-ben-welle. J. Jason West, et al. (2013), “Co-Benefits Of Mitigating Global Greenhouse Gas Emissions For Future Air Quality And Human Health,” Nature Climate Change, Vol. 3, pp. 885–889 (doi:10.1038/nclimate2009); at www.nature.com/nclimate/journal/v3/n10/full/nclimate2009.html.
55

Toward Next-Generation Transport Systems in Asia Eighth Regional EST Forum in Asia – 2014
WHO (2011), Health Co-Benefits Of Climate Change Mitigation - Transport Sector: Health In The Green Economy, Health Impact Assessment, World Health Organization (www.who.int/hia); at www.who.int/hia/examples/trspt_comms/transport_sector_health_co-benefits_climate_change_mitigation/en/index.html. WHO (2012), Estimated Road Traffic Death Rate (Per 100,000 Population), 2010, World Health Organization (www.who.int); at http://gamapserver.who.int/gho/interactive_charts/road_safety/road_traffic_deaths2/atlas.html. WHO (2013), Global Status Report On Road Safety 2013, World Health Organization (www.who.int); at www.who.int/violence_injury_prevention/road_safety_status/2013/en. Yunshi Wang, Jacob Teter, and Daniel Sperling (2011), “China’s Soaring Vehicle Population: Even Greater Than Forecasted?” Energy Policy, Vol. 39, Is. 6, pp. 3296-3306; at www.sciencedirect.com/science/article/pii/S030142151100200X. Lloyd Wright (2009), Environmentally Sustainable Transport For Asian Cities: A Sourcebook, United Nations Centre for Regional Development (www.uncrd.org.jp); at http://unpan1.un.org/intradoc/groups/public/documents/uncrd/unpan031844.pdf. Lloyd Wright (2009b), Win-Win Solutions and Climate Change and Transport, United Nations Centre for Regional Development (www.uncrd.org.jp); at www.uncrd.or.jp/content/documents/4EST-P1-1.pdf. Lloyd Wright and Lewis Fulton (2005), “Climate Change Mitigation and Transport in Developing Nations,” Transport Reviews (www.tandf.co.uk), Vol. 25, No. 6, November, pp. 691–717; at http://cleanairinitiative.org/portal/sites/default/files/articles-70119_paper.pdf. Working Group (2013), ‘An Overview of Urban Transport Situation in Asia’, in Kutani, I. (ed.), Study On Energy Efficiency Improvement In The Transport Sector Through Transport Improvement And Smart Community Development In The Urban Area, ERIA Research Project Report 2012-29, pp.5-14; at www.eria.org/RPR_FY2012_No.29_Chapter_2.pdf.
56
Toward Next-Generation Transport Systems in Asia Eighth Regional EST Forum in Asia – 2014
Appendix I
Bali Declaration on
Vision Three Zeros - Zero Congestion, Zero Pollution, and Zero Accidents towards Next Generation Transport Systems in Asia
We, the participants, who are representatives of member countries of the Seventh Regional Environmentally Sustainable Transport (EST) Forum in Asia (Afghanistan, Bangladesh, Bhutan, Brunei Darussalam, Cambodia, People's Republic of China, Indonesia, India, Japan, Republic of Korea, Lao PDR, Maldives, Mongolia, Myanmar, Nepal, the Philippines, Pakistan, Russian Federation, Sri Lanka, Thailand, Timor-Leste, and Viet Nam), international organizations, bilateral and multilateral agencies, nongovernmental organizations, research organizations, and expert sustainable transport professionals, having met at the Seventh Regional EST Forum in Asia and Global Consultation on Sustainable Transport in the Post-2015 Development Agenda, held in Bali, Indonesia, from 23 to 25 April 2013, adopt the “Bali Declaration on Vision Three Zeros ‐ Zero Congestion, Zero Pollution, and Zero Accidents towards Next Generation Transport Systems in Asia”, to give further inspiration and encouragement to all who are working on promoting environmentally sustainable transport in Asia. Realizing this will be helped by zero tolerance to fatalities, congestion, and pollution. Recalling the commitments to achieve the sustainable transport goals under the Bangkok 2020 Declaration (2010-2020) agreed upon by the participants at the Fifth Regional EST Forum, held in Bangkok, Thailand, on 23-25 August 2010, Noting the Outcome of the 2012 United Nations Conference on Sustainable Development (Rio+20) – The Future We Want, which provides the international community with a meaningful framework to develop and implement environmentally-protective, safe, economically-efficient, and socially-inclusive transport policies, programmes, and measures, leading to more sustainable passenger and freight transport systems and services, Acknowledging that the frequency and magnitude of natural disasters (floods, earthquakes, tsunamis, cyclones, landslides, volcanic eruptions, storm surges, and extreme weather events) are on the rise globally, including across Asia, and that transport infrastructure and services are vulnerable to climate change impact, Raising concern that a majority of developing countries and cities of the region are yet to make climate resilience, mitigation, and adaptation an integral part of their transport (infrastructure and services) policy, planning and development, and recognizing the need for the developed countries to fulfill existing commitments for financial support, technology transfer, capacity-building, and institutional-strengthening for developing countries so as to facilitate introduction of next generation sustainable transport systems in Asia for zero congestion, zero pollution, and zero accidents; 1. Express our intent to voluntarily develop and introduce more sustainable transport policies programmes, and projects, appropriate to the context of our countries and cities, that will
57
Toward Next-Generation Transport Systems in Asia Eighth Regional EST Forum in Asia – 2014
contribute to our common vision of realizing 21st century cities characterized by zero congestion, pollution, and transport accidents, and at the same time, be resilient to climate change; 2. Call for a Post-2015 Development Agenda that acknowledges the critical contribution of sustainable transport in realizing sustainable development and addressing the climate change challenges; 3. Recommend complementing the Bangkok 2020 Declaration with the voluntary and legally non-binding Bali Declaration; 4. Call for close cooperation among countries to jointly foster the vision of Three Zeros; 5. Call for the developed countries and multinational institutions to fulfil their existing commitments for financial assistance, technological transfer, and sharing the expertise and experiences in advancing environmentally sustainable transport; 6. Call for multilateral financial institutions to adopt more inclusive policies for environmentally sustainable transport; and 7. Call for relevant international fora to deal with sustainable development to give more serious attention to environmentally sustainable transport aspects.
58
Toward Next-Generation Transport Systems in Asia Eighth Regional EST Forum in Asia – 2014
Appendix II
Colombo Declaration For the Promotion of Next Generation Low Carbon Transport Solutions in Asia
(21 November 2014)
We, the participants, who are representatives of member countries of Regional Environmentally Sustainable Transport (EST) Forum in Asia (Afghanistan, Bangladesh, Bhutan, Cambodia, India, Indonesia, Japan, Lao PDR, Malaysia, Maldives, Mongolia, Myanmar, Nepal, Pakistan, Philippines, Russian Federation, Republic of Korea, Singapore, Sri Lanka, Thailand, and Viet Nam), international organizations, bilateral and multilateral agencies, nongovernmental organizations, research organizations, and sustainable transport experts, having met at the Eighth Regional EST Forum in Asia, held in Colombo, Sri Lanka, from 19 to 21 November 2014, unanimously adopt the Colombo Declaration, in order to demonstrate our continued intention in, and reinforce our resolve and commitment to the promotion of low carbon transport in Asia, Reaffirming and building upon the Seoul Statement ~ Towards the Promotion of Environmentally Sustainable Transport (EST) for a Low-Carbon Society and Green Growth in Asia, agreed upon at the Fourth Regional EST Forum in Asia (2009), Reaffirming and building upon the voluntary actions of participating member countries of the Regional EST Forum in Asia to achieve the twenty sustainable transport goals under the integrated Avoid-Shift-Improve strategy of the Bangkok 2020 Declaration (2010-2020) agreed upon at the Fifth Regional EST Forum in Asia (2010), Recalling the Rio+20 outcome - The Future We Want, which recognized that transport and mobility are centre to sustainable development, and which called for the efficient movement of people and goods, and access to environmentally sound, safe and affordable transportation as a means to improve social equity, health, resilience of cities, urban-rural connectivity and productivity of rural areas, Reinforcing the objectives of the Bali Declaration on Vision Three Zeros-Zero Congestion, Zero Pollution, and Zero Accidents towards Next Generation Transport Systems in Asia adopted at the Seventh Regional EST Forum in Asia and Global Consultation on Sustainable Transport in the Post-2015 Development Agenda (2013), Recognizing the mandate of the United Nations Framework Convention on Climate Change as the lead process for developing intergovernmental agreements on climate change, Noting the outcomes of the UN Climate Summit 2014 organized by the United Nations Secretary-General Ban Ki-moon with special emphasis on the Voluntary Commitments made on Transport: (a) The International Association of Public Transport (UITP): Declaration on Climate Leadership; (b) The International Union of Railways (UIC): Low-Carbon Sustainable Rail Transport Challenge; (c) The Urban Electric Mobility Vehicles Initiative (UEMI); (d) Global Fuel Economy Initiative - Public-Private Partnership to double vehicle efficiency, and (e) Reducing Short-Lived Climate Pollutants – A Global Green Freight Action Plan, Noting the substantial potential for mitigation of emissions from all sorts of transport modes documented in the Fifth Assessment Report of the Intergovernmental Panel on Climate Change as well as the substantive economic savings of adopting and implementing low-carbon transport policies by the International Energy Agency,
59
Toward Next-Generation Transport Systems in Asia Eighth Regional EST Forum in Asia – 2014
Noting the role of sustainable transport in realizing the Sustainable Development Goals (SDGs) and in particular the transport related SDGs and associated targets, recommended by the Open Working Group (OWG) for adoption to the United Nations General Assembly, Noting the priority given by UN Secretary-General to sustainable transport including the establishment of a Secretary-General High-level Advisory Group on Sustainable Transport, Acknowledging the rapid growth of greenhouse gas emissions from transport sector in urbanizing Asia, and the importance of promoting sustainable development for movement of people and goods, safe, low carbon transport through policies, programmes and actions that will result in the availability of appropriate transport infrastructure and services for shifting to most efficient, multimodal, integrated modes of passenger and freight transport along with improvement in the environmental performance of fuel and engine technologies, Underscoring the enabling role of environmentally sustainable transport for Asian countries to reduce poverty, improve regional and rural-urban connectivity, and achieve sustainable development,
(1) Applaud the efforts of UN Secretary-General Ban Ki-moon to promote action on Climate Change in the context of Sustainable Development and to make transport one of the specific areas of action in the UN Climate Summit 2014;
(2) Express our support for the transport-related commitments on mobility; transit-oriented development; non-motorized transport (NMT); maritime transport; public transport; fuel economy; and green freight presented at the UN Secretary-General’s Climate Summit 2014, and confirm our intention to voluntarily develop, introduce and implement policies, programmes and projects in support of these transport commitments;
(3) Call upon our development partners in the international development community (both
multilateral and bilateral development partners); foundations and NGOs; and the business sector to align their transport-related assistance with these commitments presented at the UN Secretary-General’s Climate Summit 2014 and national plans and programmes. This includes the provision of support for capacity building and setting countries EST Strategy, as well as financial support for implementing such commitments;
(4) Express our intention to make use of mechanisms under the United Nations Framework Convention on Climate Change, including the Clean Development Mechanism, Clean Technology Center and Network, the Global Environment Facility, the Green Climate Fund and Nationally Appropriate Mitigation Actions (NAMAs), to support the promotion of low carbon transport in Asia. Likewise, this also applies to climate change related mechanisms that are not part of the United Nations Framework Convention on Climate Change, such as the Climate Investment Fund; and
(5) Agree to share best practices of Asian countries and promote learning, cooperation and
technology transfer on low carbon transport and solutions, transport safety, and acknowledge the positive role of the Regional EST Forum in Asia and its partners in facilitating and supporting the dialogue among Asian countries.
60