implications for the development strategy in …siteresources.worldbank.org/dec/resources/84797...1...
TRANSCRIPT

1
The Growth-Inequality-Poverty Triangle:Implications for the Development Strategy in
Developing Countries
François Bourguignon
Chief Economist & Senior Vice President of the World Bank
Egyptian Center for Economic Studies Cairo, December 18, 2004

2
Outline of this Presentation
! Strategies for development and poverty reduction
! The simple arithmetics of poverty, inequality and growth.
! The lessons from economic theory and empirical analysis about the interactions between growth and equity.
! Scope and role of social and redistribution policies.
! Illustrations and implications in the case of Egypt.

3
! Poverty reduction results from the combination of strong economic growth and a non-worsening distribution of income.
! This raises the question of the bi-directional relationship between economic growth and the distribution of productive endowments in the population.
! Role of redistribution. How much possibly distorting redistribution of income and how much possibly growth-enhancing redistribution of assets?
Strategies for Development and Poverty Reduction
Three aspects of poverty reduction strategy

4
Absolute poverty and poverty reduction
Distribution and distributional
changes
Aggregate income level and
growth
"Development strategy"
The Poverty-Growth-Inequality Triangle
(1) (2)
(3)

5
(1) + (2)
Simple Arithmetics of Poverty, Inequality and Growth
Change in Poverty
F ( average income, distribution, growth, change in distribution)
6
0
0.1
0.2
0.3
0.4
0.5
0.6
0.1 1 10 100
Income ($ a day, logarithmic scale)
Den
sity
( s
har
e o
f p
op
ula
tio
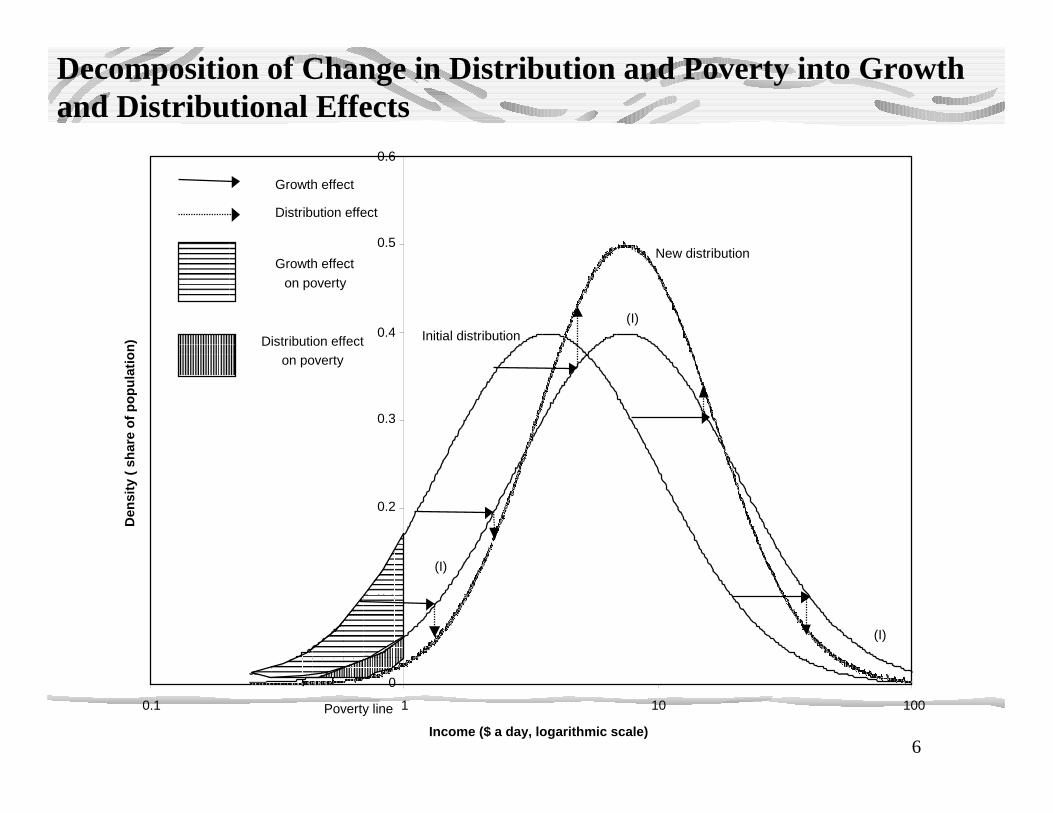
n) Initial distribution
New distribution
Growth effect
Distribution effect
Poverty line
Growth effect
on poverty
Distribution effecton poverty
(I)
(I)
(I)
Decomposition of Change in Distribution and Poverty into Growth and Distributional Effects

7
“Absolute” Poverty in a Middle-Income Country with Middle Inequality and 3% Growth in Real Expenditure per Capita
+ 10 years
Prospective Absolute Poverty Reduction in Egypt with 3% Annual Growth in Real Expenditure per Capita
0
0.02
0.04
0.06
0.08
0.1
0.12
0.14
0.16
0.18
Today No change in
inequality
Inequality brought
from Gini = .38 to .41
Inequality remained at
initial level (Gini=.38)
Pro
port
ion
of p
oor
peop
le + 10 years + 4.7 years

8
« + » indicates increase in poverty; « - » indicates decline.
Numbers indicate the count of growth spells in each cell.Cells shaded in « blue » indicate declining poverty.
Growth, Distribution and Changing Poverty Levels
Positive Income Growth
Negative Income Growth
Total
Increasing Gini
+13- 21
+18- 1
+31- 22
Decreasing Gini
+2- 31
+18- 10
+20- 41
Total+15
- 52+36
- 11+51
- 63

9
Note: See Bourguignon (2004). ε = the elasticity of poverty with respect to income. T-statistics are included in
parentheses in the regression equation.
Growth Elasticity of Poverty

10
! The process of economic growth modifies income distribution depending on the forces behind growth.
! But these effects may be attenuated or compounded by growth and distribution policies.
! Because of this, it would be illusory to rely on preceding poverty-growth elasticities.
Growth is rarely distribution neutral

11
Case of Egypt: Growth Incidence (1995/96-1999/2000)
Source: HIECS 1995/96, 1999/2000
total Egypt urban Egypt rural Egypt
-50
510
15a
nnua
l gro
wth
rate
(%
)
0 20 40 60 80 100% of popu la tion ranked by per cap ita expenditure
average 5.51%
average 3.24%
average –0.10%

12
Case of Egypt: Growth and Distributional Effects Decomposition
Source: HIECS 1995/96, 1999/2000
Distribution of expenditure per capita in total Egypt (lognormal assumption)
Initial distribution New distribution
Horizontal translation of the initial density curve
positive growth
worsening distribution
growth effects distributional effects
poverty line
13
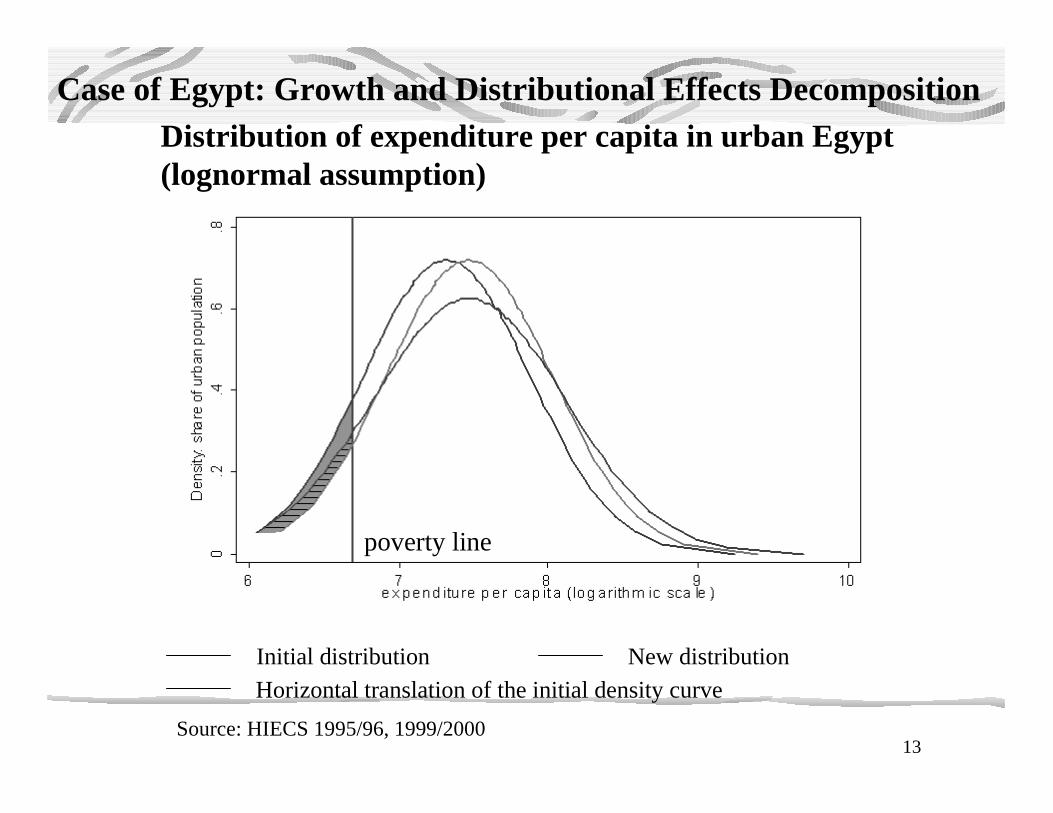
Case of Egypt: Growth and Distributional Effects Decomposition
Source: HIECS 1995/96, 1999/2000
Distribution of expenditure per capita in urban Egypt (lognormal assumption)
Initial distribution New distributionHorizontal translation of the initial density curve
positive growth
worsening distribution
growth effects distributional effects
poverty line

14
Case of Egypt: Growth and Distributional Effects Decomposition
Source: HIECS 1995/96, 1999/2000
Distribution of expenditure per capita in rural Egypt (lognormal assumption)
slightly negative growth
Initial distribution New distributionHorizontal translation of the initial density curve
worsening distribution
growth effects distributional effects
poverty line

15
Growth, Inequality Change and Poverty ReductionRegional Comparison (1995/96-1999/2000)
Poverty reduction mainly occurs in the regions where there is positive economic growth; in general, the effect of growth on poverty reduction is greater when the region has a pro-poor
distribution change.Negative Gini change = reduction in inequality; negative change in poverty incidence = reduction in poverty.
Source: El-Laithy, Lokshin and Banerji (2003), “Poverty and Economic Growth in Egypt, 1995-2000”, Policy Research
Working Paper #3068, The World Bank.
Gini changeAnnual per capita
expenditure growth rateChange in
poverty incidence
Metropolitan 0.022 7.96 -8.04Lower Egypt Urban -0.028 1.04 -2.17Lower Egypt Rural -0.032 2.87 -9.7Upper Egypt Urban 0.023 -1.32 8.45Upper Egypt Rural 0.005 -0.33 4.83
Border Urban 0.054 9.73 -1.93Border Rural -0.082 -4.09 4.48
All Egypt 0.033 3.24 -2.68

16
Growth ⇒ Distribution
! Growth is not necessarily distribution neutral. Several arguments about endogenous development mechanisms support the Kuznets curve hypothesis … but other arguments contradict it.
! Fully general model suggests many exogenous factors may simultaneously affect growth and distribution : technology, international prices, trade protection, …
! Endogeneity of redistribution policies and social institutions determining them – e.g. democracy.
! Conclusion : no ‘law’ and therefore room for policy
Mechanisms linking growth and distribution (I)

17
Distribution ⇒ GrowthSeveral arguments suggest that a progressive redistribution of wealth may be efficiency- and growth-enhancing.
! Credit market imperfection (exploits the fact that return on assets larger among credit-constrained small asset holders)
! Political economy argument (too much asset inequality leads to more redistribution, politically or possibly through violent means)
! Economies of scale (too much inequality and imperfect foreign markets prevent producing at the efficient scale); …
But other reasons suggest the opposite relationship … (Kaldor’s saving propensity argument)
Mechanisms linking growth and distribution (II)

18
! Empirical literature dominated by cross-country studies :• Growth as a function of initial income inequality in the growth regression literature of the 90’s
• Income inequality as a function of development level : Kuznets curve in the 1970’s, «Growth is good for the poor» (Dollar-Kraay) in the 00’s
• Both streams of literature equally inconclusive - not unsurprisingly so.
! Case studies on the distributional effects of growth (‘pro-poor growth’) showing very much country specificity
! Micro-economic evidence
Empirical evidence (I)Growth ⇒ Distribution

19
! Empirical verification through 'growth regressions' with distribution variables on the RHS yields ambiguous (or even contradictory) results.
! This is not unexpected: (a) theory suggests some redistribution of assets may generate more efficiency and growth; (b) Did such a redistribution ever occur exogenously?
! Hypothesis testing is better approached through microeconomic evidence. Best empirical verification is to check whether micro-economic mechanisms behind preceding hypotheses are verified or not, and then proceed with 'calibrating' the likely effect of various types of redistribution.
Empirical evidence (II)
Distribution ⇒ Growth

20
! Redistribution as Compensation : redistribution of incomemay be necessary to compensate for the regressive distributional effect of growth.
! Redistribution to Accumulate Assets in the Hands of the Poor : redistribution of assets may be beneficial to growth directly and indirectly .
! But paradox: (non-lump-sum) redistribution of current income may be harmful to growth (through disincentives to accumulate) " redistribution aimed at accumulating assetsamong the poor relies on taxation of current income " There is an optimal scale of “income for asset” redistribution(strong argument in favor of 'smart transfers’ conditional on asset buildup)
Role of (and Scope for) Redistribution in Development

21
!Robust growth in late 1990s – averaging over 5% per annum over 1995-1999 – poverty rate dropped from 19.4% to 16.7%. However, between 1999 and 2004, the growth rate slowed down to around 3.5%.
!Measured unemployment remained high (at 9.9% on average in 2003/04 and very likely higher among the poor)
! Inequality level comparable to other middle-income countries but Gini rose from 34.5 to 37.8 over 1995-1999.
! Considerable progress in asset accumulation among the poor but still considerable scope for further progress.
Experience of Egypt
An Illustration: Case of Egypt

22
!Growth supported through domestic fiscal and monetary expansion policies (plus positive external shocks) – sustainable?
! Inequality increased at national level; regional disparities moved beyond the traditional rural-urban divide.
!Growing unemployment pressure (particularly among the youths).
# Limited ability to provide jobs # Rapid labor force growth. Inequalizing role of
unemployment due to difficult integration of young people in the labor market.
Challenges of Egypt
An Illustration: Case of Egypt

23
Three sets of factors critical for the poor*:
! Income earning-opportunities
Increasing current earnings through growth and employments
! Education
The strongest correlate to poverty in Egypt
Increasing future earnings through education
! Social safety-nets
Protecting the vulnerable through social assistance
An Illustration: Case of Egypt
*Source: The World Bank (2004), Arab Republic of Egypt, A Poverty Reduction Strategy for Egypt.

24
! Conduct macroeconomic and structural policies so as to increase private sector investment.
! Raise poverty-oriented investments for Upper Egypt.
! Ensure availability of critical inputs for micro and small business.
! Reduce regulatory obstacles to starting, operating and dissolving small businesses.
! Support agricultural development.
Increasing current earnings through growth & employmentKey Pillars for a Poverty Reduction Strategy (I)
An Illustration: Case of Egypt

25
Increasing future earnings through education! Combat adult illiteracy by using civil society groups more actively and adding a parental education focus to literacy programs.
! Enhance access and reduce costs of education for the poor by offering conditional stipends for attendance, etc.
! Improve quality of basic and secondary education for the poor, through improving teacher skills, instituting evaluation processes and improving technical skills of both teachers and students.
Key Pillars for a Poverty Reduction Strategy (II)
An Illustration: Case of Egypt

26
Protecting the vulnerable through social assistance
! Improve geographical coverage to align safety net resource allocation with poverty status of districts and governorates.
! Increase budget outlays for cash transfer programs and improve poverty targeting.
! Improve poverty-orientation of the Social Fund for Development so as to better harness the considerable resources and outreach of this agency for the purposes of poverty reduction.
Key Pillars for a Poverty Reduction Strategy (III)
An Illustration: Case of Egypt

27
Poverty monitoring and program evaluation
! Improve data quality and frequency in a cost effective manner.
! Make data easily available to facilitate robust analysis.
! Institutionalize program evaluation systems so as to allow for better comparison of alternative uses of public funds.
Key Pillars for a Poverty Reduction Strategy (IV)
An Illustration: Case of Egypt