implications of raising cigarette excise taxes in peru
TRANSCRIPT

250 Rev Panam Salud Publica 40(4), 2016
Implications of raising cigarette excise taxes in Peru
Martin Gonzalez-Rozada1 and Alejandro Ramos-Carbajales2
Pan American Journal of Public HealthOriginal research
Suggested citation Gonzalez-Rozada M, Ramos-Carbajales A. Implications of raising cigarette excise taxes in Peru. Rev Panam Salud Publica. 2016;40(4):250–5.
Raising taxes on tobacco is by far the more cost-effective policy for reducing ciga-rette consumption (1, 2). There are at least two reasons for this: first, raising cigarette taxes increases government revenue de-spite decreasing demand. This is because smoking is addictive, and so tax revenue from consumption proportionately sur-mounts the decrease. Second, by increasing the cost of cigarettes, and thereby reducing consumption, the detrimental health effects of smoking on smokers and non-smokers alike are reduced. These impacts support a policy of controlling tobacco consumption
through higher taxes, which creates the win-win of reduced consumption and in-creased revenue.
However, raising cigarette taxes can also have bad consequences: it can be re-gressive, meaning that the poor will pay a higher percentage of their income to cover the tax than the rich will. Regressivity is an important topic because the tobacco industry frequently uses this argument to oppose government policy that might raise taxes to reduce consumption.
In most nations, the poor smoke more than the rich do (3). As a result, the poor often spend a substantially larger pro-portion of their income on cigarettes, bearing a disproportionate share of the cigarette tax burden. Therefore, increas-ing the tax disproportionately increases
this burden (4–6). A tax increase may not be regressive if the poor are much more sensitive to the price change than the rich are and they respond by quitting smok-ing or reducing consumption. In this sce-nario, the change in tax expenditure for the poor would be less than for the rich. Therefore, if the poor have a much larger demand price elasticity,3 in absolute value, then an increase in cigarette taxes would not be regressive.
How much a tax increase reduces con-sumption and whether or not it is regres-sive are important empirical questions. One can design effective public policy
3 “Price elasticity” measures the sensitivity of consumption to price changes. If cigarette prices increase, the price elasticity indicates how much consumption will decrease.
ABSTRACT Objective. To assess how raising cigarette excise taxes in Peru might impact cigarette con-sumption, and to determine if higher taxes would be regressive.Methods. Total demand price elasticity was estimated by income groups using two datasets: quarterly time-series data from 1993 – 2012 and data from a cross-sectional survey of income and expenses conducted in 2008 – 2009 . A functional form of the cigarette demand in Peru was specified using the quarterly data set, and the demand price elasticity was estimated for the short and long run. Using the second data set and Deaton methodology, the implementation of elasticity estimation and by groups’ elasticity was done in a two-step procedure.Results. Demand price elasticity was −0.7, implying that a 10% price increase via a new tax would reduce consumption by 7%. Demand price elasticity estimations by income group sug-gested that poorer families are not more price sensitive than richer ones, which implies that increasing cigarette taxes could be regressive.Conclusions. Increasing cigarette taxes is the most efficient policy for inducing a reduction in smoking. However, in the case of Peru, an increase in cigarette taxes could be regressive.
Keywords Taxation of tobacco-derived products; consumption of tobacco-derived products; smoking cessation; health economics; Peru.
1 Universidad Torcuato Di Tella, Buenos Aires, Argentina. Send correspondence to Martin Gonzalez-Rozada, email: [email protected]
2 Interamerican Heart Foundation, Montevideo, Uruguay.
THEMATIC ISSUE ON ECONOMICS OF TOBACCO CONTROL IN THE AMERICAS

Rev Panam Salud Publica 40(4), 2016 251
Gonzalez-Rozada et al. • Implications of cigarette taxes in Peru Original research
to reduce tobacco consumption by tak-ing into account the answers to these questions.
The objectives of this study were to em-pirically assess how raising cigarette taxes would impact consumption in Peru and to determine whether or not an in-crease would be regressive.
MATERIALS AND METHODS
Datasets
Two distinct datasets were used for esti-mating cigarette demand in Peru. The first was a time-series database composed of quarterly data from 1993–2012. It provided information on apparent consumption, av-erage real price of cigarettes, and the aver-age monthly income per rolling quarter reported by the National Institute of Statis-tics and Informatics (INEI) of Peru (7). The second dataset came from the ENAPREF 2008–2009 (8), a household survey of in-come and expenditure that includes ciga-rette expenses and quantities purchase by individuals in a household.
Time-series data
The consumption of cigarettes variable was constructed from the macroeconomic identity that takes cigarette production and adds to it the cigarette imports and subtracts the cigarette exports (called ap-parent consumption) using the data records of the Superintendencia Nacional de Aduanas y de Administración Tributaria (Na-tional Customs and Taxation Authority). Since 2005, the demand for cigarettes in Peru has been satisfied mainly by imports from Chile, where British American To-bacco Chile Operaciones S.A. (Santiago, Chile) has its production plant.
The source of the cigarette price series was the consumer price index (CPI), with the real price of cigarettes computed by dividing the CPI of cigarettes by the gen-eral CPI as per the INEI (7). These monthly statistics were then converted to quarterly figures to compute the average real price per quarter.
For the series of income, the average monthly income per mobile quarter re-ported by INEI in its Permanent Employ-ment Survey (9) was used. This nominal income was transformed in real terms using the general CPI.
Given the tobacco market in Peru, where cigarette demand is supplied by imports, it was necessary to include the exchange rate
as a control variable in the demand function for cigarettes. The quarterly series used in this work corresponds to the average inter-bank exchange rate (sell) of the Central Re-serve Bank of Peru, from the first quarter of 1993 to the last quarter of 2012.
The average quarterly consumption was about 35 packs of 20 cigarettes, ranging from a low of 14 packs to a high of 63. The real price in Peruvian Nuevos Soles (PEN) varied from PEN 1.00 – 1.75, with the real median price of PEN 1.45 over the whole sample. Note that this price was computed as a ratio of two price indices (cigarette price index divided by consumer price index) that do not have an interpretation regarding the Peruvian currency. The monthly av-erage real income in the sample was around PEN 1 600 (US$ 540), ranging from nearly PEN 1 200–2 000 (US$ 405 – 676). The average exchange rate in the sample was PEN 2.96 : US$ 1.00, and ranged from PEN 1.76–3.50.
Cross-sectional database
The ENAPFRE has a module that col-lects data on individual spending on cig-arettes. It quantifies cigarette spending per person in a household, but does not identify the smokers. So, for example, it is possible that the person who purchases the cigarettes is not the smoker. In this regard, the survey can be used to charac-terize the percentage of households with at least one smoker. Of the 35 000 house-holds in the survey, a little less than 8% had at least one smoker.
The unit value was computed as the ratio between expenditure on cigarettes and physical quantities bought. The esti-mation of the demand for cigarettes was performed in two ways, using the quan-tity of cigarettes purchased by each and the unit value of every purchase. This same information was aggregated for the household level. The methodology ad-vanced by Deaton (10) was employed.
To measure the sensitivity of the ciga-rette demand to a price change, individ-uals who reported any spending on cigarettes and who received income dur-ing the reference period of the survey were selected. A total of 3 642 people re-ported having purchased cigarettes dur-ing the reference week, but of those only 3 153 also reported some income. There-fore, estimations were performed using this latter group, of which 95% was male and the level of education was 14%
primary school, 66% secondary school, and 20% a college degree.
Specifying cigarette demand using time series data
Specifying a conventional demand func-tion for cigarettes requires stationarity of the individual variables involved. If not, then the specification of the demand func-tion depends on whether the variables contain a common trend or not. For a com-plete description of the functional form of the demand for cigarettes, tests, and esti-mation procedures with time series data, see Gonzalez-Rozada (11).
The order of integration for each vari-able was identified using the Augmented Dickey-Fuller test (ADF) (12). The ADF statistic suggests that the apparent con-sumption of cigarettes, the average real price, the average real income, and the ex-change rate are individually non-station-ary variables. The Johansen test procedure (13–16) was used to check for cointegra-tion between these series. The result of Johansen’s sequential procedure suggests that there is a cointegration relationship between the mentioned variables during the period under analysis. The specifica-tion of the demand for cigarettes, in the long run, was established by a model for the steady-state path growth of the variables.
Demand price elasticity (l1) states that a 1% increase in the real price of ciga-rettes reduces consumption by l1%, while the income elasticity (l2) indicates that a 1% increase in a consumer’s real income increases the amount consumed by l2% in the long run. In the short-run, the vari-ables may not be in the path of long-run equilibrium; therefore, a general model was specified that allowed the estima-tion of the short-run elasticities of ciga-rette consumption.
The demand price elasticity for the short-term (b0) states that a 1% increase in price causes a drop of b0% in the num-ber of cigarettes consumed in a quarter, while the short-term income elasticity (g0) indicates that an increase of 1% in real income of consumers produces an increase of g0 % in the number of ciga-rettes consumed in a quarter.
Specifying cigarettes demand using cross-sectional data
Household surveys, such as ENAPREF, do not report the price of cigarettes. The
Rev Panam Salud Publica 40(4), 2016 252
Original research Gonzalez-Rozada et al. • Implications of cigarette taxes in Peru
ENAPREF asks households to report not only their spending on each good, but also the physical quantity purchased. The ratio of these two figures is a mea-sure of price, or more accurately, a unit value. One reason the unit values are not the same as the prices is that unit values are affected by the level of quality of the product purchased. For example, in the case of a pack of cigarettes, a premium brand costs more than a pack of black market ones since, in general, smuggled cigarettes are of lower quality. The unit values include this quality feature. Unit values were computed by dividing the expenditure by the physical quantities so that premium cigarettes have higher unit values. As a result, and in contrast to a market price on which the consumer has no control, in this case the consumer “chooses” a unit value, at least to some extent. In particular, since richer house-holds tend to buy higher quality prod-ucts, unit values are positively related to income.
The basic ideas underlying the model that allows this estimation can be found in the work of Deaton (10). A more detailed explanation of the pro-cedures necessary for price estimation and income elasticity are explored elsewhere by Ramos-Carbajales and colleagues (17).
RESULTS
A demand price elasticity of −0.7 was found in Peru, implying that increasing prices by 10%, via taxes, reduces con-sumption by 7%. Demand price elasticity estimations by income groups suggested
that poorer families are not more price sensitive than richer ones, implying that increasing cigarette taxes in Peru could be regressive.
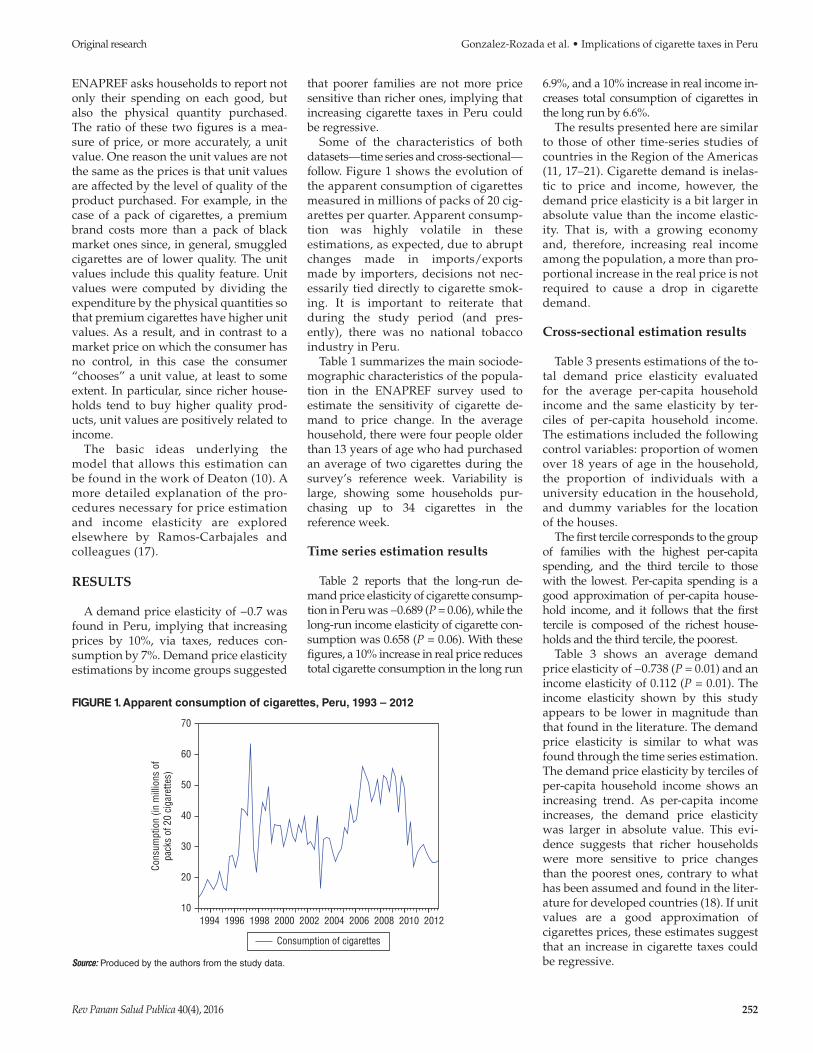
Some of the characteristics of both datasets—time series and cross- sectional—follow. Figure 1 shows the evolution of the apparent consumption of cigarettes measured in millions of packs of 20 cig-arettes per quarter. Apparent consump-tion was highly volatile in these estimations, as expected, due to abrupt changes made in imports/exports made by importers, decisions not nec-essarily tied directly to cigarette smok-ing. It is important to reiterate that during the study period (and pres-ently), there was no national tobacco industry in Peru.
Table 1 summarizes the main sociode-mographic characteristics of the popula-tion in the ENAPREF survey used to estimate the sensitivity of cigarette de-mand to price change. In the average household, there were four people older than 13 years of age who had purchased an average of two cigarettes during the survey’s reference week. Variability is large, showing some households pur-chasing up to 34 cigarettes in the reference week.
Time series estimation results
Table 2 reports that the long-run de-mand price elasticity of cigarette consump-tion in Peru was −0.689 (P = 0.06), while the long-run income elasticity of cigarette con-sumption was 0.658 (P = 0.06). With these figures, a 10% increase in real price reduces total cigarette consumption in the long run
6.9%, and a 10% increase in real income in-creases total consumption of cigarettes in the long run by 6.6%.
The results presented here are similar to those of other time-series studies of countries in the Region of the Americas (11, 17–21). Cigarette demand is inelas-tic to price and income, however, the demand price elasticity is a bit larger in absolute value than the income elastic-ity. That is, with a growing economy and, therefore, increasing real income among the population, a more than pro-portional increase in the real price is not required to cause a drop in cigarette demand.
Cross-sectional estimation results
Table 3 presents estimations of the to-tal demand price elasticity evaluated for the average per-capita household income and the same elasticity by ter-ciles of per-capita household income. The estimations included the following control variables: proportion of women over 18 years of age in the household, the proportion of individuals with a university education in the household, and dummy variables for the location of the houses.
The first tercile corresponds to the group of families with the highest per-capita spending, and the third tercile to those with the lowest. Per-capita spending is a good approximation of per-capita house-hold income, and it follows that the first tercile is composed of the richest house-holds and the third tercile, the poorest.
Table 3 shows an average demand price elasticity of −0.738 (P = 0.01) and an income elasticity of 0.112 (P = 0.01). The income elasticity shown by this study appears to be lower in magnitude than that found in the literature. The demand price elasticity is similar to what was found through the time series estimation. The demand price elasticity by terciles of per-capita household income shows an increasing trend. As per- capita income increases, the demand price elasticity was larger in absolute value. This evi-dence suggests that richer households were more sensitive to price changes than the poorest ones, contrary to what has been assumed and found in the liter-ature for developed countries (18). If unit values are a good approximation of cigarettes prices, these estimates suggest that an increase in cigarette taxes could be regressive.
FIGURE 1. Apparent consumption of cigarettes, Peru, 1993 – 2012
Source: Produced by the authors from the study data.
10
20
30
40
50
60
70
1994 1996 1998 2000 2002 2004 2006 2008 2010 2012
Consumption of cigarettes
Cons
umpt
ion
(in m
illio
ns o
fpa
cks
of 2
0 ci
gare
ttes)

Rev Panam Salud Publica 40(4), 2016 253
Gonzalez-Rozada et al. • Implications of cigarette taxes in Peru Original research
To see if the unit values are a good ap-proximation for prices, demand price elasticity was estimated according to Deaton’s methodology (10). Estimations were performed using households and individuals as the unit of analysis. Both estimations included control variables. Among the variables associated with the household were the number of people in the household and the proportion of males and females older than 18 years of
age. Included among the variables related to the individual were the age of the head of household and age squared, and a set of categorical variables indicating gender and whether university or secondary school education had been attained.
Table 4 shows the estimates of the de-mand price elasticity, the total expendi-ture elasticity with respect to the number of cigarettes consumed, and the total expenditure elasticity with respect to
the unit value. The demand price elas-ticity for the total sample ranged from −0.675 to −0.800 (P = 0.01). These values were similar to both the demand price elasticity estimated assuming that unit values reflect prices, and the one that was estimated using time series data. This evidence generates a certain ro-bustness for the study results. If the breakdown by terciles of per-capita household expenditure is considered, the picture is similar to the one pre-sented above. This evidence seems to suggest that poorer households (or lower per-capita expenditure) do not have a larger elasticity in absolute value than households in the first tercile. Thus, tax increases on the consumption of cig-arettes in Peru are very likely to be re-gressive in the sense that the increased tax burden would fall on the shoulders of poor more so than on the rich.
The elasticity of total expenditure is between 0.19 – 0.22 (P = 0.01), suggesting that a 10% increase in total spending in-creases cigarette consumption by ap-proximately 2%. The estimate of the quality elasticity with respect to the total expenditure is about 0.09 (P = 0.01). Both panels of Table 4 show that the quality elasticity is statistically significant for those with the lowest total household expenditure per capita. This result is expected since when total expenditure decreases, the expectation is that the poor are more inclined to reduce quality.
DISCUSSION
This study sought to answer two empirical questions: How much does raising the price of cigarettes through taxes reduce consumption and would an increase in cigarette taxes be regressive?
Increasing cigarette taxes is important public policy for reducing tobacco use. The appeal of increasing cigarette taxes is obvious. Since smoking is bad for one’s health and for the health of others, in-creasing taxes can induce people to quit or cut back.
Using two information sets, we esti-mated the total demand price elasticity to be −0.7, implying that a 10% increase in the price of cigarettes would reduce con-sumption by 7%. Since 14 January 2010, Peru has had a specific Selective Con-sumption Tax of PEN 0.07 per unit of imported cigarette (Supreme Decree 004-2010-EF), that is, PEN 1.40 per pack of 20. Hence, to increase the retail price of
TABLE 1. Sociodemographic characteristics of study sample from the National Survey of Family Budgets (Encuesta Nacional de Presupuestos Familiares) Peru, 2008 – 2009
AgeNumber of persons
> 14 years of age in the household
Average quantity of single cigarettes purchased
Average 36.2 3.9 2.03Median 33.0 4.0 1.14Standard deviation 13.7 1.7 2.87Minimum 14.0 2.0 0.15Maximum 88.0 14.0 34.20
Source: Produced by the authors from the survey data.
TABLE 2. Long run price and income elasticity of cigarette demand using quarterly data, Peru, 1993 – 2012
VariableDependent variable: Lna (consumption of cigarettes)
T-statistic P-valueCoefficient Standard error
Ln (real cigarette prices) −0.689 0.321 −2.144 0.035Ln (real income) 0.658 0.345 1.907 0.060Ln (exchange rate) 1.459 0.207 7.056 0.000Intercept −2.722 2.513 −1.083 0.282Seasonal controls Yes Yes Yes YesAdjusted R-squared 0.5104F-statistic 42.0724P-value 0.000
Source: Produced by the authors from the study data.Note: Least squares estimations. The table shows heteroskedasticity robust standard errors.a Natural logarithm.
TABLE 3. Average price and income elasticity estimations from the Encuesta Nacional de Presupuestos Familiares (National Survey of Family Budgets) Peru, 2008 – 2009
Demand price elasticity, tercile 1 (richer) −0.831a
(0.00048)Demand price elasticity, tercile 2 −0.762a
(0.00038)Demand price elasticity, tercile 3 (poorer) −0.619a
(0.00125)Total demand price elasticity −0.738a
(0.0010)Income elasticity 0.112a
(0.00152)
Source: Produced by the authors from the study data.Note: Figures in parentheses are standard errors computed using the Delta method.a P = 1%.

Rev Panam Salud Publica 40(4), 2016 254
Original research Gonzalez-Rozada et al. • Implications of cigarette taxes in Peru
cigarettes, this selective tax should be raised, and the total demand price elastic-ity estimate provides an answer to how much cigarette consumption would be reduced. For the regressivity question, we used the cross-sectional database and esti-mated the demand price elasticity by in-come and expenditure groups. We found that, in absolute value, the demand price elasticity of cigarettes is larger for richer
households than for poorer ones. This finding suggests that poorer families are not more price sensitive than richer ones, which implies that increasing cigarette taxes could be regressive.
Limitations
This study had some limitations. The time-series analyses considered apparent
consumption, which is highly volatile due to sudden changes made by import-ers that might be completely unrelated to cigarette smoking. The cross-sectional ENAPREF survey did not permit analy-sis of certain groups by gender or geo-graphic area, which could be relevant. In spite of these limitations and potential biases, the similarities among the time series and cross sectional results suggest that the estimations were robust.
Conclusions
Evidence found by this study suggests that implementing an effective policy of increasing taxes to reduce consumption should be complemented by public health policies targeted at the poor. Such policies would aim to reduce the adverse effects of spending a larger percentage of their in-come on the cigarette excise tax.
Acknowledgements. The authors grate-fully acknowledge the International Devel-opment Research Centre (Ottawa, Canada) and its funding for this project.
Conflict of interests. None declared.
Disclaimer. Authors hold sole respon-sibility for the views expressed in the manuscript, which may not necessarily reflect the opinion or policy of the RPSP/PAJPH and/or PAHO.
TABLE 4. Cigarette demand price elasticity and household total expenditure from the sample taken from the Encuesta Nacional de Presupuestos Familiares (National Survey of Family Budgets) Peru, 2008 – 2009
Total
Terciles of per capita expenditure
First Second Third
Estimations by individuals Demand price elasticity −0.800a −0.870a −0.760a −0.900a
(0.198) (0.160) (0.130) (0.120) Total expenditure elasticity 0.190a 0.240a 0.237a 0.215a
(0.030) (0.070) (0.080) (0.060) Expenditure elasticity of
quality0.090a 0.090b 0.006 0.035b
(0.018) (0.050) (0.050) (0.019)Estimations by households Demand price elasticity −0.675a −0.810a −0.570a −0.750a
(0.212) (0.142) (0.068) (0.142) Total expenditure elasticity 0.218a 0.250c 0.170 0.230a
(0.030) (0.100) (0.230) (0.070) Expenditure elasticity of
quality0.088a 0.013 0.130 0.050c
(0.018) (0.060) (0.110) (0.020)
Source: Produced by the authors from the study data.Note: Figures in parenthesis are standard errors computed by the bootstrapping procedure for the demand price elasticity and by the Delta method for the rest of the estimates.Statistical significance: a 1%, b 10% and C 5%.
REFERENCES
1. Chaloupka FJ, Straif K, Leon ME. Effectiveness of tax and price policies in tobacco control. Tob Control. 2010;20(3): 235–8.
2. Currie L, Townsend J, Leon Roux M, Godfrey F, Gallus S, Gilmore AB, et al. Policy recommendations for tobacco tax-ation in the European Union. Integrated Research Findings from the PPACTE proj-ect. Dublin: Pricing Policies and Control of Tobacco in Europe Consortium; 2012.
3. Jha P, Chaloupka FJ. Tobacco control in de-veloping countries. Oxford: Oxford Uni-versity Press; 2000.
4. Chaloupka FJ, Warner KE. The economics of smoking. In: Culyer A, Newhouse J, eds. Handbook of health economics. Amsterdam: North Holland; 2000.
5. Warner KE. The economics of tobacco: myths and realities. Tob Control. 2000;9(1): 78–89.
6. Remler DK. Poor smokers, poor quitters and cigarette tax regressivity. Am J Public Health. 2004;94(2):225–9.
7. Instituto Nacional de Estadística e In-formática del Peru. Available from: www.inei.gob.pe/ Accessed on 1 June 2016.
8. Instituto Nacional de Estadística e In-formática del Peru. Encuesta Nacional de Presupuestos Familiares, 2008–2009. Lima: INEI; 2009.
9. Instituto Nacional de Estadística e In-formática del Peru. Encuesta Permanente de Empleo. Lima: INEI. Available from: http://webinei.inei.gob.pe/anda_inei/index.php/catalog/19 Accessed on 1 June 2016.
10. Deaton A. The analysis of household sur-veys. A microeconometric approach to development policy. Baltimore: John Hopkins University Press; 1997.
11. Gonzalez-Rozada M. Economía del con-trol del tabaco en los países del Mercosur y estados asociados. Argentina, 1996–2004. Washington, DC: PAHO; 2006.
12. Dickey DA, Fuller WA. Distribution of the estimators for autoregressive time series with a unit root. J Am Stat Assoc. 1979; 74(366):427–31.
13. Johansen S. Estimation and hypothesis testing of cointegration vectors in Gaus-sian Vector Autoregressive Models. Econ-ometrica. 1991;59(6):1551–80.
14. Engle RF, Granger CWJ. Co-integration and error correction: representation, esti-mation, and testing. Econometrica. 1987;55: 251–76.
15. MacKinnon JG. Critical values for cointe-gration tests. In: Engle RF, Granger CWJ eds. Long-run economic relationships: read-ings in cointegration. Oxford: Oxford Uni-versity Press; 1991.
16. MacKinnon JG, Haug AA, Michelis L. Nu-merical distribution functions of likelihood ratio tests for cointegration. J Appl Econom. 1999;14(5):563–77.
17. Ramos-Carbajales A, Vallarino H, Gonza-lez-Rozada M. Peru--tributación sobre los productos del tabaco. Panorama general y propuesta de reforma. Lima: Comisión Nacional Permanente de Lucha Anti-tabáquina; 2014.
18. Gonzalez-Rozada M, Rodriguez Iglesias G. Análisis de la demanda de cigarrillos en Argentina. Buenos Aires: Interamerican Heart Foundation of Argentina; 2014.
19. Ramos-Carbajales A, Curti D. Política fis-cal, asequibilidad y efectos cruzados de precios en la demanda de productos de

Rev Panam Salud Publica 40(4), 2016 255
Gonzalez-Rozada et al. • Implications of cigarette taxes in Peru Original research
tabaco: el caso de Uruguay. 2010. Available from: http://bvs.insp.mx/rsp/anteriores/n u m e ro . p h p ? y e a r = 2 0 1 0 & v o l = 5 2 & num=2&tipo=suplemento Accessed on 18 May 2016.
20. Ramos-Carbajales A, Gonzalez-Rozada M. El modelo econométrico y estimaciones de
elasticidades precio e ingreso en la de-manda de cigarrillos en El Salvador. Buenos Aires: Universidad Torcuato Di Tella; 2013.
21. Colman GJ,Remler DK. Vertical equity consequences of very high cigarette tax in-creases: If the poor are the ones smoking,
how could cigarette tax increases be pro-gressive? J Policy Anal Manag. 2008;27(2): 376–400.
Manuscript received on 3 December 2015. Revised version accepted for publication on 25 April 2016.
RESUMEN Objetivo. Examinar los efectos que podría tener un aumento de los impuestos indirectos sobre el tabaco en el Perú sobre el consumo de cigarrillos y determinar si el alza de los impuestos tendría un efecto regresivo. Métodos. La elasticidad de la demanda total en función del precio se determinó, por grupos de ingreso, a partir de dos conjuntos de datos: datos trimestrales de series cronológicas para el período de 1993 al 2012 y datos obtenidos en una encuesta trans-versal de ingresos y gastos para el período del 2008 al 2009. El tipo de función mate-mática que capta la demanda de cigarrillos en el Perú se determinó a partir de los datos trimestrales; la elasticidad de la demanda en función del precio se calculó tanto para el corto como para el largo plazo. El segundo conjunto de datos y el método de Deaton se usaron para calcular en dos pasos la elasticidad y la elasticidad por grupos. Resultados. La elasticidad de la demanda en función del precio fue de -0,7. Esto implica que un aumento de precio de 10% por efecto de un impuesto nuevo reduciría el consumo en 7%. Los cálculos de la elasticidad de la demanda en función del precio por grupos de ingreso revelaron que las familias más pobres no reaccionan más a los cambios de precio que las familias más prósperas, o sea, que un aumento de los impuestos sobre el tabaco podría tener un efecto regresivo. Conclusiones. El aumento de los impuestos sobre el tabaco es la política más eficiente para reducir el tabaquismo. Sin embargo, en el caso del Perú dicho aumento podría tener consecuencias regresivas.
Palabras clave Tributación de los productos derivados del tabaco; consumo de productos derivados del tabaco; cese del tabaquismo; economía de la salud; Perú.
Efectos de aumentar los impuestos indirectos sobre tabaco en el Perú