important cautionary note - …dmx.listedcompany.com/newsroom/20171114_183010_5ch... · brought up...
TRANSCRIPT

DMX TECHNOLOGIES GROUP LTD
1
IMPORTANT CAUTIONARY NOTE:
The financial results disclosed in this announcement include finance information provided by the Company's
subsidiaries, namely DMX Technologies (Hong Kong) Limited and DMX Technologies (Macao Commercial
Offshore) Limited (collectively, the "Affected Subsidiaries").
As disclosed in the announcement made by the Company on 24 March 2015 in relation to the Company's
request for suspension of trading in its shares, the findings (the "Findings") of the Company's Hong Kong legal
counsel (the "HK Counsel") appointed to conduct an investigation into the subject matter of the ongoing
investigations by the Commercial Crime Bureau of the Hong Kong Police Force (the "Initial Investigations")
brought up certain issues which affect the completion and audit of the Company's financial statements for the
year ended 31 December 2014 (the "FY2014 Financial Statements"). The Initial Investigations revealed that
there were irregular accounting practices at the Affected Subsidiaries in 2008 and 2009.
In addition to the above, the Company wishes to highlight that the financial results disclosed in this
announcement are subject to the background and limitations relating to the preparation of the financial
statements as set out below ("Limitations"):
(a) The Company highlighted the following issues in the announcement dated 12 May 2015:
(i) there is uncertainty in relation to account receivables arising from past transactions amongst the
Company, and its clients and vendors, and the possibility of such account receivables not being
collectible; and
(ii) there is uncertainty in relation to the asset values recorded in respect of supplies, tangible and
intangible fixed assets of the Company in connection with such transactions.
(b) As such, the Company further expanded the scope of the Initial Investigations (the "Expanded
Investigations") and in addition to the HK Counsel, engaged an independent, external accounting
investigation team to conduct independent forensic investigative procedures relating to the Expanded
Investigations.
(c) As disclosed in the announcement dated 22 April 2016 (the "April Announcement"), the Company
released a report (the "Disclosure Report") based on the Findings. As stated on page R-12 of the
Disclosure Report, the unaudited account receivables and other receivables for the financial year ended
31 December 2014 ("FY2014") amounted to approximately US$378 million, of which US$140 million
and US$190 million are due to the Company from Beijing Hantz Development and Winscom
Guangzhou Technologies Company Limited, respectively. Despite the best efforts of the Company, the
Company is uncertain as to the collectability of these account receivables. Further, the unaudited
tangible and intangible fixed assets attributable to the Transactions in Question ("TIQ") (as defined in
the Disclosure Report) for FY2014 amounting to US$28 million remains unsubstantiated due to the lack
of documentary evidence of the TIQ.
(d) As disclosed in the announcement dated 19 May 2016, due to the substantial costs of the Expanded
Investigations and the fees for completing the audit on the Company relating to the FY2014 Financial
Statements (the "FY2014 Audit"), the board of directors of the Company suspended the Expanded
Investigations and the FY2014 Audit.

DMX TECHNOLOGIES GROUP LTD
2
(e) As disclosed in the announcements dated 31 August 2017 and 5 September 2017, the Company has
completed the disposal of 60% of the entire issued and paid-up capital of PT Packet Systems Indonesia
(the "PSI Disposal"), and part of the proceeds raised from the PSI Disposal will be used to fund the
fees for the completion of an extended scope audit (the "Extended Scope Audit") in respect of the
FY2014 Financial Statements, the financial statements for the year ended 31 December 2015 (the
“FY2015 Financial Statements”) and the financial statements for the year ended 31 December 2016
(the “FY2016 Financial Statements”) by the Group's auditors, PricewaterhouseCoopers LLP
Singapore (“PwC”).
(f) Pursuant to the findings of the Initial Investigations as disclosed in the April Announcement, the
Company made corresponding adjustments to the FY2014 Financial Statements, the financial
statements for the first quarter ended 31 March 2015, the financial statements for the second quarter
ended 30 June 2015, the financial statements for the third quarter ended 30 September 2015 and the
FY2015 Financial Statements to reflect the impact of the TIQ on the Group’s results and financial
position based on the Group accounting policies which follow the relevant international accounting
standards (the "Accounting Adjustments"). The key financial statement line items affected by the
Accounting Adjustments include revenue, accounts receivable, costs of sales, accounts payable,
property, plant and equipment, and intangible assets. The Accounting Adjustments are subject to the
audit by PwC and may change as a result of the Extended Scope Audit.
(g) As the closing balances and figures in the FY2015 Financial Statements serve as the opening balances
and figures in the FY2016 Financial Statements, and the closing balances and figures in the FY2016
Financial Statements will, in turn, serve as the opening balances and figures in the quarterly and full
year financial statements for the year ending 31 December 2017 (the "Relevant FY2017 Financial
Statements"), the Accounting Adjustments will continue to have an impact on the Relevant FY2017
Financial Statements.
(h) The financial results disclosed in this announcement have not been reviewed or audited by PwC. As
such, the Company would like to remind shareholders of the Company that the financial results
disclosed in this announcement may be subject to further adjustments and revisions after the
completion of the Expanded Investigations and the Extended Scope Audit.
GIVEN THE ABOVE AND PENDING COMPLETION OF THE EXPANDED INVESTIGATIONS AND THE
EXTENDED SCOPE AUDIT, THE BOARD OF DIRECTORS WISHES TO CAUTION INVESTORS AND TO
ADVISE THAT INVESTORS SHOULD NOT RELY ON THE FINANCIAL RESULTS DISCLOSED IN THIS
ANNOUNCEMENT.

DMX TECHNOLOGIES GROUP LTD
3
UNAUDITED FINANCIAL STATEMENT FOR THIRD QUARTER OF FY2017
1(a) Statements of Comprehensive Income (for the group) together with comparative statements for the corresponding period of the immediately preceding financial year
Group Group Note 1
3Q 3Q 9M 9M 2Q
2017 2016 Change 2017 2016 Change 2017
US$'000 US$'000 % US$'000 US$'000 % US$'000
Revenue 8,969 21,831 -58.92% 38,708 68,404 -43.41% 13,620
Cost of sales (5,613) (17,833) 68.52% (28,443) (54,711) 48.01% (9,758)
Gross profit 3,356 3,998 -16.06% 10,265 13,693 -25.03% 3,862
Gross profit % 37.42% 18.31% 19.10% 26.52% 20.02% 6.50% 28.36%
Other operating income 95 110 -13.64% 243 953 -74.50% 13
Distribution costs (1,700) (2,484) 31.56% (5,958) (9,473) 37.11% (2,343)
Administrative expenses [Note2] (8,275) (2,179) -279.76% (12,317) (9,154) -34.55% (2,554)
Other operating (expenses) income (691) (81) -753.09% (537) (387) -38.76% 346
Finance costs (43) (307) 85.99% (269) (991) 72.86% (116)
Loss before income tax (7,258) (943) -669.67% (8,573) (5,359) -59.97% (792)
Income tax expense (712) (271) -162.73% (948) (854) -11.01% (212)
Loss for the period (7,970) (1,214) -556.51% (9,521) (6,213) -53.24% (1,004)
Loss attributable to:
Owners of the company (6,258) (1,415) -342.26% (7,984) (6,857) -16.44% (1,161)
Non-controlling interests (1,712) 201 -951.74% (1,537) 644 -338.66% 157
Loss for the period (7,970) (1,214) -556.51% (9,521) (6,213) -53.24% (1,004)
Loss after tax margin -88.86% -5.56% -24.60% -9.08% -7.37%
Other comprehensive income (loss):
Exchange differences arising on translation of foreign operations
(5) (495) 98.99% (359) (314) -14.33% 263
Release of exchange reserve upon disposal of a subsidiary [Note 2.(a)]
4,587 - 4,587 - -
Other comprehensive income (loss) for the period
4,582 (495) 1025.66% 4,228 (314) 1446.5% 263
Total comprehensive loss for the period
(3,388) (1,709) -98.24% (5,293) (6,527) 18.91% (741)
Total comprehensive loss attributable to:
Owners of the company (1,676) (1,910) 12.25% (3,756) (7,171) 47.62% (898)
Non-controlling interests (1,712) 201 -951.74% (1,537) 644 -338.66% 157
Total comprehensive loss for the period
(3,388) (1,709) -98.24% (5,293) (6,527) 18.91% (741)

DMX TECHNOLOGIES GROUP LTD
4
Operating loss is arrived at after crediting and (charging) :
Group Group Note 1
3Q 3Q 9M 9M 2Q 2017 2016 Change 2017 2016 Change 2017 US$'000 US$'000 % US$'000 US$'000 % US$'000
Interest income 13 7 85.71% 30 22 36.36% 12
Interest expenses (43) (306) 85.95% (269) (991) 72.86% (116)
Net foreign exchange (loss) gain (242) 844 -128.67% 285 612 -53.43% (128)
Release of exchange reserve upon disposal of a subsidiary [Note 2.(a)]
(4,587) - (4,587) - -
Decrease in allowance for doubtful trade receivables
86 159 -45.91% 77 193 -60.10% 371
(Increase in) reversal of allowance for obsolete inventories
(69) (81) 14.81% 103 (54) 290.74% (22)
Amortisation expenses (4) (153) 97.39% (13) (482) 97.30% (4)
Depreciation expenses (158) (285) 44.56% (576) (886) 34.99% (205)
Loss on write off of property, plant and equipment
- -
- (25) -100.00% -
Gain on disposal of property, plant and equipment
- 21 -100.00% 4 742 -99.46% -
Loss on disposal of a subsidiary (117) -
(117) -
-
Bad debt written off - (6) 100.00% - (19) -100.00% -
Note 1: 2Q2017 Profit and loss statement is used for comparison purpose.
Note 2: Non-ordinary Administrative expenses of Total US$7.2 million is included in “Administrative Expenses”
3Q2017
US$ million
(a) Release of exchange reserve upon disposal of a subsidiary
4.6
(b) Provision of Extended Scope Audits for FY2014 – FY2016
1.8
(c) Professional advisory fee upon disposal of a subsidiary 0.8
Total
7.2

DMX TECHNOLOGIES GROUP LTD
5
1(b) (i) Statements of Financial Position (for the issuer and group) together with comparative statements as at the end of the immediately preceding financial year Statements of Financial Position
The Group The Company
30-Sep-17 31-Dec-16 30-Jun-17 30-Sep-17 31-Dec-16
US$'000 US$’000 US$'000 US$’000 US$'000
ASSETS
Current assets:
Cash and cash equivalents 8,863 6,174 9,414 260 364
Pledged bank deposits 454 1,037 1,154 - -
Trade receivables 6,410 29,789 14,784 - -
Other receivables, deposits and prepayments
4,051 7,851 7,056 40,796 41,460
Tax recoverable 100 60 79 - -
Held for trading investments 14 14 14 - -
Inventories 3,975 18,901 14,340 - -
Total current assets 23,867 63,826 46,841 41,056 41,824
Non-current assets:
Property, plant and equipment 455 3,475 3,217 - -
Goodwill 2,000 2,700 2,700 - -
Intangible assets 52 62 54 - -
Investments in subsidiaries - - - 11,534 11,534
Deferred tax assets 175 434 727 - -
Other receivable 563 - - - -
Total non-current assets 3,245 6,671 6,698 11,534 11,534
Total assets 27,112 70,497 53,539 52,590 53,358
LIABILITIES AND EQUITY
Current liabilities:
Bank loans - 9,637 3,803 - -
Trade payables 3,138 20,618 14,559 - -
Other payables 10,008 13,092 12,327 1,910 766
Tax payables 260 2,137 521 - -
Current portion of finance lease payables - 37 37 - -
Total current liabilities 13,406 45,521 31,247 1,910 766
DMX TECHNOLOGIES GROUP LTD
6
The Group The Company
30-Sep-17 US$’000
31-Dec-16 US$’000
30-Jun-17 US$’000
30-Sep-17 US$’000
31-Dec-16 US$’000
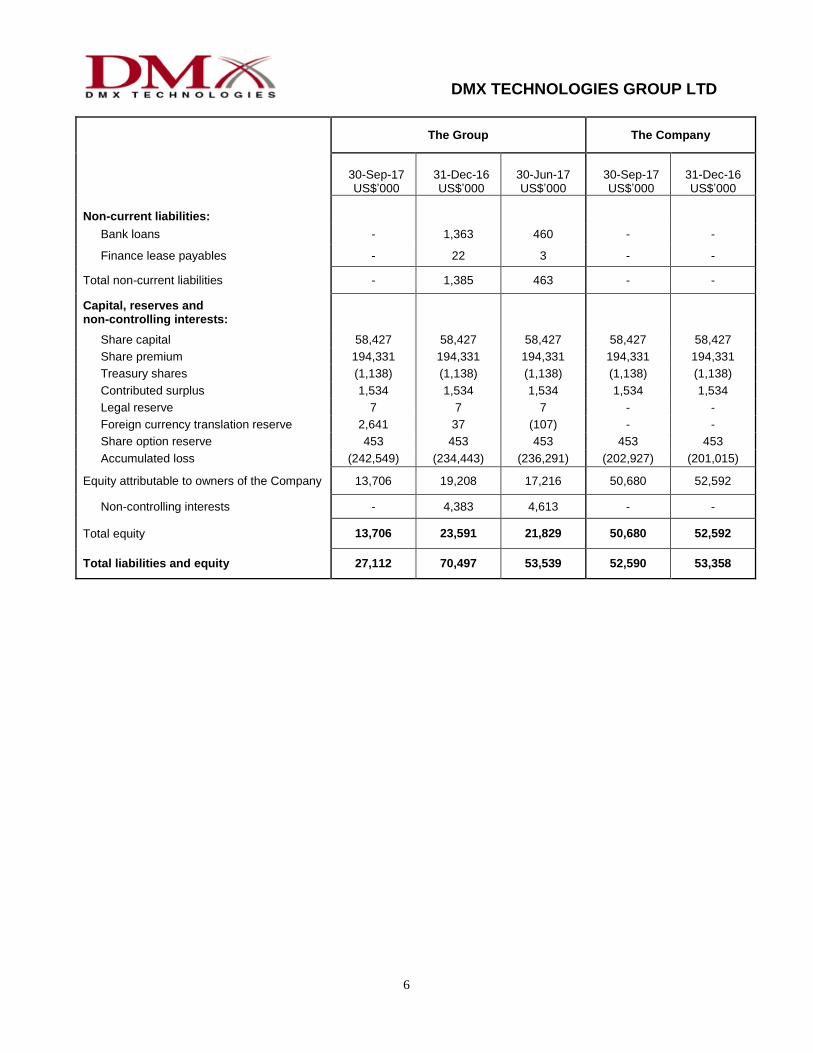
Non-current liabilities:
Bank loans - 1,363 460 - -
Finance lease payables - 22 3 - -
Total non-current liabilities - 1,385 463 - -
Capital, reserves and non-controlling interests:
Share capital 58,427 58,427 58,427 58,427 58,427
Share premium 194,331 194,331 194,331 194,331 194,331
Treasury shares (1,138) (1,138) (1,138) (1,138) (1,138)
Contributed surplus 1,534 1,534 1,534 1,534 1,534
Legal reserve 7 7 7 - -
Foreign currency translation reserve 2,641 37 (107) - -
Share option reserve 453 453 453 453 453
Accumulated loss (242,549) (234,443) (236,291) (202,927) (201,015)
Equity attributable to owners of the Company 13,706 19,208 17,216 50,680 52,592
Non-controlling interests - 4,383 4,613 - -
Total equity 13,706 23,591 21,829 50,680 52,592
Total liabilities and equity 27,112 70,497 53,539 52,590 53,358

DMX TECHNOLOGIES GROUP LTD
7
1b (ii) Aggregate amount of group’s borrowings and debts securities
Group Borrowings and Debts securities
Group
As at 30 Sep 2017 As at 31 Dec 2016
US$’000 US$’000
Amounts repayable in one year or less, or on demand
Unsecured - -
Secured - 9,674
- 9,674
Amounts repayable after one year
Unsecured - -
Secured - 1,385
- 1,385
Details of any collateral:
As at 30 September 2017, the Group and the Company respectively have: (1) pledged bank deposits of US$454,144 (31 Dec 2016: US$1,036,904) and Nil (31 Dec 2016: Nil). (2) pledged held for trading investments of US$13,456 (31 Dec 2016: US$13,456) and Nil (31 Dec 2016: Nil).

DMX TECHNOLOGIES GROUP LTD
8
1(c) Statements of Cash Flows (for the group, together with comparative statements for the corresponding period of the immediately preceding financial year Statements of Cash Flows
Note 1
3Q 3Q 9M 9M 2Q
2017 2016 2017 2016 2017
US$’000 US$’000 US$’000 US$’000 US$’000
Operating activities:
Loss before income tax (7,258) (943) (8,573) (5,359) (792)
Adjustments for:
Amortisation expense 4 153 13 482 4
Depreciation expense 158 285 576 886 205
Interest expenses 43 306 269 991 116
Release of exchange reserve upon disposal of a subsidiary
4,587 - 4,587 - -
Decrease in allowance for doubtful trade receivables
(86) (159) (77) (193) (371)
Increase in (reversal of) allowance for obsolete inventories
69 81 (103) 54 22
Loss on write off of property, plant and equipment
- - - 25 -
Gain on disposal of property, plant and equipment
- (21) (4) (742) -
Gain on disposal of a subsidiary (117) - (117) - -
Bad debt written off - 6 - 19 -
Interest income (13) (7) (30) (22) (12)
Operating cash flows before movements in working capital
(2,613) (299) (3,459) (3,859) (828)
(Increase) decrease in trade receivables (649) (1,455) 15,613 8,946 9,192
(Increase) decrease in other receivables, deposits and prepayments
(1,766) 629 (2,912) (75) (703)
(Increase) decrease in inventories (972) 599 4,097 (4,310) 1,158
Decrease in trade payables (132) (814) (7,872) (7,508) (1,990)
Increase (decrease) in other payables 293 602 (380) 788 318
Cash (used in) generated from operating activities (5,839) (738) 5,087 (6,018) 7,147
Income taxes paid (586) (37) (699) (154) (32)
Interest paid (43) (306) (269) (991) (116)
Interest received 13 7 30 22 12
Net cash (used in) generated from operating activities
(6,455) (1,074) 4,149 (7,141) 7,011

DMX TECHNOLOGIES GROUP LTD
9
Note 1
3Q 3Q 9M 9M 2Q
2017 2016 2017 2016 2017
US$'000 US$'000 US$'000 US$'000 US$'000
Investing activities:
Addition to intangible assets - (2) - (2) -
Purchase of property, plant and equipment (71) (172) (212) (726) (52)
Decrease (increase) in pledged bank deposits 234 (1,028) 117 325 (28)
Proceeds on disposal of property, plant and equipment
- 6 4 747 -
Proceeds on disposal of a subsidiary 6,639 - 6,639 - -
Net cash generated from (used in) investing activities
6,802 (1,196) 6,548 344 (80)
Financing activities:
Repayment of bank loans (389) (8,687) (7,668) (31,359) (5,422)
Repayment of finance leases (6) - (24) (16) (9)
New bank loans raised - 8,844 542 32,334 -
Dividend paid to non-controlling interests (527) - (527) (247) -
Net cash (used in) generated from financing activities
(922) 157 (7,677) 712 (5,431)
Net effect of exchange rate changes on the balance of cash held in foreign currencies / other adjustments
24 (361) (331) 27 127
Net (decrease) increase in cash and cash equivalents
(551) (2,474) 2,689 (6,058) 1,627
Cash and cash equivalent at beginning of period 9,414 7,241 6,174 10,825 7,787
Cash and cash equivalent at end of period 8,863 4,767 8,863 4,767 9,414
Note 1: 2Q2017 cash flows is used for comparison purposes.

DMX TECHNOLOGIES GROUP LTD
10
1(d)(i) Statements (for the issuer and group) showing either (i) all changes in equity or (ii) changes in equity other than those arising from capitalization issues and distributions to shareholders, together with comparative statements for the corresponding period of the immediately preceding financial year. Statements of Changes in Equity
GROUP
Share Share Treasury Contributed Legal
Foreign
currency
translation
Share
Option Accumulated
Non-
controlling Total
capital premium shares surplus reserve reserve reserve loss Total interests equity
US$'000 US$'000 US$'000 US$'000 US$'000 US$'000 US$'000 US$'000 US$'000 US$'000 US$'000
Balance at 1 Jul 2017 58,427 194,331 (1,138) 1,534 7 (107) 453 (236,291) 17,216 4,613 21,829
Loss for the period - - - - - (5) - (6,258) (6,263) (1,712) (7,975)
Other comprehensive loss for the
period:
Release of exchange reserve upon
disposal of a subsidiary- - - - - 4,587 - - 4,587 - 4,587
Total comprehensive loss for the
period- - - - - 4,582 - (6,258) (1,676) (1,712) (3,388)
Dividend to non-controlling interest - - - - - - - - - (280) (280)
Disposal of a subsdiary - - - - - (1,834) - (1,834) (2,621) (4,455)
Balance at 30 Sep 2017 58,427 194,331 (1,138) 1,534 7 2,641 453 (242,549) 13,706 - 13,706
Balance at 1 Jul 2016 58,427 194,331 (1,138) 1,534 7 60 453 (230,532) 23,142 3,748 26,890
Loss for the period - - - - - (495) - (1,415) (1,910) 201 (1,709)
Total comprehensive loss for the
period- - - - - (495) - (1,415) (1,910) 201 (1,709)
Adjustments - - - - - - - 1 1 (247) (246)
Balance at 30 Sep 2016 58,427 194,331 (1,138) 1,534 7 (435) 453 (231,946) 21,233 3,702 24,935
COMPANY
Share Share Treasury Contributed Legal
Foreign
currency
translation
Share
Option Accumulated
Non-
controlling Total
capital premium shares surplus reserve reserve reserve loss Total interests equity
US$'000 US$'000 US$'000 US$'000 US$'000 US$'000 US$'000 US$'000 US$'000 US$'000 US$'000
Balance at 1 Jul 2017 58,427 194,331 (1,138) 1,534 - 453 (201,366) 52,241 - 52,241
Loss for the period - - - - - - - (1,561) (1,561) - (1,561)
Total comprehensive loss for the
period- - - - - - - (1,561) (1,561) - (1,561)
Balance at 30 Sep 2017 58,427 194,331 (1,138) 1,534 - - 453 (202,927) 50,680 - 50,680
Balance at 1 Jul 2016 58,427 194,331 (1,138) 1,534 - - 453 (200,070) 53,537 - 53,537
Loss for the period - - - - - - - (439) (439) - (439)
Total comprehensive loss for the
period- - - - - - - (439) (439) - (439)
Balance at 30 Sep 2016 58,427 194,331 (1,138) 1,534 - - 453 (200,509) 53,098 - 53,098

DMX TECHNOLOGIES GROUP LTD
11
1(d)(ii) Details of any changes in the company's share capital arising from rights issue, bonus issue, share buy-backs, exercise of share options or warrants, conversion of other issues of equity securities, issue of shares for cash or as consideration for acquisition or for any other purposes since the end of the previous period reported on. State also the number of shares that may be issued on conversion of all the outstanding convertibles, as well as the number of shares held as treasury shares, if any, against the total number of issued shares excluding treasury shares of the issuer, as at end of the current financial period reported on and as at the end of the corresponding period of the immediately preceding financial year.
Share Capital Changes
Share Capital Changes No. of shares US$'000
Ordinary shares of US$0.05 each at 1 July 2017 and 30 September 2017 1,168,546,867 58,427
Treasury Shares Changes
No. of shares US$'000
Balance as at 1 July 2017 and 30 September 2017 5,152,125 1,138
Share Options & Contingent Shares
As at 30 September 2017, the following Employee Share Options remained outstanding:
Date of grant Exercise Period Exercise price per
share
Balance at beginning of
year
Total exercised
Total cancelled
Balance outstanding as at 30 Sep 17
25 April 2008 24 April 2009 to
25 April 2018 S$0.226 3,886,858 - - 3,886,858
28 November 2008 27 November 2009 to
28 November 2018 S$0.093 7,471,000 - - 7,471,000
Total 11,357,858 - - 11,357,858
1(d) (iii) To show the total number of issued shares excluding treasury shares as at the end of the current financial period and as at the end of the immediately preceding financial year.
30-Sep-17 31-Dec-16
No. of shares issued 1,163,394,742 1,163,394,742

DMX TECHNOLOGIES GROUP LTD
12
1(d) (iv) A statement showing all sales, transfers, disposal, cancellation and/or use of treasury shares as at end of the current financial period reported on
There were no sales, transfers, disposal, cancellation and/or use of treasury shares as at 30 September 2017.
2. Whether the figures have been audited, or reviewed and in accordance with which standard (e.g.
Singapore Standard on Auditing 910, Engagements to Review Financial Statements, or an equivalent standard).
The figures have not been audited or reviewed.
3. Where the figures have been audited or reviewed, the auditors’ report (including any qualifications or emphasis of matter).
The figures have not been audited or reviewed.
4. Whether the same accounting policies and methods of computation as in the issuer’s most recently audited annual financial statements have been applied.
The accounting policies and methods of computation applied by the Group are consistent with those used in its most recently audited financial statements as at 31 December 2013.
However, please refer to paragraph (f) of “Important Cautionary Notes” stating the “Accounting Adjustments” based on the Group accounting policies which follow the relevant international accounting standards.
5. If there are any changes in the accounting policies and methods of computation, including any required by an accounting standard, what has changed, as well as the reasons for, and the effect of, the change.
Please refer to paragraph (f) of “Important Cautionary Notes” stating the “Accounting Adjustments” based on the Group accounting policies which follow the relevant international accounting standards.
6. Earnings per ordinary share of the group for the current period reported on and the corresponding period of the immediate preceding financial year, after deducting any provision for preference dividends.
Earnings per share
The Group
3Q 3Q 9M 9M
2017 2016 2017 2016
Based on the weighted average number of ordinary shares on issue (US cents)
Note 1 -0.70 -0.12 -0.84 -0.59
On fully diluted basis (US Cents) Note 2 -0.70 -0.12 -0.84 -0.59
Note 1) The weighted average number of ordinary shares in issue for 3Q2017 and YTD Sep 2017: 1,163,394,742 (3Q2016 and YTD Sep 2016: 1,163,394,742).
Note 2) The earnings per share on a fully diluted basis are calculated on the adjusted average number of ordinary shares for 3Q2017 and YTD Sep 2017: 1,163,394,742 (3Q2016 and YTD Sep 2016: 1,163,394,742).

DMX TECHNOLOGIES GROUP LTD
13
7. Net asset value (for the issuer and group) per ordinary share based on the total number of issued shares
excluding treasury shares of the issuer at the end of the (a) current period reported on and (b) immediately preceding financial year.
Net asset value per share The Group The Company
30-Sep-17 31-Dec-16 30-Sep-17 31-Dec-16
Net asset value per ordinary share (US cents) 1.18 1.65 4.36 4.52
Net asset value per ordinary share as at 30 September 2017 and 31 December 2016 are also calculated based on share capital of the Company of 1,163,394,742 shares.
8. A review of the performance of the group, to the extent necessary for a reasonable understanding of the group’s business. The review must discuss any significant factors that affected the turnover, costs, and earnings of the group for the current financial period reported on, (where applicable) seasonal or cyclical factors. It must also discuss any material factors that affected cash flow, working capital, assets or liabilities of the group during the current financial period reported on.
Statements of Comprehensive Income The following paragraphs should be read in conjunction with our Statements of Comprehensive Income for quarter ended 30 September 2017 as presented on Section 1(a) of this document.
Revenue
3Q 3Q 9M 9M
Business Divisions
Business Segments 2017 2016 YOY 2017 2016 YOY
US$’m US$’m % US$’m US$’m %
ICT
ICT Solutions 6.0 15.1 -60.3 26.0 50.9 -48.9
Services / Software 3.0 6.5 -53.8 10.8 16.5 -34.5
Sub-total 9.0 21.6 -58.3 36.8 67.4 -45.4
as % of overall sales 100.0% 99.1% 95.1% 98.5%
Digital Media (TV related)
Digital Media Solutions 0.0 0.2 -100.0 1.9 1.0 90.0
as % of overall sales 0.0% 0.9% 4.9% 1.5%
Total 9.0 21.8 -58.9 38.7 68.4 -43.4
Overview The Group recorded a 58.9% year-on-year (“yoy”) decrease in revenue to US$9.0 million in 3Q2017. The lower revenue was a result of the lower revenue in Indonesia and the other restructuring business units such as China. ICT The Group’s “ICT” division revenue decreased 58.3% yoy to US$9.0 million in 3Q2017, which accounts for 100% of the Group’s total revenue. While the “Services” segment decreased 53.8% yoy to US$3.0 million mainly due to the overall lower revenue in the above mentioned regions.

DMX TECHNOLOGIES GROUP LTD
14
Digital Media & Mobile Solution Services The Group had no sales in 3Q2017 due to no accomplishment of existing ordered projects in China
3Q 3Q 9M 9M
Geographical Segment 2017 2016 YOY 2017 2016 YOY
US$’m US$’m % US$’m US$’m %
China 0.8 3.5 -77.1 5.5 12.2 -54.9
as % of overall sales 8.9% 16.0% 14.2% 17.8%
Indonesia 5.6 16.2 -65.4 27.1 47.0 -42.3
as % of overall sales 62.2% 74.3% 70.0% 68.7%
Others 2.6 2.1 23.8 6.1 9.2 -33.7
as % of overall sales 28.9% 9.7% 15.8% 13.5%
Total 9.0 21.8 -58.9 38.7 68.4 -43.4
Revenue from “China” region dropped 77.1% yoy to US$0.8 million in 3Q2017 mainly due to the restructuring of China operation. As a result, China’s contribution reduced to 8.9% of the Group’s total revenue for 3Q2017. Revenue from “Indonesia” declined 65.4% yoy to US$5.6 million in 3Q2017 due to (1) sluggish sales up to August 2017 and (2) no revenue is counted after the disposal. Indonesia’s contribution decreased to 62.2% in 3Q2017 of the Group’s total revenue. Meanwhile, the Group recorded 23.8% yoy increase to US$2.6 million in 3Q2017 for “Others” outside of “China” and “Indonesia”. Revenue contribution from “Others” increased to 28.9% in 3Q2017 of the Group’s total revenue due to the reduction of overall group revenue. Gross Margin Gross margin ratio increased 19.10% yoy to 37.42% in 3Q2017 mainly due to the higher margin ratio based on the restructuring business portfolio of the group.
Total Operating Expenses The Group’s total operating expense increased 112.0% yoy to US$10.7 million in 3Q2017 including “non-ordinary expenses” of total US$7.2 million mentioned in Note 2 of Section 1(a) of this report. The Group has streamlined its operation over the last years and resulted in lower “ordinary expenses” (exclude non-ordinary) at US$3.5 million in 3Q2017. Loss Before Tax The Group’s loss before tax was increased to the level of US$7.3 million in 3Q2017 compared to US$0.9 million in 3Q2016 as a result of the group optimization due to the non-ordinary expenses as mentioned above. Statements of Financial Position The following paragraphs should be read in conjunction with our Statements of Financial Position as at 30 September 2017 as presented on section 1(b) (i) of this document.

DMX TECHNOLOGIES GROUP LTD
15
Total current assets decreased by US$40.0 million to US$23.9 million as at 30 September 2017 compared to the last year end unaudited figures. This was largely due to the net impact from:-
US$2.7 million increase in cash and cash equivalents to US$8.9 million;
US$0.6 million decrease in pledged bank deposits;
US$23.4 million decrease in trade receivables to US$6.4 million;
US$3.8 million decrease in other receivables, deposits and prepayments to suppliers; and
US$14.9 million decrease in indent inventories.
Aging of total trade receivables are as follows:-
0-180 days 181-360 days 361-540 days Over 540 days
30 September 2017 41% 15% 4% 40%
30 June 2017 71% 3% 5% 21%
31 March 2017 78% 4% 8% 10%
31 December 2016 79% 7% 5% 9%
30 September 2016 77% 7% 1% 15%
The aging of total trade receivable of 30 September 2017 has been significantly changed after the disposal of Indonesia business unit. The long outstanding but collectable debts are mainly attributed to China and Korea. The above trade receivables are with credit worthy, reputable customers and all projects are irrevocable and not from any interested party. As the Group is undertaking many projects concurrently, a task force is in place in each country to work closely with each of the telecom and the enterprise customers on the progress of their projects.
Non-current assets reduced by US$3.4 million to US$3.2 million as at 30 September 2017 due to the disposal of Indonesia business unit.
Total current liabilities have been decreased by US$32.1 million to US$13.4 million as at 30 September 2017. This was due mainly to a US$20.6 million decrease in trade and other payable; and US$9.6 million decrease in bank loan.
As at 30 September 2017, the Group’s equity attributable to shareholders decreased by US$5.5 million to US$13.7 million mainly due to the loss of US$8.0 million during 9M2017.
Statements of Cash Flows The following paragraphs should be read in conjunction with our Statements of Cash Flows as of 30 September 2017 as presented on section 1(c) of this document.
The Group utilized US$6.5 million of cash in operations in 3Q2017 compared to US$1.1 million utilized in 3Q2016. The Group had the increase of trade receivables, other receivable and inventories of US$0.6 million, US$1.8 million and US$1.0 million respectively.

DMX TECHNOLOGIES GROUP LTD
16
The Group generated US$6.8 million of cash in investing activities for 3Q2017 as compared to US$1.1 million cash utilized for 3Q2016 due to the proceeds on disposal of a subsidiary of US$6.6 million in 3Q2017. The Group has utilized US$0.9 million of cash in financing activities in 3Q2017 compared to US$0.2 million generated in 3Q2016 due to repayment of bank loan and no new bank loans raised in 3Q2017. As a result of the above activities, the Group recorded a decrease in cash and cash equivalents of US$0.6 million in 3Q2017, compared to the decrease of US$2.5 million in 3Q2016.
9. Where a forecast, or a prospect statement, has been previously disclosed to shareholders, any variance
between it and actual results. Not applicable.
10. A commentary at the date of the announcement of the competitive conditions of the industry in which the group operates and any known factors or events that may affect the group in the next reporting period and the next 12 months.
The Group remains cautious and continues to exercise prudence in view of the slower growth and challenging ICT business environment. As such, the Group is focusing on ICT business in emerging markets while shifting away from capital intensive hardware systems integration business and slimming down the operation in matured markets; which may result in lower revenue from “ICT” division. However, the Group will continue to pursue opportunities in niche markets comprising IT security solutions, software, managed services and cloud computing. Although these solutions are relatively lower in business volume and market opportunities, they yield higher profitability and are in line with the Group’s focus to generate more recurring revenue in software and services in the ICT division. The Group sees the limitation of fund as a major obstacle in order to expand the business especially in emerging markets where capital intensive hardware systems integration is the major market opportunity. Going forward, it is difficult for the Group to prospect for growth potential within the current “ICT” business division, while remaining vigilant due to the limitation of fund in undertaking projects with intensive working capital required.
11. Dividend
a. Current Financial Period Reported On
Any dividend declared for the current financial period reported on? No
Name of dividend Not Applicable
Dividend Type Not Applicable
Dividend amount per share (in S$ cents) Not Applicable
Tax Rate Not Applicable
b. Corresponding Period of the immediately preceding financial year
Any dividend declared for the corresponding period of the immediately preceding financial year? No
Name of dividend Not Applicable
Dividend Type Not Applicable
Dividend amount per share (in S$ cents) Not Applicable
Tax Rate Not applicable

DMX TECHNOLOGIES GROUP LTD
17
c. Date payable
Not Applicable.
d. Books Closure date
Not Applicable.
12. If no dividend has been declared/recommended, a statement to that effect.
No dividend has been declared / recommended.
13. If the Group has obtained a general mandate from shareholders for IPTS, the aggregate value of such transactions as required under Rule 920(1)(a)(ii). If no IPT mandate has been obtained, a statement to that effect.
Name of interested person
Aggregate value of all IPTs during the financial year under review (excluding transactions
less than S$100,000 and transactions conducted under
shareholders’ mandate pursuant to Rule 920)
Aggregate value of all IPTs conducted under shareholder’s mandate pursuant to Rule 920 (excluding transactions less
than S$100,000)
Transactions for the sales of goods and services
KDDI Corporation and/or its Associates
- -
Transactions for the purchase of goods and services
KDDI Corporation and/or its Associates
-
-
Total Interested Person Transactions
- -
14. Negative confirmation pursuant to Rule 705(5)
“We, Iwao Oishi and Takashi Eida, being two directors of DMX Technologies Group Ltd (the “Company”) wish to highlight that the preparation of the 3Q 2017 results is subject to the Limitations set out in the “Important Cautionary Note” on pages 1 and 2 of this announcement. As such, the financial information disclosed in this announcement may be subject to further adjustments and revisions depending on the outcome of the Expanded Investigations and the Extended Scope Audit. Subject to the above, we hereby confirm on behalf of the Directors that, to the best of their knowledge, nothing has come to the attention of the Board of Directors of the Company which may render the Group’s unaudited financial result for the 3rd quarter ended 30 September 2017 to be materially false or
misleading."

DMX TECHNOLOGIES GROUP LTD
18
15. Confirmation that the issuer has procured undertakings from all its directors and executive officers (in the format set out in Appendix 7.7) under Rule 720(1)
The Company has procured undertakings from all its directors and executive officers (in the format set out in Appendix 7.7) under Rule 720(1) of the Listing Manual of the Singapore Exchange Securities Trading Limited.
`
By Order of the Board Iwao Oishi Executive Director, Vice Chairman and Acting Chief Executive Officer 14 November 2017