importers, exporters, and exchange rate disconnectitskhoki/papers/importsandpassthroug… ·...
TRANSCRIPT
Importers, Exporters, and
Exchange Rate Disconnect
Mary Amiti Oleg Itskhoki Jozef KoningsNY FRB Princeton Leuven and BNB
Princeton IES WorkshopJuly 2013
1 / 23
Motivation
• Large movements in exchange rates have small effects on theprices of internationally traded goods
— this exchange rate disconnect constitutes one of the centralpuzzles in international macroeconomics
• The vast empirical pass-through literature has neglected oneof the most salient features of international trade:
— the largest exporters are the largest importers
• We show this pattern is key to understanding low aggregatepass-through and the variation in pass-through across firms
1 / 23

Our Approach
1 Develop theory to guide our empirical strategy
— Variable mark-ups due to strategic complementarities
— Firm’s choice to import intermediate inputs
• Methodology:
o pass-through estimation in a GE environment
o structural interpretation of the pass-through equation
2 Use detailed firm-level Belgium data to test and quantify themechanism
o merge firm data on exports by destination, imports bysource-country, and domestic cost data
o construct firm import intensity from outside the Euro Area (asa share of total variable cost)
o construct firm-industry-export destination market shares as aproxy for markup
2 / 23
Main Findings
1 A firm in the 5th percentile, with zero import intensity andmarket share, has nearly complete pass-through
2 A firm in the 95th percentile of import intensity and marketshare distributions has 55% pass-through
3 Marginal cost and markup channels contribute roughly equallyto this cross-sectional variation
— import intensity proxies for marginal cost— market share proxies for markup elasticity
4 Low aggregate exchange rate pass-through: 62%
— Firm import intensity, as well as export market shares, areheavily skewed towards the largest exporters
3 / 23
Related Literature
1 Exporters and importers
— e.g., Bernard, Redding and Schott (2009)
2 Imports and productivity
— e.g., Amiti and Konings (’07), Halpern, Koren and Szeidl (’11)
3 Incomplete pass-through (exchange rate disconnect)
— Pricing-to-market (PTM)(Dornbusch ’87; Krugman ’87; Atkeson and Burstein, 2008)
— Sticky prices and local currency pricing (LCP)(Engel, 2006; Gopinath, Itskhoki and Rigobon, 2010)
— Local distribution margin (Campa and Goldberg, 2010)
— Firm size and pass-through (Berman, Martin and Mayer, 2011)
— Market share and pass-through (Feenstra,Gagnon&Knetter’96)
— Structural demand estimation (Goldberg and Hellerstein, 2008)
4 / 23

THEORY
5 / 23

Model Ingredients and Mechanism
1 Nested CES + oligopoly = variable markups(Atkeson and Burstein, 2008)
2 Access to imported inputs at a fixed cost(Halpern, Koren and Szeidl, 2011)
Productivity
Cost of importing
Quality\Demand
Imported inputs, ϕ
Market share, s
Markup elasticity
Marginal cost sensitivity
Pass-through
5 / 23
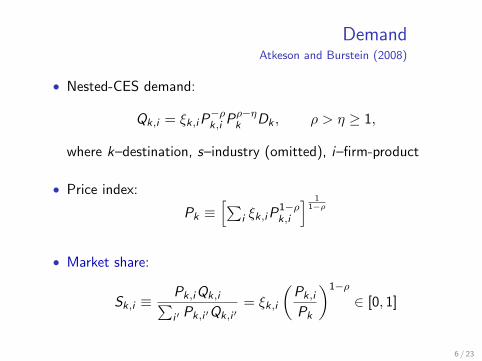
DemandAtkeson and Burstein (2008)
• Nested-CES demand:
Qk,i = ξk,iP−ρk,i Pρ−η
k Dk , ρ > η ≥ 1,
where k–destination, s–industry (omitted), i–firm-product
• Price index:
Pk ≡[∑
i ξk,iP1−ρk,i
] 11−ρ
• Market share:
Sk,i ≡Pk,iQk,i∑i ′ Pk,i ′Qk,i ′
= ξk,i
(Pk,i
Pk
)1−ρ∈ [0, 1]
6 / 23
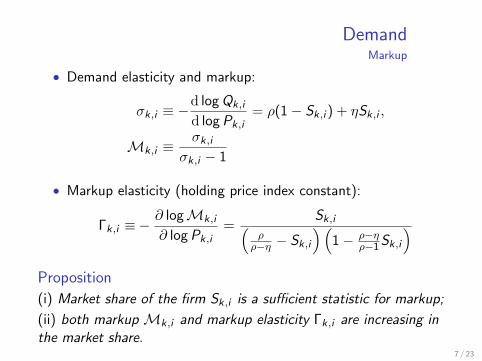
DemandMarkup
• Demand elasticity and markup:
σk,i ≡ −d log Qk,i
d log Pk,i= ρ(1− Sk,i ) + ηSk,i ,
Mk,i ≡σk,i
σk,i − 1
• Markup elasticity (holding price index constant):
Γk,i ≡−∂ logMk,i
∂ log Pk,i=
Sk,i(ρ
ρ−η − Sk,i
)(1− ρ−η
ρ−1 Sk,i
)Proposition
(i) Market share of the firm Sk,i is a sufficient statistic for markup;
(ii) both markup Mk,i and markup elasticity Γk,i are increasing inthe market share.
7 / 23
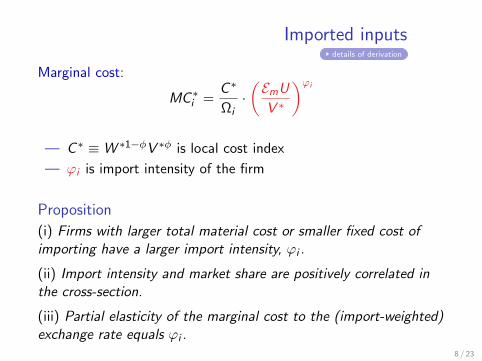
Imported inputsdetails of derivation
Marginal cost:
MC ∗i =C ∗
Ωi·(EmU
V ∗
)ϕi
— C ∗ ≡W ∗1−φV ∗φ is local cost index
— ϕi is import intensity of the firm
Proposition
(i) Firms with larger total material cost or smaller fixed cost ofimporting have a larger import intensity, ϕi .
(ii) Import intensity and market share are positively correlated inthe cross-section.
(iii) Partial elasticity of the marginal cost to the (import-weighted)exchange rate equals ϕi .
8 / 23
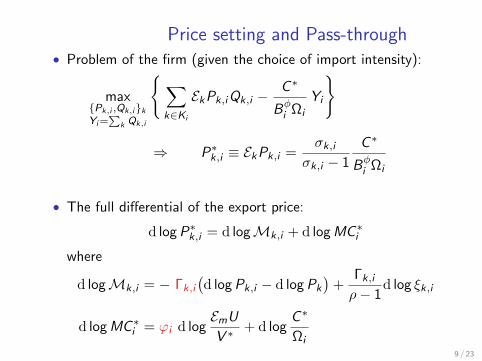
Price setting and Pass-through• Problem of the firm (given the choice of import intensity):
maxPk,i ,Qk,ikYi=
∑k Qk,i
∑k∈Ki
EkPk,iQk,i −C ∗
Bφi Ωi
Yi
⇒ P∗k,i ≡ EkPk,i =σk,i
σk,i − 1
C ∗
Bφi Ωi
• The full differential of the export price:
d log P∗k,i = d logMk,i + d log MC ∗i
where
d logMk,i = − Γk,i
(d log Pk,i − d log Pk
)+
Γk,i
ρ− 1d log ξk,i
d log MC ∗i = ϕi d logEmU
V ∗+ d log
C ∗
Ωi9 / 23
Pass-through
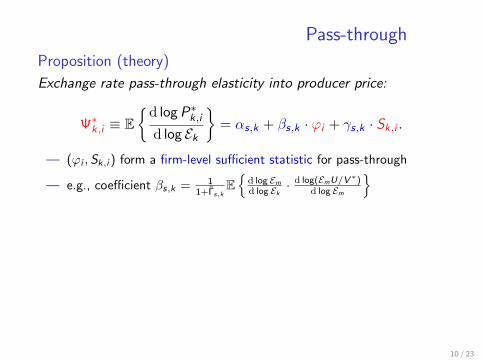
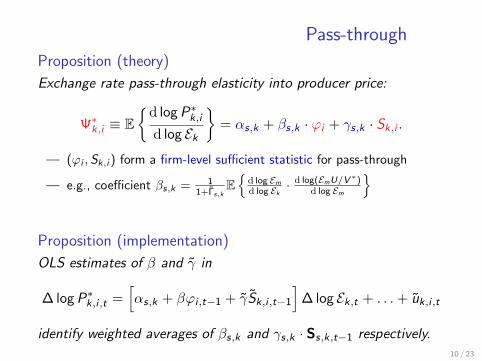
Proposition (theory)
Exchange rate pass-through elasticity into producer price:
Ψ∗k,i ≡ Ed log P∗k,id log Ek
= αs,k + βs,k · ϕi + γs,k · Sk,i .
— (ϕi ,Sk,i ) form a firm-level sufficient statistic for pass-through
— e.g., coefficient βs,k = 11+Γs,k
E
d log Emd log Ek ·
d log(EmU/V ∗)d log Em
Proposition (implementation)
OLS estimates of β and γ in
∆ log P∗k,i ,t =[αs,k + βϕi ,t−1 + γSk,i ,t−1
]∆ log Ek,t + . . .+ uk,i ,t
identify weighted averages of βs,k and γs,k · Ss,k,t−1 respectively.
10 / 23
Pass-through
Proposition (theory)
Exchange rate pass-through elasticity into producer price:
Ψ∗k,i ≡ Ed log P∗k,id log Ek
= αs,k + βs,k · ϕi + γs,k · Sk,i .
— (ϕi ,Sk,i ) form a firm-level sufficient statistic for pass-through
— e.g., coefficient βs,k = 11+Γs,k
E
d log Emd log Ek ·
d log(EmU/V ∗)d log Em
Proposition (implementation)
OLS estimates of β and γ in
∆ log P∗k,i ,t =[αs,k + βϕi ,t−1 + γSk,i ,t−1
]∆ log Ek,t + . . .+ uk,i ,t
identify weighted averages of βs,k and γs,k · Ss,k,t−1 respectively.10 / 23

EMPIRICS
1. DATA, STYLIZED FACTS
11 / 23

Dataset
• Belgian firm-level data (annual, 2000-2008):
1 NBB import and export data by firm-product-country atHS 8-digit (10K product codes): values and quantities
2 Belgian Business Registry firm panel with firm characteristics,including firm’s inputs (wages and material costs)
• Export price (unit value):
∆p∗f ,i ,k,t ≡ ∆ log
(Export valuef ,i ,k,t
Export quantityf ,i ,k,t
)
• Focus on manufacturing exports to non-Euro OECD countriesin major IO category
11 / 23
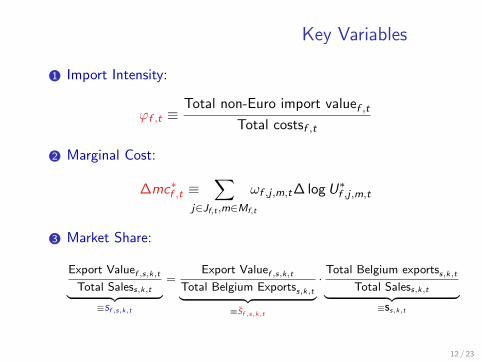
Key Variables
1 Import Intensity:
ϕf ,t ≡Total non-Euro import valuef ,t
Total costsf ,t
2 Marginal Cost:
∆mc∗f ,t ≡∑
j∈Jf,t ,m∈Mf,t
ωf ,j ,m,t∆ log U∗f ,j ,m,t
3 Market Share:
Export Valuef ,s,k,tTotal Saless,k,t︸ ︷︷ ︸
≡Sf ,s,k,t
=Export Valuef ,s,k,t
Total Belgium Exportss,k,t︸ ︷︷ ︸≡Sf ,s,k,t
·Total Belgium exportss,k,t
Total Saless,k,t︸ ︷︷ ︸≡Ss,k,t
12 / 23
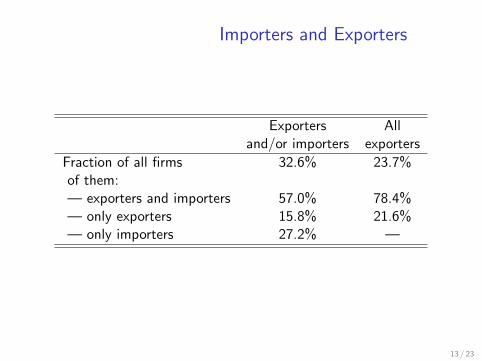
Importers and Exporters
Exporters Alland/or importers exporters
Fraction of all firms 32.6% 23.7%of them:— exporters and importers 57.0% 78.4%— only exporters 15.8% 21.6%— only importers 27.2% —
13 / 23
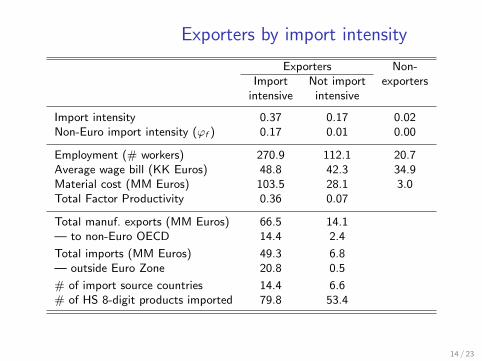
Exporters by import intensity
Exporters Non-Import Not import exporters
intensive intensive
Import intensity 0.37 0.17 0.02Non-Euro import intensity (ϕf ) 0.17 0.01 0.00
Employment (# workers) 270.9 112.1 20.7Average wage bill (KK Euros) 48.8 42.3 34.9Material cost (MM Euros) 103.5 28.1 3.0Total Factor Productivity 0.36 0.07
Total manuf. exports (MM Euros) 66.5 14.1— to non-Euro OECD 14.4 2.4
Total imports (MM Euros) 49.3 6.8— outside Euro Zone 20.8 0.5
# of import source countries 14.4 6.6# of HS 8-digit products imported 79.8 53.4
14 / 23
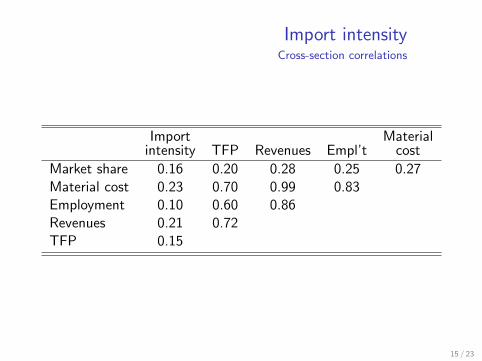
Import intensityCross-section correlations
Import Materialintensity TFP Revenues Empl’t cost
Market share 0.16 0.20 0.28 0.25 0.27Material cost 0.23 0.70 0.99 0.83Employment 0.10 0.60 0.86Revenues 0.21 0.72TFP 0.15
15 / 23

Import intensityDistribution
frac# firms frac firms exp. value
ϕf = 0 716 24.9% 1.2%0 < ϕf ≤ 0.1 1,478 51.3% 38.5%
0.1 < ϕf ≤ 0.2 348 12.1% 23.8%0.2 < ϕf ≤ 0.3 154 5.4% 8.9%0.3 < ϕf ≤ 0.4 95 3.3% 22.7%
ϕf > 0.4 89 3.1% 4.9%
• Time-averaged firm import intensity ϕf , contributes over 85%to the variation in ϕf ,t
• For a given firm, ∆ϕf ,t responds little to ∆eMf ,t
16 / 23
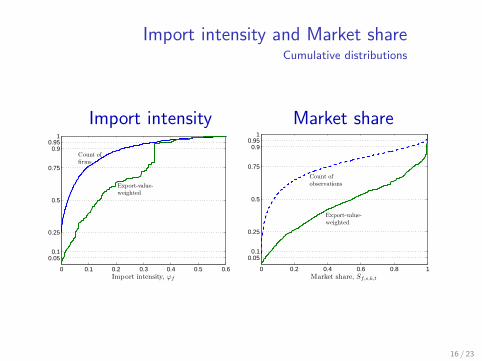
Import intensity and Market shareCumulative distributions
Import intensity Market share
0 0.1 0.2 0.3 0.4 0.5 0.6
0.050.1
0.25
0.5
0.75
0.90.95
1
Import intensity, ϕf
Count offirms
Export-value-weighted
0 0.2 0.4 0.6 0.8 1
0.050.1
0.25
0.5
0.75
0.90.95
1
Market share, Sf,s,k,t
Export-value-weighted
Count ofobservations
16 / 23

EMPIRICS
2. MAIN RESULTS
17 / 23
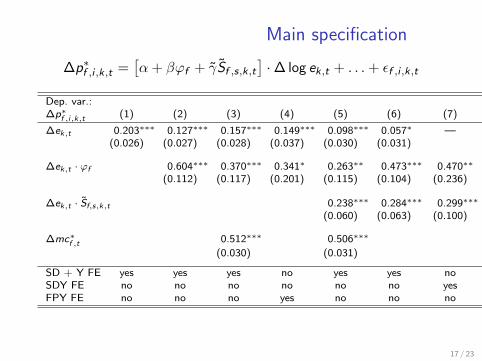
Main specification
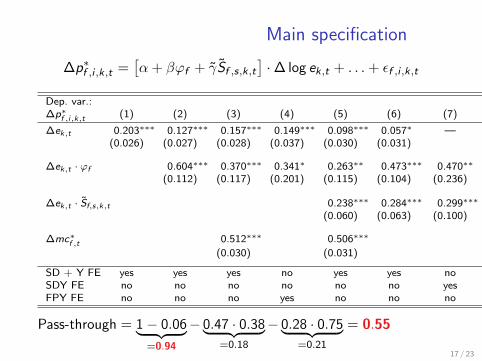
∆p∗f ,i ,k,t =[α + βϕf + γSf ,s,k,t
]·∆ log ek,t + . . .+ εf ,i ,k,t
Dep. var.:∆p∗f ,i,k,t (1) (2) (3) (4) (5) (6) (7)
∆ek,t 0.203∗∗∗ 0.127∗∗∗ 0.157∗∗∗ 0.149∗∗∗ 0.098∗∗∗ 0.057∗ —(0.026) (0.027) (0.028) (0.037) (0.030) (0.031)
∆ek,t · ϕf 0.604∗∗∗ 0.370∗∗∗ 0.341∗ 0.263∗∗ 0.473∗∗∗ 0.470∗∗
(0.112) (0.117) (0.201) (0.115) (0.104) (0.236)
∆ek,t · Sf,s,k,t 0.238∗∗∗ 0.284∗∗∗ 0.299∗∗∗
(0.060) (0.063) (0.100)
∆mc∗f ,t 0.512∗∗∗ 0.506∗∗∗
(0.030) (0.031)
SD + Y FE yes yes yes no yes yes noSDY FE no no no no no no yesFPY FE no no no yes no no no
Pass-through = 1− 0.06︸ ︷︷ ︸=0.94
− 0.47 · 0.38︸ ︷︷ ︸=0.18
− 0.28 · 0.75︸ ︷︷ ︸=0.21
= 0.55
17 / 23
Main specification
∆p∗f ,i ,k,t =[α + βϕf + γSf ,s,k,t
]·∆ log ek,t + . . .+ εf ,i ,k,t
Dep. var.:∆p∗f ,i,k,t (1) (2) (3) (4) (5) (6) (7)
∆ek,t 0.203∗∗∗ 0.127∗∗∗ 0.157∗∗∗ 0.149∗∗∗ 0.098∗∗∗ 0.057∗ —(0.026) (0.027) (0.028) (0.037) (0.030) (0.031)
∆ek,t · ϕf 0.604∗∗∗ 0.370∗∗∗ 0.341∗ 0.263∗∗ 0.473∗∗∗ 0.470∗∗
(0.112) (0.117) (0.201) (0.115) (0.104) (0.236)
∆ek,t · Sf,s,k,t 0.238∗∗∗ 0.284∗∗∗ 0.299∗∗∗
(0.060) (0.063) (0.100)
∆mc∗f ,t 0.512∗∗∗ 0.506∗∗∗
(0.030) (0.031)
SD + Y FE yes yes yes no yes yes noSDY FE no no no no no no yesFPY FE no no no yes no no no
Pass-through = 1− 0.06︸ ︷︷ ︸=0.94
− 0.47 · 0.38︸ ︷︷ ︸=0.18
− 0.28 · 0.75︸ ︷︷ ︸=0.21
= 0.55
17 / 23
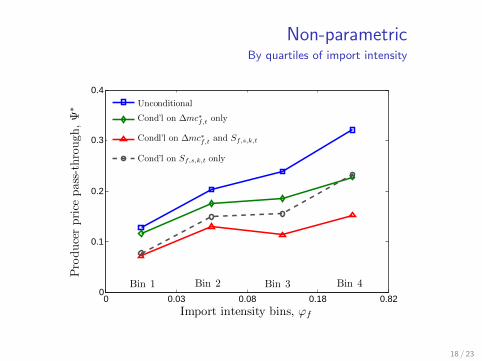
Non-parametricBy quartiles of import intensity
0 0.03 0.08 0.18 0.820
0.1
0.2
0.3
0.4
Import intensity bins, ϕf
Producerprice
pass-through,Ψ
∗
Unconditional
Cond’l on ∆mc∗f,t only
Condl’l on ∆mc∗f,t and Sf,s,k,t
Cond’l on Sf,s,k,t only
Bin 4Bin 2Bin 1 Bin 3
18 / 23
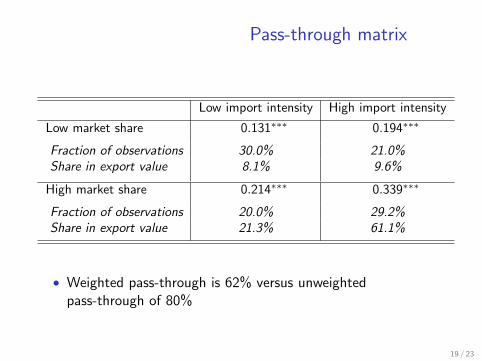
Pass-through matrix
Low import intensity High import intensity
Low market share 0.131∗∗∗ 0.194∗∗∗
Fraction of observations 30.0% 21.0%Share in export value 8.1% 9.6%
High market share 0.214∗∗∗ 0.339∗∗∗
Fraction of observations 20.0% 29.2%Share in export value 21.3% 61.1%
• Weighted pass-through is 62% versus unweightedpass-through of 80%
19 / 23

EMPIRICS
3. EXTENSIONS/ROBUSTNESS
20 / 23
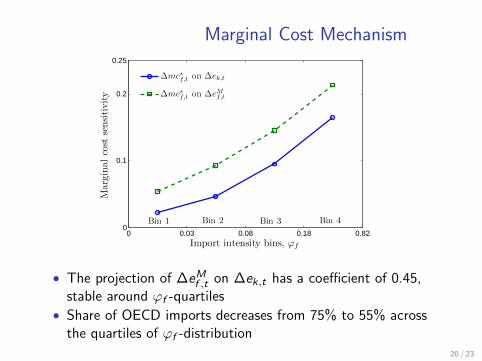
Marginal Cost Mechanism
0 0.03 0.08 0.18 0.820
0.1
0.2
0.25
Import intensity bins, ϕf
Marginalcost
sensitivity
∆mc∗f,t on ∆ek,t
∆mc∗f,t on ∆eMf,t
Bin 4Bin 2 Bin 3Bin 1
• The projection of ∆eMf ,t on ∆ek,t has a coefficient of 0.45,stable around ϕf -quartiles
• Share of OECD imports decreases from 75% to 55% acrossthe quartiles of ϕf -distribution
20 / 23
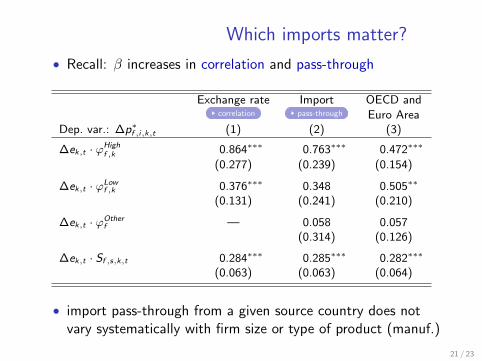
Which imports matter?
• Recall: β increases in correlation and pass-through
Exchange rate Import OECD andcorrelation pass-through Euro Area
Dep. var.: ∆p∗f ,i,k,t (1) (2) (3)
∆ek,t · ϕHighf ,k 0.864∗∗∗ 0.763∗∗∗ 0.472∗∗∗
(0.277) (0.239) (0.154)
∆ek,t · ϕLowf ,k 0.376∗∗∗ 0.348 0.505∗∗
(0.131) (0.241) (0.210)
∆ek,t · ϕOtherf — 0.058 0.057
(0.314) (0.126)
∆ek,t · Sf ,s,k,t 0.284∗∗∗ 0.285∗∗∗ 0.282∗∗∗
(0.063) (0.063) (0.064)
• import pass-through from a given source country does notvary systematically with firm size or type of product (manuf.)
21 / 23
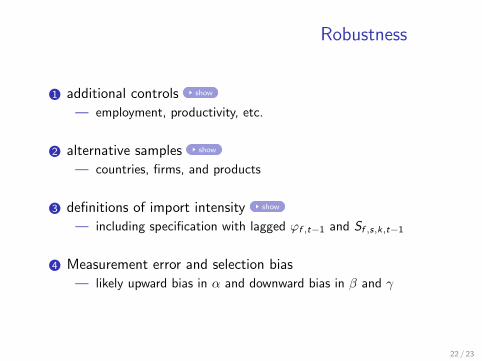
Robustness
1 additional controls show
— employment, productivity, etc.
2 alternative samples show
— countries, firms, and products
3 definitions of import intensity show
— including specification with lagged ϕf ,t−1 and Sf ,s,k,t−1
4 Measurement error and selection bias
— likely upward bias in α and downward bias in β and γ
22 / 23
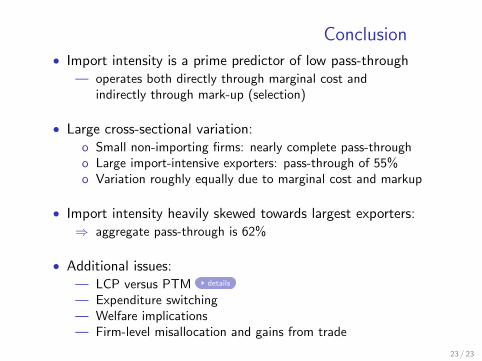
Conclusion
• Import intensity is a prime predictor of low pass-through— operates both directly through marginal cost and
indirectly through mark-up (selection)
• Large cross-sectional variation:o Small non-importing firms: nearly complete pass-througho Large import-intensive exporters: pass-through of 55%o Variation roughly equally due to marginal cost and markup
• Import intensity heavily skewed towards largest exporters:⇒ aggregate pass-through is 62%
• Additional issues:— LCP versus PTM details
— Expenditure switching— Welfare implications— Firm-level misallocation and gains from trade
23 / 23

APPENDIX
24 / 23

Additional issues
1 Price stickiness and currency choice
— Low flexible-price pass-through (PTM) versus LCP?
— GIR (2010): work in the same direction
2 Financial and real hedging:
— Without liquidity frictions, financial hedging has no effect onmarginal cost and pricing
— Our mechanism can be viewed as ‘real hedging’: offsettingmovements in marginal costs
— We find little effects of switching source countries in responseto exchange rate
24 / 23
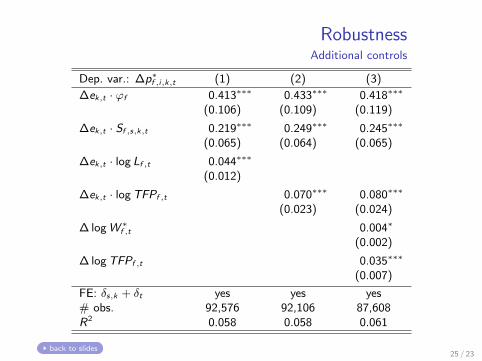
RobustnessAdditional controls
Dep. var.: ∆p∗f ,i,k,t (1) (2) (3)
∆ek,t · ϕf 0.413∗∗∗ 0.433∗∗∗ 0.418∗∗∗
(0.106) (0.109) (0.119)
∆ek,t · Sf ,s,k,t 0.219∗∗∗ 0.249∗∗∗ 0.245∗∗∗
(0.065) (0.064) (0.065)
∆ek,t · log Lf ,t 0.044∗∗∗
(0.012)
∆ek,t · logTFPf ,t 0.070∗∗∗ 0.080∗∗∗
(0.023) (0.024)
∆ logW ∗f ,t 0.004∗
(0.002)
∆ logTFPf ,t 0.035∗∗∗
(0.007)
FE: δs,k + δt yes yes yes# obs. 92,576 92,106 87,608R2 0.058 0.058 0.061
back to slides25 / 23

RobustnessAlternative samples
Destinations All firms Dropping Productsall w/out only including intra-firm all HS 4-digit
countries US US wholesalers trade products major major*Dep. var.: ∆p∗f ,i,k,t (1) (2) (3) (4) (5) (6) (7) (8)
∆ek,t −0.011 0.034 0.184∗∗ 0.094∗∗∗ 0.070∗∗ 0.062∗∗ 0.102∗∗ 0.090∗∗
(0.016) (0.035) (0.062) (0.028) (0.033) (0.027) (0.042) (0.045)
∆ek,t · ϕf 0.263∗∗∗ 0.438∗∗∗ 0.652∗ 0.335∗∗∗ 0.479∗∗∗ 0.587∗∗∗ 0.400∗∗ 0.505∗∗∗
(0.064) (0.122) (0.385) (0.079) (0.120) (0.107) (0.175) (0.165)
∆ek,t · Sf ,s,k,t 0.097∗∗∗ 0.292∗∗∗ 0.312∗∗∗ 0.162∗∗∗ 0.211∗∗∗ 0.224∗∗∗ 0.195∗∗∗ 0.198∗∗
(0.029) (0.062) (0.110) (0.057) (0.071) (0.051) (0.070) (0.087)
Fixed Effects:δs,k + δt yes yes no yes yes yes yes yesδs no no yes no no no no no
# countries 55 11 1 12 12 12 12 12# obs. 218,879 82,438 10,957 158,804 79,461 143,912 62,679 53,037
R2 0.077 0.058 0.055 0.041 0.062 0.043 0.057 0.060
back to slides
26 / 23
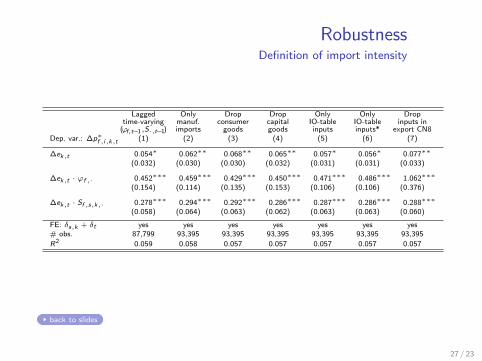
RobustnessDefinition of import intensity
Lagged Only Drop Drop Only Only Droptime-varying manuf. consumer capital IO-table IO-table inputs in
(ϕf,t−1,S·,t−1) imports goods goods inputs inputs* export CN8Dep. var.: ∆p∗f ,i,k,t (1) (2) (3) (4) (5) (6) (7)
∆ek,t 0.054∗ 0.062∗∗ 0.068∗∗ 0.065∗∗ 0.057∗ 0.056∗ 0.077∗∗
(0.032) (0.030) (0.030) (0.032) (0.031) (0.031) (0.033)
∆ek,t · ϕf ,· 0.452∗∗∗ 0.459∗∗∗ 0.429∗∗∗ 0.450∗∗∗ 0.471∗∗∗ 0.486∗∗∗ 1.062∗∗∗
(0.154) (0.114) (0.135) (0.153) (0.106) (0.106) (0.376)
∆ek,t · Sf ,s,k,· 0.278∗∗∗ 0.294∗∗∗ 0.292∗∗∗ 0.286∗∗∗ 0.287∗∗∗ 0.286∗∗∗ 0.288∗∗∗
(0.058) (0.064) (0.063) (0.062) (0.063) (0.063) (0.060)
FE: δs,k + δt yes yes yes yes yes yes yes# obs. 87,799 93,395 93,395 93,395 93,395 93,395 93,395
R2 0.059 0.058 0.057 0.057 0.057 0.057 0.057
back to slides
27 / 23
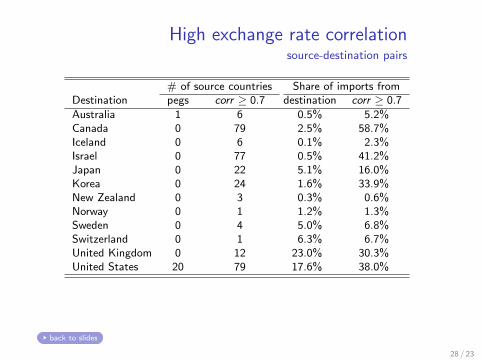
High exchange rate correlationsource-destination pairs
# of source countries Share of imports fromDestination pegs corr ≥ 0.7 destination corr ≥ 0.7
Australia 1 6 0.5% 5.2%Canada 0 79 2.5% 58.7%Iceland 0 6 0.1% 2.3%Israel 0 77 0.5% 41.2%Japan 0 22 5.1% 16.0%Korea 0 24 1.6% 33.9%New Zealand 0 3 0.3% 0.6%Norway 0 1 1.2% 1.3%Sweden 0 4 5.0% 6.8%Switzerland 0 1 6.3% 6.7%United Kingdom 0 12 23.0% 30.3%United States 20 79 17.6% 38.0%
back to slides
28 / 23
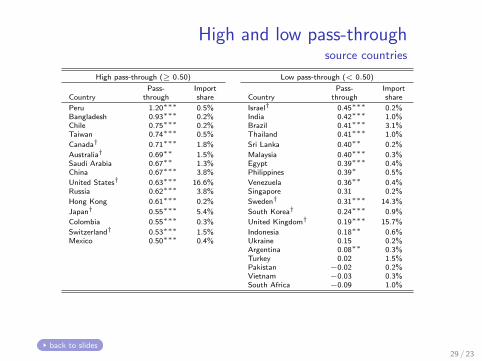
High and low pass-throughsource countries
High pass-through (≥ 0.50) Low pass-through (< 0.50)
Pass- Import Pass- ImportCountry through share Country through share
Peru 1.20∗∗∗ 0.5% Israel† 0.45∗∗∗ 0.2%Bangladesh 0.93∗∗∗ 0.2% India 0.42∗∗∗ 1.0%Chile 0.75∗∗∗ 0.2% Brazil 0.41∗∗∗ 3.1%Taiwan 0.74∗∗∗ 0.5% Thailand 0.41∗∗∗ 1.0%
Canada† 0.71∗∗∗ 1.8% Sri Lanka 0.40∗∗ 0.2%
Australia† 0.69∗∗ 1.5% Malaysia 0.40∗∗∗ 0.3%Saudi Arabia 0.67∗∗ 1.3% Egypt 0.39∗∗∗ 0.4%China 0.67∗∗∗ 3.8% Philippines 0.39∗ 0.5%
United States† 0.63∗∗∗ 16.6% Venezuela 0.36∗∗ 0.4%Russia 0.62∗∗∗ 3.8% Singapore 0.31 0.2%
Hong Kong 0.61∗∗∗ 0.2% Sweden† 0.31∗∗∗ 14.3%
Japan† 0.55∗∗∗ 5.4% South Korea† 0.24∗∗∗ 0.9%
Colombia 0.55∗∗∗ 0.3% United Kingdom† 0.19∗∗∗ 15.7%
Switzerland† 0.53∗∗∗ 1.5% Indonesia 0.18∗∗ 0.6%Mexico 0.50∗∗∗ 0.4% Ukraine 0.15 0.2%
Argentina 0.08∗∗ 0.3%Turkey 0.02 1.5%Pakistan −0.02 0.2%Vietnam −0.03 0.3%South Africa −0.09 1.0%
back to slides29 / 23
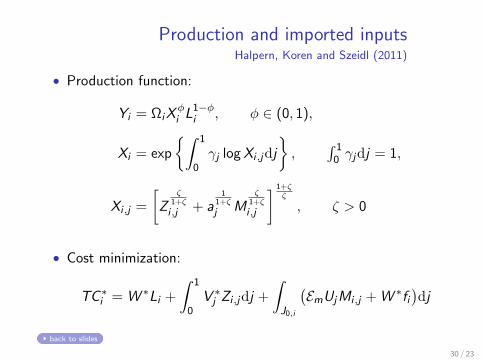
Production and imported inputsHalpern, Koren and Szeidl (2011)
• Production function:
Yi = ΩiXφi L1−φ
i , φ ∈ (0, 1),
Xi = exp
∫ 1
0γj log Xi ,jdj
,
∫ 10 γjdj = 1,
Xi ,j =
[Z
ζ1+ζ
i ,j + a1
1+ζ
j Mζ
1+ζ
i ,j
] 1+ζζ
, ζ > 0
• Cost minimization:
TC ∗i = W ∗Li +
∫ 1
0V ∗j Zi ,jdj +
∫J0,i
(EmUjMi ,j + W ∗fi
)dj
back to slides
30 / 23
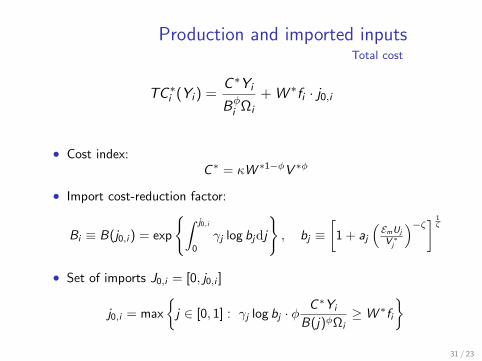
Production and imported inputsTotal cost
TC ∗i (Yi ) =C ∗Yi
Bφi Ωi
+ W ∗fi · j0,i
• Cost index:C∗ = κW ∗1−φV ∗φ
• Import cost-reduction factor:
Bi ≡ B(j0,i ) = exp
∫ j0,i
0
γj log bjdj
, bj ≡
[1 + aj
(EmUj
V ∗j
)−ζ] 1ζ
• Set of imports J0,i = [0, j0,i ]
j0,i = max
j ∈ [0, 1] : γj log bj · φ
C∗Yi
B(j)φΩi≥W ∗fi
31 / 23
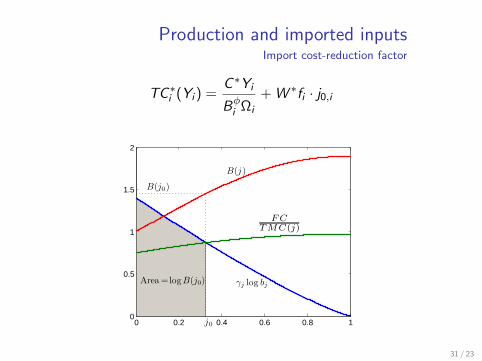
Production and imported inputsImport cost-reduction factor
TC ∗i (Yi ) =C ∗Yi
Bφi Ωi
+ W ∗fi · j0,i
0 0.2 0.4 0.6 0.8 10
0.5
1
1.5
2
j0
B(j )
Area =logB(j0) γj log bj
B(j0)
FCTMC(j)
31 / 23
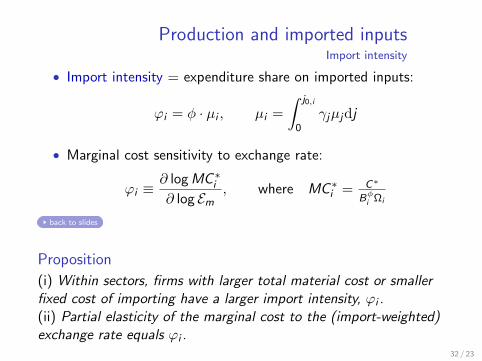
Production and imported inputsImport intensity
• Import intensity = expenditure share on imported inputs:
ϕi = φ · µi , µi =
∫ j0,i
0γjµjdj
• Marginal cost sensitivity to exchange rate:
ϕi ≡∂ log MC ∗i∂ log Em
, where MC ∗i = C∗
Bφi Ωi
back to slides
Proposition
(i) Within sectors, firms with larger total material cost or smallerfixed cost of importing have a larger import intensity, ϕi .(ii) Partial elasticity of the marginal cost to the (import-weighted)exchange rate equals ϕi .
32 / 23

Equilibrium relationships
• Problem of the firm:
maxYi ,Pk,i ,Qk,ik
∑k∈KiEkPk,iQk,i − TC ∗(Yi )
s.t. demand for Qk,i , production of Yi , and Yi =
∑k Qk,i
• Optimal producer price for market k:
P∗k,i =σk,i
σk,i − 1MC ∗i =Mk,i
C ∗
Bφi Ωi
— Consider two firms i and i ′:
Sk,i
Sk,i ′=
ξk,iξk,i ′
(Mk,i
Mk,i ′
Bφi ′Ωi ′
Bφi Ωi
)1−ρ
33 / 23
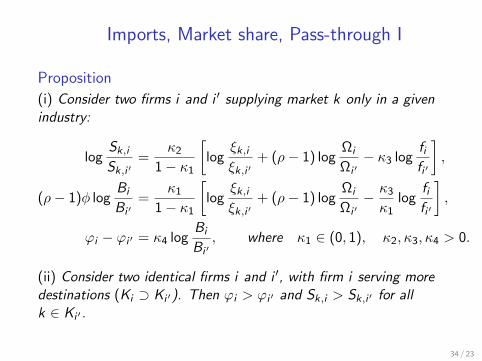
Imports, Market share, Pass-through I
Proposition
(i) Consider two firms i and i ′ supplying market k only in a givenindustry:
logSk,i
Sk,i ′=
κ2
1− κ1
[log
ξk,iξk,i ′
+ (ρ− 1) logΩi
Ωi ′− κ3 log
fifi ′
],
(ρ− 1)φ logBi
Bi ′=
κ1
1− κ1
[log
ξk,iξk,i ′
+ (ρ− 1) logΩi
Ωi ′− κ3
κ1log
fifi ′
],
ϕi − ϕi ′ = κ4 logBi
Bi ′, where κ1 ∈ (0, 1), κ2, κ3, κ4 > 0.
(ii) Consider two identical firms i and i ′, with firm i serving moredestinations (Ki ⊃ Ki ′). Then ϕi > ϕi ′ and Sk,i > Sk,i ′ for allk ∈ Ki ′ .
34 / 23
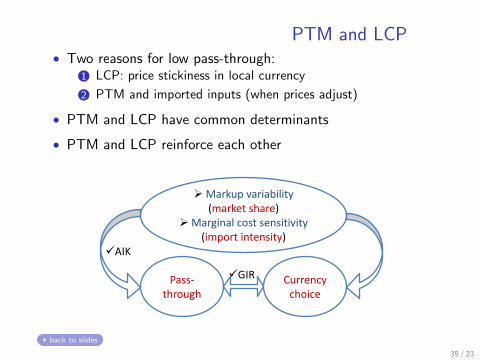
PTM and LCP• Two reasons for low pass-through:
1 LCP: price stickiness in local currency
2 PTM and imported inputs (when prices adjust)
• PTM and LCP have common determinants
• PTM and LCP reinforce each other
Markup variability (market share)
Marginal cost sensitivity (import intensity)
Pass-through
Currency choice
AIK
GIR
back to slides
35 / 23