impression technique for the assessment of oedema
TRANSCRIPT
1 I n t r o d u c t i o n OEDEMA IS A condition in which abnormal quantities of body fluids are gathered in the extra- and/or intra-cellular spaces. The symptom is swelling of the tissue. Oedema can have a wide variety of aetiology, for example, heart and kidney failure, thrombosis and disturbed lymph circula- tion. Surface measurements and volumetry are common methods for the assessment of oedema in the extremities (SWEDBORG, 1977).
In the beginning of this century SCHADE (1912) measured the elasticity of oedema by recording tissue relaxation time after impression. SCHWARTZ 0916) showed that it was pos- sible to measure the degree of oedema by impressing the skin with various weights attached to a piston and measur- ing the impression depth. The instrument thereby con- structed was called the elastometer and was based on assumptions about the pitting phenomenon. This pheno- menon, i.e. the increase of hydraulic conductivity in sub- cutaneous oedemaous tissue compared to normal tissue, has been described by several authors (GuYTON et al., 1966; AUKLAND and NICOLAYSEN, 1981; BOGEN, 1987). Correspondence should be addressed to Dr. Lindahl
First received 24th May and in final form 5th December 1990
�9 IFMBE: 1991
Medical & Biological Engineering & Computing
Recently MRIDHA and (~DMAN (1986) described a method for the assessment of subcutaneous oedema based on the same pitting phenomenon. They have developed a noninvasive technique that measures the resistive force of the tissue under compression. It is based on the instantan- eous impression of an impression head with a known dia- meter to a predefined depth into cutaneous tissue. The force measured is suggested to be related to the mobility and volume of interstitial fluid translocated due to com- pression. They have also studied the effect of pneumatic compression treatment of postmastectomy lymphoedema in the arm of a subject with this technique (MmDnA and C)DMAN, 1989).
In the present study we have further developed and evaluated this method, which we call the 'impression tech- nique', with the aim of improving the accuracy and hand- ling.
2 I n s t r u m e n t a t i o n The principle of the impression measurement is based
on the instantaneous impression of the tissue (skin) to a predefined depth. The impression will then be sustained and the force required to do this is measured. A stable stand is therefore necessary to hold the impression head
November 1991 591
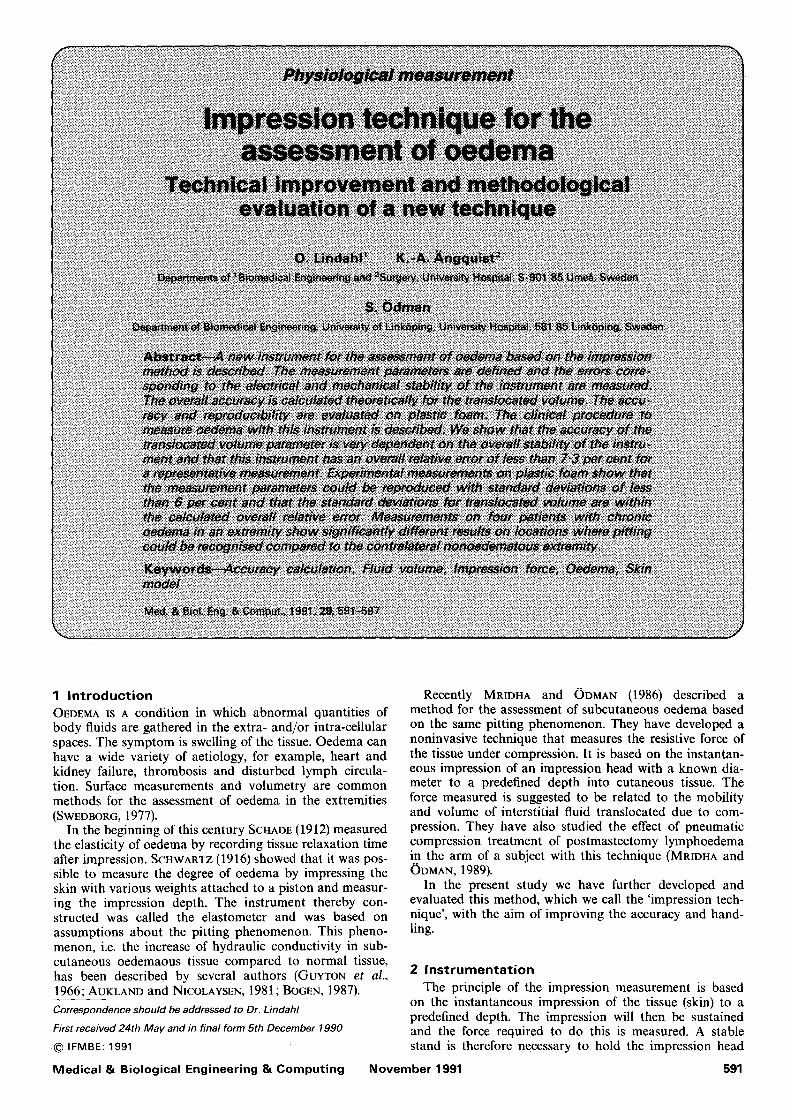
with its force sensor in a fixed position. The impression head is moved by a stepper motor with low drift electronic regulation.
The oedema test instrument software runs on an IBM personal computer system (PC) or a compatible system and the hardware is composed of a stand, specially con-
is shown in Fig. la and in Fig. lb the stepper motor and pressure head is pictured. The hardware is constructed to satisfy the international safety standard IEC-601.
The stepper motor and the force transducer are con- nected to a D/A convertor and an A/D convertor, respec- tively (PC-30 Boston Technology, England).
Fig. 1
structed for high stability, a force transducer (Showa MR05K, Japan), a stepper motor (Airpax Co., L92421P2, USA) and a main electronic unit for both the force trans- ducer and the stepper motor. A photograph of the device
Oedema measurement system (a) overview of the instrumentation; (b) the pressure head
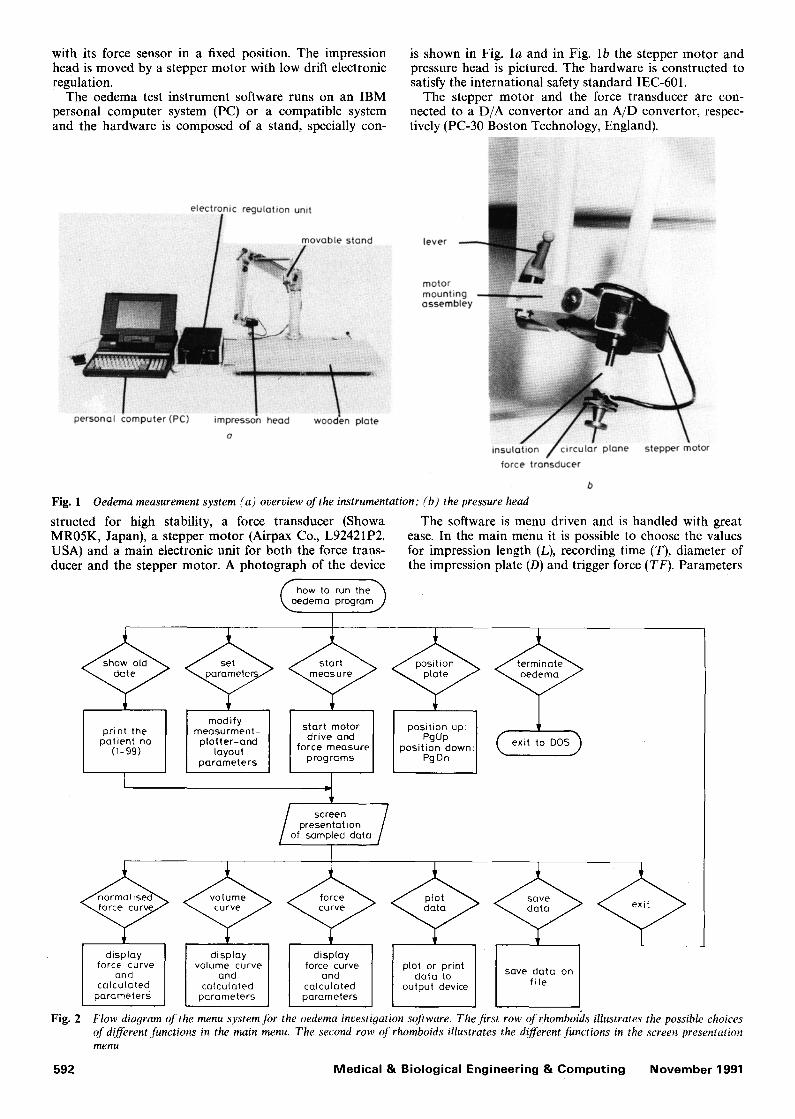
The software is menu driven and is handled with great ease. In the main menu it is possible to choose the values for impression length (L), recording time (T), diameter of the impression plate (D) and trigger force (TF). Parameters
modify measurment- plotter-and
layout parameters
print the patient no
(1-99)
(oe, hOw to run the h dema programj
presentation of sampled data
position up: ] PgUp
position down: PgDn ( e x i t to DOS)
display force curve
and calculated
parameters
Fig. 2
display volume curve
and calculated
parameters
display force curve
and calculated parameters
plot or print save data on data to
output device fi le
Flow diagram of the menu system for the oedema investigation software. The first row of rhomboids illustrates the possible choices of different functions in the main menu. The second row of rhomboids illustrates the d!fferent functions in the screen presentation menu
592 Medical & Biological Engineering & Computing November 1991
L, D and T are all used in the computat ion of the trans- located volume, according to eqn. 4 below. Patient identi- cation parameters are also registered in the main menu. Furthermore, it is possible to specify the parameters for a specific printing or plotting device and a special function is also available for positioning the pressure head manually up or down. The menu functions are displayed in Fig. 2.
In the presentation mode the force curve F(t) and the preset values are displayed. Several additional parameters are computed and displayed on the screen. These are F(0), F(encO, F(max), Int and V(end). F(O) is the mean of ten individual samples of the maximum force, here called the initial force, in Newtons; F(end) is the last sampled value of the force curve in Newtons; F(max) is the maximum value of the sampled force curve in Newtons; Int is the percentage of the area above the normalised force curve F,(t):
Int = 100 • ((1 - F,(t)) dt)/T (1)
V(end) is the translocated volume at the end of the regis- tration time (t = T) calculated as
V(end) = (1 - F.(T))Tr(D/2)2L (2)
With the presentation menu it is also possible to view the normalised force curve
F.(t) = F(t)/F(max) (3)
and the translocated volume curve
V(t) = (1 -- F.(t))n(D/2)2L (4)
Eqns. 3 and 4 were suggested by MRIDHA and (~DMAN (1986).
All data can be saved on a floppy disk or on a hard disk in ASCII format and viewed at a later occasion.
3 M e a s u r e m e n t considerat ions and results The total electronic drift of the measurement system is
of great importance in obtaining opt imum measurements. When measuring, the pressure head is moved towards the skin surface, controlled by a stepper motor. When the pressure head touches the skin surface and the force trans- ducer senses a force exceeding the preset trigger force (usually 10, 50 or 100raN), the force recording begins and the pressure head is moved with high speed (8.5 m m s - x ) into the skin to a specific preset depth (usually 2 or 4mm).
The accuracy of preset trigger force is limited by the A/D convertor which has 12 bits, i.e. 4096 levels. With the A/D convertor set to 10V swing, and the amplifier set to give 1 V - N - ~, we obtain a resolution of 2.4 m N b i t - 1
The recording of the force ends after a preset time; usually 20s. (The trigger force, impression depth and recording time can be chosen in the main menu described above.) During the recording, small changes in force due to the translocation of tissue fluid must be detected by the system with a resolution of 2.4inV. Therefore the elec- tronic circuitry was designed for very low drift. A high performance signal conditioning module 2B31J (Analog Devices, Norwood, USA), specially designed for high ac- curacy interface to strain gauge-type transducers, was used. After a warming up period of 15min, a 15min recording on a pen writer ( W + W model 312, Basel, Switzerland) with a calibration weight of 1 N placed on the pressure head was carried out. The voltage drift in the electronics was less than 0-02 mV s-1 and as the amplifier was set for 1 N V -1, the variation was less than 0-02 mN s- 1.
The relationship between the output voltage from the force transducer and the applied force was measured by
Medical & Biological Engineering & Computing
placing calibration weights on the pressure head and measuring the output voltage. Five weights were used, 0-1, 0.5, 1, 2 and 5 N, and the weight to voltage relationship was shown to be linear and had a linear correlation coeffi- cient better than 0.99. Table 1 shows the results.
One other parameter that affects the result is the mech- anical stability of the stand. The position of the pressure
Table 1 Calibration of the pressure head. Theoreti- cal voltage calculated with g = 9.81 m s-2
Theoretical Measured Error Weight voltage voltage voltage
N V V V
0" 1 0"098 0"098 0.000 0"5 0"490 0'490 0.000 1 0-981 0"981 0.000 2 1.962 1"965 + 0'003 5 4'905 4"895 -0"010
head must be variable over a wide range and thus a movable a rm must be used. It must be stable enough to resist the different amounts of force which depend on the stiffness of the skin and the extremity in which the impres- sion is made. The stability of the constructed stand was measured using various forces acting on the stand and with the stand in two positions. To do this a dynamometer (Pesola, Switzerland) was attached to the upper part of the motor and a dial indicator (Mitutoyo, Japan, 0-01-10ram) was placed on the wooden plate in contact with the pres- sure head. Different axial load forces could then be applied to the motor with the dynamometer , and displacements due to instability in the stand could be measured with the dial indicator. Table 2 shows the results. The maximum force used was 5 N and, in the most critical position, which was when the stand was in the most extended position, the stand had a displacement of less than 0.21 m m for 5 N.
The displacement due to the axial looseness of the motor screw axle was measured in the same way as the
Table 2 Vertical displacement of the stand measured between the motor mounting assembly and the patient wooden plate. Critical position is the most extended outmost position of the stand. Middle position, i.e. the most common position, is when the pressure head is posi- tioned at the middle of the wooden plate
Load Displacement of the Displacement of the force critical position middle position
N mm mm
0-1 0"00 0-00 1 0.03 0-01 2 0.08 0.02 5 0.21 0"09
stand displacement but with the force applied to the motor axle. No movement of the dial indicator was detected which means that it moved less than 0.01 m m which could be neglected compared to the displacement of the stand.
3.1. Overall accuracy
The overall accuracy in the measurement of the trans- located volume V(t) can be calculated using eqns. 3 and 4 which gives
V(t) = (I - F(t)/F(max))nD2L/4 (5)
The absolute error AV is given by
AV = I AF(max) OV/dF(max) I + IAF(T) dV/dF(T) I
+ [A DOV/OD[ + [ALOV/c~L[ (6)
according to DOEBLIN (1976). Consider a representative measurement (F(rnax)= 2 N;
F(T = 20s) = 1 N; D = 17mm; L = 4mm) and maximum
November 1991 593

limits for component errors AF(max) = - 0 - 0 1 N , AF(20) = -0 .01 N, AD = 0.01 mm, ALl = 0.03 ram, AL2 = 0.23 mm, where AF(max) and AF(20) are the calcu- lated force error values (IV--- IN) corresponding to the error voltage for 5 N in Table 1. ALl and AL2 are the best case-error (0-01 mm) and the worst case-error (0-21 mm), respectively, according to Table 2, added to the displace- ment error of the stepper motor (0-025 mm) which is half the linear travel per step (0.05 ram) according to the manu- facturer specification (Airpax Co., USA). The partial deriv- atives of eqn. 4 are
~V/~F(max) = F(20)nD2L/4(F(max)) 2 (7)
V/OF(20) = -- ~DZ L/4F(max) (8)
OV/OD = (1 - F(20)/F(max))rc2OL/4 (9)
OV/OL = (1 -- F(20)/F(max))~O2/4 (10)
The contributions of the various sources of error are as follows: OV/OF(max) = 227 al N x ; OV/8F(20) = - 4 5 4 / d N - 1 ; OV/OD = 267 x 102/rim-X; OV/OL = 114 x 10a/Am -1. Thus, the error limit of L in relation to the position of the stand provides the major contribution to the absolute error.
By substituting eqns. 7-10 into eqn. 6 and inserting the proposed values, we get AV1 = 10.5/d for the middle posi- tion and AV2 = 33-3/d for the most extended position of the stand.
Inserting the measured values considered into eqn. 5 gives a calculated value of V(end) of 454 al and hence we can calculate the relative error E,:
E,x = (AV1/V(end))lO0 = 2.3 per cent (middle position) (11)
Er2 = (AV2/V(end))lO0 = 7-3 per cent (most extended position) (12)
However, in the clinical situation F(max) seldom reaches 5 N and if we instead assume a limit for F(max) of 2 N, Table 1 gives a component error of 0.003 N, which could
1.0
E 0.75 D
-~ 0'5 tD
5 u o
-~ 0 " 2 5 t- O
0
t'0
u 0-75 o
"(D o.5 O E
0-25 c
Fig. 3
f
' ' ' ' 2'0 4 8 12 16
t ime ,s
O
i I A L 2'0 4 8 12 16
t ime, s
b
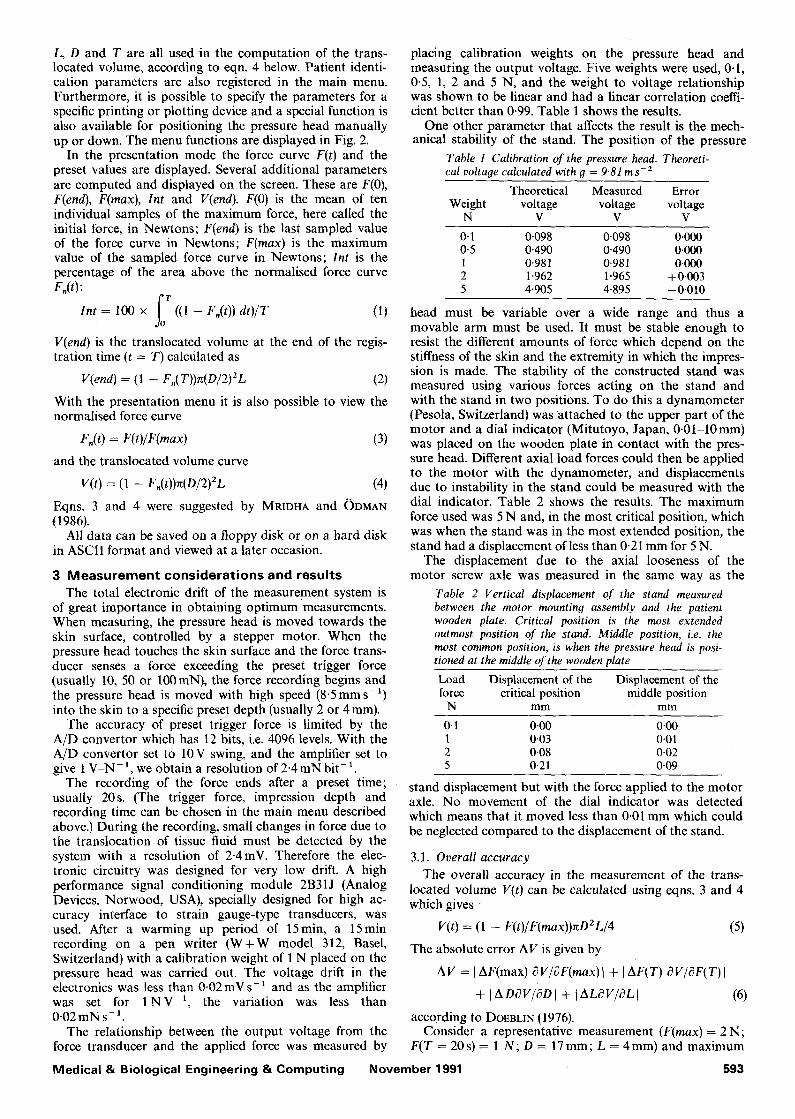
Recording of (a) translocated volume V( t ) ; (b) normal- ised force F,( t ) on foam plastic. The preset parameters are L = 4ram, TF = lOOmN and D = 17ram. The parameters are calculated to be F(O) = 0.45 N, V(end) = 0.28 ml and Int = 26 per cent
be used as the error limit for F(max) and F(20) in the calculations above. This assumption gives AV1 = 5-7/A and AV2 = 28.5/d. The corresponding relative errors are E,x = 1.3 per cent and E,2 --- 6.3 per cent.
These calculations show that in the normal (middle) position of the stand it is possible to measure the trans- located volume with a relative error less than 1.3 per cent if F(max) is less than 2 N. If, however, the stand is in the most extended position it is more appropriate to assume a relative error of 7-3 per cent.
It should be noted that the shape of the circular plate that is impressed in the tissue is of interest for the accuracy of the measurement. The translocated volume is calculated with the assumption that the impressed tissue volume is that of a cylinder. This is only a rough simplification. In reality the boundary between impressed tissue and non- impressed tissue is curved and not perpendicular to the tissue surface which should be the case if the cylinder approximation is supposed to be an exact one. Further- more, the curvature is different for different types of tissue.
3.2 Experimental evaluation o f accuracy and reproducibility
To evaluate the accuracy and reproducibility in an experimental situation, we chose to use a simple model of human skin consisting of plastic foam. The recordings in Fig. 3 show that plastic foam of a certain quality reacts to an impression in a similar way to human skin (see with
1.0
0.75~~.. R
0-5 U3
O E o E
0'25 OE
0-75
o ;2 2'o t ime, s
0
E 2
~D ID
5 o
Fig. 4
o5/ 0.25
0 4
OE
i i 8 12 1'6 2'0
t i r n e , s
b
Recordings ott a patient with oedema. "OE' indicates the oedematous arm and "R" the reference arm. (a) normalised force F, ; (b) translocated volume V(t) . The parameters are F ( O ) = 2"66N, V (end)= 0"58ml and Int = 75 per cent for OE, and F ( O ) = 1.24N, V (end)= 0"3Oral and Int = 35 per cent for R.
5 9 4 M e d i c a l & B i o l o g i c a l E n g i n e e r i n g & C o m p u t i n g N o v e m b e r 1991
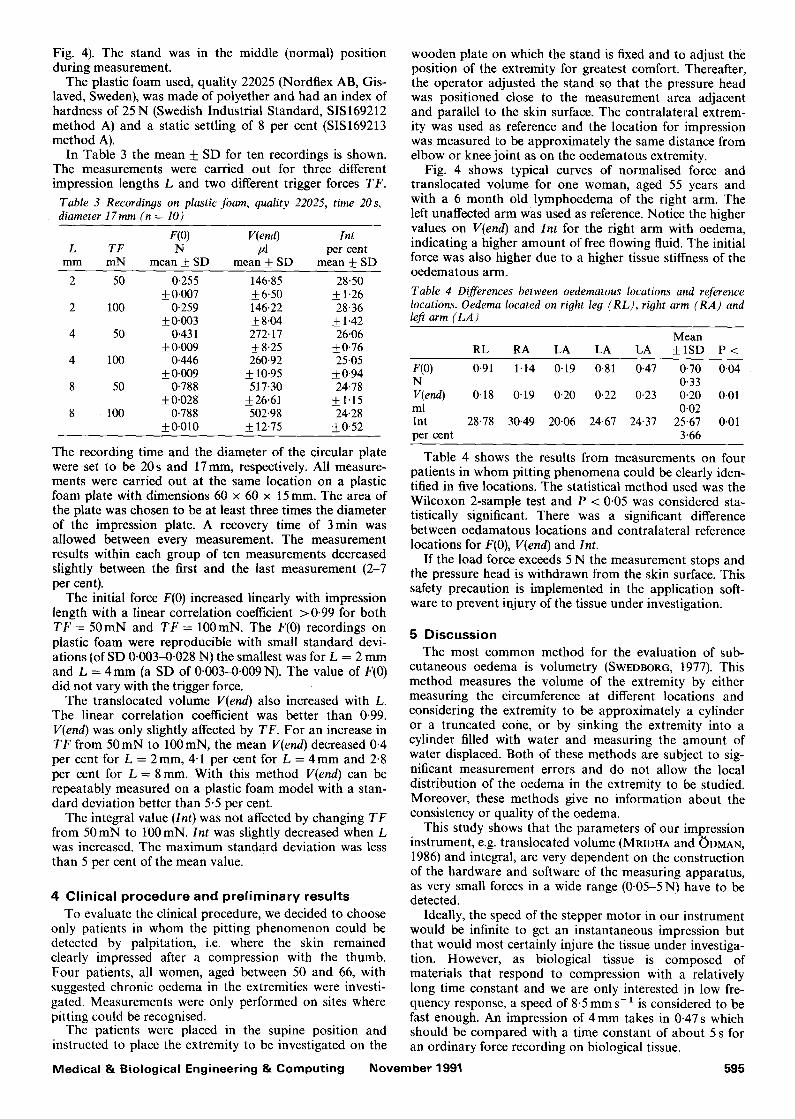
Fig. 4). The stand was in the middle (normal) position during measurement.
The plastic foam used, quality 22025 (Nordflex AB, Gis- laved, Sweden), was made of polyether and had an index of hardness of 25N (Swedish Industrial Standard, SIS169212 method A) and a static settling of 8 per cent (SIS169213 method A).
In Table 3 the mean + SD for ten recordings is shown. The measurements were carried out for three different impression lengths L and two different trigger forces TF.
Table 3 Recordings on plastic foam, quality 22025, time 20 s, diameter 17ram (n = 10)
F(O) V(end) lnt L TF N pl per cent
mm mN mean • SD mean • SD mean __+ SD
2 50 0-255 146.85 28.50 +0.007 +6-50 • 1-26
2 100 0-259 146.22 28.36 + 0.003 • 8-04 • 1.42
4 50 0.431 272-17 26.06 • + 8.25 +0.76
4 100 0.446 260-92 25-05 +0-009 _• 10.95 •
8 50 0-788 517.30 24.78 +0.028 __+26.61 • 1.15
8 100 0-788 502.98 24.28 _• + 12.75 __+0.52
The recording time and the diameter of the circular plate were set to be 20s and 17ram, respectively. All measure- ments were carried out at the same location on a plastic foam plate with dimensions 60 x 60 x 15 ram. The area of the plate was chosen to be at least three times the diameter of the impression plate. A recovery time of 3 min was allowed between every measurement. The measurement results within each group of ten measurements decreased slightly between the first and the last measurement (2-7 per cent).
The initial force F(0) increased linearly with impression length with a linear correlation coefficient >0.99 for both T F = 50mN and T F = 100raN. The F(0) recordings on plastic foam were reproducible with small standard devi- ations (of SD 0.003-0.028 N) the smallest was for L = 2 m m and L = 4 m m (a SD of 0.003-0.009 N). The value of F(0) did not vary with the trigger force.
The translocated volume V(end) also increased with L. The linear correlation coefficient was better than 0.99. V(end) was only slightly affected by TF. For an increase in T F from 5 0 m N to 100mN, the mean V(end) decreased 0.4 per cent for L = 2mm, 4.1 per cent for L = 4 m m and 2.8 per cent for L = 8 mm. With this method V(end) can be repeatably measured on a plastic foam model with a stan- dard deviation better than 5.5 per cent.
The integral value (Int) was not affected by changing T F from 50mN to 100mN. Int was slightly decreased when L was increased. The maximum standard deviation was less than 5 per cent of the mean value.
4 Clinical procedure and prel iminary results To evaluate the clinical procedure, we decided to choose
only patients in whom the pitting phenomenon could be detected by palpitation, i.e. where the skin remained clearly impressed after a compression with the thumb. Four patients, all women, aged between 50 and 66, with suggested chronic oedema in the extremities were investi- gated. Measurements were only performed on sites where pitting could be recognised.
The patients were placed in the supine position and instructed to place the extremity to be investigated on the
Medical & Biological Engineering & Computing
wooden plate on which the stand is fixed and to adjust the position of the extremity for greatest comfort. Thereafter, the operator adjusted the stand so that the pressure head was positioned close to the measurement area adjacent and parallel to the skin surface. The contralateral extrem- ity was used as reference and the location for impression was measured to be approximately the same distance from elbow or knee joint as on the oedematous extremity.
Fig. 4 shows typical curves of normalised force and translocated volume for one woman, aged 55 years and with a 6 month old lymphoedema of the right arm. The left unaffected arm was used as reference. Notice the higher values on V(end) and Int for the right arm with oedema, indicating a higher amount of free flowing fluid. The initial force was also higher due to a higher tissue stiffness of the oedematous arm.
Table 4 Differences between oedematous locations and reference locations. Oedema located on right leg (RL), right arm (RA) and left arm (LA)
Mean RL RA LA LA LA • P <
F(0) 0.91 1.14 0"19 0.81 0.47 0-70 0"04 N 0"33 V(end) 0"18 0-19 0-20 0-22 0-23 0"20 0'01 ml 0-02 Int 28.78 30.49 20"06 24.67 24.37 25-67 0-01 per cent 3"66
Table 4 shows the results from measurements on four patients in whom pitting phenomena could be clearly iden- tified in five locations. The statistical method used was the Wilcoxon 2-sample test and P < 0.05 was considered sta- tistically significant. There was a significant difference between oedamatous locations and contralateral reference locations for F(0), V(end) and Int.
If the load force exceeds 5 N the measurement stops and the pressure head is withdrawn from the skin surface. This safety precaution is implemented in the application soft- ware to prevent injury of the tissue under investigation.
5 Discussion The most common method for the evaluation of sub-
cutaneous oedema is volumetry (SWEDBOR6, 1977). This method measures the volume of the extremity by either measuring the circumference at different locations and considering the extremity to be approximately a cylinder or a truncated coiae, or by sinking the extremity into a cylinder filled with water and measuring the amount of water displaced. Both of these methods are subject to sig- nificant measurement errors and do not allow the local distribution of the oedema in the extremity to be studied. Moreover, these methods give no information about the consistency or quality of the oedema.
This study shows that the parameters of our impression instrument, e.g. translocated volume (MRIDHA and ODMAN, 1986) and integral, are very dependent on the construction of the hardware and software of the measuring apparatus, as very small forces in a wide range (0.05-5 N) have to be detected.
Ideally, the speed of the stepper motor in our instrument would be infinite to get an instantaneous impression but that would most certainly injure the tissue under investiga- tion. However, as biological tissue is composed of materials that respond to compression with a relatively long time constant and we are only interested in low fre- quency response, a speed of 8-5 m m s - ~ is considered to be fast enough. An impression of 4 mm takes in 0-47 s which should be compared with a time constant of about 5 s for an ordinary force recording on biological tissue.
November 1991 595

During a normal 20s impression measurement, the measured voltage drift (0-02mNs 1) contributes an error of less than 0 .4mN which is negligible compared to the reso lu t ion of the A/D converter (2.4mV = 2.4mN). In other words, the voltage drift in the described instrument could be considered to be small enough to be excluded from the accuracy calculation.
It is of great importance that the circular plate on the pressure head is adjusted so it is parallel to the skin surface. This adjustment is easily carried out as the motor and pressure head are fixed on a special construction which allows three dimensional adjustments to be made (Fig. 1).
It can be stated that very small movements in the stand, due to instability, and nonlinearity in the calibration of F(t), due to a combination of errors in the force transducer and in amplification, create measureable errors in the volume calculation. Considering the accuracy calculation, an increase in component error in L from 0.03 mm to 0.23 m m increases the overall relative error by 5 per cent, or in absolute terms from 10.5/A to 33.3/A. The com- ponent error in F(t) contributes less to the overall relative error and, from the accuracy calculation again, it can be seen that a decrease in component error from 0-01 N to 0.003 N corresponds to a decrease of 1 per cent in overall maximum relative error or in absolute terms from 33.3/d to 28-5ltl. The component error in D contributes very little to the overall error because of the small dimensions of the circular plate and the high precision in manufacturing.
The overall accuracy calculation shows that the maximum absolute error of the system for the measure- ment of fluid translocation is when the stand is in the most extended position and when F(max) is 5 N (AF = 33.3/A and Er = 7.3 per cent). In the experiments with plastic foam, we can roughly compare the standard deviation with the theoretical overall error E,. If the mean and standard deviation (SD) for V(end) in Table 3, where L = 4 mm and TF = 100 mN, is taken as an example, we obtain an esti- mated overall relative error of
Ere = I SD/meanl x 100
= 10.95/260.92 = 4-2 per cent (13)
which falls within the maximum theoretical error E, = 7"3 per cent.
When F(max) was less than 2 N, as in the plastic foam model (see Table 3), we have calculated that the theoretical relative error was 6.3 per cent, which was also greater than E r e �9
Taking the most extended position of the stand as the basis for maximum component error in impression length L (0-23mm), the theoretical relative overall error for V(end) holds for our experimental setup with plastic foam.
On the other hand, we have shown theoretically that in the middle position of the stand it was possible to measure translocated volume with overall relative errors E r = 2.3 per cent (F(max)=5N) and E ~ = l . 3 per cent (F(max) = 2 N). These proposed errors do not exceed the estimated overall relative error in eqn. 13, which would be expected as the plastic foam experiments were performed with the stand in the middle position. This is mainly because we have neglected random errors in our theoreti- cal calculation of overall accuracy. Indeed, random errors in, for example, the parallel adjustment of the pressure head to the plastic foam surface, the instability of the motor screw axle and the settling of the plastic foam con- tribute to the standard deviations in the plastic foam model.
The experiments on plastic foam do however show that
this material is useful for evaluating system performance. In comparison with measurements on gel with different water content (MRIDHA and ODMAN, 1986; 1985) plastic foam is easier to handle and more independent of environ- mental conditions (humidity, temperature etc.). Impression lengths of 2, 4 and 8 mm gave quite acceptable standard deviations ( < 6 per cent) in all parameters. Trigger forces of 50 or 100mN seemed not to interfere with the results which was probably due to the mechanical properties of plastic foam being different to biological materials. One major difference is that in biological tissues as in skin there are compartments of different mechanical properties such as elastic tissue fibres, liquids of different viscosity etc. (MRIDHA and ODMAN, 1986; FINLAY, 1978; GUYTON et al. 1971) whereas in plastic foam there are elastic plastic fibres and air.
It must be emphasised that the impression method mea- sures the translocated volume using a cylinder approx- imation (MRIDHA and (~)DMAN, 1986), which means that the measured volume in biological tissue is always less than the actual value, as stated earlier in the present paper. This means that the translocated volume value V(t) should be used with great care, especially as the curvature of the tissue surface at the boundary between impressed and non- impressed tissue probably differs between different meas- urement sites and thus the impressed tissue volume is not equal from site to site. Moreover, the tissue surface is rarely flat before impression, which means that the total area of the pressure head (the circular plate) is not in contact with the tissue when the trigger force is sensed.
The application of the impression technique in this study shows that the parameters F(0), Int, and V(end) were all greater at locations where pitting could be clearly rec- ognised compared to the contralateral reference location. This indicates that the instrument is able to find the local distribution of mobile fluid in tissue, which is also in accordance to the findings of MRTDHA and ODMAN (1986; 1989). Furthermore, it seems reasonable to suggest that the parameters F(0) and Int contain information about the mechanical properties of swollen tissue.
6 Conc lus ion The reliability of the impression technique is clearly
dependent on the very stable mechanical and electrical design of the measuring device. The device described here satisfies these requirements with a maximum overall rela- tive error of 7-3 per cent in a representative measurement and is quite acceptable for biological experiments on oedematous tissue. To fully understand the clinical value of the proposed parameters, further research must be carried out.
Acknowledgments--We thank Tomas B~icklund, Lars Granst6m, Stefan Karlsson and M~rten S6derberg at the Department of Biomedical Engineering for their skilful technical assistance and Ronny Sundstr6m, Norflex Sike~t AB, Sweden, for providing us with plastic foam. The study was supported by the National Swedish Board for Technical Development (grant 88-04503).
References AUKLAND, K. and NICOLAYSEN, G. (1981) Interstitial fluid
volume: local regulatory mechanisms. Physiol. Rev., 61, 556- 643.
BOGEN, D. K. (1987) Strain energy descriptions of biological swelling I: Single fluid compartment models. J. Biomech. Eng., 109, 252-262.
DOEBLIN, E. O. (1976) Measurement systems. McGraw Hill Inc., 38-209.
FINLAY, J. B. (1978) Thixotropy in human skin. J. Biomech., II, 333-342.
596 Medical & Biological Engineering & Computing November 1991
GUYTON, A. C., SCHEEL, K. and MURPHREE, D. (1966) Interstitial fluid pressure: III Its effect on resistance to tissue fluid mobil- ity. Circ. Res., 19, 412-419.
GUYTON, A. C., GRANGER, H. J. and TAYLOR, A. E. (1971) Inter- stitial fluid pressure. Physiol. Rev., 51, (3), 527-563.
MRIDHA, M. and Or)MAN, S. (1985) Characterization of subcuta- neous edema by mechanical impedance measurements. J. Invest. Dermat., 85, 575-578.
MRIDHA, M. and Or)MAN, S, (1986) Noninvasive method for the assessment of subcutaneous oedema. Med. & Biol. En O. & Comput., 24, 393-398.
MRIDHA, M. and ODMAN, S. (1989) Fluid translocation measure- ment. Scand. J. Rehab. Med., 21, 63-69.
SCHADE, H. (1912) Untersuchungen zur Organfunction des Bin- desgewebes. Zeitschr. f exp. Path. u. Therap., 11, 369-399.
SCHWARTZ, A. B. (1916) The clinical study of edema by means of the elastometer. Arch. Internal. Med., 17, 393-403.
SWEDBORG, I. (1977) Voluminometric estimation of the degree of lymphedema and its therapy by pneumatic compression. Scand. J. Rehab., 9, 131.
Authors" biographies Olof Lindahl was born in Ornsk61dsvik, Sweden, in 1955. He received his M.Sc. degree in Technical Physics and Electronics at the University of Link6ping, Sweden, in 1979. He is working on research in Biomedical Engin- eering at the University hospital in Ume~, Sweden. He is currently the chairman of the Swedish Society for Biomedical Engineering and Medical Physics. His research interest is
in physiological measurement technology and Biomechanical modelling and he is working towards his Ph.D. degree.
Karl-Axel_~ngquist was born in Osby Sweden, in 1943. After studying medicine at Karolinska Institutet, Stockholm, he worked as a surgeon in Ornsk61dsvik, and since 1973 at the uni- versity hospital of Ume~. He is today working at the vascular surgery unit as assistant pro- fessor. In 1978 he obtained his degree based on the thesis 'Muscle fiber fine structure'.
Svante Odman was born in Gothenburg, Sweden, in 1948. He received his M.Sc. degree in Biomedical Engineering in 1975 at the Uni- versity of Link6ping, Sweden. In 1980 he received his Ph.D. and in 1985 was appointed assistant professor in Biomedical Engineering at the same University. His main areas of research have been electrodes and electro- chemistry, physiology and mechanical proper-
ties of skin, mierotechnology and biosensors. Since 1985 he has been working at the National Defence Research Establishment, Sweden, and is at present responsible for the research area of Optoelectronics. He is also Consulting Scientist at the University of Link6ping, Sweden.
Medical & Biological Engineering & Computing November 1991 597