improve hurricane structure monitoring and intensity forecast using npp atms and gcom-w amsr2...
TRANSCRIPT
Improve Hurricane Structure Monitoring and Intensity Forecast Using NPP ATMS and GCOM-W
AMSR2
Fuzhong Weng (PI)NOAA/NESDIS/Center for Satellite Applications and Research
Xiaolei ZouFlorida State University
Vijay Tallapragada and Andrew Collard NOAA/NWS/Environmental Modeling Center
And
STAR/EMC Satellite Data Assimilation Team Members (Ben Zhang, Lin Lin, Tong Zhu, Greg Grawsowski, and In-Hyuk Kwon)
GOSE-R AWG Annual Meeting June 23-26, 2008<Soundings> AWG Annual 2
Proposed Tasks
1. Advanced Microwave Sounder Technology (ATMS) Backus-Gilbert Re-sampling
2. ATMS Algorithm for Hurricane Warm Core Monitoring
3. AMSR2 Algorithm for Sea Surface Temperature and Wind Speed in Storm Conditions
4. Direct Assimilation of Microwave Cloudy Radiances in Hurricane Model
GOSE-R AWG Annual Meeting June 23-26, 2008<Soundings> AWG Annual 3
Project Milestones and Deliverables (2012-2013)
• Generate the ATMS re-sampling weights using B-G methods and understand the noise reduction in association with each averaging algorithm
• Preprocess the ATMS data granules into new granule files with new B-G weights and generate the BUFR ATMS files for hurricane applications
• Retrieve atmospheric temperature profiles from ATMS under hurricane conditions
• Revise AMSR-E SST and SSW algorithms for AMSR2 applications and demonstrate the products over hurricane conditions (Delay to the second year)
By the end of the first year, we deliver the ATMS preprocessor for generating a high resolution of ATMS SDR data with a nadir resolution of 30 km and AMSR2 SST and SSW algorithm software
GOSE-R AWG Annual Meeting June 23-26, 2008<Soundings> AWG Annual 4
Project Milestones and Deliverables(2014-2015)
• Produce operational ATMS resampled data and distribute to user community for demonstrating the values of ATMS oversampling data
• Derive AMSR2 surface temperature and wind speed products using a physical retrieval algorithm and validate the products with insitu data
• Collocate ATMS and AMSR2 data and generate the retrievals of atmospheric and surface parameters using a combined set of AMSR2 and ATMS channels (delayed to the third year)
• Produce a composite analysis of hurricane vortex structure for hurricane model initialization.
• Collocation of retrieved variables should be done within the DA framework
By the end of the second year, we deliver AMSR2 SST and SSW algorithm and products in hurricane conditions and also a composite vortex dataset
GOSE-R AWG Annual Meeting June 23-26, 2008<Soundings> AWG Annual 5
Project Milestones and Deliverables(2015-2017)
• Characterize ATMS temperature sounding channel bias in presence of clouds and define the best predictors for bias correction with respect to GFS and HWRF
• Characterize the forward model errors for simulating ATMS radiances in cloudy conditions using the collocated Cloudsat and precipitation radar data with ATMS
• Conduct the experiments for assessing the impacts of cloud radiance assimilation in GFS and HWRF
By the end of third year, we will deliver a bias correction algorithm and forward radiative transfer model errors, with a focus on assimilating cloudy radiances in hurricane conditions
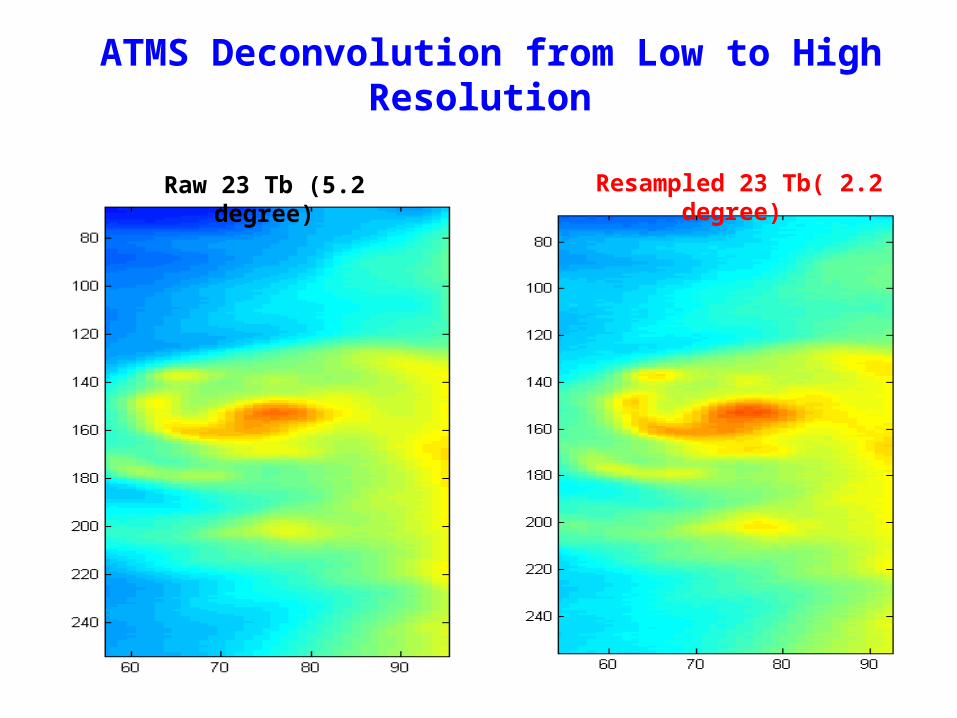
ATMS Deconvolution from Low to High Resolution
Raw 23 Tb (5.2 degree) Resampled 23 Tb( 2.2 degree)
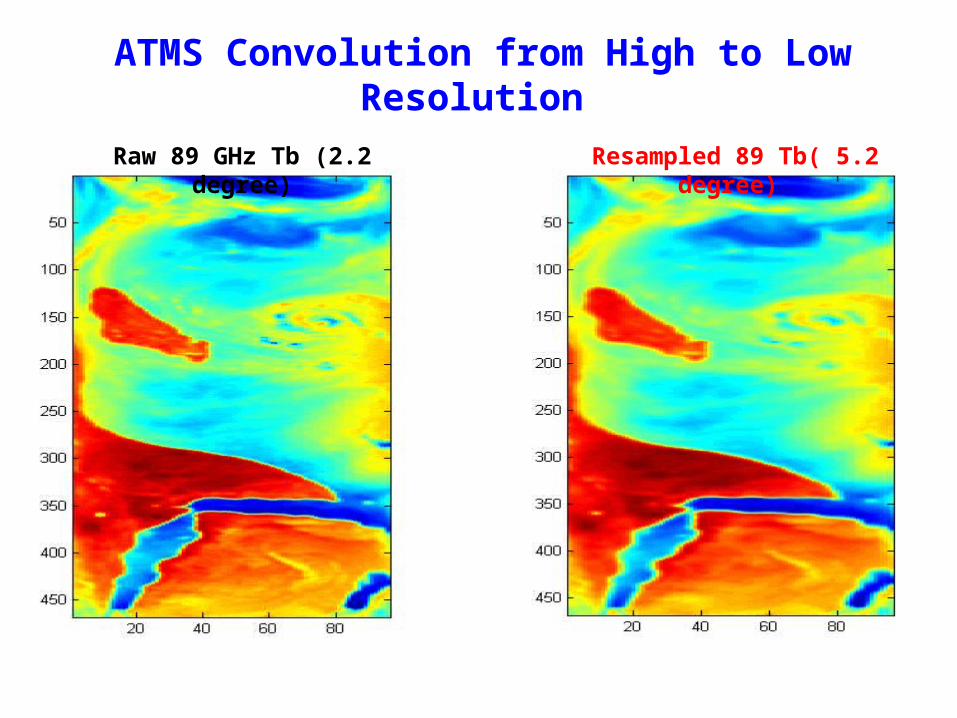
ATMS Convolution from High to Low Resolution
Raw 89 GHz Tb (2.2 degree) Resampled 89 Tb( 5.2 degree)
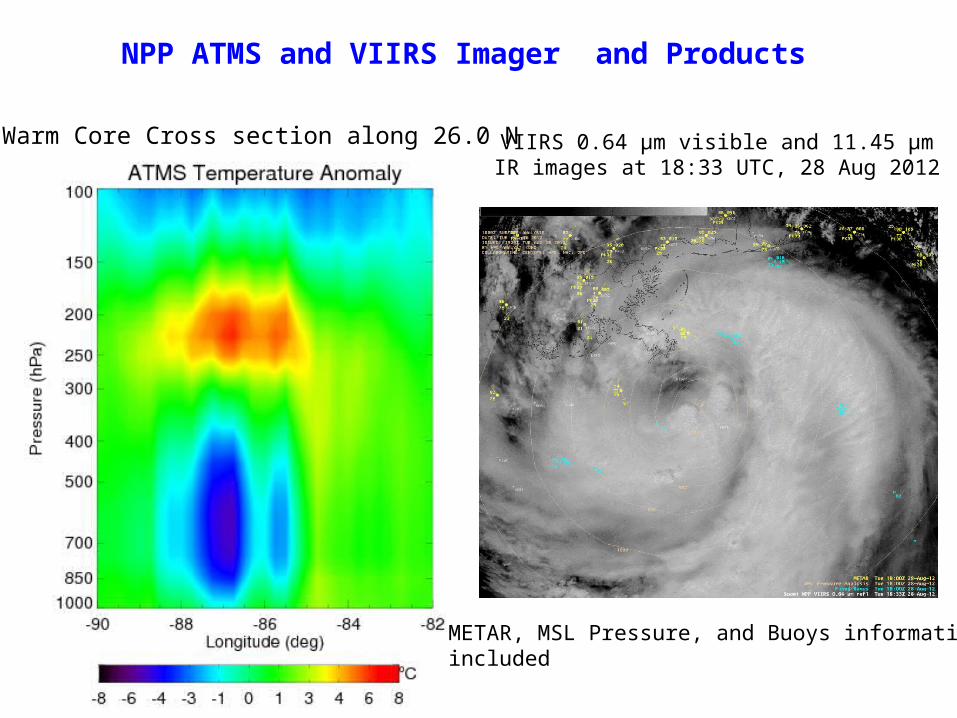
NPP ATMS and VIIRS Imager and Products
Warm Core Cross section along 26.0 N VIIRS 0.64 µm visible and 11.45 µm IR images at 18:33 UTC, 28 Aug 2012
METAR, MSL Pressure, and Buoys information included
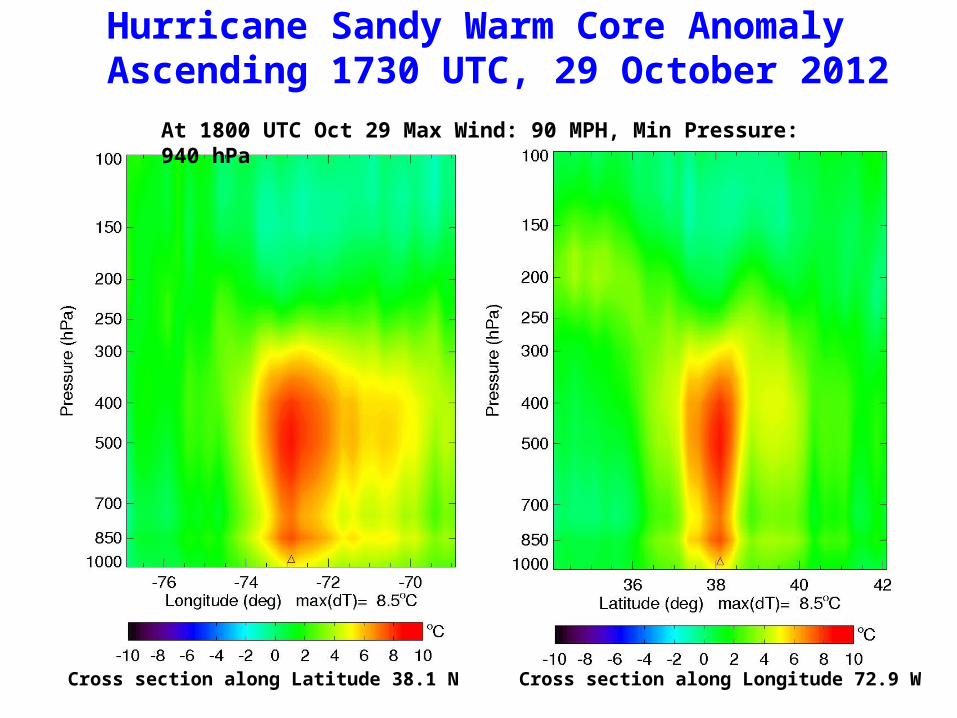
Hurricane Sandy Warm Core Anomaly Ascending 1730 UTC, 29 October 2012
Cross section along Longitude 72.9 WCross section along Latitude 38.1 N
At 1800 UTC Oct 29 Max Wind: 90 MPH, Min Pressure: 940 hPa
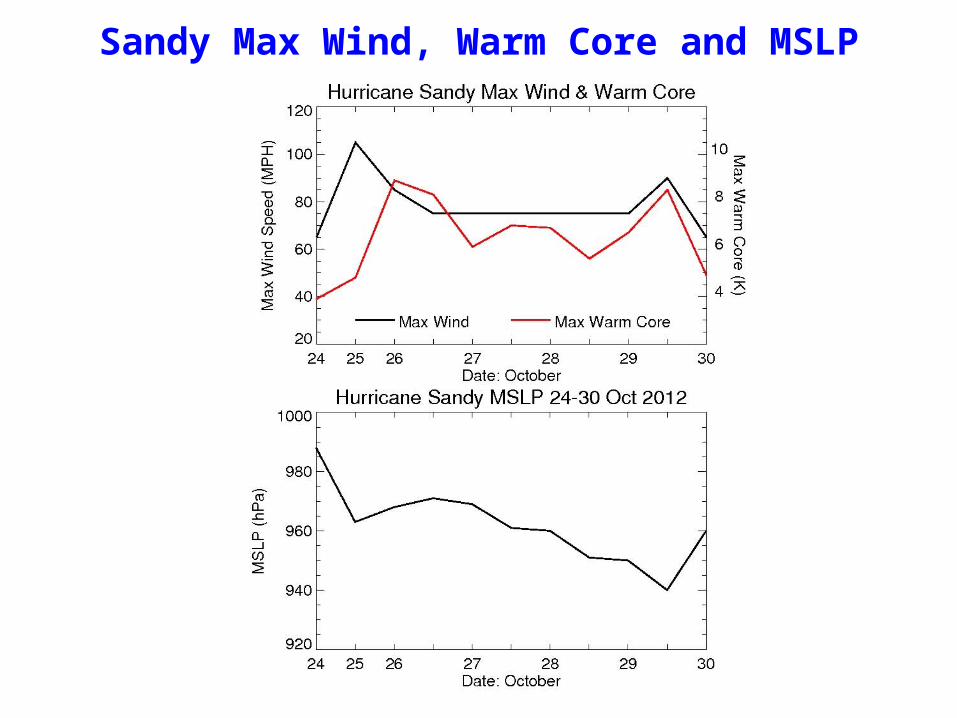
Sandy Max Wind, Warm Core and MSLP
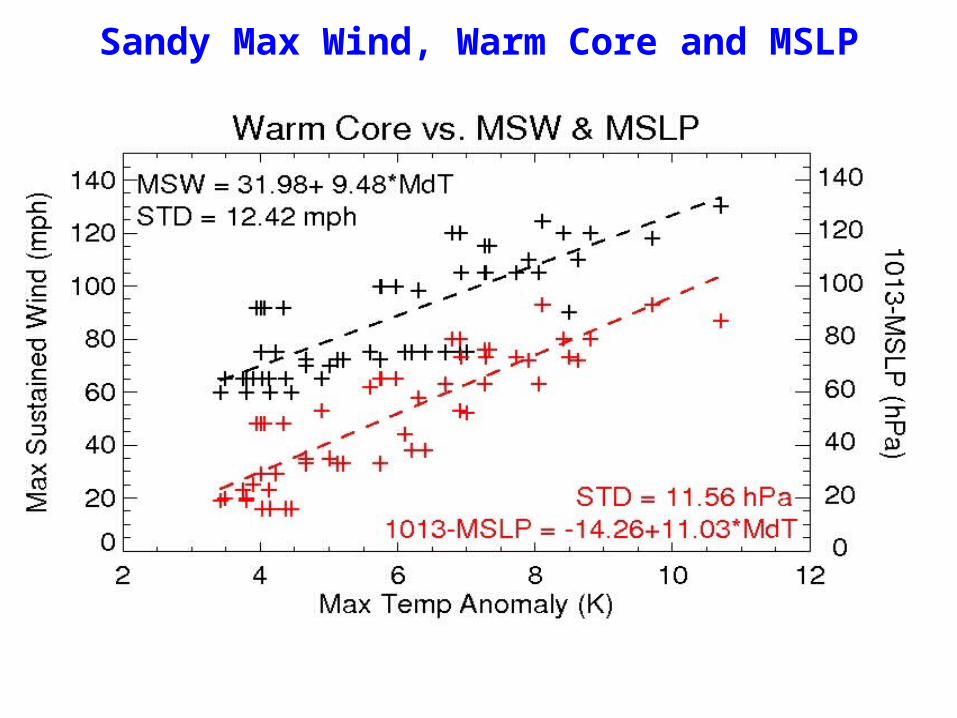
Sandy Max Wind, Warm Core and MSLP
14
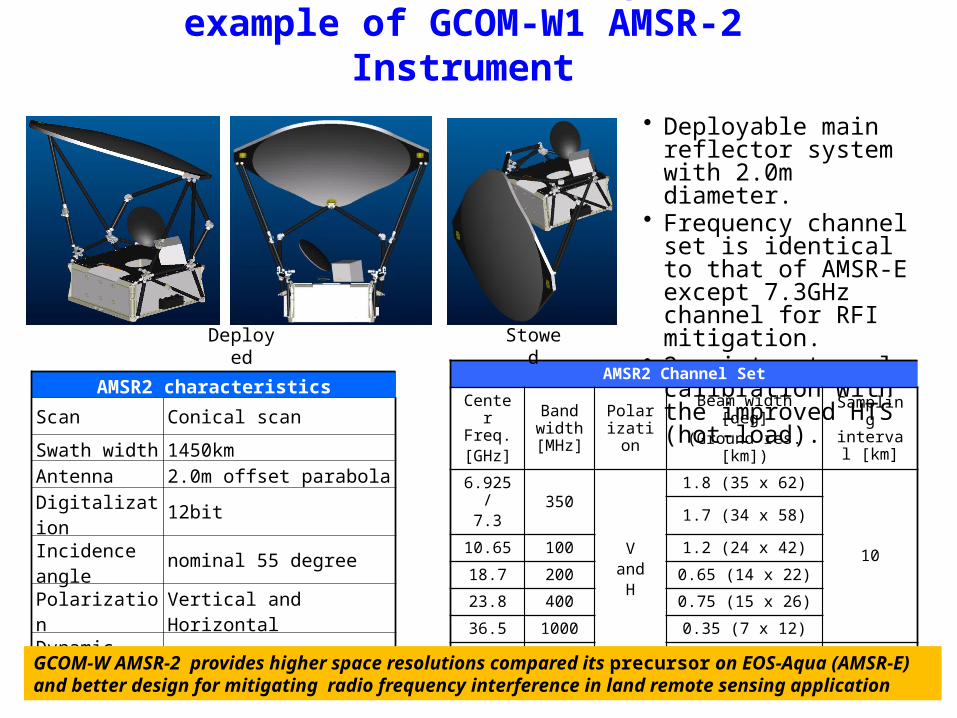
Passive Microwave Imager: an example of GCOM-W1 AMSR-2 Instrument
• Deployable main reflector system with 2.0m diameter.
• Frequency channel set is identical to that of AMSR-E except 7.3GHz channel for RFI mitigation.
• 2-point external calibration with the improved HTS (hot-load).
AMSR2 Channel Set
Center Freq.[GHz]
Band width [MHz]
Polarization
Beam width [deg](Ground res. [km])
Sampling interval
[km]
6.925/7.3 350
VandH
1.8 (35 x 62)
10
1.7 (34 x 58)
10.65 100 1.2 (24 x 42)
18.7 200 0.65 (14 x 22)
23.8 400 0.75 (15 x 26)
36.5 1000 0.35 (7 x 12)
89.0 3000 0.15 (3 x 5) 5
Stowed
AMSR2 characteristics
Scan Conical scan
Swath width 1450km
Antenna 2.0m offset parabola
Digitalization 12bit
Incidence angle nominal 55 degree
Polarization Vertical and Horizontal
Dynamic range 2.7-340K
Deployed
GCOM-W AMSR-2 provides higher space resolutions compared its precursor on EOS-Aqua (AMSR-E) and better design for mitigating radio frequency interference in land remote sensing application
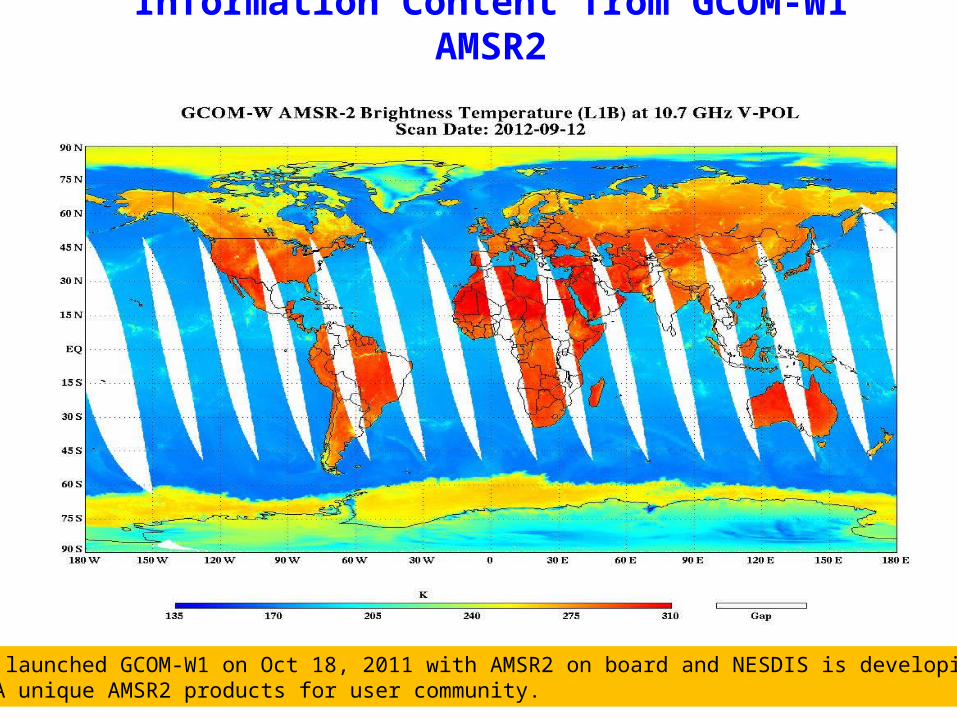
Information Content from GCOM-W1 AMSR2
Duration 9 - 21 February 2012MSPD=115 mph MSLP=932 (hPa)JAXA launched GCOM-W1 on Oct 18, 2011 with AMSR2 on board and NESDIS is developing
NOAA unique AMSR2 products for user community.
AMSR-E Ocean Products: Theoretical Base
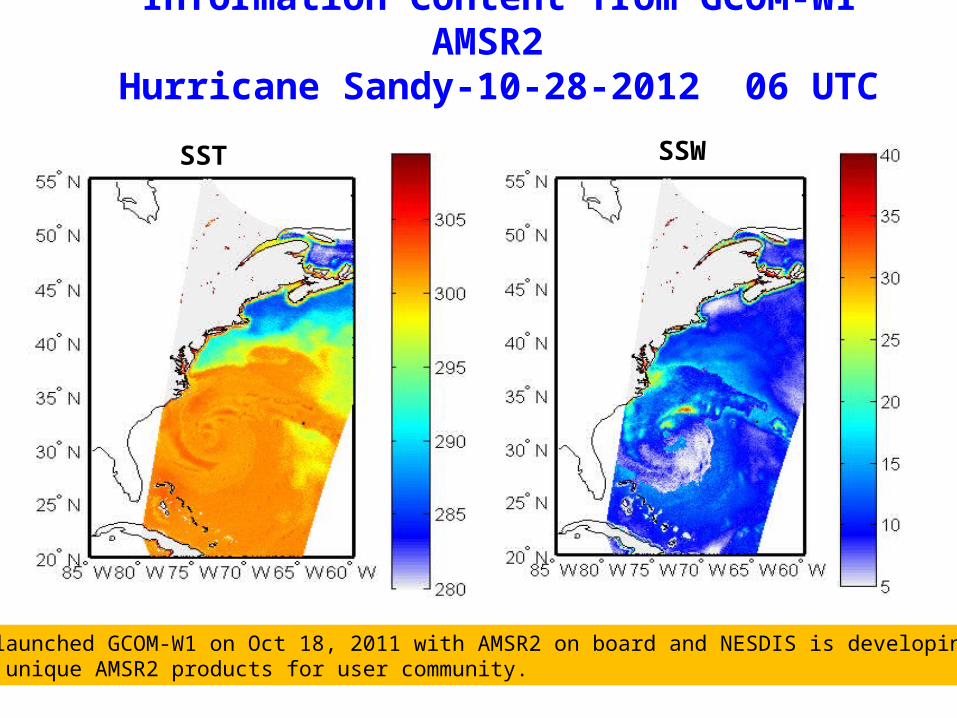
Information Content from GCOM-W1 AMSR2 Hurricane Sandy-10-28-2012 06 UTC
Duration 9 - 21 February 2012MSPD=115 mph MSLP=932 (hPa)
JAXA launched GCOM-W1 on Oct 18, 2011 with AMSR2 on board and NESDIS is developing NOAA unique AMSR2 products for user community.
SST SSW
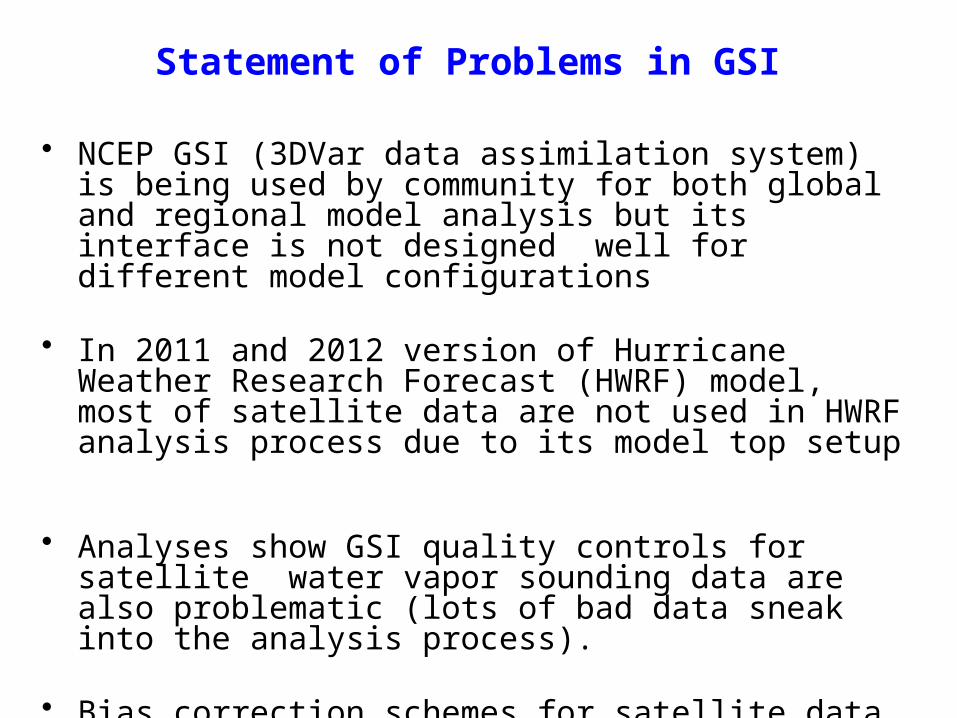
Statement of Problems in GSI
• NCEP GSI (3DVar data assimilation system) is being used by community for both global and regional model analysis but its interface is not designed well for different model configurations
• In 2011 and 2012 version of Hurricane Weather Research Forecast (HWRF) model, most of satellite data are not used in HWRF analysis process due to its model top setup
• Analyses show GSI quality controls for satellite water vapor sounding data are also problematic (lots of bad data sneak into the analysis process).
• Bias correction schemes for satellite data developed for the global model applications have not been fully vetted for regional model applications
Pre
ssur
e (h
Pa)
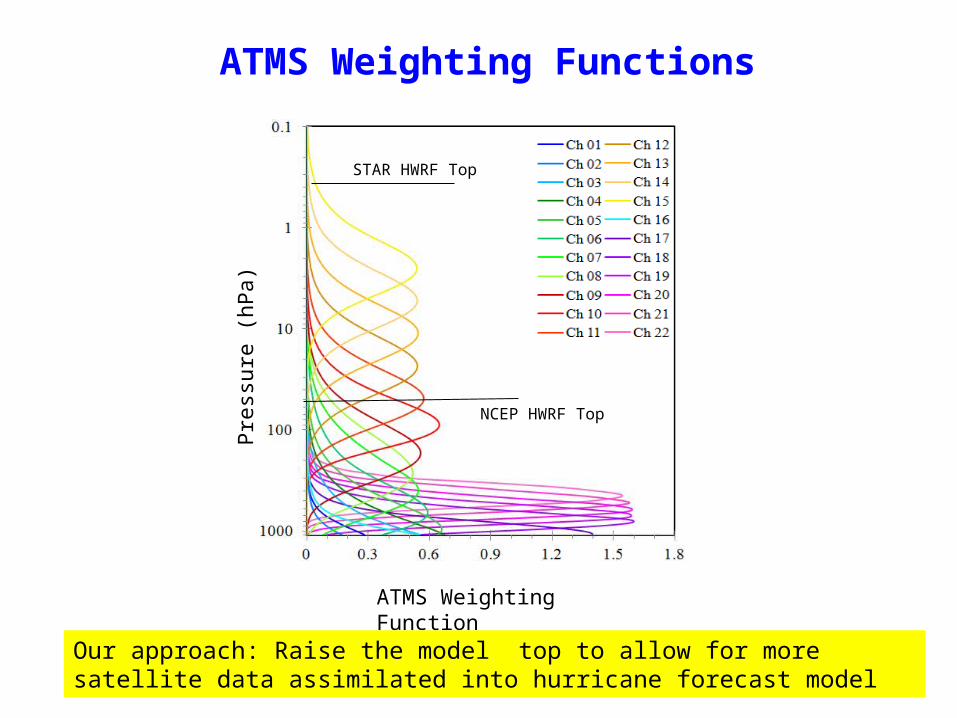
ATMS Weighting Function
NCEP HWRF Top
STAR HWRF Top
ATMS Weighting Functions
Our approach: Raise the model top to allow for more satellite data assimilated into hurricane forecast model
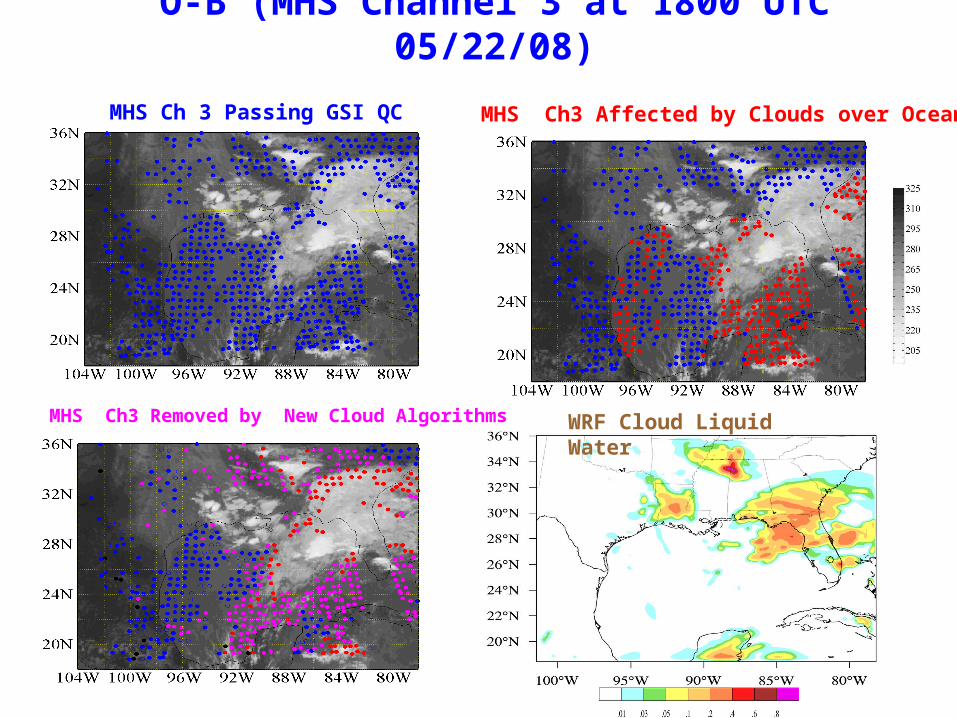
O-B (MHS Channel 3 at 1800 UTC 05/22/08)
MHS Ch 3 Passing GSI QC MHS Ch3 Affected by Clouds over Oceans
MHS Ch3 Removed by New Cloud Algorithms WRF Cloud Liquid Water
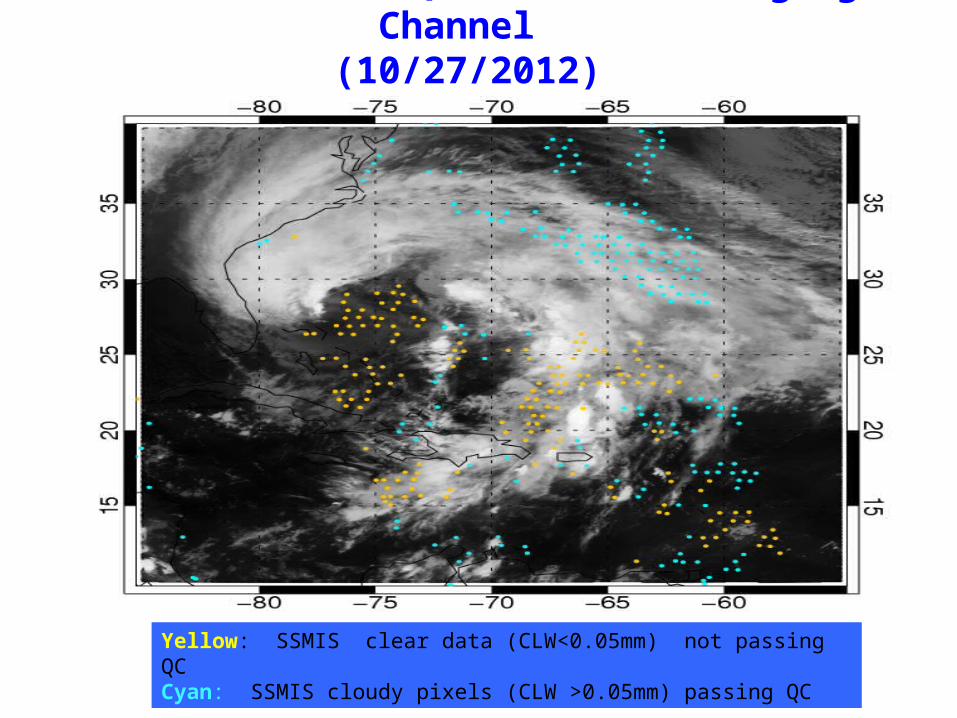
Issues on GSI QC for SSMIS Imaging Channel (10/27/2012)
Yellow: SSMIS clear data (CLW<0.05mm) not passing QC Cyan: SSMIS cloudy pixels (CLW >0.05mm) passing QC
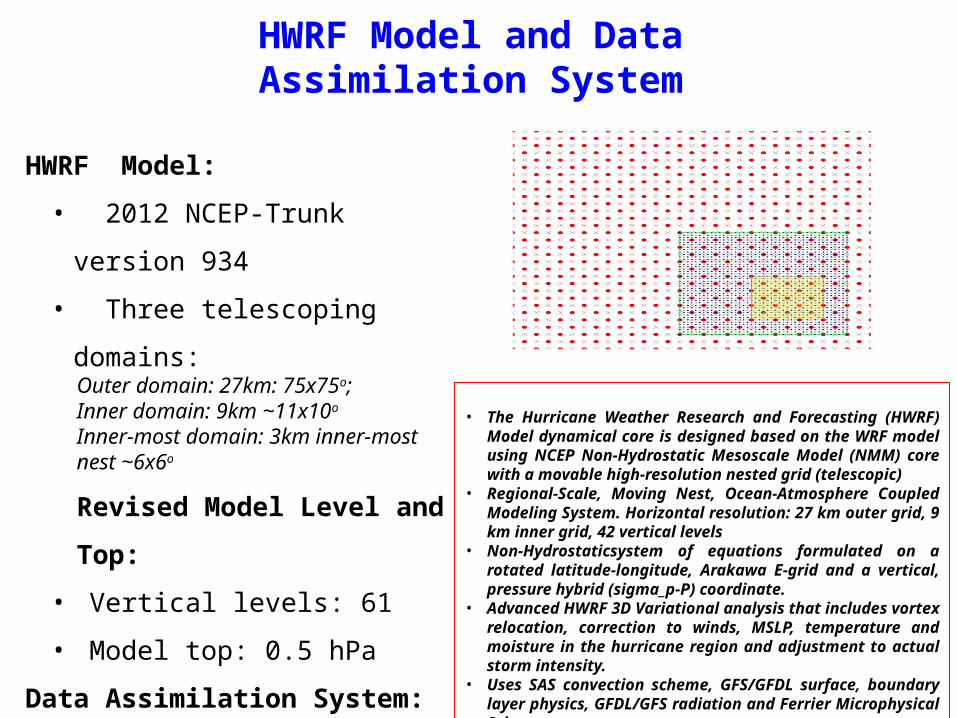
HWRF Model and Data Assimilation System
HWRF Model:
• 2012 NCEP-Trunk version 934
• Three telescoping domains:Outer domain: 27km: 75x75o; Inner domain: 9km ~11x10o
Inner-most domain: 3km inner-most nest ~6x6o
Revised Model Level and Top:
• Vertical levels: 61
• Model top: 0.5 hPa
Data Assimilation System:
• HWRF 6 hour forecasts
• GSI (3DVAR)
• The Hurricane Weather Research and Forecasting (HWRF) Model dynamical core is designed based on the WRF model using NCEP Non-Hydrostatic Mesoscale Model (NMM) core with a movable high-resolution nested grid (telescopic)
• Regional-Scale, Moving Nest, Ocean-Atmosphere Coupled Modeling System. Horizontal resolution: 27 km outer grid, 9 km inner grid, 42 vertical levels
• Non-Hydrostaticsystem of equations formulated on a rotated latitude-longitude, Arakawa E-grid and a vertical, pressure hybrid (sigma_p-P) coordinate.
• Advanced HWRF 3D Variational analysis that includes vortex relocation, correction to winds, MSLP, temperature and moisture in the hurricane region and adjustment to actual storm intensity.
• Uses SAS convection scheme, GFS/GFDL surface, boundary layer physics, GFDL/GFS radiation and Ferrier Microphysical Scheme.
• Ocean coupled modeling system (POM/HYCOM).
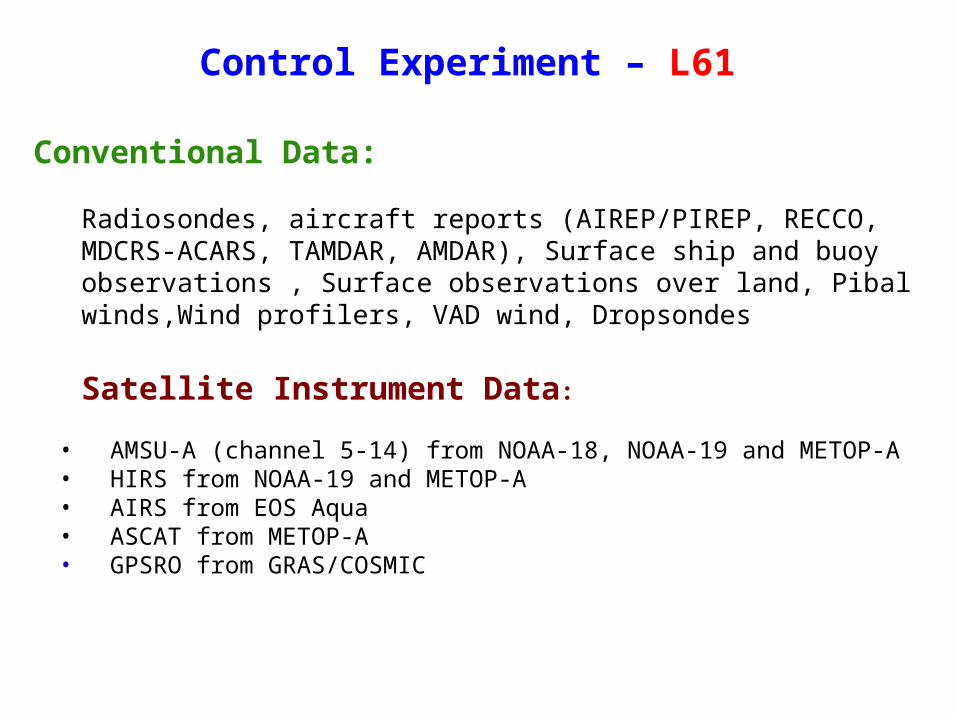
Control Experiment – L61
Conventional Data:
Radiosondes, aircraft reports (AIREP/PIREP, RECCO, MDCRS-ACARS, TAMDAR, AMDAR), Surface ship and buoy observations , Surface observations over land, Pibal winds,Wind profilers, VAD wind, Dropsondes
Satellite Instrument Data:
• AMSU-A (channel 5-14) from NOAA-18, NOAA-19 and METOP-A• HIRS from NOAA-19 and METOP-A • AIRS from EOS Aqua • ASCAT from METOP-A • GPSRO from GRAS/COSMIC
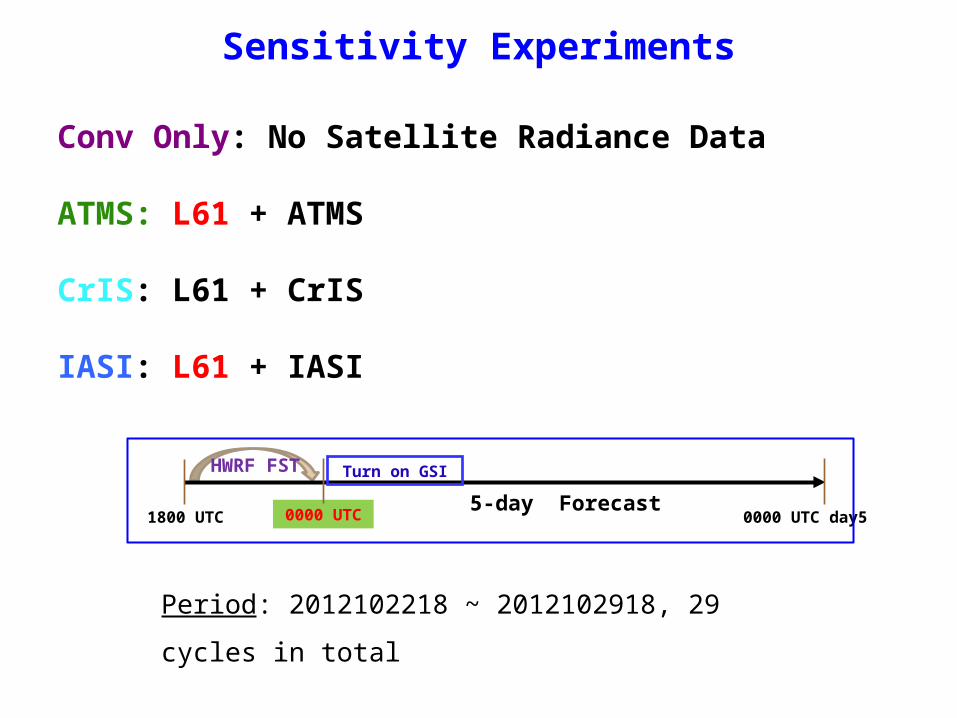
Sensitivity Experiments
Conv Only: No Satellite Radiance Data
ATMS: L61 + ATMS
CrIS: L61 + CrIS
IASI: L61 + IASI
1800 UTC 0000 UTC 0000 UTC day55-day Forecast
HWRF FST Turn on GSI
Period: 2012102218 ~ 2012102918, 29 cycles in total
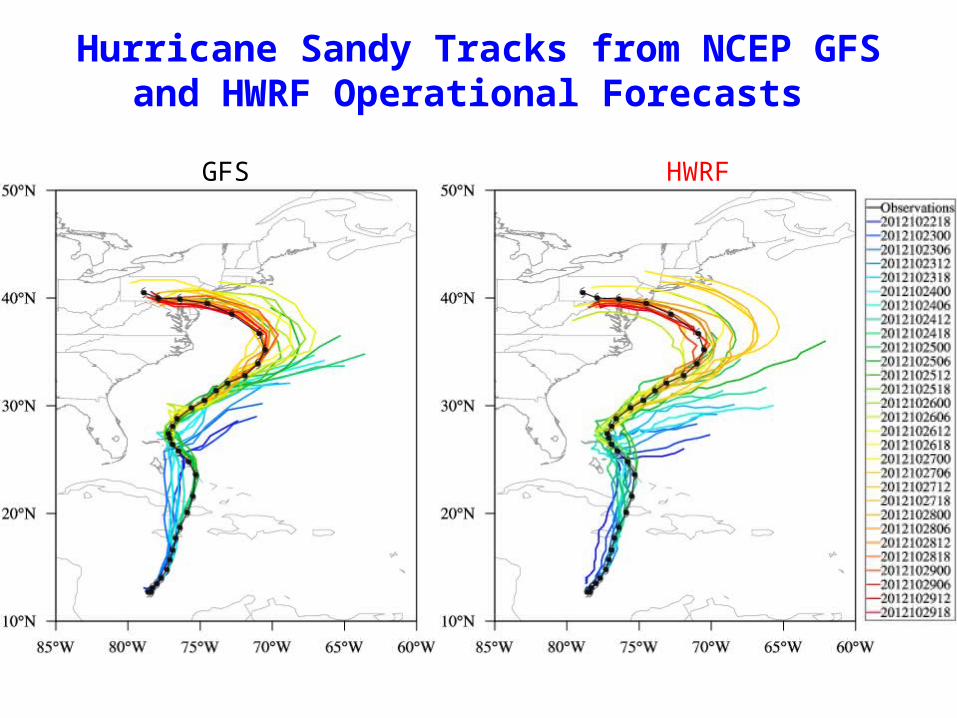
HWRF GFS
Hurricane Sandy Tracks from NCEP GFS and HWRF Operational Forecasts
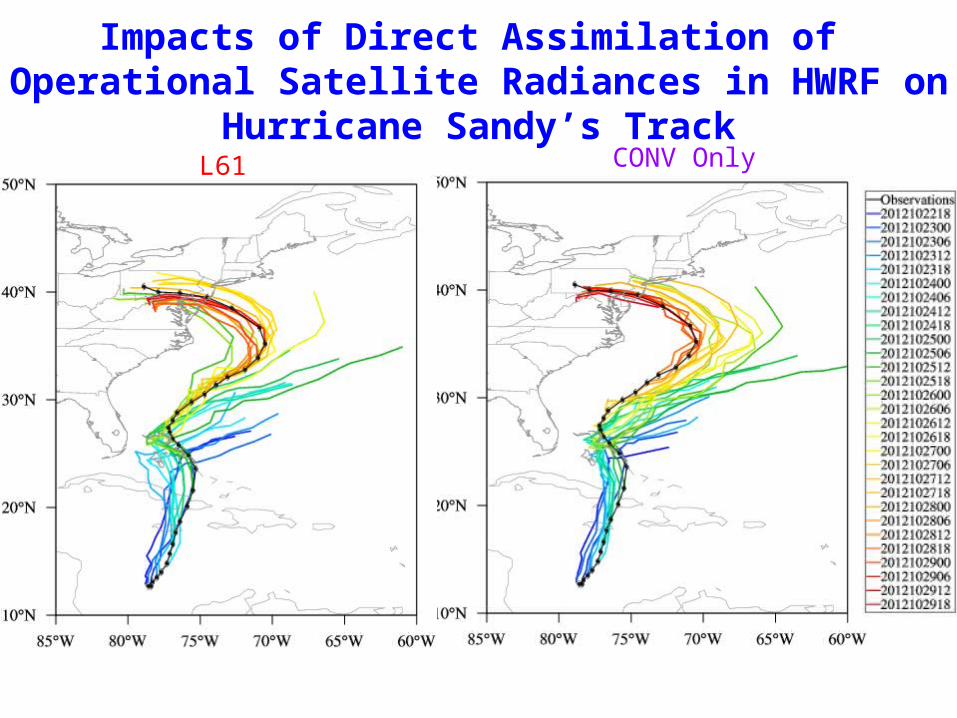
CONV OnlyL61
Impacts of Direct Assimilation of Operational Satellite Radiances in HWRF on Hurricane Sandy’s Track
L61:Control Run
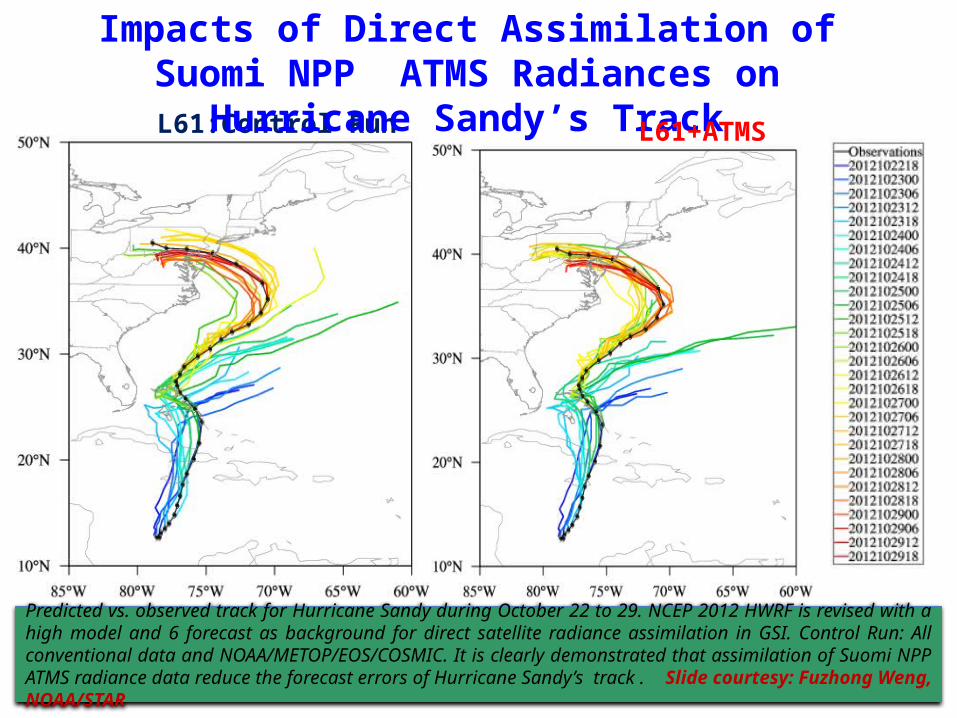
Impacts of Direct Assimilation of Suomi NPP ATMS Radiances on Hurricane Sandy’s Track
L61+ATMS
Predicted vs. observed track for Hurricane Sandy during October 22 to 29. NCEP 2012 HWRF is revised with a high model and 6 forecast as background for direct satellite radiance assimilation in GSI. Control Run: All conventional data and NOAA/METOP/EOS/COSMIC. It is clearly demonstrated that assimilation of Suomi NPP ATMS radiance data reduce the forecast errors of Hurricane Sandy’s track . Slide courtesy: Fuzhong Weng, NOAA/STAR
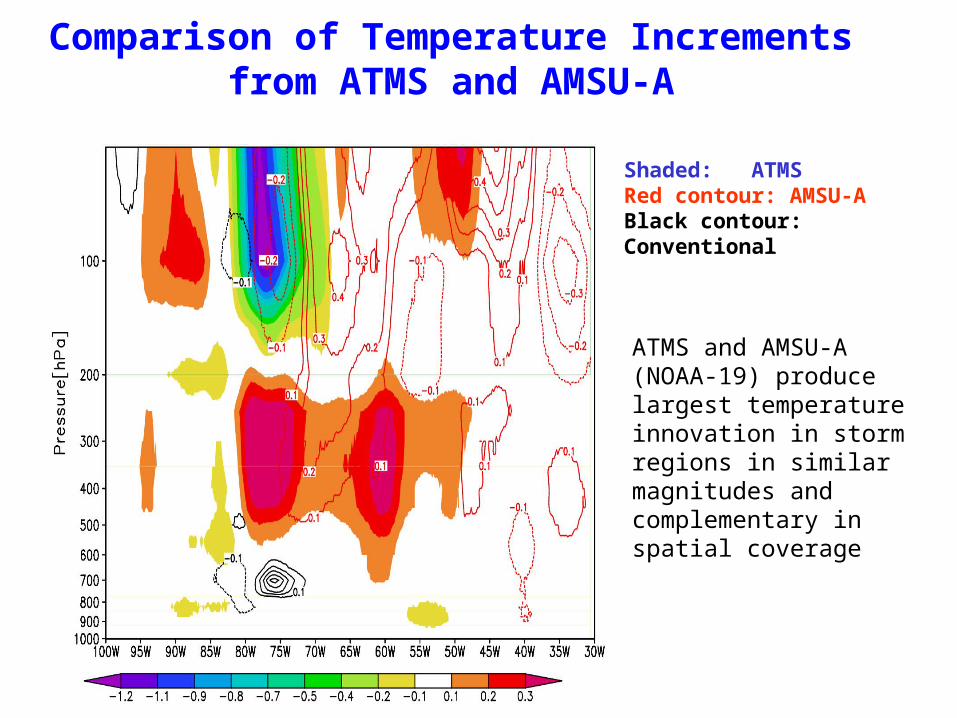
Comparison of Temperature Increments from ATMS and AMSU-A
Shaded: ATMS Red contour: AMSU-ABlack contour: Conventional
ATMS and AMSU-A (NOAA-19) produce largest temperature innovation in storm regions in similar magnitudes and complementary in spatial coverage
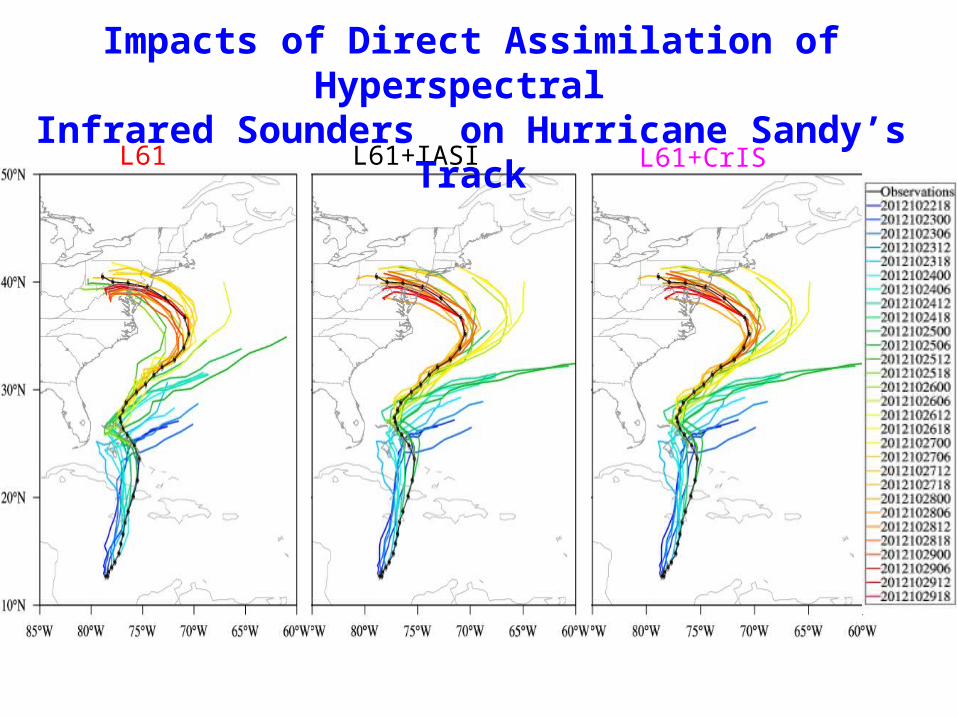
L61+IASIL61 L61+CrIS
Impacts of Direct Assimilation of Hyperspectral Infrared Sounders on Hurricane Sandy’s Track
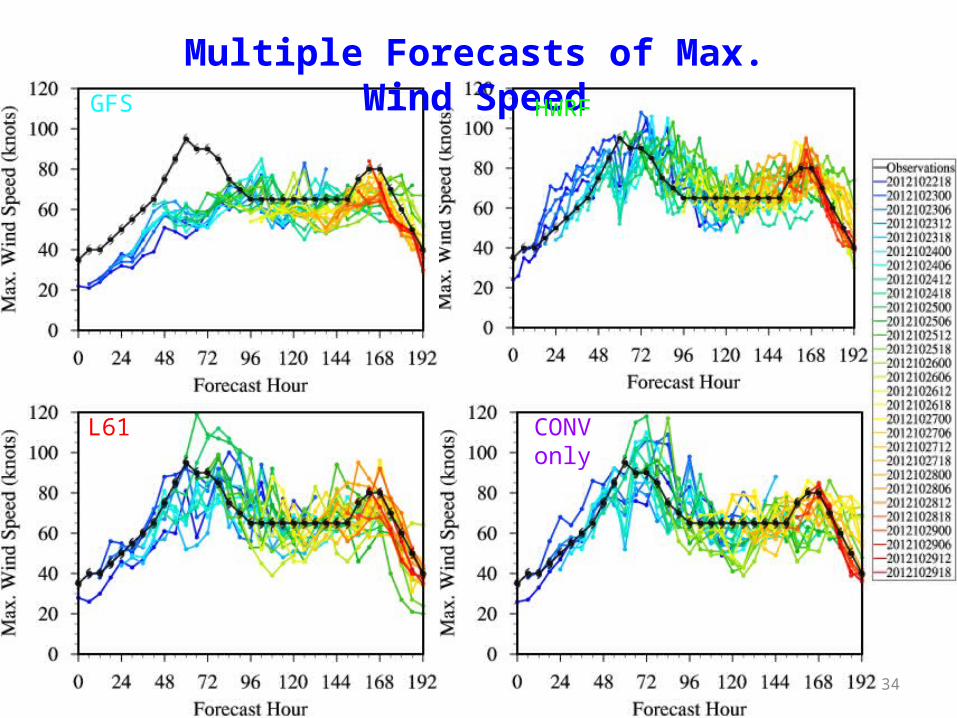
Multiple Forecasts of Max. Wind SpeedGFS HWRF
L61
34
CONVonly
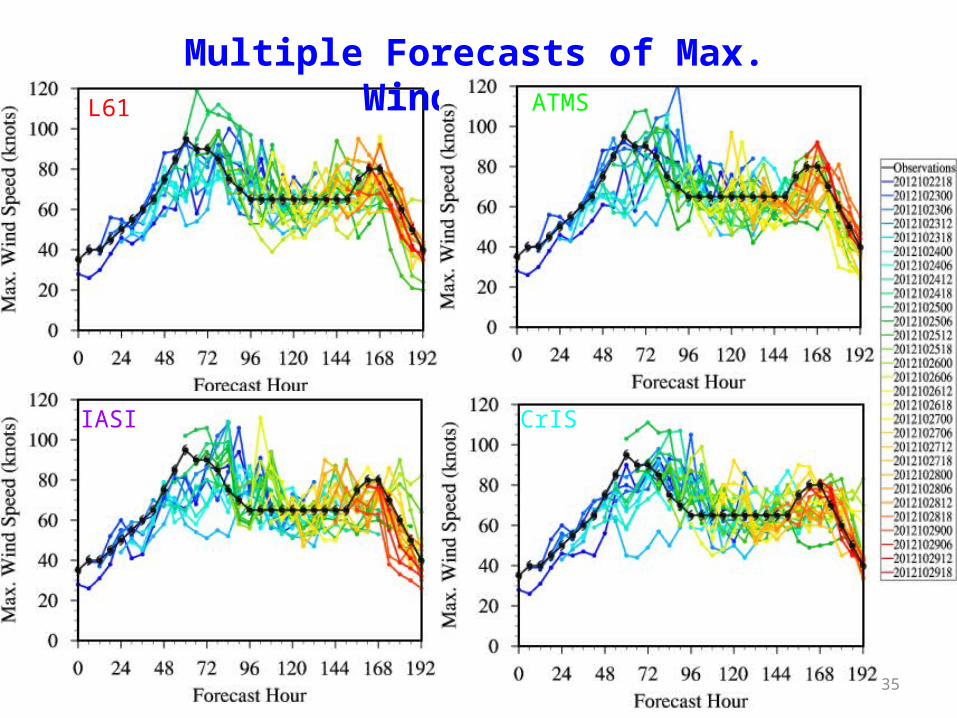
Multiple Forecasts of Max. Wind SpeedL61
35
IASI
ATMS
CrIS
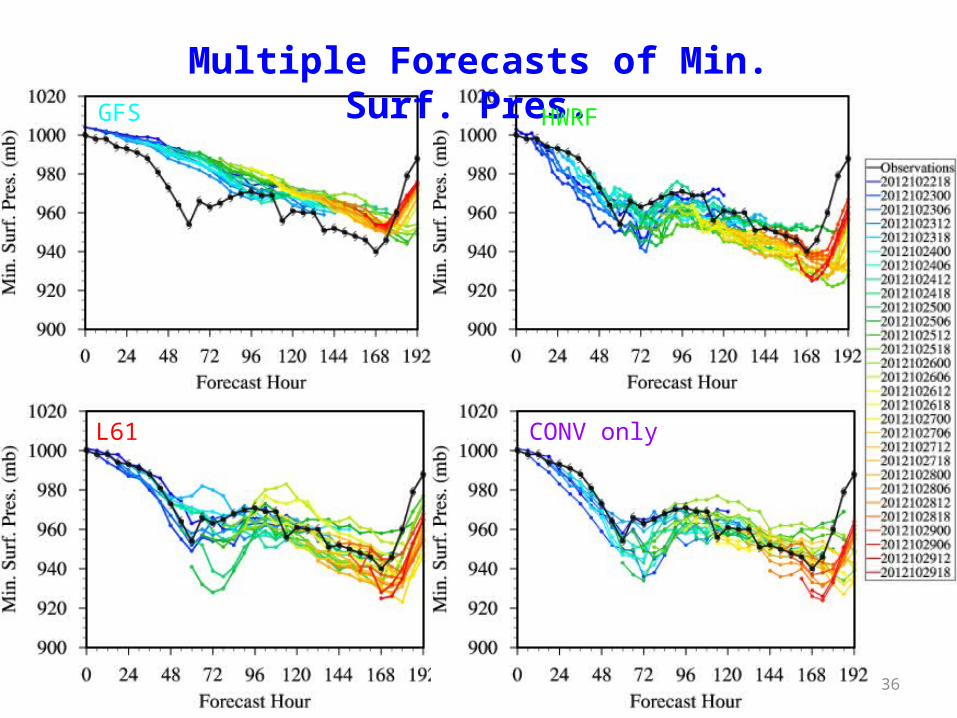
Multiple Forecasts of Min. Surf. Pres.
36
GFS HWRF
L61 CONV only
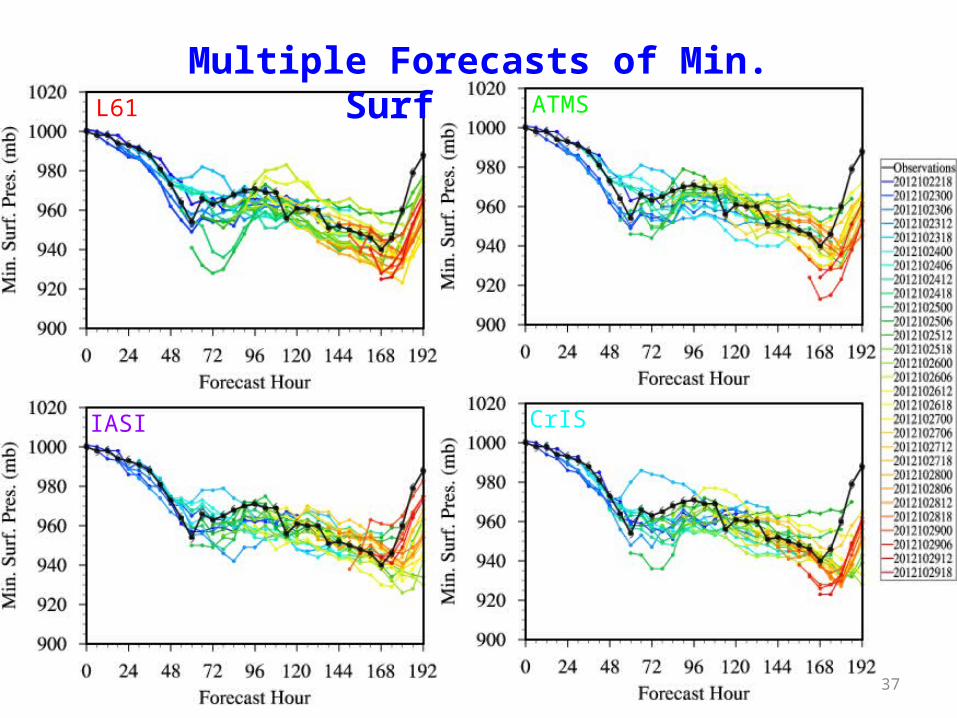
Multiple Forecasts of Min. Surf. Pres.
37
L61
IASI
ATMS
CrIS
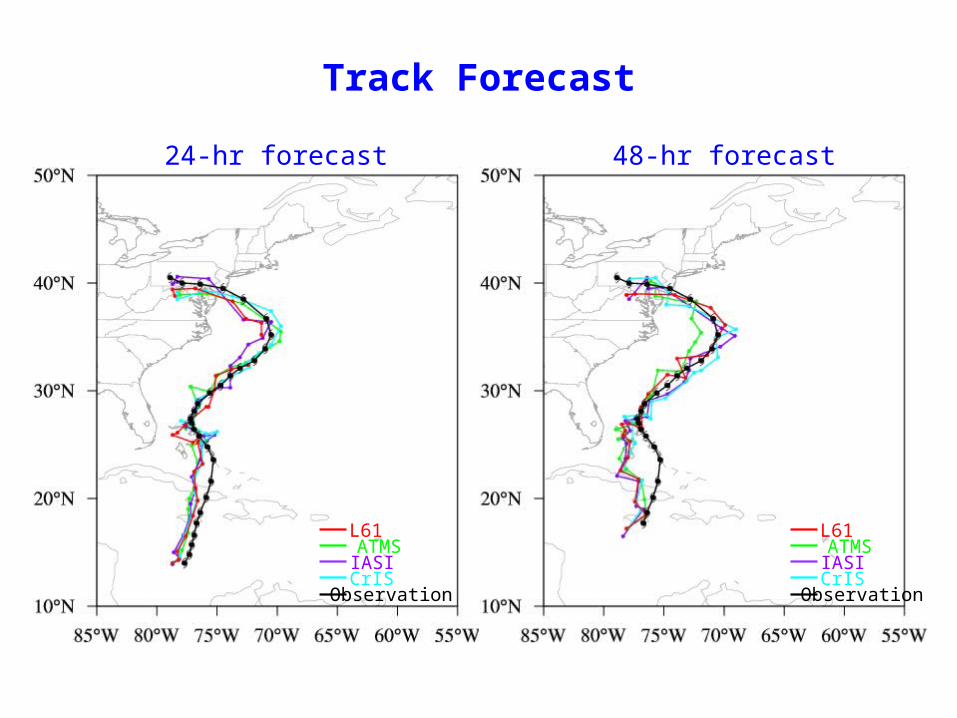
48-hr forecast24-hr forecast
Track Forecast
Observation
ATMSIASI
L61
CrISObservation
ATMSIASI
L61
CrIS
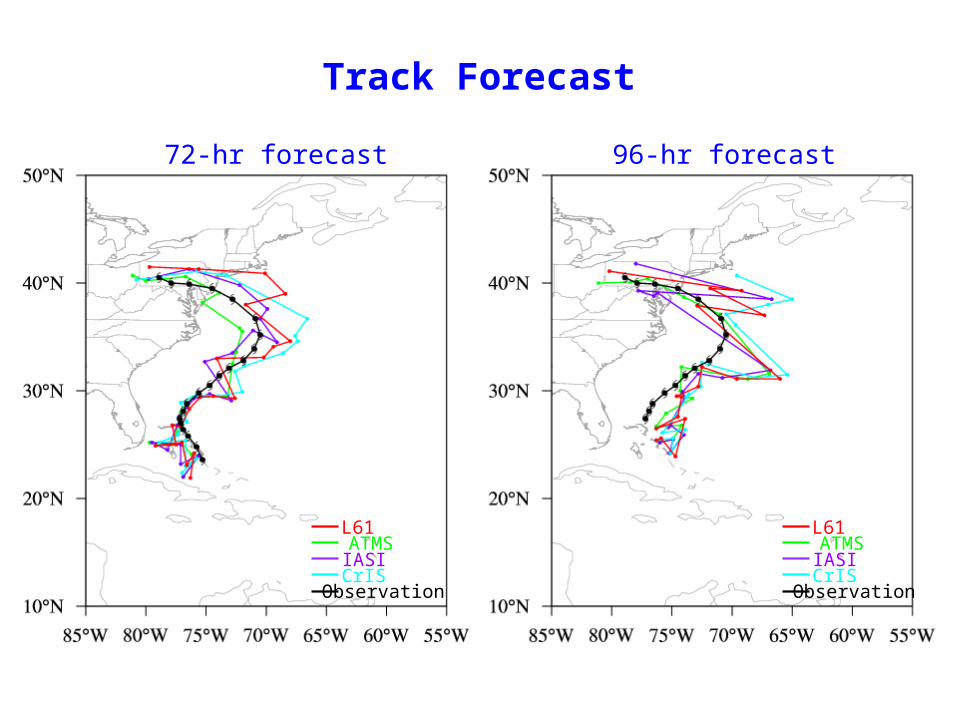
96-hr forecast72-hr forecast
Track Forecast
Observation
ATMSIASI
L61
CrISObservation
ATMSIASI
L61
CrIS
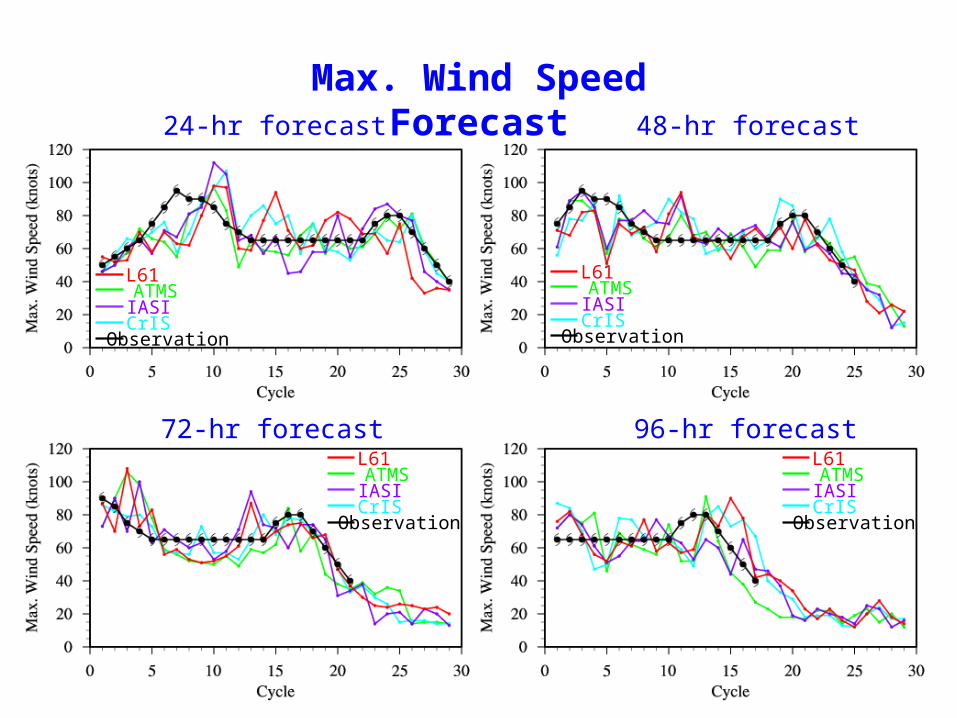
Max. Wind Speed Forecast24-hr forecast 48-hr forecast
72-hr forecast 96-hr forecast
Observation
ATMSIASI
L61
CrISObservation
ATMSIASI
L61
CrIS
Observation
ATMSIASI
L61
CrISObservation
ATMSIASI
L61
CrIS
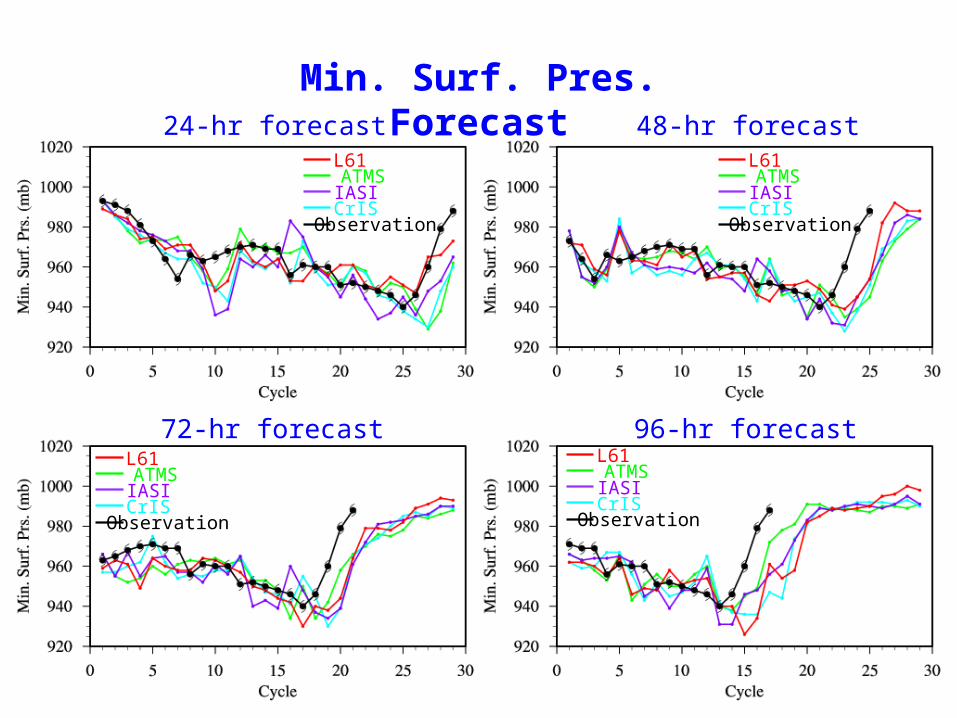
Min. Surf. Pres. Forecast24-hr forecast 48-hr forecast
72-hr forecast 96-hr forecast
Observation
ATMSIASI
L61
CrISObservation
ATMSIASI
L61
CrIS
Observation
ATMSIASI
L61
CrISObservation
ATMSIASI
L61
CrIS
Summary and Conclusions
• Our JPSS proving ground project is progressing very well and all the tasks in 2012-2013 are on track.
• Suomi NPP ATMS/CRIS added more values for improving hurricane monitoring and forecasts.
• ATMS is very unique for resolving hurricane warm core features through spatial oversampling and additional channels.
• AMSR2 provides SST and SSW information within the hurricane precipitation areas and the algorithms have been developed and tested for retrievals
• 2012 HWRF/GSI is re-configured with more vertical layers and higher model top for improving direct satellite radiance assimilation.
• Our control and sensitivity experiments show NPP ATMS improves Sandy’s track and intensity forecasts