improve project plans, budgets & schedules mike tulkoff ... · improve project plans, budgets...
TRANSCRIPT
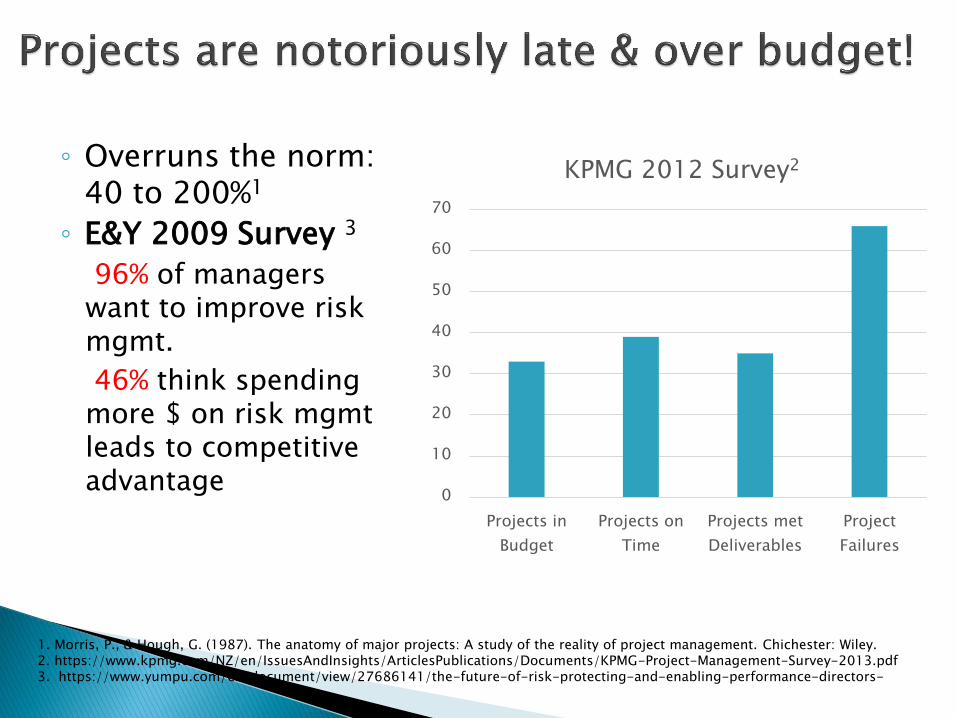
◦ Overruns the norm: 40 to 200%1
◦ E&Y 2009 Survey 3
96% of managers want to improve risk mgmt.
46% think spending more $ on risk mgmt leads to competitive advantage
0
10
20
30
40
50
60
70
Projects in
Budget
Projects on
Time
Projects met
Deliverables
Project
Failures
KPMG 2012 Survey2
1. Morris, P., & Hough, G. (1987). The anatomy of major projects: A study of the reality of project management. Chichester: Wiley. 2. https://www.kpmg.com/NZ/en/IssuesAndInsights/ArticlesPublications/Documents/KPMG-Project-Management-Survey-2013.pdf 3. https://www.yumpu.com/en/document/view/27686141/the-future-of-risk-protecting-and-enabling-performance-directors-
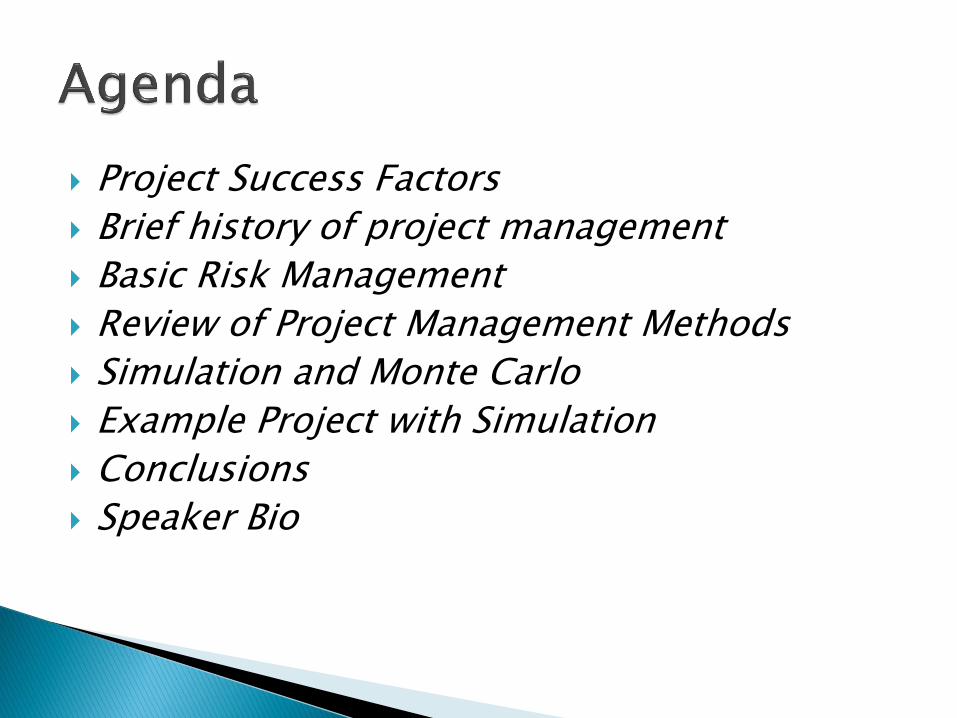
Project Success Factors
Brief history of project management
Basic Risk Management
Review of Project Management Methods
Simulation and Monte Carlo
Example Project with Simulation
Conclusions
Speaker Bio
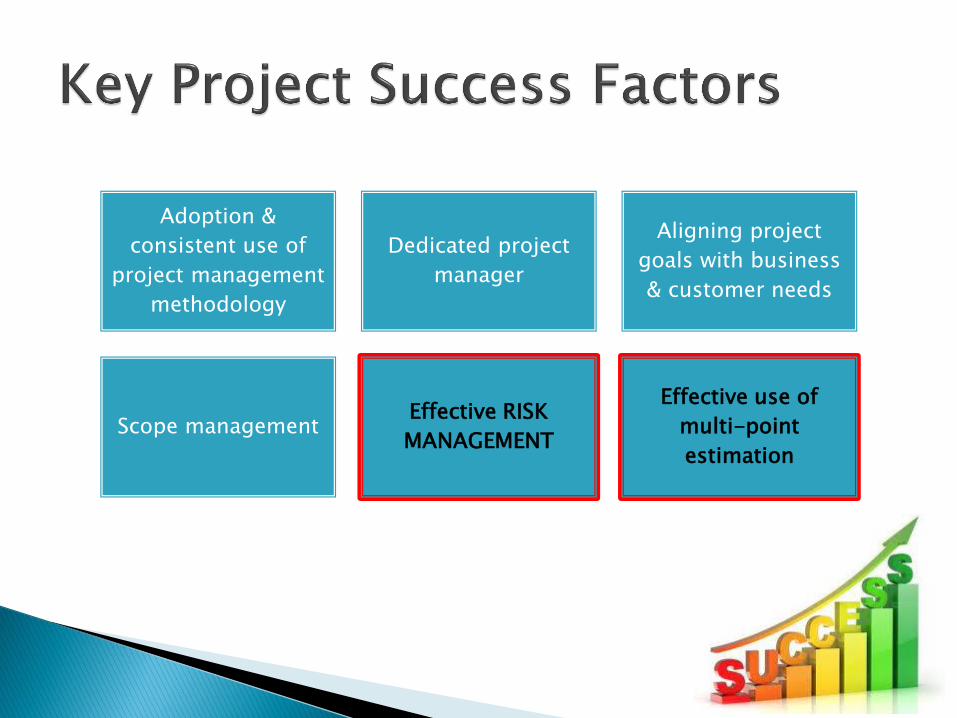
Adoption &
consistent use of
project management
methodology
Dedicated project
manager
Aligning project
goals with business
& customer needs
Scope management Effective RISK
MANAGEMENT
Effective use of
multi-point
estimation
4. Meredith, J., & Mantel, S. (1995). Project management: A managerial approach (3rd ed.). New York: Wiley.
5. Wilson, J. M. (2003). Gantt charts: A centenary appreciation. European Journal of Operational Research, 149(2), 430-437.
6. Moder, J. J., & Phillips, C. R. (1970). Project Management with CPM and PERT (2nd ed.).
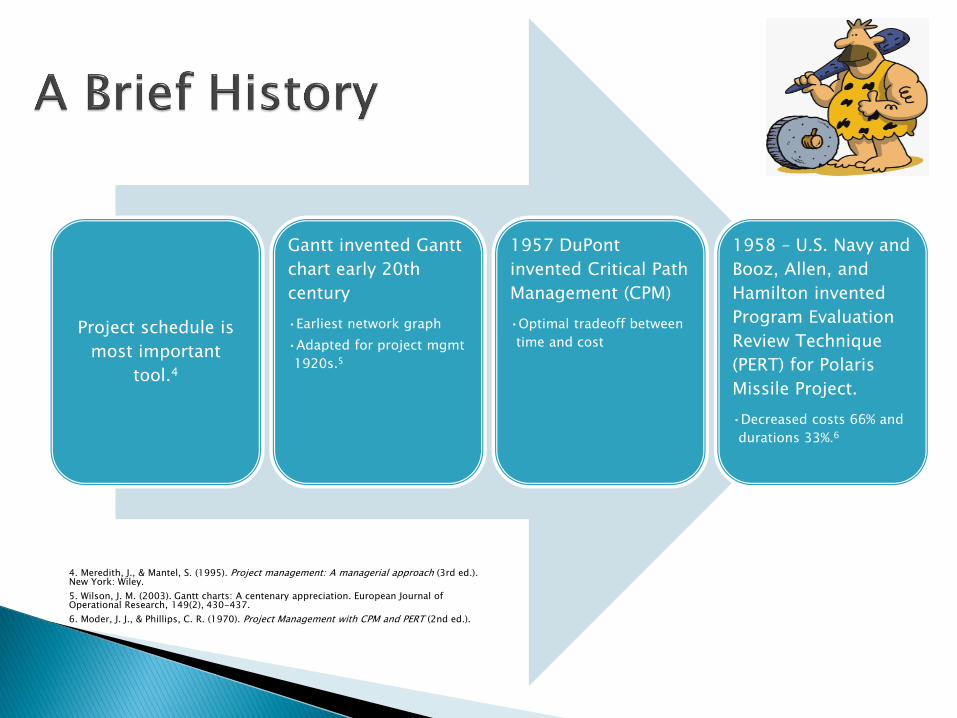
Project schedule is
most important
tool.4
Gantt invented Gantt
chart early 20th
century
•Earliest network graph
•Adapted for project mgmt
1920s.5
1957 DuPont
invented Critical Path
Management (CPM)
•Optimal tradeoff between
time and cost
1958 – U.S. Navy and
Booz, Allen, and
Hamilton invented
Program Evaluation
Review Technique
(PERT) for Polaris
Missile Project.
•Decreased costs 66% and
durations 33%.6

Identify Risks, perform risk analysis & plan risk responses (PMI PMBOK 5).
Use Identification Tools
•Documentation, project WBS, SWOT analysis, cross-functional reviews (e.g. legal, financial)
Use Risk Register
•Matrix of identified risks, categories, likelihood, mitigation, owner.
Risk Management is an iterative approach – feedback into the project plan
Simulation & prototype have highest correlations to successful risk
mitigation.7
7, Raz, T., & Michael, E. (2001). Use and benefits of tools for project risk management. International Journal of Project Management, 19(1)

Risk Register helps characterize known risks and potential “black swans”.
Probability and project impact
Mitigation plans
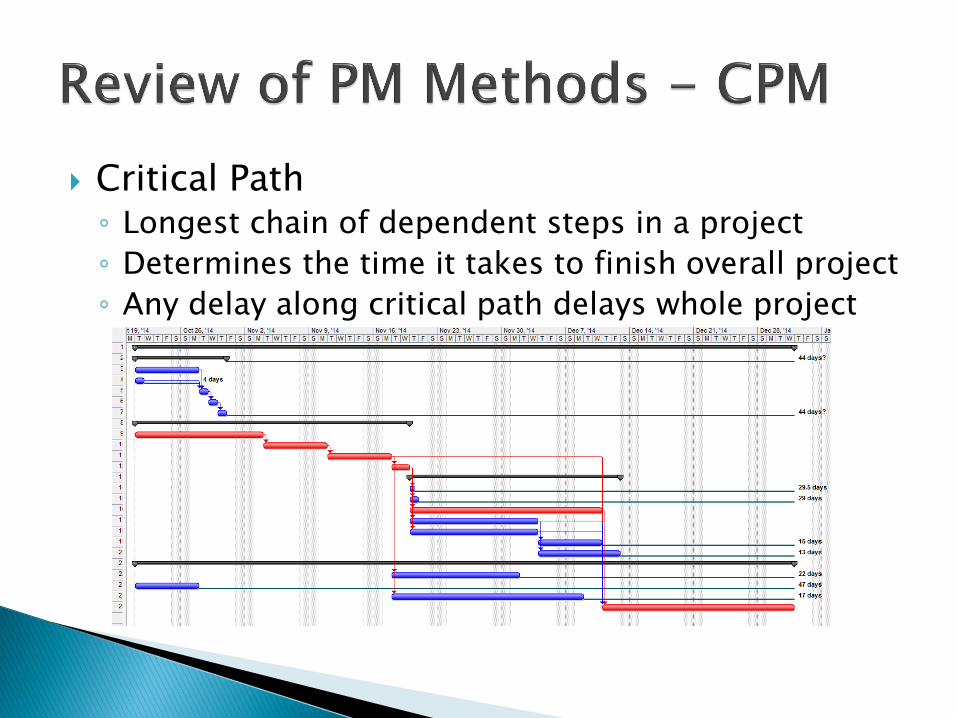
Critical Path ◦ Longest chain of dependent steps in a project
◦ Determines the time it takes to finish overall project
◦ Any delay along critical path delays whole project
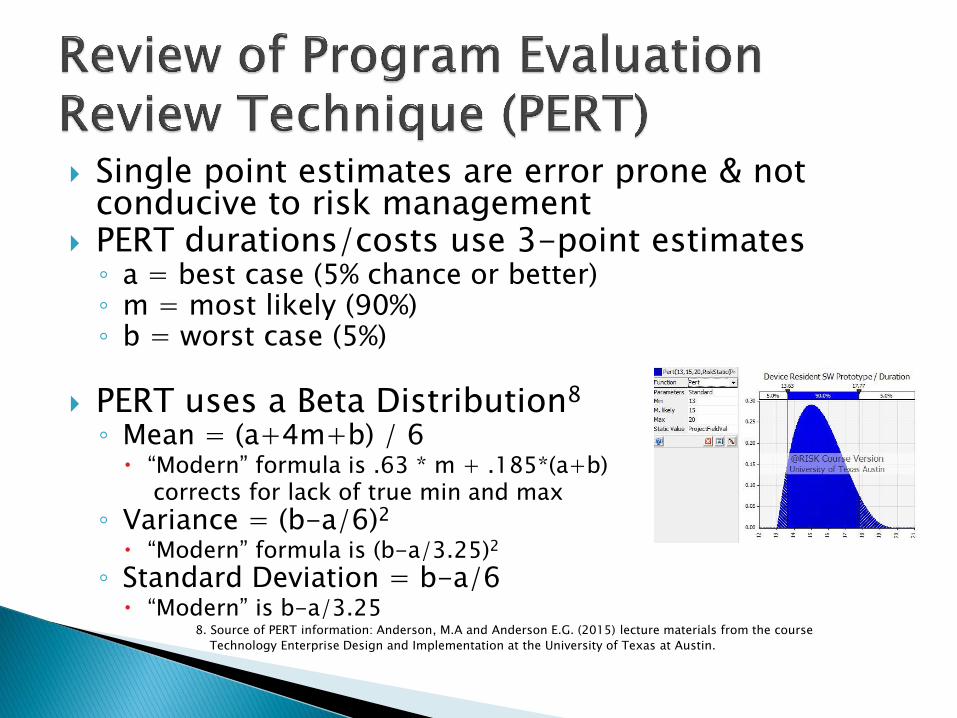
Single point estimates are error prone & not conducive to risk management
PERT durations/costs use 3-point estimates ◦ a = best case (5% chance or better) ◦ m = most likely (90%) ◦ b = worst case (5%)
PERT uses a Beta Distribution8 ◦ Mean = (a+4m+b) / 6
“Modern” formula is .63 * m + .185*(a+b) corrects for lack of true min and max
◦ Variance = (b-a/6)2 “Modern” formula is (b-a/3.25)2
◦ Standard Deviation = b-a/6 “Modern” is b-a/3.25
8. Source of PERT information: Anderson, M.A and Anderson E.G. (2015) lecture materials from the course
Technology Enterprise Design and Implementation at the University of Texas at Austin.
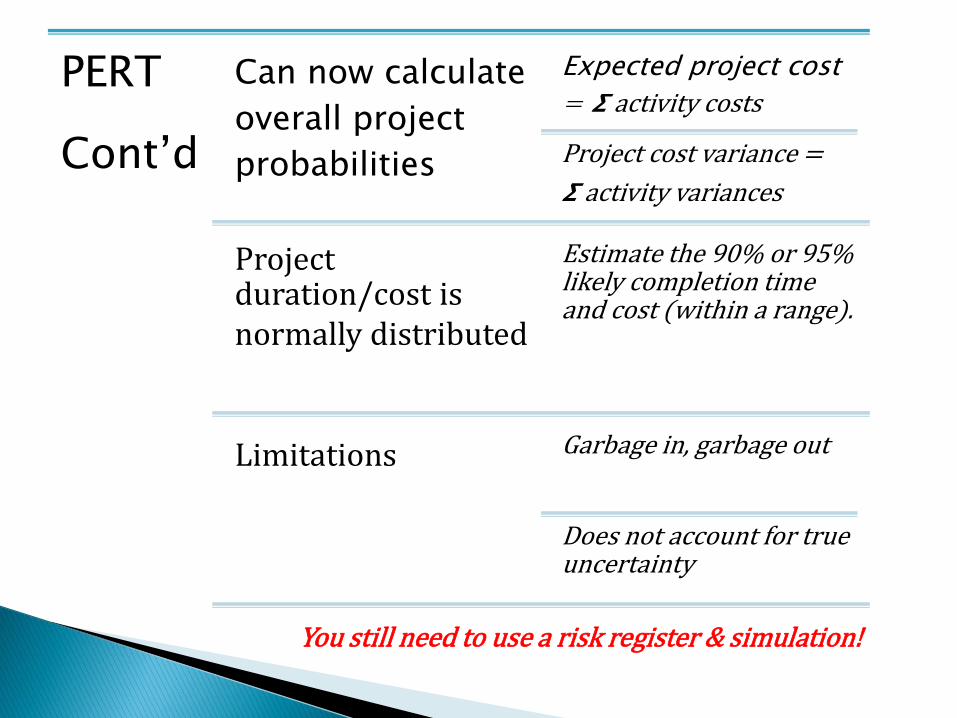
You still need to use a risk register & simulation!
PERT
Cont’d
Can now calculate
overall project
probabilities
Expected project cost
= 𝞢 activity costs
Project cost variance =
𝞢 activity variances
Project duration/cost is normally distributed
Estimate the 90% or 95% likely completion time and cost (within a range).
Limitations Garbage in, garbage out
Does not account for true uncertainty
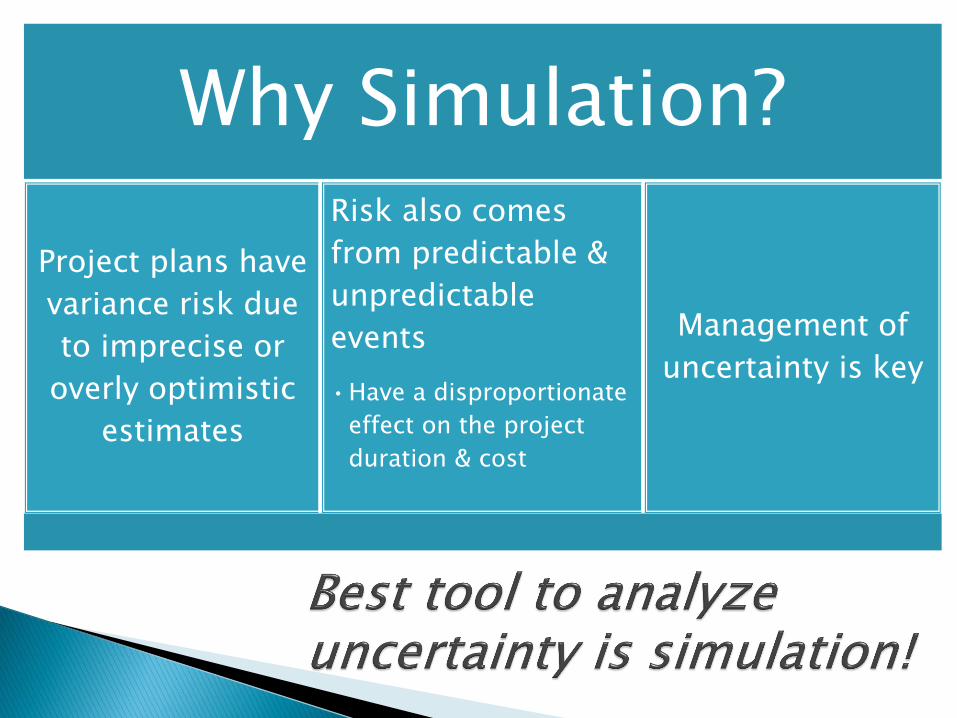
Why Simulation?
Project plans have
variance risk due
to imprecise or
overly optimistic
estimates
Risk also comes
from predictable &
unpredictable
events
•Have a disproportionate
effect on the project
duration & cost
Management of
uncertainty is key
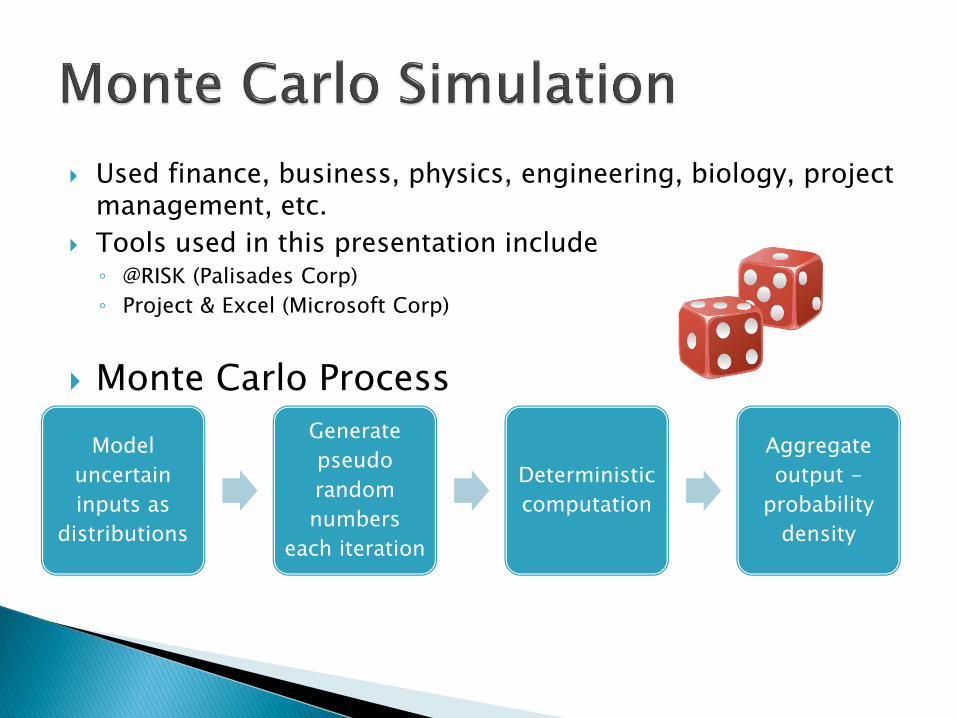
Used finance, business, physics, engineering, biology, project management, etc.
Tools used in this presentation include ◦ @RISK (Palisades Corp)
◦ Project & Excel (Microsoft Corp)
Monte Carlo Process
Model
uncertain
inputs as
distributions
Generate
pseudo
random
numbers
each iteration
Deterministic
computation
Aggregate
output -
probability
density

A Trivial Example ◦ Roll two 6-sided die
◦ Output is sum of dice
◦ After 1000 iterations, results show probabilities
Die 1
=RiskDiscrete({1,2,3,4,5,6},{0.166666667,0.166666667,0.166666667,0.166666667,0.166666667,0.166666667},RiskStatic(1))
Die 2
=RiskDiscrete({1,2,3,4,5,6},{0.166666667,0.166666667,0.166666667,0.166666667,0.166666667,0.166666667},RiskStatic(1))
Sum =RiskOutput("Sum")+SUM(B2:B3)

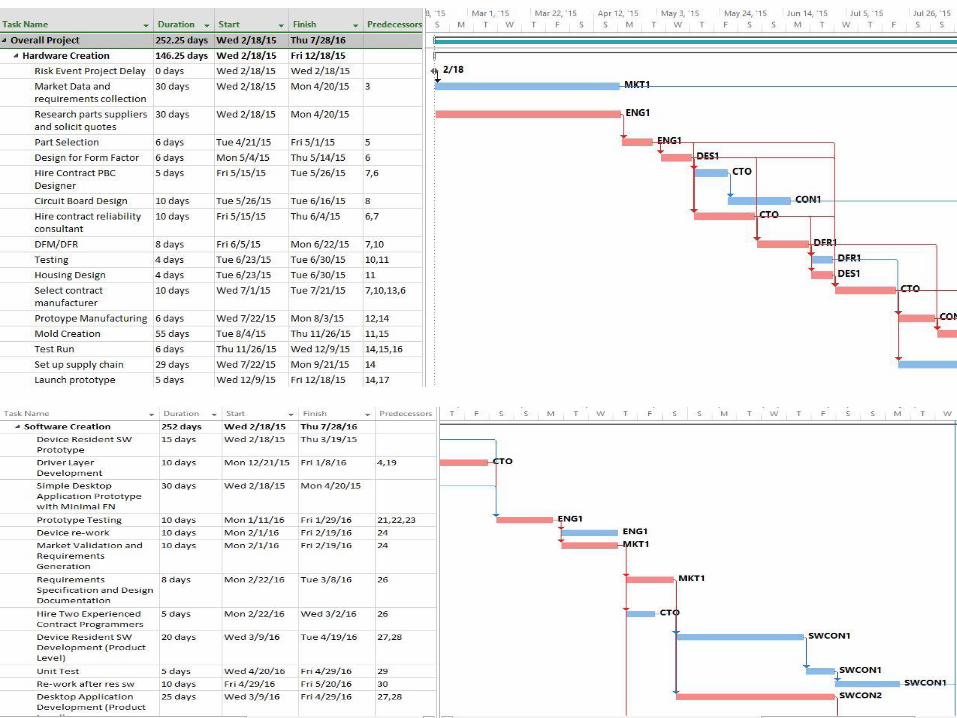
Sample Project Simulation
Background schematic image courtesy of InvenSense
Proj Plan courtesy of Kibbe, Pfau, Reber, Shields, Tulkoff (2015)
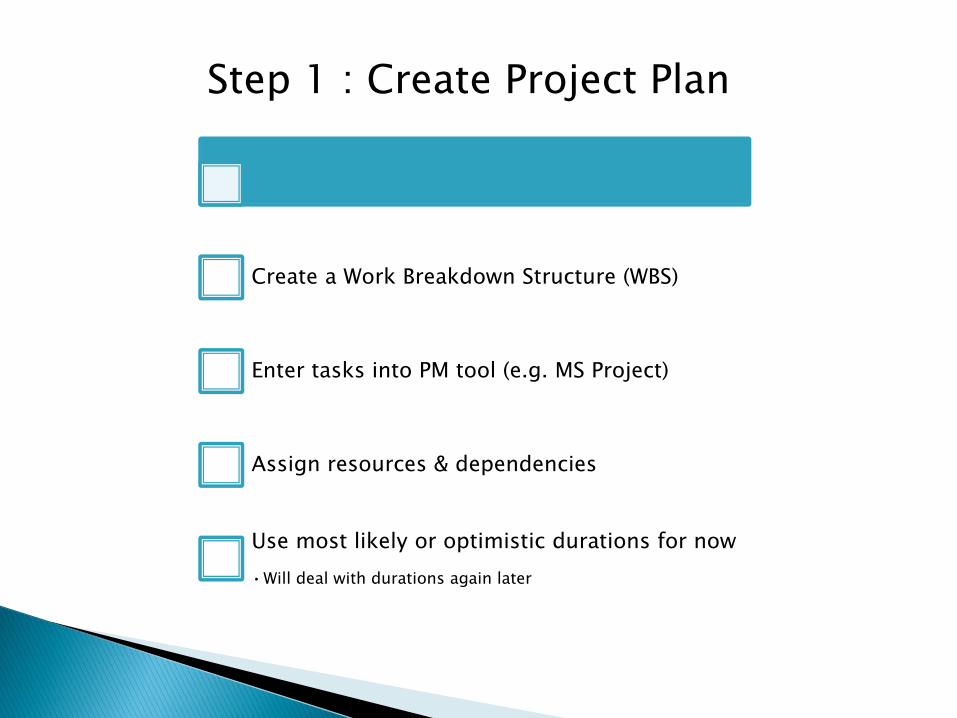
Step 1 : Create Project Plan
Create a Work Breakdown Structure (WBS)
Enter tasks into PM tool (e.g. MS Project)
Assign resources & dependencies
Use most likely or optimistic durations for now
•Will deal with durations again later
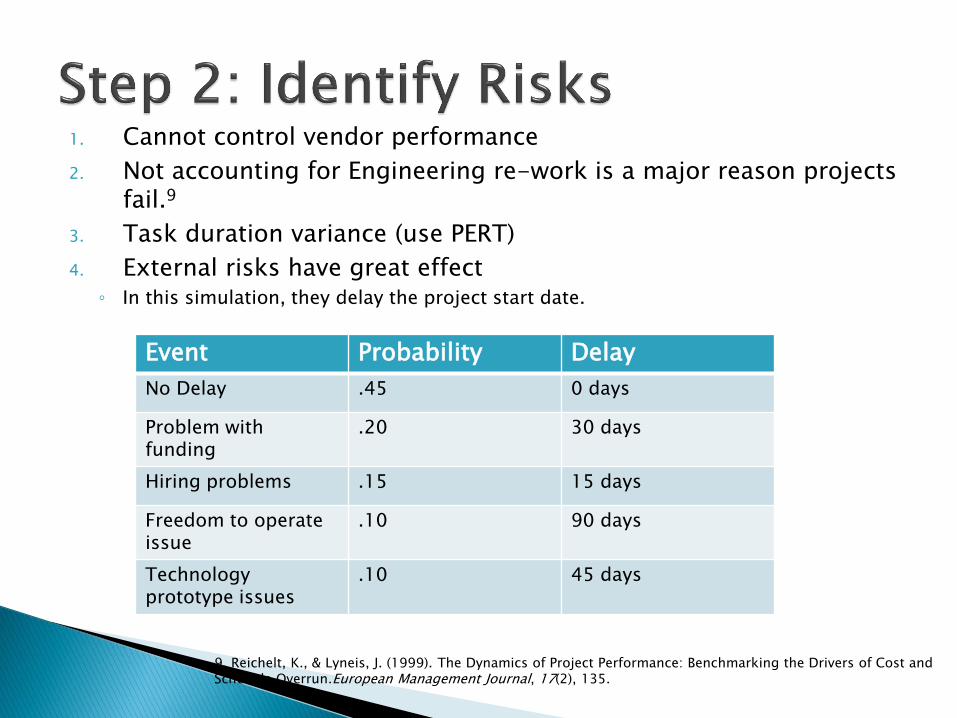
1. Cannot control vendor performance
2. Not accounting for Engineering re-work is a major reason projects fail.9
3. Task duration variance (use PERT)
4. External risks have great effect ◦ In this simulation, they delay the project start date.
Event Probability Delay
No Delay .45 0 days
Problem with funding
.20 30 days
Hiring problems .15 15 days
Freedom to operate issue
.10 90 days
Technology prototype issues
.10 45 days
9. Reichelt, K., & Lyneis, J. (1999). The Dynamics of Project Performance: Benchmarking the Drivers of Cost and Schedule Overrun.European Management Journal, 17(2), 135.
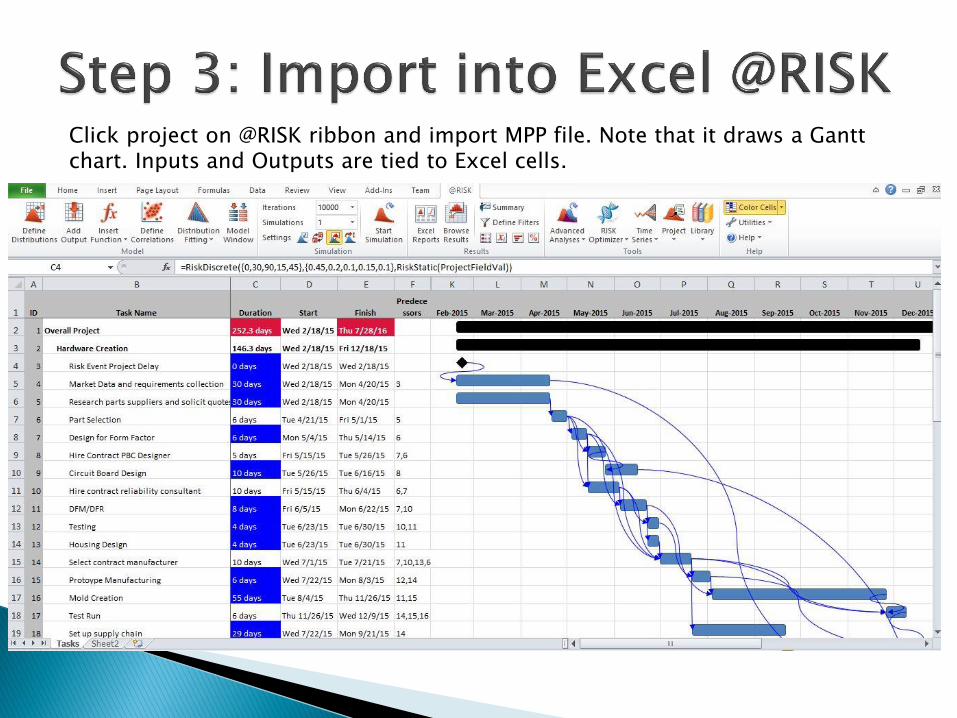
Click project on @RISK ribbon and import MPP file. Note that it draws a Gantt chart. Inputs and Outputs are tied to Excel cells.
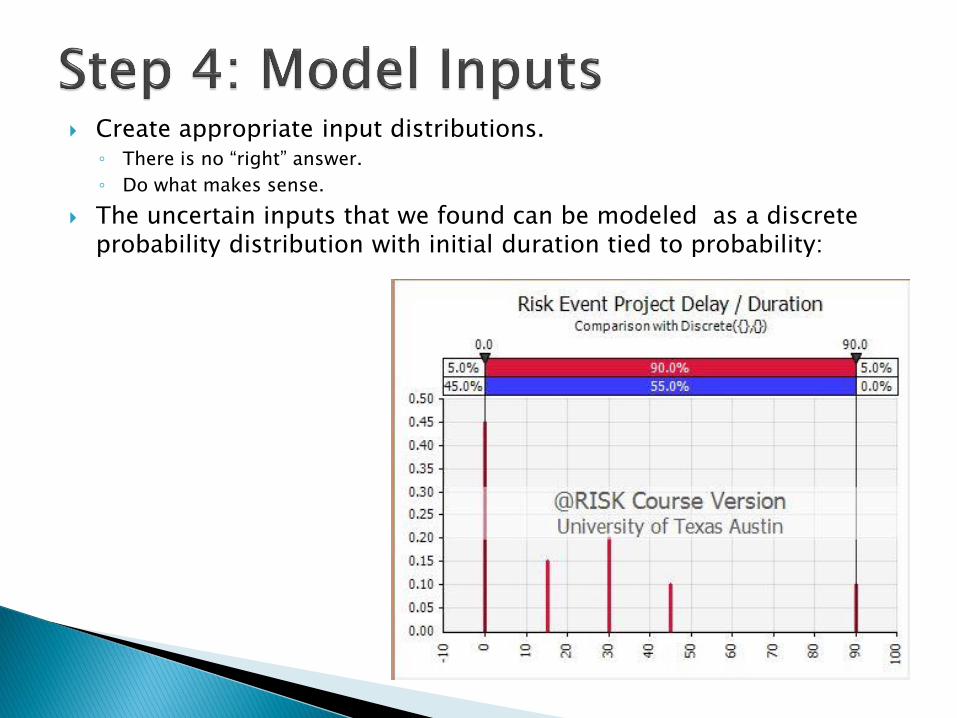
Create appropriate input distributions. ◦ There is no “right” answer.
◦ Do what makes sense.
The uncertain inputs that we found can be modeled as a discrete probability distribution with initial duration tied to probability:
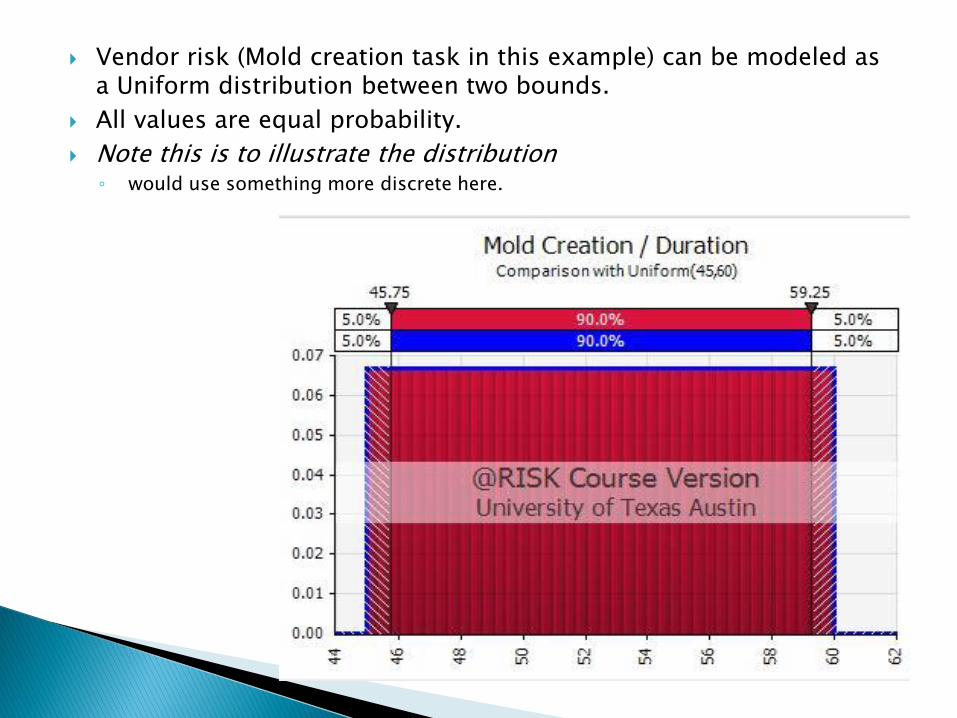
Vendor risk (Mold creation task in this example) can be modeled as a Uniform distribution between two bounds.
All values are equal probability.
Note this is to illustrate the distribution ◦ would use something more discrete here.
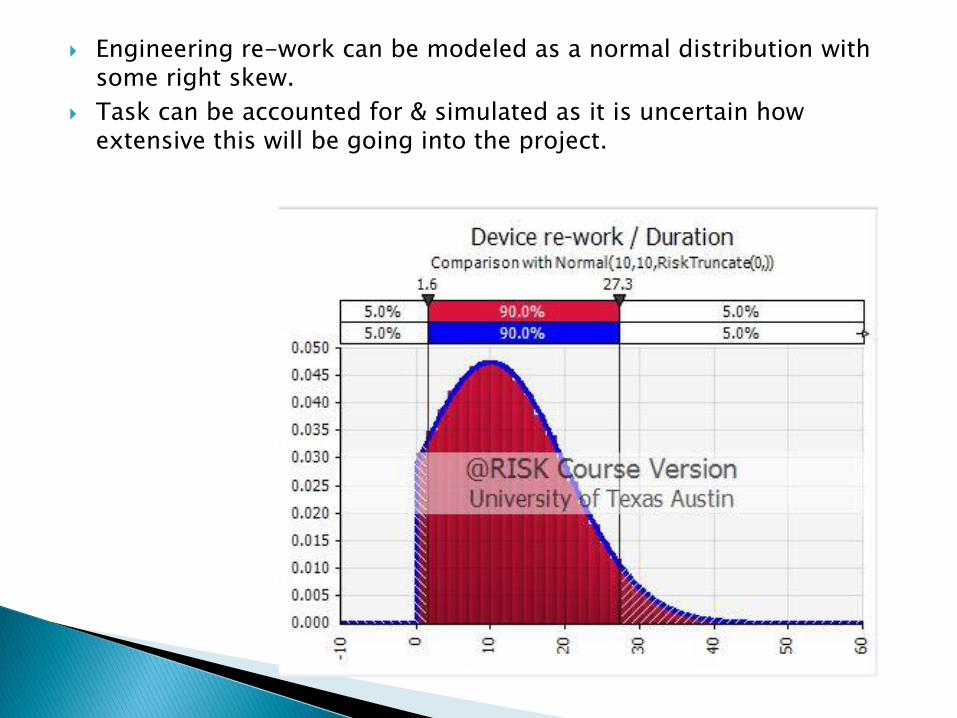
Engineering re-work can be modeled as a normal distribution with some right skew.
Task can be accounted for & simulated as it is uncertain how extensive this will be going into the project.
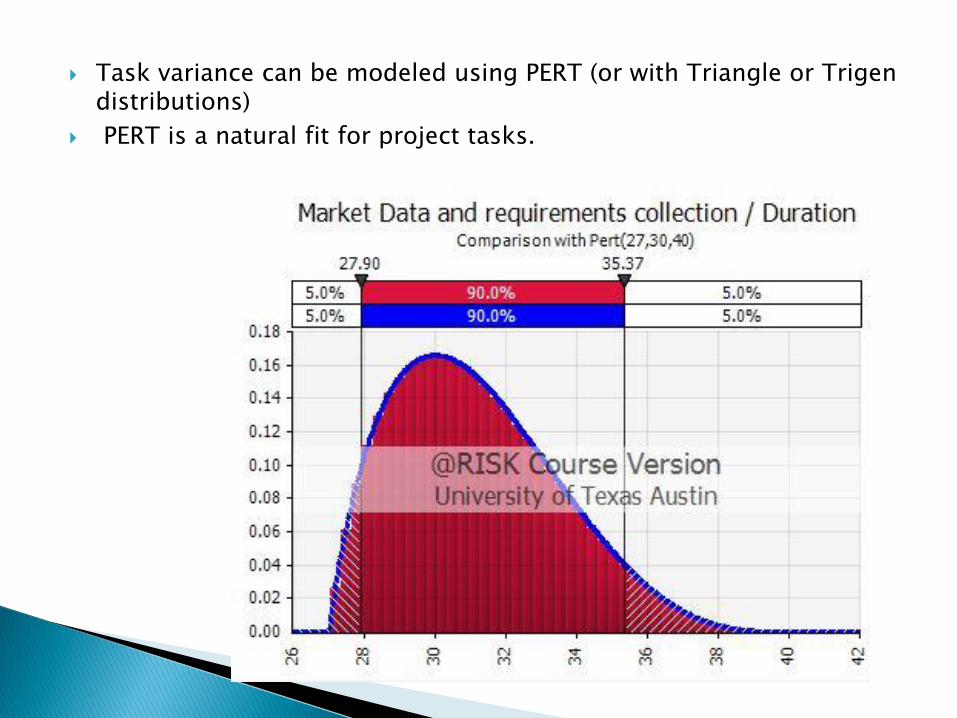
Task variance can be modeled using PERT (or with Triangle or Trigen distributions)
PERT is a natural fit for project tasks.
Step 5: Add Outputs, Run simulation
•Outputs are tied to cells with data that varies
based on varying inputs
•Flexibility to also tie values to additional Excel
data, formulas, conditionals
•May run simulation using multiple scenarios &
perform sensitivity analysis
•Should run at least 1000 iterations
•10k is better
•Directly integrated with Project – uses Project’s
scheduling engine each iteration
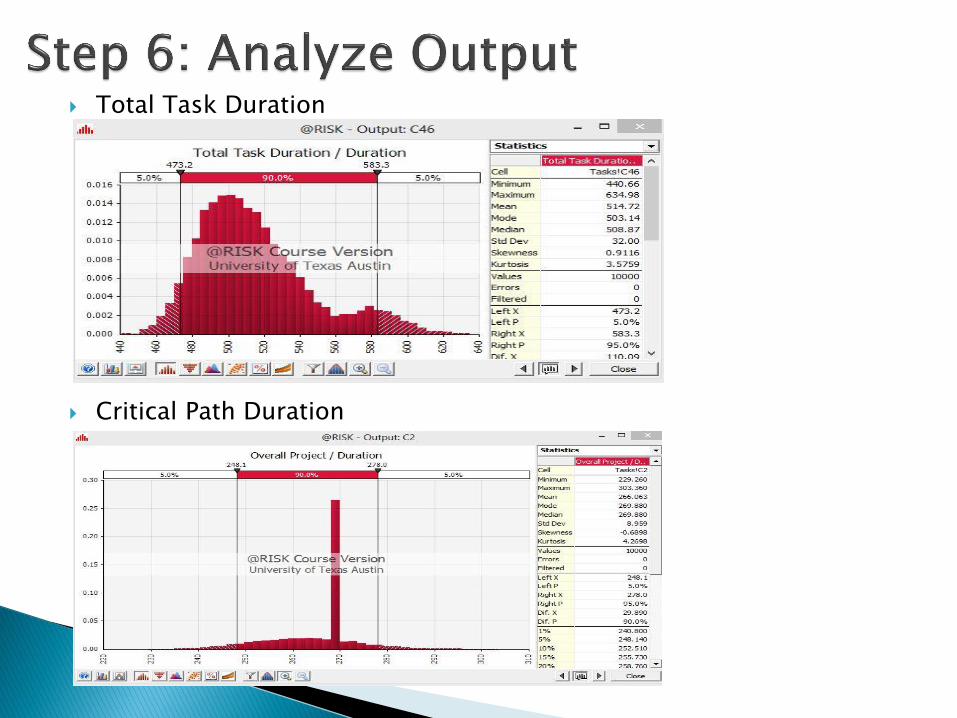
Total Task Duration
Critical Path Duration
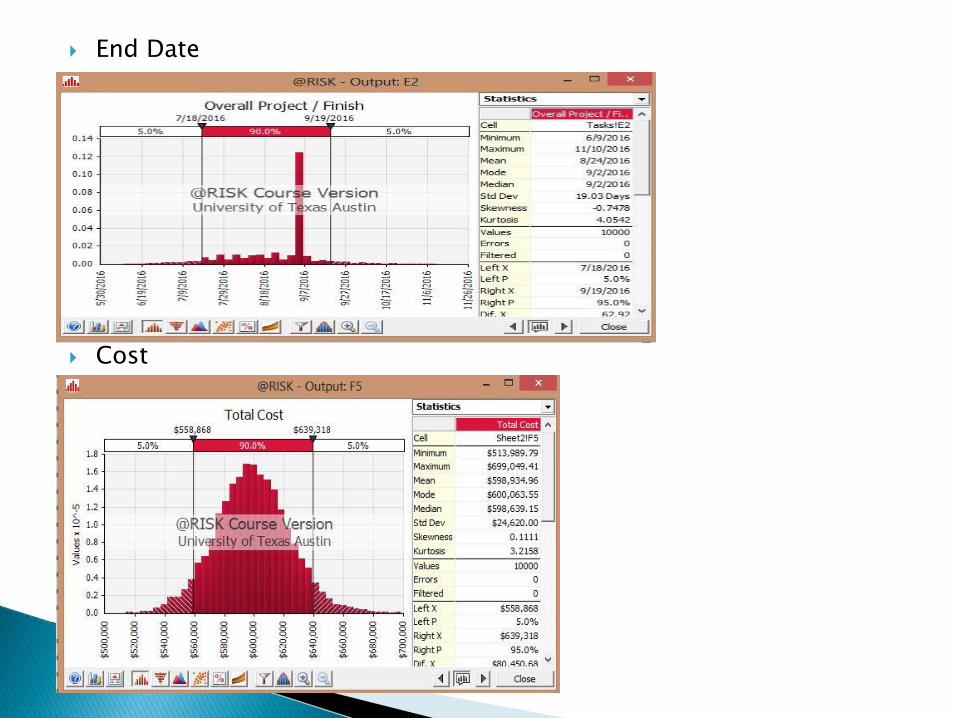
End Date
Cost
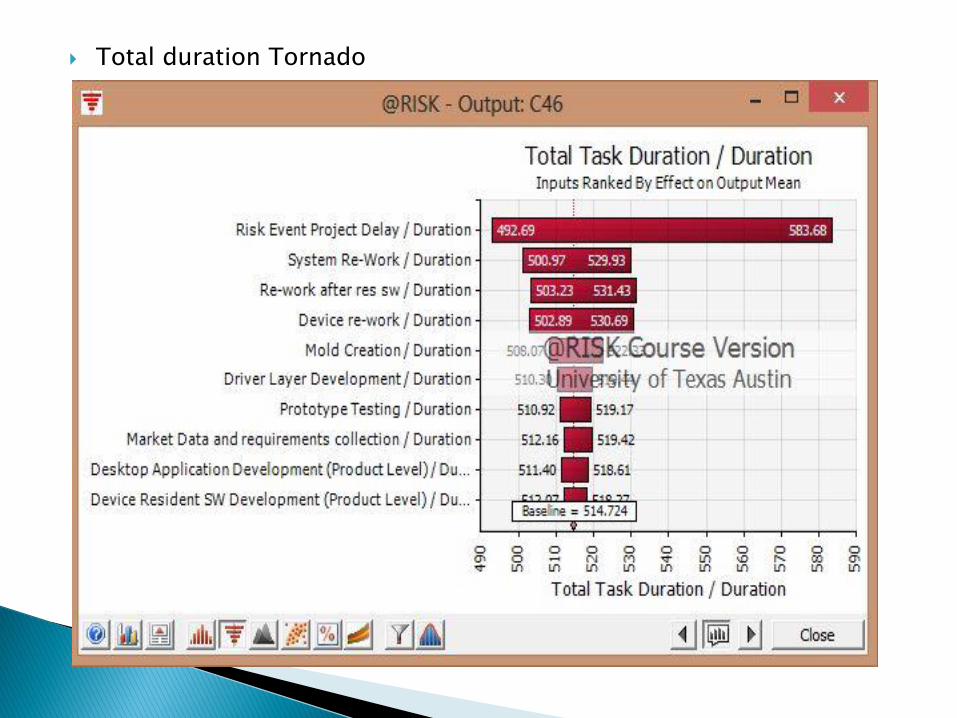
Total duration Tornado
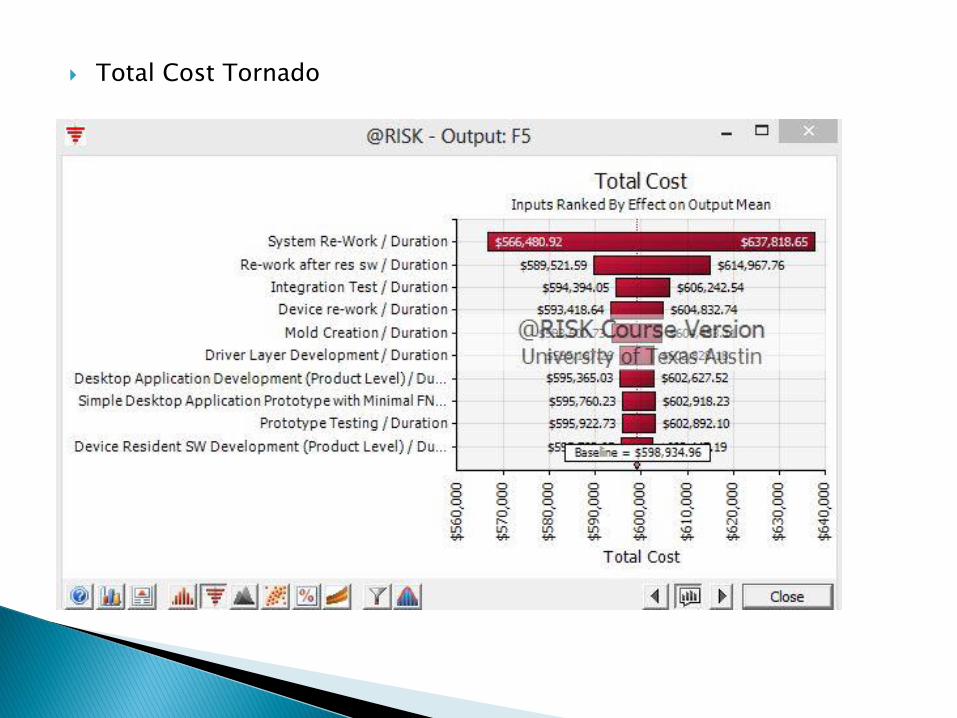
Total Cost Tornado
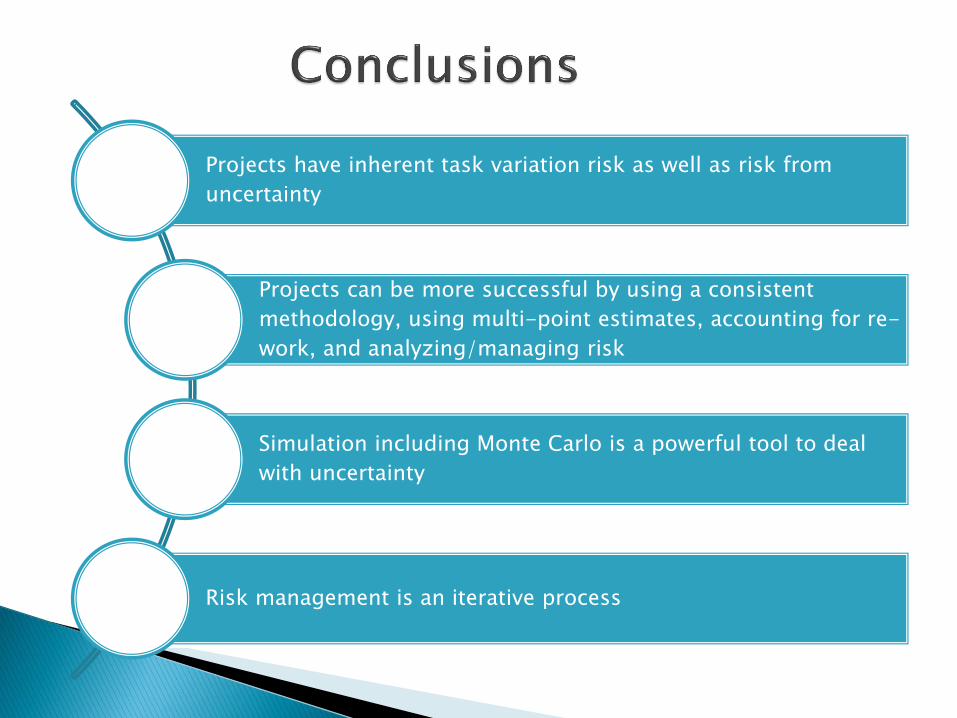
Projects have inherent task variation risk as well as risk from
uncertainty
Projects can be more successful by using a consistent
methodology, using multi-point estimates, accounting for re-
work, and analyzing/managing risk
Simulation including Monte Carlo is a powerful tool to deal
with uncertainty
Risk management is an iterative process

Mike Tulkoff is a Software Engineer with over twenty years of delivering Enterprise Computing solutions. He has spent his career building great products that satisfy market needs and has had technical and managerial roles at both large, global companies and small start-ups. Mike has 12 U.S. patents and holds an MS in Technology Commercialization from the University of Texas at Austin McCombs School of Business and a BS in Computer Science from Georgia Institute of Technology.
Please feel free to contact Mike at [email protected] with additional questions, discussion, or consulting inquiries.