improved groundwater resource management through …€¦ · resource management through better...
TRANSCRIPT
Improved groundwater resource management through better groundwater monitoring
A review of groundwater monitoring
Volume 1 – Main report
By
A. M. Kern and S. L. Johnson
Department of Water
Hydrogeology Report Series
Report no. HR268
April 2009

Department of Water 168 St Georges Terrace Perth Western Australia 6000 Telephone +61 8 6364 7600 Facsimile +61 8 6364 7601 www.water.wa.gov.au
© Government of Western Australia 2009
April 2009
This work is copyright. You may download, display, print and reproduce this material in unaltered form only (retaining this notice) for your personal, non-commercial use or use within your organisation. Apart from any use as permitted under the Copyright Act 1968, all other rights are reserved. Requests and inquiries concerning reproduction and rights should be addressed to the Department of Water.
For more information about this report, contact Senior Hydrogeologist, Alex Kern, (08) 6364 6838
The recommended reference is:
Kern AM and Johnson SL, 2009, Improved groundwater resource management through better groundwater monitoring – A review of groundwater monitoring, Department of Water, Hydrogeology Report Series, HR268.
A review of groundwater monitoring HR268
Department of Water iii
Contents Contents......................................................................................................................iii
Executive Summary ...................................................................................................vii
1 Introduction ............................................................................................................. 9
1.1 Agency vision and strategy................................................................................................ 9 1.2 Importance of groundwater to Western Australia.............................................................. 9
1.2.1 Distribution .....................................................................................................................................9 1.2.2 Storage.........................................................................................................................................10 1.2.3 Development and utilisation .........................................................................................................10 1.2.4 Economic benefit ..........................................................................................................................11 1.2.5 Environmental value.....................................................................................................................11
1.3 Business need ................................................................................................................. 12 1.4 Scope and purpose.......................................................................................................... 12
2 The need for groundwater monitoring ................................................................... 14
2.1 Improving groundwater knowledge.................................................................................. 14 2.2 Monitoring dynamic groundwater systems...................................................................... 16
2.2.1 Frequency of water level measurements......................................................................................17 2.2.2 Water level trends.........................................................................................................................18
2.3 Other groundwater monitoring......................................................................................... 21 2.3.1 Groundwater quality .....................................................................................................................21 2.3.2 Groundwater dependent ecosystems...........................................................................................23
3 History of groundwater monitoring program.......................................................... 24
3.1 Ownership of monitoring in State government ................................................................ 25 3.1.1 Metropolitan Water Authority and Public Works Department........................................................26 3.1.2 Water Authority of Western Australia............................................................................................26 3.1.3 Water and Rivers Commission .....................................................................................................26 3.1.4 Department of Water ....................................................................................................................27
4 Regional groundwater monitoring needs and priorities ......................................... 29
4.1 Swan Region.................................................................................................................... 29 4.1.1 Priority ..........................................................................................................................................30 4.1.2 Current monitoring........................................................................................................................31 4.1.3 Gaps.............................................................................................................................................31 4.1.4 Recommended monitoring ...........................................................................................................32
4.2 South West Region.......................................................................................................... 32 4.2.1 Priority ..........................................................................................................................................33 4.2.2 Current monitoring........................................................................................................................33 4.2.3 Gaps.............................................................................................................................................34 4.2.4 Recommended monitoring ...........................................................................................................34
4.3 Mid West (Geraldton) Region .......................................................................................... 34 4.3.1 Priority ..........................................................................................................................................35 4.3.2 Current monitoring........................................................................................................................35 4.3.3 Gaps.............................................................................................................................................36 4.2.4 Recommended monitoring ...........................................................................................................36
4.4 Mid West (Carnarvon) Region ......................................................................................... 36 4.4.1 Priority ..........................................................................................................................................37 4.4.2 Current monitoring........................................................................................................................37 4.4.3 Gaps.............................................................................................................................................38 4.4.4 Recommended monitoring ...........................................................................................................38

HR268 A review of groundwater monitoring
____________________________________________________________________________________________________________
iv Department of Water
4.5 North West (Pilbara) Region............................................................................................ 38 4.5.1 Priority ..........................................................................................................................................39 4.5.2 Current monitoring........................................................................................................................39 4.5.3 Gaps.............................................................................................................................................39 4.5.4 Recommended monitoring ...........................................................................................................39
4.6 North West (Kimberley) Region....................................................................................... 40 4.6.1 Priority ..........................................................................................................................................40 4.6.2 Current monitoring........................................................................................................................40 4.6.3 Gaps.............................................................................................................................................41 4.6.4 Recommended monitoring ...........................................................................................................41
4.7 South Coast Region......................................................................................................... 41
5 The groundwater monitoring network.................................................................... 43
5.1 Methodology .................................................................................................................... 43 5.2 Review findings................................................................................................................ 45
5.2.1 Bores in the GWAN ......................................................................................................................45 5.2.2 Number of GWAN bores...............................................................................................................46 5.2.3 Classification of GWAN bores ......................................................................................................47 5.2.4 Number of project bores ...............................................................................................................47 5.2.5 Bore distribution ...........................................................................................................................48 5.2.6 Duplication of monitoring ..............................................................................................................48 5.2.7 Aquifer names ..............................................................................................................................49
5.3 Review of monitoring frequency ...................................................................................... 49
6 Evaluation of automated water level technology................................................... 50
6.1 Overview of data loggers................................................................................................. 51 6.2 Types of data loggers ...................................................................................................... 51 6.3 Wireless download of data loggers.................................................................................. 52 6.4 Telemetry ......................................................................................................................... 52 6.5 Trials using data loggers.................................................................................................. 53 6.6 Considerations in implementing data loggers ................................................................. 54
6.6.1 Cost of data loggers .....................................................................................................................54 6.6.2 Life of data loggers.......................................................................................................................55 6.6.3 Maintenance.................................................................................................................................56 6.6.4 Downloading time.........................................................................................................................56 6.6.5 Processing....................................................................................................................................56 6.6.6 Cost benefit analysis ....................................................................................................................57 6.6.7 Implementation approach .............................................................................................................57
7 Improved groundwater monitoring – a staged approach....................................... 59
7.1 Existing monitoring practice............................................................................................. 60 7.1.1 Water level monitoring..................................................................................................................60 7.1.2 Automated measurement .............................................................................................................60 7.1.3 Water quality monitoring...............................................................................................................61 7.1.4 Data management........................................................................................................................61
7.2 Enhanced manual measurement – Stage 1.................................................................... 62 7.2.1 Staff requirements ........................................................................................................................63
7.3 Incorporating automated measurement – Stage 2.......................................................... 63 7.3.1 Schedule of installation of data loggers........................................................................................64 7.3.2 Staff requirements ........................................................................................................................65
8 The proposed groundwater monitoring program................................................... 71
8.1 Program cost and benefit................................................................................................. 71

A review of groundwater monitoring HR268
Department of Water v
8.2 Timing .............................................................................................................................. 72 8.3 Resources........................................................................................................................ 72
8.4.1 Staff levels....................................................................................................................................72 8.4.2 External contractors......................................................................................................................73
8.4 Program coordination ...................................................................................................... 73 8.5 Program outcomes and risks........................................................................................... 74 8.6 Stakeholder awareness ................................................................................................... 74
8.7.1 Internal stakeholders ....................................................................................................................74 8.7.2 External stakeholders ...................................................................................................................76
9 Conclusions .......................................................................................................... 77
10 Recommendations ................................................................................................ 79
11 References............................................................................................................ 80
Appendices (all removed from document due to size)
APPENDIX A Groundwater monitoring network – Swan RegionError! Bookmark not defined.
APPENDIX B Groundwatyer monitoring network – South West RegionError! Bookmark not defined.
APPENDIX C Groundwater monitoring network – Mid West (Geraldton) RegionError! Bookmark not defined.
APPENDIX D Groundwater monitoring network – Mid West (Carnarvon) RegionError! Bo okmark not defined.
APPENDIX E Groundwater monitoring network – North West (Pilbara) RegionError! Bookmark not defined.
APPENDIX F Groundwater monitoring network – North West (Kimberley) RegionError! Bookmark not defined.
APPENDIX G Operational expenses for manual measurementError! Bookmark not defined.
Plates
Plates 1- 17 Detailed maps of GWAN monitoring bores ........................................ 107
Figures
Figure 1. Historical water use and demand projections ............................................. 3
Figure 2. Increasing need for monitoring relative to groundwater usage.................... 6
Figure 3. The process for improving groundwater resources knowledge ................... 7
Figure 4. Hydrograph of bore AM42......................................................................... 11
Figure 5. Hydrograph of bore Irwin View OB11-77................................................... 11
Figure 6. Hydrograph of bore Robe River 6A........................................................... 12
Figure 7. Hydrograph of bore Cowaramup Line CL3W ............................................ 12
Figure 8. Hydrograph of bore Cowaramup Line CL5A3 ........................................... 13
Figure 9. Hydrograph for bore Artesian Monitoring AM39........................................ 16
Figure 10. Groundwater monitoring (1970 to 2007) ................................................. 17
Figure 11. GWAN bore distribution .......................................................................... 40

HR268 A review of groundwater monitoring
____________________________________________________________________________________________________________
vi Department of Water
Figure 12. Groundwater allocation ........................................................................... 40
Figure 13. Water level response in shallow watertable bore .................................... 46
Figure 14. Water level response in deeper surperficial aquifer bore ........................ 46
Tables
Table 1. Priority groundwater areas determined by MAP process....................... 22
Table 2. Recommended groundwater monitoring in Swan Region...................... 24
Table 3. Recommended groundwater monitoring in South West Region ............ 26
Table 4. Recommended groundwater monitoring in Mid West (Geraldton)
Region ................................................................................................... 28
Table 5. GWAN monitoring bores (as at 1 March 2009)...................................... 38
Table 6. Comparative prices of data loggers ....................................................... 47
Table 7. Required frequency for manual water level monitoring.......................... 55
Table 8. Staff and funding requirements for manual measurement..................... 56
Table 9. Schedule for installation data loggers.................................................... 58
Table 10a. Staff requirements for one download per year....................................... 60
Table 10b. Staff requirements for two downloads per year ..................................... 60
Table 10c. Staff requirements for four downloads per year..................................... 60
Table 11. Number of data logger traces ................................................................ 61
Table 12. Staff requirements for automated measurement ................................... 63
Table 13. Cost schedule for installing 500 data loggers per year .......................... 64
Table 14. Cost schedule for automated measurement.......................................... 64
Table 15. Cost schedule for proposed groundwater monitoring program.............. 68

A review of groundwater monitoring HR268
Department of Water vii
Executive Summary
An appropriate groundwater monitoring program is necessary for the Department of Water to manage groundwater resources throughout Western Australia. Groundwater level monitoring is an integral and arguably the most important component of groundwater management, as it is the only way of monitoring resource condition. The report outlines the current extent of and a future direction for groundwater monitoring.
Western Australia is highly dependent on groundwater for water supply, mining and large component of irrigated agriculture. The impact of climate change has led to an increased dependency on groundwater resources, which requires a better understanding of these resources across the State and, in turn, requires improved groundwater monitoring.
Groundwater monitoring underpins the sustainable management of groundwater resources across the State. The acquisition and interpretation of monitoring data provides the scientific understanding of groundwater resource sustainability and measure of the Department’s management approach. Consequently, the Department’s role in sustainable assessment can only be maintained if there is appropriate data collection.
The objective of the groundwater monitoring program is the collection of adequate water level data for current and future resource management. The frequency of groundwater monitoring must align with the increasing demand for the resource and be appropriate for future needs of the Department as it moves towards ‘adaptive management’ and ‘managing to acceptable impact’.
There are a number of costs and risks if groundwater monitoring is not undertaken. This includes under-utilisation of the groundwater resources forgoing economic benefit through hindering State development, or over-utilisation of the resources requiring reductions in licensed groundwater usage.
Using results from the Management Area Prioritisation (MAP) process, the different regions were ranked and prioritised for their groundwater monitoring needs. The Swan Region is considered the highest priority in the State. This is followed by the South West, Mid West (Geraldton), Mid West (Carnarvon), Pilbara, Kimberley and then the South Coast region. Attached are regional descriptions detailing groundwater resource pressures, current monitoring and gaps for each region.
There has been a comprehensive assessment of more than 9000 bores owned by the Department of Water. It has determined that the regional groundwater monitoring network (or GWAN – Groundwater Assessment Network) comprises 2461 bores in total with 1982 bores (includes 68 staff gauges) currently monitored with all data known, 312 bores currently monitored with data gaps and 167 new bores for inclusion. A further 586 bores require further assessment to determine inclusion, while 194 bores could be removed due to overlap or position within water supply

HR268 A review of groundwater monitoring
____________________________________________________________________________________________________________
viii Department of Water
borefields. The Department owns about 6200 project bores that were installed as short-term investigation bores that are not included in the GWAN.
The use of automated groundwater measurement is seen as critical to improving understanding. More frequent data collection will allow better groundwater model calibration, confirm aquifer performance and response, and determine connectivity between aquifers and groundwater dependent ecosystems.
Since the mid-1990s, the decline in groundwater level monitoring is counter to the trend of increasing groundwater abstraction and reflects an inability to adequately monitor the impacts of groundwater abstraction which the Department licenses. The existing budget for groundwater monitoring in 2008/09 is less than $300,000, which is inadequate to meet current needs.
An improved groundwater monitoring program will have unquantifiable benefits by increasing knowledge of groundwater resources, providing confidence in monitoring data, and offering better monitoring data to stakeholders. Given the Department of Water’s requirements and obligations under the National Water Initiative, the implementation of automated groundwater level measurement aligns with the Bureau of Meteorology’s approach to more comprehensive groundwater resource assessments.
Department of Water 9
1 Introduction
1.1 Agency vision and strategy
The Department of Water is responsible for the management of water resources in Western Australia. In order to meet this management objective, under the Rights in Water and Irrigation Act, the Department issues licences, regulates water use, protects quantity and quality of water resources, and prepares policies and water allocation plans to meet current and future needs for Western Australia. These functions can only be successfully completed with a robust understanding and monitoring of the State’s water resources.
The concept of sustainable groundwater management can only be achieved with the ability to adequately monitor changes in these systems. The Department is required to monitor the response and performance of groundwater resources, in order to make more-informed decisions in groundwater management and measure the success of its management approach. Therefore, a strategic groundwater monitoring program is critically important and underpins the groundwater management process.
1.2 Importance of groundwater to Western Australia
Water is vitally important for human activities, and for the maintenance of the environment in which all Australians live. Western Australia is the second driest State in the driest continent of the world, yet the availability of water for the wide range of domestic, agricultural and industrial usage is commonly taken for granted.
There is poor awareness of how small the State’s water resources are in relation to the potential demands that may be placed upon them. The importance of these resources is only highlighted for the wider community when issues arise, such as droughts, which raise community awareness. These are usually temporary occurrences and for most of the time, the community takes the availability of water for granted and is generally unaware of the need for careful management of the available resources. Awareness of limited groundwater resources is increasing as more subareas reach full allocation, and licence applications are refused.
1.2.1 Distribution
Although groundwater is unevenly distributed in terms of its availability and quality, it has a much wider occurrence over the State than surface water. Major fresh groundwater resources occur in the south west of the State associated with the Perth Basin, but there are significant fresh, brackish and saline resources throughout most of the remainder.
10 Department of Water
1.2.2 Storage
The volume of groundwater held in storage is commonly between twenty and several thousand times larger than its mean annual rate of replenishment (Allen, 1997). It is possible to draw groundwater from storage with considerable independence from the effects of irregular rainfall. This is a valuable attribute for water resources management, especially in areas of arid climate, such as over the major part of Western Australia. Nevertheless, in the long term, the abstraction of groundwater should generally not exceed the rate of replenishment and impacts on the environment must be managed at acceptable levels. Monitoring storage levels therefore assumes an increasing importance, particularly in view of the requirements for annual water accounts.
1.2.3 Development and utilisation
Groundwater resources can readily be developed incrementally to meet growing water supply demands. Thus, it is possible to install borefields initially to meet the immediate water demands and later extend them as required. This incremental development has a significant financial advantage as it also stages the need for capital expenditure. It contrasts with the development of surface water resources, which generally require major capital expenditure for storage construction, often some years before consumption is likely to reach supply capacity.
Groundwater provides about two-thirds of all water used in the State (Water and Rivers Commission, 2000) and is the only available, readily exploitable source of water over about 60% of Western Australia. There are many rural and mining towns as well as Aboriginal communities that also rely on groundwater as the main source of public water supply. Groundwater is the principal source of water supply for mining operations, where it is used for mineral processing and dust suppression. It is the source of about 60% of all water used for irrigation, especially in the Carnarvon and Gingin areas, and is widely utilised for livestock water supplies.
Figure 1 shows a significant increase in groundwater demand with total groundwater use rising from 371 GL in 1984 and 1138 in 1997 as estimated in Water and Rivers Commission (2000) to 1545 GL in 2008 as estimated by Resource Economics Unit (2009). Resource Economic Unit (2009) confirmed that groundwater usage has increased from 44% in 1984 to 69% in 2008 of total water consumed.
A large proportion of groundwater usage is by the mining industry and irrigated agriculture, as well as for public water supply. Groundwater has also been investigated as a potential source of water for aquaculture, for geothermal energy and as a source of salt.

Department of Water 11
Projections have shown that the reliance on groundwater resources will become greater due to lower rainfall, and that groundwater demand will continue to increase exponentially beyond 2020. The projections, shown in Figure 1, are considered conservative and growth in groundwater demand may be significantly stronger. This trend is highly significant, particularly in light of the impact of a drying climate on water resources in the South West.
Figure 1. Historical water use and demand projections
1.2.4 Economic benefit
A rigorous financial analysis of the value to the entire State of current groundwater use has yet to be carried out. Marsden Jacob Associates (2006) determined that the annual value of groundwater of the Gnangara Mound is $0.91/kL, based on an economic value ($300 million per year) created from using 329 GL/yr of groundwater. Assuming 1545 GL/yr of groundwater use (Resource Economics Unit, 2009) and a nominal value of $0.90/kL placed on that usage, the economic benefit of groundwater to the State could be estimated at about $1.4 billion per year.
1.2.5 Environmental value
Groundwater at shallow depths, for instance on the Swan Coastal Plain, maintains wetlands and their associated flora and fauna. In such areas, the availability of groundwater through the summer supports plant communities and provides water supplies for the wildlife that live there. Groundwater supports native vegetation, particularly trees along stream channels. Groundwater may also discharge into rivers and streams to maintain streamflow during dry periods.
0
500
1000
1500
2000
2500
3000
1900 1910 1920 1930 1940 1950 1960 1970 1980 1990 2000 2010 2020
Year
State Population (000's)
0
500
1000
1500
2000
2500
3000
3500
4000
Water Use (GL/yr)
State Population
Surfacewater Use
Groundwater Use
465
371
1138
660
688
1545
12 Department of Water
1.3 Business need
Given the importance of groundwater resources for the State, water level measurement of the Department’s groundwater monitoring network is a vital function. The need for monitoring will become more critical, as the number of groundwater management areas reach full allocation. The consequences of not improving monitoring are the under-use and potential over-allocation of groundwater resources. The credibility of the government as a groundwater manager will also be challenged, as demonstrated by the previous losses of appeals where there was inadequate understanding and monitoring of the resource.
As the Department becomes more dependent on groundwater modelling for making predictions and supporting its management decisions, there will be a need to improve the frequency of water level monitoring. The more frequent data will assist in evaluating the condition and performance of the groundwater resources, as well as determining connectivity between aquifers and groundwater dependent ecosystems.
Expenditure on the State’s regional groundwater monitoring was the highest in the early 1990s, when it was jointly funded by the State and Federal governments. Funding for groundwater monitoring was rationalised from 1996 due to other groundwater management priorities within the Water and Rivers Commission. The existing groundwater monitoring program is considered grossly inadequate. This proposal aims to address the funding shortfall; outline the minimum requirements of the current monitoring network, and provide a strategy for future groundwater monitoring.
With requirements under the National Water Initiative (NWI) and the new role of the Bureau of Meteorology in water resource assessment, it is an opportune time to review the groundwater monitoring program. This will ensure that the groundwater monitoring program is in line with the Federal Government’s future direction for data provision and water resource assessment. Discussions with Bureau of Meteorology indicate a preference for continuous measurement of water levels rather than time-discrete intervals.
1.4 Scope and purpose
The management of groundwater resources requires a well-planned strategy for groundwater monitoring. This document will outline the collection of groundwater monitoring data in the past, the current situation, and details a more effective and appropriate groundwater monitoring program for the future. The groundwater monitoring review has five main objectives:
1. Underline the role and importance of groundwater level monitoring within the Department’s groundwater management strategies.

Department of Water 13
2. Understand the extent and number of monitoring bores in the regional monitoring bore network, as well as identify those bores required to be retained for long-term water level monitoring.
3. Understand the current groundwater monitoring program and identify where there may be deficiencies or improvements required.
4. Determine future groundwater monitoring requirements to better support management decisions, as well as evaluating the use of new technologies including data loggers and telemetry at strategic bore locations.
The document focuses on water level monitoring of the regional bore network, as this is the primary data source required in determining the response and performance of groundwater resources, and calibration of groundwater models. There is a need for further work to understand the monitoring of water quality and groundwater dependent ecosystems, which is only briefly discussed in Section 2.5.
14 Department of Water
2 The need for groundwater monitoring
An understanding of groundwater resources is essential for water supply planning, design and operation, and increasingly for effective water, land resource and environmental management. Groundwater data and information is required by a wide range of users in all industry sectors, including State, Local, and Commonwealth Government Agencies, consultants, oil and mining companies, drilling contractors, research organisations, land and project developers, educational institutions, and the general public. The Department of Water handles approximately 3300 enquiries per year for groundwater information, of which close to 90% are from the general public.
Groundwater monitoring is a vital function and considered core business of the Department of Water. Monitoring data is essential for assessing the effectiveness of groundwater management objectives, calibration of groundwater models and evaluating the condition of groundwater resources. In order to meet these needs, there has to be an ongoing collection of time-series water level data.
2.1 Improving groundwater knowledge
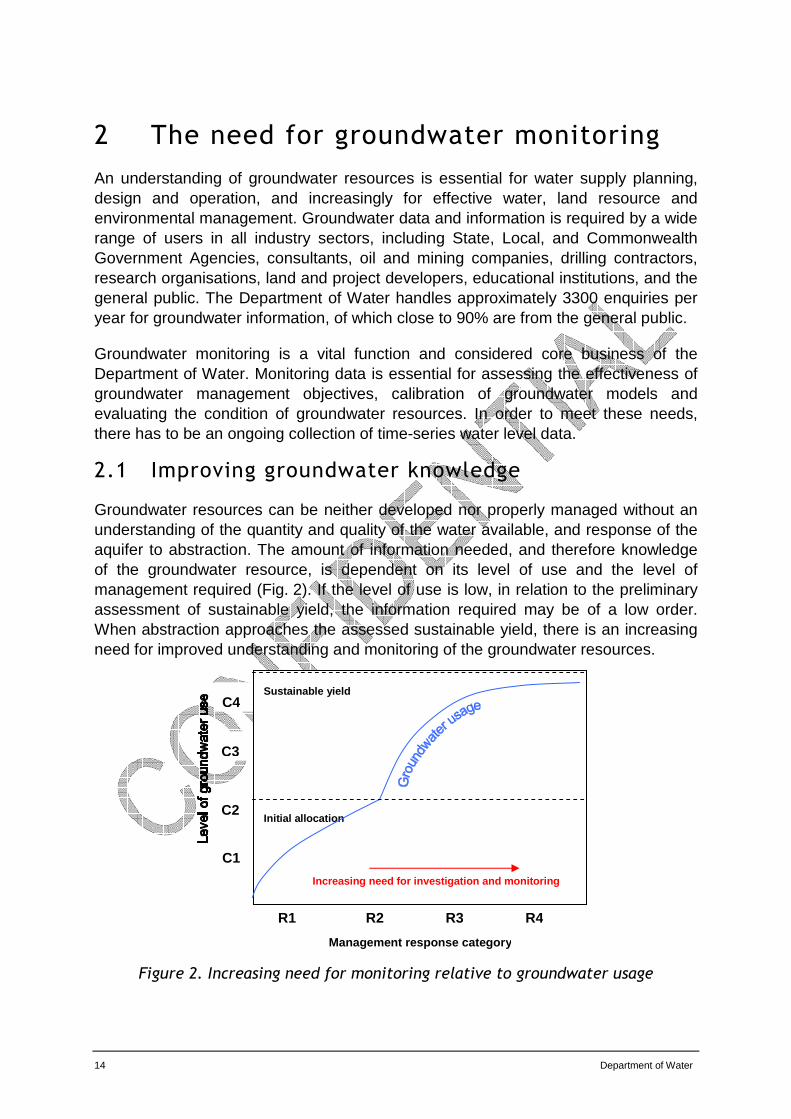
Groundwater resources can be neither developed nor properly managed without an understanding of the quantity and quality of the water available, and response of the aquifer to abstraction. The amount of information needed, and therefore knowledge of the groundwater resource, is dependent on its level of use and the level of management required (Fig. 2). If the level of use is low, in relation to the preliminary assessment of sustainable yield, the information required may be of a low order. When abstraction approaches the assessed sustainable yield, there is an increasing need for improved understanding and monitoring of the groundwater resources.
Figure 2. Increasing need for monitoring relative to groundwater usage
Management response category
C1
C3
C2
C4
R2 R3 R4 R1
Sustainable yield
Initial allocation
Increasing need for investigation and monitoring

Department of Water 15
Groundwater monitoring plays a crucial role in the process of better understanding groundwater resources, as it provides the fundamental time-series water level dataset that is used to support groundwater investigations, assessment and reviews (Fig. 3). The first priority in gaining a better understanding of groundwater resources is through groundwater investigation, which involves the installation of new monitoring bores. This enables the collection of new hydrogeological information to fill previously identified information or knowledge gaps.
Initial assessment of the groundwater resources is generally made based on recharge or throughflow estimation. In more recent years, groundwater resource assessment has involved the use of numerical groundwater models. Groundwater models need to be calibrated so that simulated groundwater levels reflecting known abstraction closely match observed groundwater level changes. From these estimates, a preliminary allocation limit is evaluated. The allocation limit will be refined based on monitoring results and groundwater flow modelling.
(After Johnson et al, 2005)
Figure 3. The process for improving groundwater resources knowledge
Groundwater monitoring is the ongoing collection of time-series water levels and water quality data. The resultant monitoring data is the only way to observe and evaluate the performance of the aquifer. The monitoring may provide for baseline data, or show changes due to abstraction or land use change.
In groundwater systems, it is important to monitor the maximum and minimum water levels. To achieve this in the South West, six measurements a year (being March, April, May, September, October and November) are required to define the seasonal
Monitoring
Collection of water levels data
Review
Determine data gaps
Investigation
Fill data gaps
Resource Assessment
Evaluate allocation limitations
Data storage
Information

16 Department of Water
variation. In the North West, aquifers dependent on periodic river flow from infrequent cyclonic storms often monitored at the end of the dry and end of the wet seasons.
A review of aquifer performance is required on a regular basis to gain advance warning of potential unacceptable impacts, and to ensure that monitoring bores are performing as required. This review process is useful in identifying groundwater management areas that require additional understanding by either investigation and/or assessment.
The storage of monitoring data involving the synthesis and dissemination of information is an essential part of the groundwater knowledge process. These data, new information collected by the Department, and further investigations undertaken by the private sector, assists external proponents in their development of local-scale groundwater models for borefield design.
2.2 Monitoring dynamic groundwater systems
Groundwater systems are dynamic and adjust continually to short-term changes in climate, groundwater abstraction and land use changes. Water level measurements from monitoring bores are the principal source of information about hydraulic change in aquifers. Long-term, systematic measurements of water level provide essential data needed to evaluate changes in the resource over time, to develop groundwater models and forecast trends, and to design, implement, and monitor the effectiveness of groundwater management and protection programs.
Water levels in most aquifers in Western Australia follow a natural cycle pattern of seasonal fluctuation. In the southern portion of the State, water levels typically rise during winter and spring due to greater precipitation and recharge, then decline during the summer and autumn owing to less recharge and greater evaporation. The magnitude of fluctuations in water levels can vary greatly from season to season and from year to year in response to varying climatic conditions. Changes in groundwater recharge and storage caused by climatic variability have a delayed response to cumulative effects of droughts.
Superimposed on natural, climate-related fluctuations in groundwater levels are the effects of human activities that alter the natural rates of groundwater recharge or discharge. For example, urban development, land clearing, and drainage of wetland can expedite surface runoff and thus reduce groundwater recharge. Land clearing, the impoundment of streams, and creation of artificial wetlands can increase groundwater recharge. Long-term water level monitoring during periods of significant land use changes is important to the protection of aquifers. The effects of such human-induced changes on groundwater recharge and storage are often incremental, and the cumulative effects may not become evident for many years. For instance, water levels in the Northern Perth Basin are rising steadily at rates up to 0.5 m/yr and are many years from establishing a new equilibrium.
Department of Water 17
2.2.1 Frequency of water level measurements
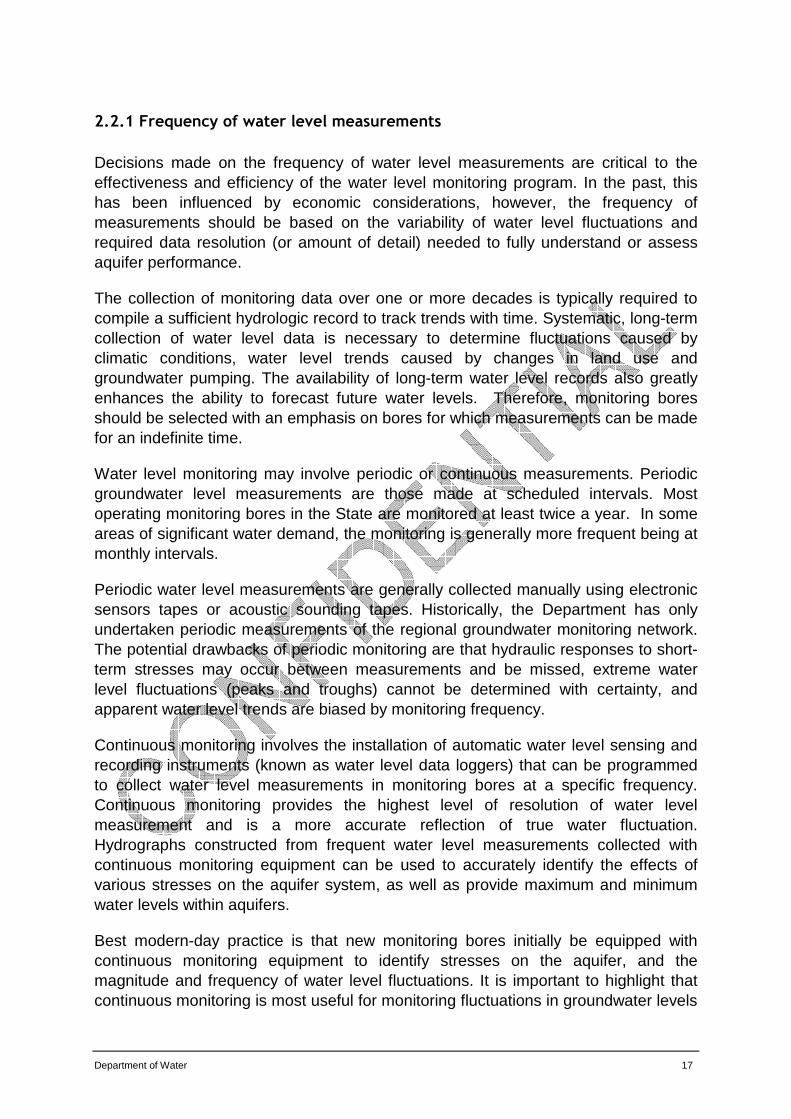
Decisions made on the frequency of water level measurements are critical to the effectiveness and efficiency of the water level monitoring program. In the past, this has been influenced by economic considerations, however, the frequency of measurements should be based on the variability of water level fluctuations and required data resolution (or amount of detail) needed to fully understand or assess aquifer performance.
The collection of monitoring data over one or more decades is typically required to compile a sufficient hydrologic record to track trends with time. Systematic, long-term collection of water level data is necessary to determine fluctuations caused by climatic conditions, water level trends caused by changes in land use and groundwater pumping. The availability of long-term water level records also greatly enhances the ability to forecast future water levels. Therefore, monitoring bores should be selected with an emphasis on bores for which measurements can be made for an indefinite time.
Water level monitoring may involve periodic or continuous measurements. Periodic groundwater level measurements are those made at scheduled intervals. Most operating monitoring bores in the State are monitored at least twice a year. In some areas of significant water demand, the monitoring is generally more frequent being at monthly intervals.
Periodic water level measurements are generally collected manually using electronic sensors tapes or acoustic sounding tapes. Historically, the Department has only undertaken periodic measurements of the regional groundwater monitoring network. The potential drawbacks of periodic monitoring are that hydraulic responses to short-term stresses may occur between measurements and be missed, extreme water level fluctuations (peaks and troughs) cannot be determined with certainty, and apparent water level trends are biased by monitoring frequency.
Continuous monitoring involves the installation of automatic water level sensing and recording instruments (known as water level data loggers) that can be programmed to collect water level measurements in monitoring bores at a specific frequency. Continuous monitoring provides the highest level of resolution of water level measurement and is a more accurate reflection of true water fluctuation. Hydrographs constructed from frequent water level measurements collected with continuous monitoring equipment can be used to accurately identify the effects of various stresses on the aquifer system, as well as provide maximum and minimum water levels within aquifers.
Best modern-day practice is that new monitoring bores initially be equipped with continuous monitoring equipment to identify stresses on the aquifer, and the magnitude and frequency of water level fluctuations. It is important to highlight that continuous monitoring is most useful for monitoring fluctuations in groundwater levels
18 Department of Water
during droughts and other critical periods when hydraulic stresses may change at relatively rapid rates. Near real-time data collection is also possible using telecommunications or radio transmitter equipment.
All new monitoring bores installed as part of the State Groundwater Investigation Program (SGIP) are being equipped with data loggers. This continuous water level monitoring data is considered invaluable for understanding connectivity between aquifers and groundwater ecosystems, responses to rainfall recharge, and calibration of groundwater models.
2.2.2 Water level trends
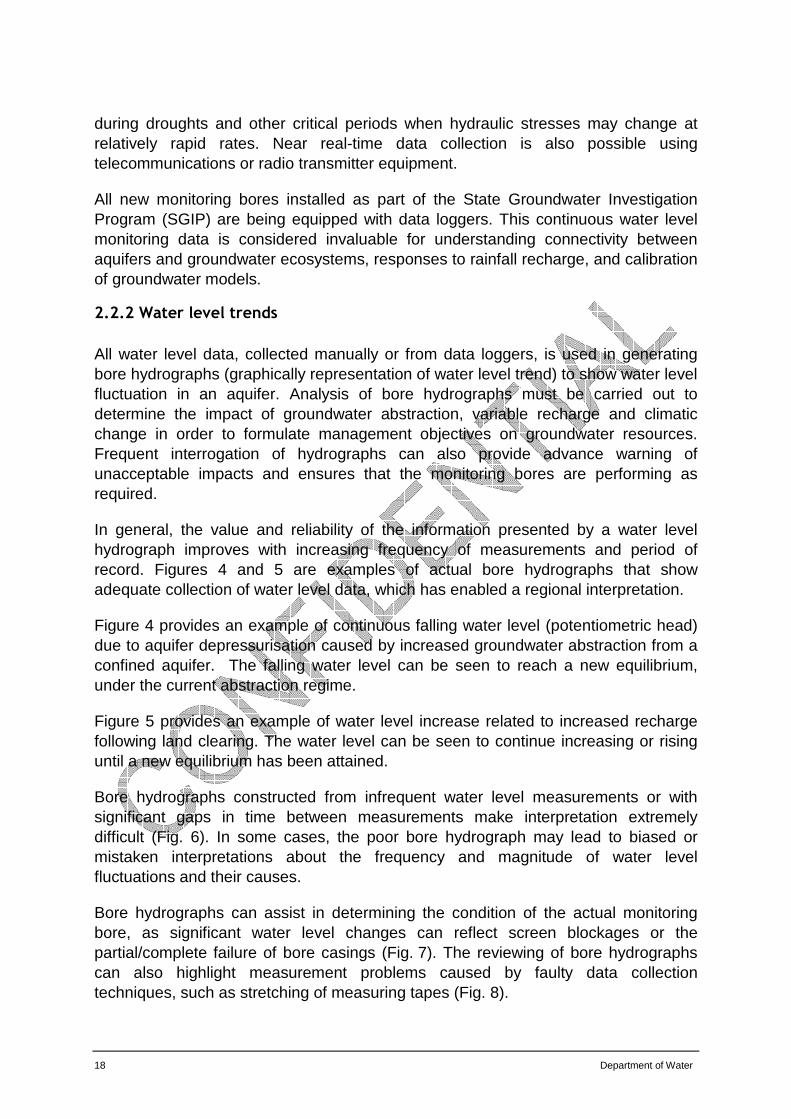
All water level data, collected manually or from data loggers, is used in generating bore hydrographs (graphically representation of water level trend) to show water level fluctuation in an aquifer. Analysis of bore hydrographs must be carried out to determine the impact of groundwater abstraction, variable recharge and climatic change in order to formulate management objectives on groundwater resources. Frequent interrogation of hydrographs can also provide advance warning of unacceptable impacts and ensures that the monitoring bores are performing as required.
In general, the value and reliability of the information presented by a water level hydrograph improves with increasing frequency of measurements and period of record. Figures 4 and 5 are examples of actual bore hydrographs that show adequate collection of water level data, which has enabled a regional interpretation.
Figure 4 provides an example of continuous falling water level (potentiometric head) due to aquifer depressurisation caused by increased groundwater abstraction from a confined aquifer. The falling water level can be seen to reach a new equilibrium, under the current abstraction regime.
Figure 5 provides an example of water level increase related to increased recharge following land clearing. The water level can be seen to continue increasing or rising until a new equilibrium has been attained.
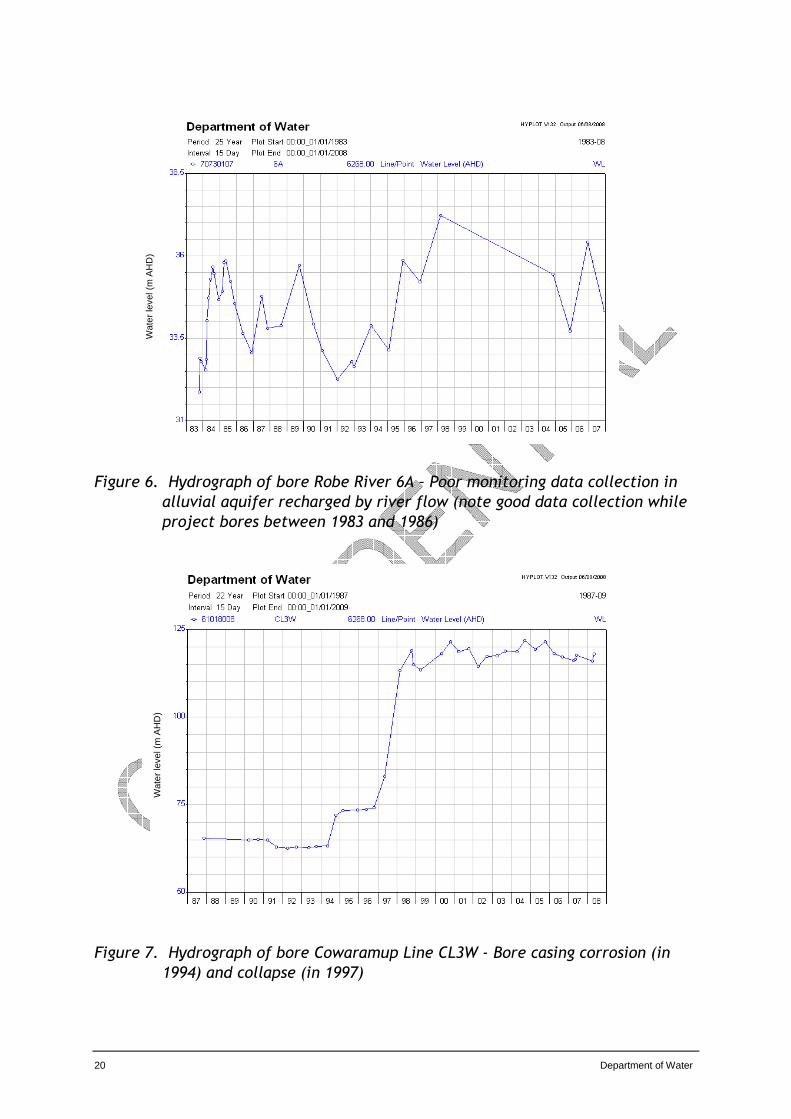
Bore hydrographs constructed from infrequent water level measurements or with significant gaps in time between measurements make interpretation extremely difficult (Fig. 6). In some cases, the poor bore hydrograph may lead to biased or mistaken interpretations about the frequency and magnitude of water level fluctuations and their causes.
Bore hydrographs can assist in determining the condition of the actual monitoring bore, as significant water level changes can reflect screen blockages or the partial/complete failure of bore casings (Fig. 7). The reviewing of bore hydrographs can also highlight measurement problems caused by faulty data collection techniques, such as stretching of measuring tapes (Fig. 8).

Department of Water 19
Figure 4. Hydrograph of bore AM42 – Declining water level in Yarragadee aquifers
reaching equilibrium
Figure 5. Hydrograph of bore Irwin View OB11-77 – Increasing water level due to
clearing over the Yarragadee aquifer
Wat
er le
vel (
m A
HD
) W
ater
leve
l (m
AH
D)
20 Department of Water
Figure 6. Hydrograph of bore Robe River 6A – Poor monitoring data collection in
alluvial aquifer recharged by river flow (note good data collection while
project bores between 1983 and 1986)
Figure 7. Hydrograph of bore Cowaramup Line CL3W - Bore casing corrosion (in
1994) and collapse (in 1997)
Wat
er le
vel (
m A
HD
) W
ater
leve
l (m
AH
D)

Department of Water 21
Figure 8. Hydrograph of bore Cowaramup Line CL5A3 – Data collection inaccuracy
between 2003 and 2005 due to stretched water level indicator
The Department of Water provides hydrographs of monitoring bores within the groundwater monitoring network on its webpage at www.water.wa.gov.au. The direct link is http://kumina.water.wa.gov.au/waterinformation/wrdata/GWL/index.htm. It is considered that the capability for rapid retrieval and transmittal of water level data is of high value to Department stakeholders. The ability for Department staff to rapidly assess resource condition on a geographic and aquifer basis through links in GISViewer is a major advancement in groundwater management.
2.3 Other groundwater monitoring
The focus of this document is regional water level monitoring and ensuring that this important function is thoroughly reviewed and adequately funded. This is not the full extent of groundwater monitoring that is required by the Department, as there is a need for monitoring groundwater quality and groundwater dependent ecosystems on a local basis. There is further work required in understanding the extent, approach and techniques of these different types of monitoring.
Most of this monitoring is currently being undertaken and funded by individual projects. At present, there is no coordinated approach and addressing this shortcoming will be a recommendation of this review.
2.3.1 Groundwater quality
Monitoring of groundwater quality is desirable where there are changes in groundwater chemistry resulting from anthropogenic impacts. Data on the chemical
Wat
er le
vel (
m A
HD
)

22 Department of Water
and biological characteristics of groundwater is critical for setting water resource protection areas, understanding the evolution and change in groundwater quality, and potentially the success of management policies. Groundwater quality monitoring is considered important in areas that are prone to saltwater intrusion, such as along the coast or coastal rivers.
Water quality can be measured by either in-field parameters (electrical conductivity, pH and temperature) and chemical analyses (dissolved metals and inorganics) requiring taking of a water sample for laboratory analysis. To date, groundwater quality has largely focused on collecting in-field measurements within minutes of the water sample retrieved from the bore.
The collection of representative water samples is complex, time-consuming and expensive. It is often necessary to either purge the bore (removal of three times the volume of water in the bore casing) until the electrical conductivity stabilises, or low-flow purging within the bore screen prior to collecting the water samples. Even after bore purging, water quality changes can occur due to changes in temperature and pressure resulting in chemical variation and inconsistencies. Most water samples for chemical analyses require filtration and storage in freezing conditions. Water samples for traces of metal analysis require a reagent for preservation.
Following their installation, most regional monitoring bores are sampled for physical parameters and standard (major ions) chemical analyses. These data are considered point-in-time data and can provide a baseline for comparing with future water quality data. However, the regional monitoring bores were not installed for on-going water quality monitoring. To date, very few monitoring bores have been re-sampled since their installation.
The scope of monitoring groundwater quality is extremely broad. In some areas, there is a need to monitor a whole range of analytes due to changes in climate (such as oxidation of acid sulphate soils), land-use and human activities (such as nitrate from agriculture, toxic contaminants, and movement of saltwater interface). While, contaminants may be an issue in different areas including high concentrations of heavy metals, pesticides, herbicides, hydrocarbon, ammonia, nitrate, sulphate and phosphorus. Monitoring programs need to be custom designed to monitor specific analytes, usually over small areas where changes in water quality are suspected.
Consequently, the development of a groundwater quality monitoring program is a complex task and was considered too difficult for addressing in this review; however, it is recommended that the Department of Water works towards an appropriate monitoring program for groundwater quality. Areas that will require attention include sampling consistency, developing objectives, and determining whether the existing network can be utilised or if a new network is required. Processes such as point source pollution, diffuse pollution, irrigation recycling, salinity upcoming, sea water intrusion and acidity from lowered watertables are require very specific monitoring design to be successful.
Department of Water 23
2.3.2 Groundwater dependent ecosystems
The protection and maintenance of ecological values of groundwater dependent ecosystems (GDEs) is an important consideration in groundwater management. As such, it is important for the Department to understand the groundwater regimes needed to maintain ecological values of GDEs at a low level of risk.
The monitoring of GDEs is considered a multi-disciplinary approach and is a new methodology for the Department. In order to understand changes in GDEs and ensure their protection, there is a need to integrate groundwater level and quality monitoring with ecological vegetation condition assessments.
Groundwater level measurement at representative GDEs detects trends in groundwater regime and monitor against the ecological water requirements that have been determined. The department has established management triggers for groundwater levels at selected sites, which initiate a management response to prevent long-term unacceptable ecological harm or unacceptable ecological impact. Given the sensitivity of GDEs to water level change and rainfall recharge, it is considered that monthly water level measurements are not adequate and that continuous water level measurement may be required at representative sites.
To date, groundwater quality monitoring has included total dissolved solids, pH, nutrients, metals and other analytes to detect the formation of acid due to the oxidation of acid sulphate soils. This is important as any major changes in groundwater chemistry could potential impact on GDEs.
Ecological monitoring includes wetland and/or phreatophytic vegetation monitoring, which is conducted periodically to assess the health of GDEs by a qualified ecologist. An annual frequency enables assessment of short-term changes in the vegetation while the accumulated data allows tracking changes to the vegetation communities in the longer term. In some circumstances, the monitoring of macro-invertebrates is also undertaken.
Groundwater dependent ecosystem monitoring in Western Australia is being trialled in the South West groundwater areas, including groundwater level, water quality and ecological condition monitoring (Department of Water, 2008a). The trial also incorporates automated water level measurement using data loggers with the resultant interpretations to be presented in the annual evaluation statement of the South West groundwater areas.
24 Department of Water
3 History of groundwater monitoring program
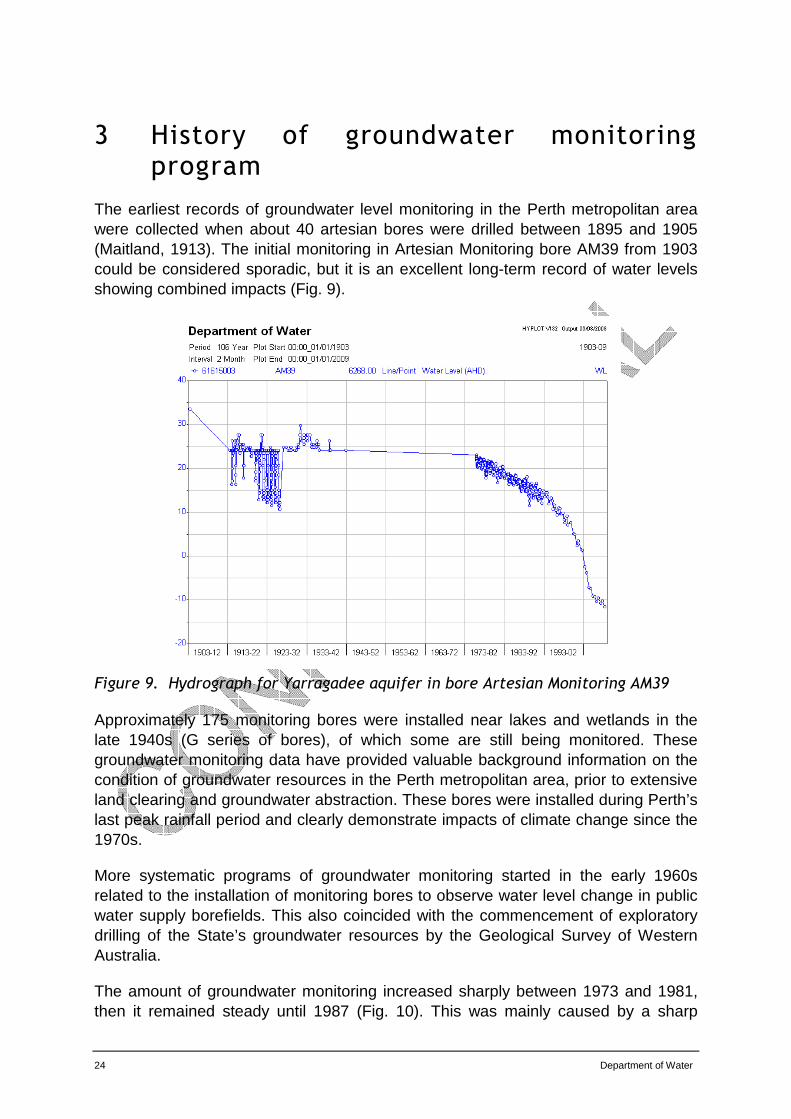
The earliest records of groundwater level monitoring in the Perth metropolitan area were collected when about 40 artesian bores were drilled between 1895 and 1905 (Maitland, 1913). The initial monitoring in Artesian Monitoring bore AM39 from 1903 could be considered sporadic, but it is an excellent long-term record of water levels showing combined impacts (Fig. 9).
Figure 9. Hydrograph for Yarragadee aquifer in bore Artesian Monitoring AM39
Approximately 175 monitoring bores were installed near lakes and wetlands in the late 1940s (G series of bores), of which some are still being monitored. These groundwater monitoring data have provided valuable background information on the condition of groundwater resources in the Perth metropolitan area, prior to extensive land clearing and groundwater abstraction. These bores were installed during Perth’s last peak rainfall period and clearly demonstrate impacts of climate change since the 1970s.
More systematic programs of groundwater monitoring started in the early 1960s related to the installation of monitoring bores to observe water level change in public water supply borefields. This also coincided with the commencement of exploratory drilling of the State’s groundwater resources by the Geological Survey of Western Australia.
The amount of groundwater monitoring increased sharply between 1973 and 1981, then it remained steady until 1987 (Fig. 10). This was mainly caused by a sharp

Department of Water 25
increase in the number of monitoring bores being drilled, requirements for monthly readings and joint funding of groundwater assessment by the State and Federal governments. Between 1988 and 2001, there was a significant reduction in groundwater monitoring due to a combination of reallocation of funding, reduction in the installation of new monitoring bores, and internal reviews reducing groundwater monitoring frequency. Since 2001, groundwater monitoring has been slightly increasing due to requests from the Water Resource Assessment Branch for increased monitoring frequency to support its groundwater assessments.
Figure 10. Groundwater monitoring (1970 to 2007) showing the number of water
level measurements each year. Note includes monitoring of project bores
It is important to note that the decline in groundwater monitoring coincided with the period in which groundwater abstraction has essentially doubled (as shown in Fig. 1), and the current level of groundwater monitoring is about one-third of the mid 1980s. This is a concern as many groundwater management areas are now either reaching or at full allocation limit. In order for these allocation limits to be modified, it is imperative to reinstate a more comprehensive groundwater monitoring program as part of improving knowledge of the State’s groundwater resources. This would align with new Department of Water initiatives related to the State Groundwater Investigation Program and Bore Rehabilitation Program.
3.1 Ownership of monitoring in State government
Since the 1970s, there have been a number of different State Government agencies that have been responsible for the management and monitoring of the regional monitoring bore network. Below is a description of the role of each organisation in the creation and evolution of the current groundwater monitoring network.
0
5000
10000
15000
20000
25000
30000
35000
40000
Num
ber of Bores R
ead
1970 1972 1974 1976 1978 1980 1982 1984 1986 1988 1990 1992 1994 1996 1998 2000 2002 2004 2006Year
Number of Bores Read
Num
ber
of m
easu
rem
ents

26 Department of Water
3.1.1 Metropolitan Water Authority and Public Works Department
Both the Metropolitan Water Authority and the Public Works Department conducted groundwater monitoring in the 1970s and early 1980s for monitoring bores near public water supply production bores and those for regional investigation drilled by the Geological Survey of Western Australia. In 1978, the Environmental Protection Authority (EPA) commissioned Layton Groundwater Consultants to study the effectiveness of the groundwater monitoring program and adequacy of existing record structure. The Planning Branch of the Metropolitan Water Authority conducted a second review of the groundwater level retrieval system (GROWLS), which was completed in 1986. Groundwater monitoring reached its peak in the early 1980s when many groundwater monitoring bores were monitored on a monthly basis (Fig. 10).
3.1.2 Water Authority of Western Australia
The Metropolitan Water Board and the Public Works Department merged to form the Water Authority of Western Australia in 1985. The Water Authority completed the Perth Urban Water Balance Study in 1987, which evaluated the groundwater system in the Perth area based on the network of groundwater level and quality monitoring bores. As part of this study, a number of additional monitoring bores including salt water interface bores were installed.
In 1988, the Water Authority conducted a comprehensive review of groundwater monitoring in metropolitan regions (Kierath and Hopkins, 1988), in response to budgetary constraints. A key recommendation of the review was a significant reduction in monitoring by lowering the frequency of water level measurements, which significantly reduced the number of measurements in the 1990s (Fig. 10).
3.1.3 Water and Rivers Commission
In 1996, the Water and Rivers Commission became responsible for monitoring all regional groundwater monitoring bores. The newly-formed Water Corporation continued to monitor their monitoring bores within public water supply production borefields.
The Water and Rivers Commission conducted further rationalisations of frequency or number of bores in the monitoring program in response to additional budgetary constraints. Although, monitoring frequency was increased in some critical bores, such as the EPA Criteria monitoring bores used to monitor water levels in wetlands and groundwater dependent environment in the Perth metropolitan area.
The Auditor General of Western Australia (2003) reported that the Water and Rivers Commission did not have the appropriate level of information to manage groundwater resources in some areas. In response to the audit, the Water and Rivers Commission initiated the State Groundwater Investigation Program (Johnson et al., 2005) and

Department of Water 27
Bore Rehabilitation Program; however, there was no formal documentation prepared to assess the state of and to consider level of funding for groundwater monitoring.
In 2004, there was a review of the groundwater monitoring bore network and monitoring program on the Gnangara and Jandakot Mounds (Aquaterra, 2004). The review recommended some rationalisation of the network and the installation of 74 new monitoring bores to improve the network.
Lindsay (2004) and Smith et al (2005) undertook additional reviews of the monitoring bore data and network across the entire Perth region. Both of these studies identified knowledge gaps and recommended additional monitoring bores in the superficial aquifer. Despite these reviews, the Water and Rivers Commission undertook no action in rationalising the network.
3.1.4 Department of Water
The Department of Water was established in 2006 as the State’s water resource manager replacing the Water and Rivers Commission. The department secured long-term funding for the State Groundwater Investigation Program (SGIP) to address knowledge gaps in the regional groundwater monitoring network. More than 100 monitoring bores have been installed including 91 monitoring bores in the Gingin area related to the Gingin-Cowalla, Gingin Brook and North Gnangara projects, as well as 24 bores in the South West related to the Scott Coastal and Cowaramup projects.
In addition, long-term funding was acquired for the rehabilitation and maintenance of the regional groundwater monitoring network, as part of the Bore Rehabilitation Program. There was also an increase in the number of hydrographic positions in the Department; however, most of these positions were considered for surface water measurement only.
In 2007, the Swan Catchment Council funded the installation of 24 new monitoring bores in the superficial aquifer in the Perth metropolitan area (GHD, 2008). These bores were installed based on the reviews by Aquaterra (2004), Lindsay (2004) and Smith et al (2005).
In 2008, the Water Resource Assessment Branch became aware of a funding shortfall for groundwater monitoring in the regional offices and that water level measurements were not being collected. It is apparent that regional groundwater monitoring has been frequently disrupted due to lack of dedicated resources, diversion of funds towards surface water measurement, field logistic issues including access problems, and a lack of technical direction and program ownership.
This review of the regional groundwater monitoring network has involved extensive consultation with Water Information Branch and all Regions to re-establish funding, improving data collection and management, and make recommendations on future

28 Department of Water
improvements. It has also identified errors within the Water Information (WIN) database system that will require addressing.
The proposed groundwater monitoring program and associated bore network will require close reviewing on an ongoing basis. The focus should be on optimising the network for each aquifer based on exiting network of bores, considering the installation of data loggers for continuous data capture, and increasing data management capability.

Department of Water 29
4 Regional groundwater monitoring needs and priorities
The development of a groundwater monitoring program must not be solely reactive; however, it is vital that groundwater areas that are reaching or at full allocation are appropriately monitored to inform management decision making. As such, it was important to understand groundwater resource pressures, current monitoring and gaps for each region.
The Water Resource Assessment Branch has recently completed a comprehensive review to determine the priority areas for groundwater and surface water across the State. This integrated process known as the Management Area Prioritisation (MAP) integrates the knowledge and needs of both technical and management areas within the Department by incorporating qualitative and quantitative data from water assessment, planning, licensing and regional staff.
Results from the MAP process, as detailed by Ryan et al. (in prep), are considered useful in determining priority groundwater areas for focusing effort and resources. The results, shown in Table 1, essentially ranks groundwater areas and is useful for comparing and prioritising the need for groundwater monitoring in the different regions.
This prioritisation of groundwater areas has demonstrated that Swan Region is the most important in the State for ongoing groundwater monitoring. This is followed by the South West, Mid West (Geraldton), Mid West (Carnarvon), Pilbara, Kimberley and finally the South Coast region. Below is a description of each region outlining the needs, priorities and gaps in existing groundwater monitoring, as well as a recommended, improved groundwater monitoring program.
4.1 Swan Region
The Swan Region considers the area that lies entirely within the Perth Basin between Lancelin to the north and Mandurah to the south. The Goldfields and a number of small groundwater areas related to public water supply are not included. It also includes those areas between Fremantle and Mandurah, as the Swan Region undertakes this groundwater monitoring on behalf of the Kwinana-Peel Region.
There is significant groundwater abstraction across the Swan Region, being about 600 GL/yr. This abstraction is largely related to irrigated agriculture, public water supply and garden bores on the Gnangara and Jandakot Mounds, and irrigated agriculture north of Gingin.
There are a number of different aquifers that are utilised for groundwater abstraction. The most significant aquifers include the unconfined superficial aquifer (major aquifer for public water supply, irrigation and maintaining wetlands); Mirrabooka aquifer
30 Department of Water
(minor aquifer for public water supply) and the confined Leederville and Yarragadee aquifers (major aquifers for public water supply).
Groundwater supports a large number of wetlands. Some of which are key wetlands that have ministerial conditions for their protection, under Section 46 of the Environmental Protection Act 1986.
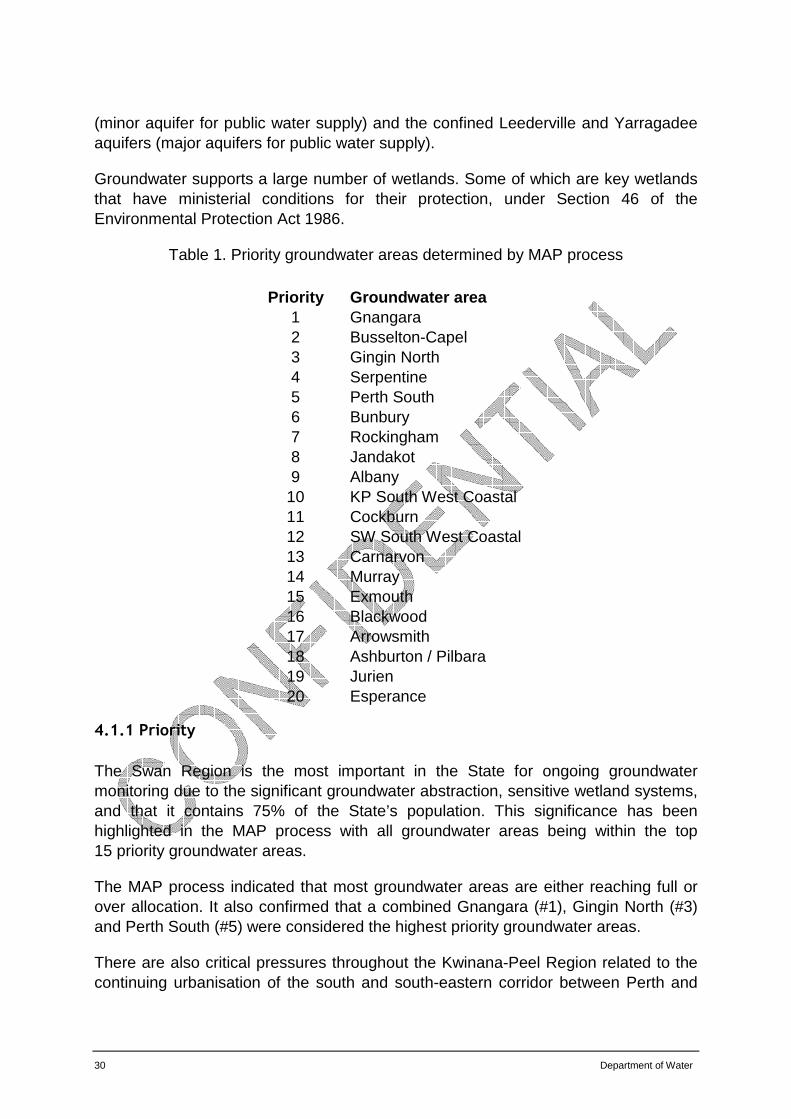
Table 1. Priority groundwater areas determined by MAP process
Priority Groundwater area 1 Gnangara 2 Busselton-Capel 3 Gingin North 4 Serpentine 5 Perth South 6 Bunbury 7 Rockingham 8 Jandakot 9 Albany
10 KP South West Coastal 11 Cockburn 12 SW South West Coastal 13 Carnarvon 14 Murray 15 Exmouth 16 Blackwood 17 Arrowsmith 18 Ashburton / Pilbara 19 Jurien 20 Esperance
4.1.1 Priority
The Swan Region is the most important in the State for ongoing groundwater monitoring due to the significant groundwater abstraction, sensitive wetland systems, and that it contains 75% of the State’s population. This significance has been highlighted in the MAP process with all groundwater areas being within the top 15 priority groundwater areas.
The MAP process indicated that most groundwater areas are either reaching full or over allocation. It also confirmed that a combined Gnangara (#1), Gingin North (#3) and Perth South (#5) were considered the highest priority groundwater areas.
There are also critical pressures throughout the Kwinana-Peel Region related to the continuing urbanisation of the south and south-eastern corridor between Perth and

Department of Water 31
Mandurah. This is particularly evident in the Serpentine (#4), Rockingham (#7) and Jandakot (#8) groundwater areas.
4.1.2 Current monitoring
Groundwater monitoring by the Swan Region is considered adequate for current needs providing high quality data that supports groundwater licensing, management of wetlands and calibration of the PRAMS model. The region is reasonably well staffed and resourced to undertake measurement of the existing network.
Monitoring frequency has provided a solid baseline of water level data for making reliable groundwater management decisions.
In 2008, there were 1080 regional monitoring bores (including staff gauges in key wetlands) measured for water levels at between once and 13 times per year. A total of 6674 water level measurements were collected in 2008. The Swan Region also collected 341 water level measurements in support of other projects from 35 bores.
There is minimal water quality measurement undertaken by the Swan Region involving the reading of electrical conductivity (EC) for saltwater interface monitoring. In 2008, 64 EC readings were obtained from 18 bores at the coast and along the Swan River.
The Swan Region has the only dedicated budget ($162,000) for undertaking groundwater monitoring. The budget provides for operational expenses and two full-time groundwater measurement staff, who can be in the field for most of the year collecting water level data.
4.1.3 Gaps
The extent of the monitoring bore network in all aquifers is generally satisfactory; however, there are some gaps in knowledge that will be addressed in the SGIP.
Sustained abstraction from the confined aquifer system will require additional monitoring bores to appropriately monitor potential saltwater intrusion, particularly along the coast to the north of Perth.
There are currently 194 monitoring bores that may be considered for removal from the Swan Region’s monitoring program due to overlap and possible duplication.
There is a need to consider the use of automated water level measurement to collect more frequent water level data, which will improve efficiency of data collection with less field time required for regional measurement staff.

32 Department of Water
4.1.4 Recommended monitoring
Table 2 details the recommended number of groundwater monitoring bores for each groundwater area and aquifer across the Swan Region. The methodology for the selection of these monitoring bores is further discussed in Section 5. Appendix A shows the distribution of the monitoring bore network.
Table 2. Recommended groundwater monitoring in Swan Region
Groundwater Area Superficial Rockingham Mirrabooka Leederville Yarragadee Staff gauge
Cockburn 49 0 0 2 1 11
Gingin 138 0 9 49 24 0
Gnangara 215 0 2 12 11 1
Gwelup 16 0 0 1 1 1
Jandakot 66 0 0 5 3 6
Mirrabooka 46 0 15 4 3 0
Murray 8 0 0 5 5 0
Perth 233 0 1 18 14 22
Rockingham 12 2 0 2 2 3
Serpentine 42 0 0 10 13 1
South West Coastal 2 1 0 1 1 0
Stakehill 14 1 0 3 3 6
Swan 54 0 17 14 4 2
Wanneroo 65 0 0 3 1 8
Yanchep 22 0 0 1 0 5
Garden Island (unproclaimed) 0 0 0 0 2 0
4.2 South West Region
The South West Region considers the area that lies within the Perth Basin between Mandurah and Pinjarra in the north and Augusta and Lake Jasper in the south, as well as the Collie Basin. The South West Region essentially includes all groundwater management areas between Mandurah and Lake Preston, as the South West Region undertakes groundwater monitoring in these areas on behalf of the Kwinana-Peel Region.
There is significant groundwater abstraction, about 220 GL/yr, that is largely related to irrigated agriculture on the Swan Coastal Plain, public drinking water supplies and the mining industry at Collie and Capel. A number of different aquifers are utilised for groundwater abstraction. The most significant aquifers include the unconfined superficial aquifer to the north of Bunbury; the major confined Leederville and Yarragadee aquifers; and minor confined Cattamarra, Lesueur and Sue aquifers.

Department of Water 33
The Department has made commitments to undertake a wide range of groundwater monitoring within the South West groundwater areas water allocation plan (Department of Water, 2009). The provision of frequent monitoring data is also critical for the ongoing development and calibration of the SWAMS groundwater model, which is the primary groundwater management tool for the South West Region.
4.2.1 Priority
The South West Region is the second-most important region for ongoing groundwater monitoring due to the significant groundwater abstraction and sensitive groundwater dependent ecosystems. The MAP process demonstrated that the Busselton-Capel (#2), Bunbury (#6), South West Coastal (#12) and Blackwood (#16) were considered high priority groundwater areas.
A significant number of groundwater resources are at full or over allocation, and have significant environmental considerations related to RAMSAR wetlands and areas of surface and groundwater interaction. Water demand is expected to increase for the Yarragadee aquifer, while demand from the Leederville aquifer will continue at current levels.
Despite significant groundwater abstraction, the Collie groundwater area was not recognised as a high priority groundwater area in the MAP process. The low priority is somewhat related to low environmental values and advanced levels of planning, but there are still high regional and political pressures.
4.2.2 Current monitoring
The level of groundwater monitoring by the South West Region is considered generally adequate for current needs; however, there is no dedicated funding and is undertaken by the Groundwater Asset Section as an act of goodwill. Monitoring of the Department’s bore network in the Collie Basin is undertaken by key stakeholders, and not by Departmental staff.
In 2008, there were 640 regional monitoring bores measured for water levels at six times per year. Measurements are collected in March, April and May when the water levels are lowest, and September, October and November when the water levels are highest. A total of 3140 water level measurements were collected in 2008. There was no water quality measurement by the South West Region during 2008.
Despite monitoring frequency being recently increased to six times per year, there have been occasions where the minimum and maximum water levels were missed. It is important that is situation is rectified.

34 Department of Water
4.2.3 Gaps
There is no dedicated funding for groundwater measurement in the South West Region, which is counter to the high levels of monitoring recommended in the water allocation management plan for the South West groundwater areas.
Previous budgetary reductions and modification of monitoring frequency has provided an inconsistent baseline of water level data.
The extent of the monitoring bore network in all aquifers is generally satisfactory. There are some significant gaps in knowledge that will be addressed by SGIP.
The high priority of the groundwater areas and increasing dependency of the SWAMS model will require increased data collection into the future; hence, the use of automated water level measurement must be considered.
The Department does not carry out groundwater monitoring in the Collie Basin, but this is currently being reviewed.
There is no systematic water quality monitoring. Sustained abstraction from the confined aquifer system will require additional monitoring bores to monitor potential saltwater intrusion between Bunbury and Busselton.
4.2.4 Recommended monitoring
Table 3 details the recommended number of groundwater monitoring bores for each groundwater area and aquifer across the South West Region. The methodology for the selection of these monitoring bores is further discussed in Section 5. Appendix B shows the distribution of the monitoring bore network.
Table 3. Recommended groundwater monitoring in South West Region
Groundwater Area Superficial Leederville Parmelia Yarragadee Cattamarra Lesueur Sue
Blackwood 16 74 8 88 1 12 3
Bunbury 22 21 0 17 5 0 0
Busselton-Capel 35 123 1 41 0 0 6
Karri 31 7 0 4 0 0 0
Murray 75 7 0 0 2 0 0
South West Coastal 89 7 0 0 3 0 0
4.3 Mid West (Geraldton) Region
The Mid West (Geraldton) Region lies mostly within the Perth Basin between Geraldton to the north and Lancelin to the south. There is significant groundwater abstraction, about 200 GL/yr, that is largely related to irrigated agriculture, mining at Eneabba and Cataby, and public drinking water supply for Geraldton.
Department of Water 35
A number of different aquifers are utilised for groundwater abstraction. The most significant aquifers are the unconfined superficial aquifer to the south of Dongara; the major confined Leederville, Leederville-Parmelia, Parmelia and Yarragadee aquifers; and minor confined Cattamarra, Eneabba and Lesueur aquifers.
Groundwater supports a large number of key wetlands that require special protection. Water levels have been steadily rising in the north-eastern portion of the Mid-West Region due to land clearing in 1960s. Groundwater monitoring has provided baseline data on water level change and will be more critical in the future as equilibrium is attained. The provision of frequent monitoring data will be critical for the development of a new groundwater model of the northern Perth Basin.
4.3.1 Priority
The Mid West (Geraldton) Region is an important region for ongoing groundwater monitoring due to the significant groundwater abstraction and presence of sensitive groundwater dependent ecosystems. The MAP process confirmed that Gingin North (#3) is a high priority groundwater area, while Arrowsmith (#17) and Jurien (#19) groundwater are considered lower priorities.
Gingin North including the northern portion of the Gingin groundwater area is a major horticulture area. There are a significant number of groundwater resources are at full or over allocation, particularly in the Leederville and superficial aquifers. The Arrowsmith and Jurien groundwater areas are experiencing increased demand for groundwater resources.
There is an increasing need for enhanced management of groundwater dependent ecosystems. There are many springs, wetlands and some rivers that are sustained by groundwater discharge.
4.3.2 Current monitoring
The level of groundwater monitoring is considered poor for current needs. The lack of a dedicated budget for groundwater monitoring has resulted in a number of bores not being monitored during 2008 and 2009.
In 2008, there were 114 regional monitoring bores measured for water levels with a total of 176 individual measurements collected. This confirms that less than half of the regional bore network was only monitored at its recommended frequency. It is apparent that monitoring frequency has been set based on staff availability and funding limitations rather than based on assessment and management needs. There was no water quality measurement by the Mid West Region during 2008.
There is no dedicated funding for groundwater monitoring in the Mid West Region. As such, groundwater monitoring is only undertaken on an ad-hoc basis depending on the availability of surface-water hydrographers.

36 Department of Water
4.3.3 Gaps
The current level of groundwater monitoring in the Mid West (Geraldton) Region is poor and not adequate for groundwater management purposes. There are large gaps in knowledge and the monitoring network needs to be addressed by the SGIP.
The ad-hoc and inconsistent approach to the collection of water level data is unsatisfactory with nearly half of the regional bore network not monitored at the recommend frequency of twice per year. The southern portion of the region is currently not monitored for water levels due to funding limitations.
4.2.4 Recommended monitoring
Table 4 details the recommended number of groundwater monitoring bores for each groundwater area and aquifer across the South West Region. The methodology for the selection of these monitoring bores is further discussed in Section 5. Appendix C shows the distribution of the monitoring bore network.
Table 4. Recommended groundwater monitoring in Mid West (Geraldton) Region
Groundwater Area
Superficial Leederville Parmelia Yarragadee Cockleshell Gully
Eneabba Lesueur
Arrowsmith 25 0 22 63 5 8 0
Gascoyne 0 0 0 6 1 0 0
Gingin 37 1 0 10 0 0 1
Jurien 7 7 17 15 5 2 17
Groundwater Area
Permian Sandstone
Surficial Fractured rock
Arrowsmith 1 0 2
Gascoyne 0 10 0
Gingin 0 0 0
Jurien 0 0 0
4.4 Mid West (Carnarvon) Region
The Mid West (Carnarvon) Region is largely restricted to the irrigated horticulture area along the Gascoyne River in Carnarvon. There are also site-specific issues at Exmouth and in the Carnarvon Artesian Basin.
Rather than widespread regional groundwater abstraction, there are localised areas of abstraction. This is primarily related to horticulture and public drinking water supply for Carnarvon along the Gascoyne River from the alluvial aquifer. There are also town water supply requirements at Exmouth in coastal limestone, and pastoral water requirements from artesian bores within the Carnarvon Basin.
Department of Water 37
Horticultural industry, which generates about $90 million of produce per year, within the Carnarvon Horticultural Precinct, and the Gascoyne Irrigation Scheme Supply is wholly dependent on groundwater resource for its survival and expansion. As the alluvial aquifer in Carnarvon is prone to salt water intrusion, groundwater monitoring is vital for the ongoing utilisation of this regionally significant aquifer.
4.4.1 Priority
Ongoing groundwater monitoring is critical for the Mid West (Carnarvon) Region to support the significant groundwater abstraction related to irrigation at Carnarvon. The MAP process highlighted that Carnarvon (#13) and Exmouth (#15) are moderate priority groundwater areas.
All groundwater resources in the superficial aquifer at Carnarvon are approaching full or are over allocated. There is high current and future water demand for horticulture and town water supply. There are also important environmental considerations related to riverine pools and GDEs along the Gascoyne River. Careful management of the groundwater resource, underpinned by water level and electrical conductivity measurement, is required to maintain groundwater quality in the aquifer.
There is also considerable pressure on groundwater resources in Exmouth, which is only source of public drinking water supply in the area. The coastal limestone aquifer is sensitive to saltwater intrusion and over abstraction, as well as being a habitat for stygofauna and troglofauna in the karst system.
4.4.2 Current monitoring
The level of groundwater monitoring is considered adequate for current needs. Given the high dependency on groundwater monitoring for groundwater resource management at Carnarvon, it is apparent that the Department has been undertaking this monitoring at an appropriate frequency. However, there many occasions when measurements are not collected or not stored in WIN database.
In 2008, all 34 regional monitoring bores were measured for water levels with a total of 80 individual measurements collected. This demonstrates that there are many bores not being measured at the recommended frequency of four times per year (being in March, June, September and December). This is lack of consistent monitoring also occurs with the measurement of electrical conductivity as only 78 data points have been collected from 34 bores during 2008.
The regional bore network comprises monitoring bores scattered throughout the alluvial aquifer. It is considered that the bore network is adequate for current needs; however, additional monitoring bores will be required for any increase in abstraction.

38 Department of Water
4.4.3 Gaps
Current groundwater monitoring appears to be adequate for groundwater management purposes. There are many occasions when measurements are not collected or not stored in WIN database, it will be important that this situation is addressed.
There is a need for the Department to ensure that all monitoring data collected up-gradient of the horticulture area by the Water Corporation since 1996 is captured and stored into the WIN database. This data is important for ongoing calibration of the groundwater model and any potential expansion of the water supply.
The region is proposing the installation and evaluation of data loggers in monitoring bores.
There is potential that rehabilitated bores within the Carnarvon Artesian Basin (CAB) may have to be monitored by the Department.
4.4.4 Recommended monitoring
It is recommended that all 35 regional monitoring bores are measured for water levels and electrical conductivity at the frequency of four times per year (being in March, June, September and December). In addition, the integration of automated measurement should be further considered and evaluated.
4.5 North West (Pilbara) Region
The North West (Pilbara) Region covers the Pilbara and West Canning Basin. The region is the State’s premier resources region and is host to two of the State’s biggest export revenue earners – iron ore ($8 billion) and petroleum products ($5 billion). For the past five years, it has been unquestionably the economic powerhouse of the State economy.
There is significant groundwater abstraction throughout the Pilbara Region and is estimated at 344 GL/year. The largest groundwater user is the resources industry with minor abstraction for town water supply and the pastoral industry.
There is a wide diversity of aquifers utilised including alluvial and calcrete aquifers with episodic recharge from river flows, fractured-rock aquifers and deep sedimentary West Canning Basin. Unlike other regions in the State, a large proportion of groundwater abstraction is from fractured-rock aquifers making regional groundwater monitoring problematic and largely unsuccessful.
There are cultural sensitivities and groundwater dependent ecosystems at Millstream, as well as along the lower reaches of Robe and Fortescue Rivers that will require careful management and considered monitoring.

Department of Water 39
The West Canning Basin represents a significant groundwater resource for the region. Presently, the resource is under-utilised by the pastoral industry but there are a number of proposals for installing borefields to provide water for mining and town water supply at Port Hedland.
4.5.1 Priority
Despite a significant increase in water demand and economic boom, the MAP process has indicated that the groundwater areas in the Pilbara are considered a low priority from a State perspective. This is largely due to the resources industry being well regulated, compliant and essentially managing their water requirements. The main priority is the future water demand for processing and town water supplies along the Pilbara Coast between Karratha and Port Hedland.
4.5.2 Current monitoring
In 2008, there was no groundwater monitoring undertaken in the Pilbara. There are a large number of potential monitoring bores installed throughout the region; however, a lack of dedicated funding and a recommended program for groundwater monitoring has seen little to no groundwater measurement undertaken in the past five years.
Resource companies are required to undertake comprehensive groundwater monitoring of their abstraction, as part of groundwater licensing conditions. The resources industry in the Pilbara are considered best practice at compliance and providing monitoring data on time and as requested by the Department.
The Water Corporation is responsible for the monitoring of most public drinking source areas in the Pilbara. The mining industry is responsible for groundwater monitoring and management of town water supplies for Tom Price and Newman.
4.5.3 Gaps
There is no current groundwater monitoring by the North West (Pilbara) Region. This is not considered appropriate or suitable for groundwater management requirements. There is a need to fully assess the condition of monitoring bores and address access problems. The focus of this should initially be at Millstream and selected alluvial aquifers along the Pilbara Coast.
4.5.4 Recommended monitoring
In order to resume groundwater monitoring, it is recommended that 17 monitoring bores at Robe and Fortescue Rivers are initially monitored twice per year. This monitoring data will support existing Water Smart projects being undertaken to support the development of a future statutory management plan. There are another potential 84 bores (including 10 bore at Millstream and 32 bores in the West Canning Basin) that can be added to improve the network.

40 Department of Water
A comprehensive evaluation of monitoring bore condition is required. The condition of the bores previously used for monitoring is uncertain, and there are many access issues due to infestation of weeds and damaged tracks.
In light of increasing demand, there may be need to resume monitoring of bores in the West Canning Basin. The increasing interest in this groundwater resources and potential as a town water supply for Port Hedland requires a baseline level of regional groundwater monitoring.
4.6 North West (Kimberley) Region
The North West (Kimberley) Region only considers the Ord Irrigation Scheme area around Kununurra and the Broome area. Unlike other regions in the State, there are localised or focused areas of groundwater abstraction in the Kimberley Region that is estimated at about 45 GL/year.
There is a wide diversity of aquifers utilised throughout the Kimberley including alluvial aquifers with episodic recharge from river flows, localised fractured-rock aquifers and the deep sedimentary West Canning Basin. Given the different aquifers utilised for groundwater abstraction, it is critical that there is appropriate site-specific groundwater monitoring to evaluate aquifer response and performance.
There is a need to understand the impact of leakage of irrigation water (from surface water from the Ord Irrigation Scheme) and subsequent rise in the watertable in the local alluvial aquifer. Rises in watertable can induce increase in groundwater salinity resulting in potential land salinisation.
Demand for groundwater is increasing in Broome for irrigated horticulture and town water supply. The location of Broome on a peninsula requires careful, ongoing management of groundwater resources to prevent saltwater intrusion.
4.6.1 Priority
The MAP process has indicated that the groundwater areas in the Kimberley are considered a low priority from a State perspective. It is considered that the main priority for the Kimberley region is the Broome groundwater area, as recent requests to increase allocation limits have been refused by Water Resource Assessment Branch due to the lack of monitoring data. There are competing needs for the groundwater resource from irrigated horticulture and the town water supply, as well as potential for new industries. The potential for saltwater intrusion also requires careful management to prevent any adverse impacts.
4.6.2 Current monitoring
The level of groundwater monitoring by the Kimberley Region is not adequate for current needs. Given the sensitivity of the Broome groundwater area to potential

Department of Water 41
saltwater intrusion, it is a concern that this groundwater resource is not being monitored.
Current groundwater monitoring is focused on the Ord Irrigation Scheme to support projects being undertaken with CSIRO; however, this is mainly undertaken due to its close proximity to Kununurra.
In 2008, there were 70 bores monitored with 130 water level measurements being collected and 87 EC measurements from 59 bores in the vicinity of the Ord Irrigation Scheme.
The regional bore network comprises monitoring bores focused in the main abstraction areas. It is considered that the bore network is adequate for current needs; however, it is critical that groundwater monitoring is undertaken.
The Water Corporation undertakes groundwater monitoring in Broome and Derby, as part of groundwater license conditions. This is also the case with the mining industry which largely responsible for managing and monitoring their water requirements.
4.6.3 Gaps
The level of groundwater monitoring by the Kimberley Region is not adequate for current needs. Given the sensitivity of the Broome groundwater area to potential saltwater intrusion, it is important this groundwater resource is better monitored.
For the past year, there has been no groundwater monitoring of the 22 bores in the Broome groundwater area due to no dedicated funding for groundwater monitoring. In contrast, current monitoring of the Ord Irrigation Scheme is considered adequate for groundwater management purposes.
Outside of the main abstraction areas, there is no recommended groundwater monitoring program. It will be necessary for a comprehensive review of potential groundwater monitoring bores and assessing the need for any additional regional groundwater monitoring.
4.6.4 Recommended monitoring
It is highly recommended that groundwater monitoring of all regional monitoring bores at Broome is resumed as soon as possible. It is also recommended that regional monitoring bores related to the Ord Irrigation Scheme are continually measured for water levels.
4.7 South Coast Region
The South Coast Region covers the southern extent of the State. There is no regional groundwater monitoring proposed for the South Coast Region, which is due

42 Department of Water
largely to a high variable groundwater environment making regional monitoring difficult.
Despite being moderate to high priority groundwater in the MAP process, it is considered that Albany (#9) and Esperance (#20) are adequately monitored by the Water Corporation. Groundwater abstraction for town water supplies at Albany, Bremer Bay, Hopetoun and Esperance are managed and monitored by the Water Corporation.
Department of Water 43
5 The groundwater monitoring network
The Department of Water has ownership of more than 9000 bores, which are registered within the WIN database. There has been confusion over the size and extent of the regional groundwater monitoring network; as such it was necessary to undertake a complete and unbiased review of all potential monitoring bores. This regional groundwater monitoring network will be referred from this point forward as the ‘Groundwater Assessment Network’ or GWAN. The primary objectives of the monitoring bore review were to:
• identify monitoring bores for inclusion in the GWAN
• understand bore distribution to ensure sufficient monitoring coverage
• identify any data / information gaps
• confirm the aquifer being monitored
• determine bore condition and status
• assess individual hydrographs for water level response
• recommend future monitoring frequencies
5.1 Methodology
Given the large number of bores to be reviewed, it was necessary to develop a methodology that was simple, efficient and accurate. A review of this magnitude required considerable effort, knowledge of the existing monitoring bore network, and an appreciation of why the existing bores were constructed in the first place. This involved extensive consultation with hydrogeologists in Water Resource Assessment Branch, environmental water professionals in Water Allocation Branch, data managers and regional measurement staff.
The primary task of the review was to identify monitoring bores for inclusion in the GWAN, and specific project bores constructed with a short-term monitoring focus. In order to achieve this objective, a spreadsheet was created from the WIN database containing all relevant data. This spreadsheet was considered too large for data manipulation and handling, as such it was subdivided into a different spreadsheet for each region.
This separation was straightforward except for bores in the Kwinana-Peel Region, which are monitored by the Swan and South West Regions. For practicality, bores in the Kwinana-Peel Region were allocated to the Swan and South West Regions, dependent on their location either north (Swan) or south (South West) of Mandurah.

44 Department of Water
Each bore was then reviewed for data gaps particularly with respect to location, bore construction (depth and screen interval), aquifer being monitored and its current condition such as existing, damaged or decommissioned. There was an extensive process of data cleansing and acquiring missing data in an attempt to address these data gaps; however, there are still many data gaps and this will be an ongoing task.
The primary filter of the bores was classification into five main categories or types considering information about their location, length of groundwater monitoring history, bore construction and their inclusion in the existing measurement program. The classification criteria were as follows:
• Existing GWAN – a bore that is currently monitoring as part of the regional groundwater monitoring network and has no data gaps. All ‘Existing GWAN’ bores for each region are listed in Appendix A - Volume 2.
• GWAN with data gap – a bore that is considered of regional and/or hydrogeological significant for inclusion in the GWAN; are currently being monitored in the existing groundwater measurement program; but has data gaps (such as no depth or screen interval). Many of these bores have long monitoring records; however, there is a need for additional work to collect the missing data. All ‘GWAN bores with data gap’ for each region are listed in Appendix B - Volume 2.
• New GWAN – a bore that is either newly installed (such as those in the State Groundwater Investigation Program) or has been identified for inclusion in the GWAN and has no data gaps. These are bores not currently monitored in the existing groundwater measurement program. All ‘New GWAN bores’ for each region are listed in Appendix C - Volume 2.
• Potential GWAN – a bore that is not currently monitored but requires some level of assessment to determine its condition and potential for later inclusion in GWAN. All ‘Potential GWAN bores’ for each region are listed in Appendix D - Volume 2
• Project – a bore that was primarily constructed as a bore for a fixed project length and short-term monitoring; as such is not included in the GWAN. It is possible that some project bores may be included in GWAN where there are gaps in our knowledge or to meet management objectives. Given the large number of project bores these have not listed in the document but are retained in the WIN database.
Following this classification and creation of a more accurate database of the GWAN, bore positions were plotted based on major aquifers for each region. Separate maps were prepared showing GWAN bore distribution across the Swan, South West and Mid West Regions, which entails majority of the Perth Basin, within the primary aquifer systems (superficial/surficial, Leederville/Parmelia, Yarragadee aquifer and ‘other’ aquifers).

Department of Water 45
These maps are presented as separate plates in the rear of this document. Different colours were used to represent the above-mentioned GWAN classifications for each bore. Owing to the high density of monitoring bores, it was necessary to prepare four smaller-scale maps to display the GWAN related to the superficial aquifer in the Perth region.
The maps showing spatial distribution of GWAN bores were useful in identifying areas of overlaps and gaps, as well as obvious errors in the spreadsheets. This additional review ensured that the final selection of GWAN bores was robust and accurate. The maps can be used to assist hydrogeologists and regional measurement staff to organise monitoring programs, while the dataset will be ultimately used to create themes in GIS Viewer for usage by the Department.
In addition to the review and determination of the GWAN, there was work undertaken to determine the minimum monitoring frequency of all GWAN bores. There was also a thorough evaluation of the efficiencies, data improvements and cost benefit of automated groundwater measurement using data loggers. These additional studies contributed to the development of the future direction for groundwater monitoring.
5.2 Review findings
The review methodology provided a comprehensive evaluation of all bores owned by the Department. The resultant GWAN is considered robust and spatially distributed to provide a meaningful measure of regional water levels. Below are the key findings from the groundwater monitoring review.
5.2.1 Bores in the GWAN
Monitoring bores in the GWAN were predominantly drilled by the Metropolitan Water Board, Public Works Department, Water Authority of Western Australia, Geological Survey of Western Australia and Department of Water for groundwater investigation. Prior to 2000, most bores were not constructed as long-term monitoring bores, but rather seen as opportunistic monitoring sites and were constructed of often inferior materials. These bores are showing signs of variable damage and are being addressed as part of the Bore Rehabilitation Program. Recent bores, constructed with higher-grade materials, have been purposely installed as long-term monitoring bores.
Prior to 2000, most GWAN bores were constructed with either steel or PVC casing, and perforated or screened over a short interval, about 6 m, to test the aquifers at specific depth and monitor water levels. The casing is usually wide enough to enable airlifting to collect water samples for field electrical conductivity and chemical analyses. These bores have largely been geophysically logged and cored or sampled for palynology.
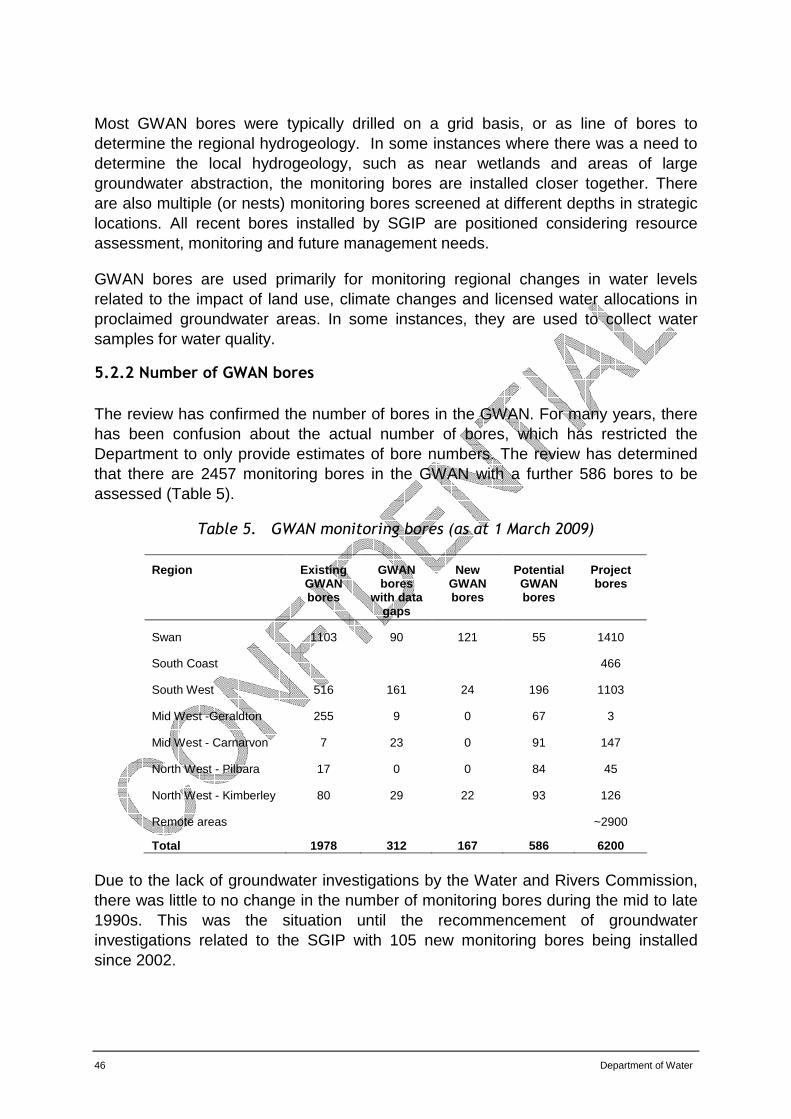
46 Department of Water
Most GWAN bores were typically drilled on a grid basis, or as line of bores to determine the regional hydrogeology. In some instances where there was a need to determine the local hydrogeology, such as near wetlands and areas of large groundwater abstraction, the monitoring bores are installed closer together. There are also multiple (or nests) monitoring bores screened at different depths in strategic locations. All recent bores installed by SGIP are positioned considering resource assessment, monitoring and future management needs.
GWAN bores are used primarily for monitoring regional changes in water levels related to the impact of land use, climate changes and licensed water allocations in proclaimed groundwater areas. In some instances, they are used to collect water samples for water quality.
5.2.2 Number of GWAN bores
The review has confirmed the number of bores in the GWAN. For many years, there has been confusion about the actual number of bores, which has restricted the Department to only provide estimates of bore numbers. The review has determined that there are 2457 monitoring bores in the GWAN with a further 586 bores to be assessed (Table 5).
Table 5. GWAN monitoring bores (as at 1 March 2009)
Region Existing GWAN bores
GWAN bores
with data gaps
New GWAN bores
Potential GWAN bores
Project bores
Swan 1103 90 121 55 1410
South Coast 466
South West 516 161 24 196 1103
Mid West -Geraldton 255 9 0 67 3
Mid West - Carnarvon 7 23 0 91 147
North West - Pilbara 17 0 0 84 45
North West - Kimberley 80 29 22 93 126
Remote areas ~2900
Total 1978 312 167 586 6200
Due to the lack of groundwater investigations by the Water and Rivers Commission, there was little to no change in the number of monitoring bores during the mid to late 1990s. This was the situation until the recommencement of groundwater investigations related to the SGIP with 105 new monitoring bores being installed since 2002.

Department of Water 47
All new SGIP bores are considered GWAN bores, as the prime objective of this program is the infilling of monitoring and knowledge gaps. To date, 24 bores in the South West Region (10 at Scott Coastal and 14 at Cowaramup) and 91 bores in the Swan Region (49 at Gnangara North, 32 at Gingin Brook and 10 along Cowalla Road in Gingin) have been installed within the Perth Basin.
In addition to the monitoring bores, 68 staff gauge sites positioned in key wetlands across the Perth region have been included in the GWAN. These monitoring sites provide crucial data on water levels and groundwater interaction around wetlands.
5.2.3 Classification of GWAN bores
There are 2145 bores that are considered the most reliable with respect to bore condition and water level measurement. These comprise 1978 existing GWAN bores within existing groundwater monitoring program, and 167 new GWAN bores that have been recently installed or selected for inclusion.
Further work is required to identify missing data on 312 GWAN bores. Despite the data gaps, these bores are considered important for various reasons and in many cases because of long monitoring records being greater than 50 years. It is a major concern that a large number of the existing monitoring network was missing critical data, such as no bore depth and/or no screen information in the WIN database.
These data gaps are symptomatic of insufficient technical involvement in regional groundwater monitoring and maintenance of the network, as well as under-resourcing of data entry into the WIN database. A work program is required for the Groundwater Asset Section to collect the missing data by either down-hole camera or depth tagging, and ensure the new data is entered into the WIN database.
In addition, there are also 586 potential GWAN bores that are not currently monitored but may be reinstated at a later stage. The assessment will differ depending on the particular problems ranging from bore condition, extent of damage, resolving access and ongoing management needs. This assessment will require the involvement of hydrogeologists from the Water Resource Assessment Branch.
5.2.4 Number of project bores
The department owns about 6200 project bores that were constructed for specific projects and short-term monitoring of less than two years. These bores are generally cased with narrow PVC casing and either fully slotted or slotted over the lowest section. These bores are of poor bore construction and have incorrect headwork completions, as such are not considered suitable for long-term monitoring. It has been decided that these bores are not included in the GWAN; however, the Department currently monitors about 300 project bores with funding from specific projects. It is possible that some project bores may be later considered for the GWAN depending on future management objectives.

48 Department of Water
5.2.5 Bore distribution
More than 80 per cent of GWAN bores are located in the Perth Basin, between Geraldton and Augusta (Fig. 11). The remaining bores are in Collie, Carnarvon and various locations in the Pilbara and Kimberley regions. The distribution of the GWAN is considered appropriate given the large volumes of groundwater allocation in these regions (Fig. 12)
There are no GWAN monitoring bores in the East Murchison, Goldfields, Gascoyne and Wheatbelt areas, as large groundwater abstractions are monitored by individual licensees. There are no GWAN monitoring bores in the South Coast Region with the Water Corporation monitoring groundwater abstraction from the Albany, Bremer Bay, Esperance and Hopetoun borefields.
Figure 11. GWAN bore distribution Figure 12. Groundwater allocation
5.2.6 Duplication of monitoring
In some parts of the superficial aquifer in the Perth region, there were large concentrations of bores suggesting potential overlap of monitoring. This is the product of bores being installed by different groundwater studies and programs without proper appreciation of the existing network. In most cases, these monitoring bores were included into the regional network without any consideration.
An approach was developed to adequately assess overlapping of water level measurement between bores, or bore concentration. It was assumed that each bore

Department of Water 49
provides a representative water level measurement within 1 km of the bore. Using GIS, a circle with a 1 km radius was placed over each bore to identify any interconnection between circles or likely bore overlap.
This assessment of bore overlap identified that 76 bores in the superficial aquifer in the Perth region are positioned within 1 km of another monitoring bore (Appendix E - Volume 2). However, a high density of shallow monitoring bores in the superficial aquifer may be required for monitoring water level changes in the vicinity of sensitive groundwater dependent ecosystems.
Another finding is that 118 GWAN monitoring bores in the superficial aquifer are located within 1 km of shallow Water Corporation production bores in the Perth region (Appendix E - Volume 2). These bores are mainly measuring water level responses related to Water Corporation abstraction rather than regional water level fluctuations. As a result, the Department of Water may consider transferring responsibility for monitoring of these bores to Water Corporation, or could continue monitoring but request reimbursement.
5.2.7 Aquifer names
As part of the review, an aquifer name was assigned for each GWAN bore, where missing in the WIN database. In some instances, there was a need to update the aquifer names in the WIN database to match new hydrogeological knowledge and names used in the Department’s Divertible Water Allocation Information Data system (DWAID). New aquifer names were verified and endorsed by Supervising Hydrogeologists in the Water Resource Assessment Branch. All updates to the WIN database for aquifer name have been finalised.
5.3 Review of monitoring frequency
Monitoring frequency for water level measurement at each GWAN bore in 2009/10 was determined based on the strategic location of the bores, management objectives and pressure on the groundwater resource. Monitoring frequencies were also recommended for all new GWAN bores. These tasks required extensive consultation across the Department including hydrogeologists, environmental scientists, water allocation planners and regional measurement staff.
The recommended frequency for manual water level measurement ranges between monthly to half yearly. Section 8.1 discusses the implementation of these monitoring frequencies for manual water level measurement, as part of the proposed groundwater monitoring program.

50 Department of Water
6 Evaluation of automated water level technology
The use of data loggers (or automated water level measurement systems) in new investigations related to the SGIP and SGS has already proven to be extremely valuable. The provision of continuous time-series water level measurements is a significant improvement and has already enhanced understanding of groundwater resources. In addition, the movement towards continuous time-series water levels data for groundwater is in line with the Bureau of Meteorology approach for more comprehensive groundwater resource assessments.
Many western countries (such as United States, Netherlands and even Lithuania) have a national network of bores equipped with data loggers that provide automated water level data through telemetry to stakeholders via the internet. It is highly probably that a similar network will be created in Australia due to the increased involvement of the Bureau of Meteorology in national-scale groundwater resource assessments, condition / status reporting and general needs for more data.
Technology related to data loggers has evolved significantly in the past five years. Long warranties (up to ten years) and reductions in equipment costs and processing times have meant that data loggers are now considered a viable alternative to manual measurement. Automated water level measurements offer many benefits for the Department of Water, external stakeholders and the Commonwealth. These are:
• Highly accurate and continuous record of water levels resulting in no need to continually review monitoring frequency.
• Identification of maximum and minimum water levels, as well as any changes in water levels caused by major rainfall events and nearby groundwater abstraction.
• Reduction in field work - the frequency of field visits may be reduced to two visits per year.
• Improvement in data quality and integrity for use by water resource managers, water users and the community.
• Better knowledge to support management and decision making process for the sustainable management of groundwater and trading of groundwater.
• More accurate monitoring of surface and groundwater interaction.
• Provision of early warning of over-abstraction and possible impacts on aquifers.
• Integration with telemetry systems to observe daily groundwater fluctuations.
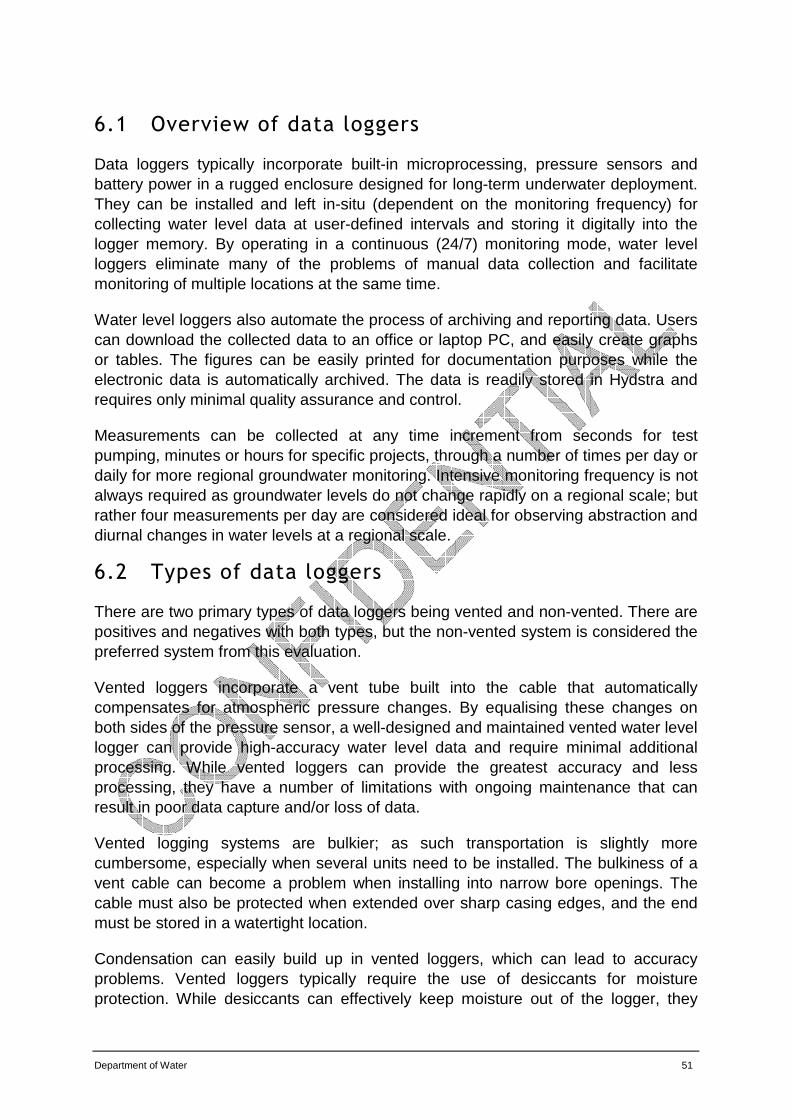
Department of Water 51
6.1 Overview of data loggers
Data loggers typically incorporate built-in microprocessing, pressure sensors and battery power in a rugged enclosure designed for long-term underwater deployment. They can be installed and left in-situ (dependent on the monitoring frequency) for collecting water level data at user-defined intervals and storing it digitally into the logger memory. By operating in a continuous (24/7) monitoring mode, water level loggers eliminate many of the problems of manual data collection and facilitate monitoring of multiple locations at the same time.
Water level loggers also automate the process of archiving and reporting data. Users can download the collected data to an office or laptop PC, and easily create graphs or tables. The figures can be easily printed for documentation purposes while the electronic data is automatically archived. The data is readily stored in Hydstra and requires only minimal quality assurance and control.
Measurements can be collected at any time increment from seconds for test pumping, minutes or hours for specific projects, through a number of times per day or daily for more regional groundwater monitoring. Intensive monitoring frequency is not always required as groundwater levels do not change rapidly on a regional scale; but rather four measurements per day are considered ideal for observing abstraction and diurnal changes in water levels at a regional scale.
6.2 Types of data loggers
There are two primary types of data loggers being vented and non-vented. There are positives and negatives with both types, but the non-vented system is considered the preferred system from this evaluation.
Vented loggers incorporate a vent tube built into the cable that automatically compensates for atmospheric pressure changes. By equalising these changes on both sides of the pressure sensor, a well-designed and maintained vented water level logger can provide high-accuracy water level data and require minimal additional processing. While vented loggers can provide the greatest accuracy and less processing, they have a number of limitations with ongoing maintenance that can result in poor data capture and/or loss of data.
Vented logging systems are bulkier; as such transportation is slightly more cumbersome, especially when several units need to be installed. The bulkiness of a vent cable can become a problem when installing into narrow bore openings. The cable must also be protected when extended over sharp casing edges, and the end must be stored in a watertight location.
Condensation can easily build up in vented loggers, which can lead to accuracy problems. Vented loggers typically require the use of desiccants for moisture protection. While desiccants can effectively keep moisture out of the logger, they
52 Department of Water
need to be changed on a regular basis resulting in higher logger maintenance costs. This is a particular problem in humid areas, where the desiccant may need replacing up to once a fortnight.
Vent tubes with contaminant-resistant material must be used if contaminants are present in the groundwater or surface water being monitored, which can significantly increase installation cost. Additionally, if a logger has been deployed in contaminated water, it must be decontaminated before it can be reinstalled. This may take a considerable amount of time since vent tubes are typically 10 m in length or longer.
Vented loggers are not flexible when it comes to deploying them at various depths. The cables cannot be lengthened without returning to the supplier, and cables typically cost $70 per metre. Shortening the cable requires the user to delicately coil the cable without creating any kinks.
If the end of the vented logger cable is inundated by surface flooding, subsequent data would be compromised due to unknown pressure compensation dynamic. This is a significant problem for monitoring water levels near streams and rivers related to rainfall events.
Non-vented loggers do not use vent tubes and are generally sole-enclosed systems. Instead, these loggers have to be barometrically compensated using a barometric pressure logger and a simple software function to perform the pressure conversion. Barometric pressure values can also be obtained from nearby weather stations within a 15 km radius. They are more compact, require minimal maintenance, can be easily deployed in wells of varying depths and are not affected by floodwater.
6.3 Wireless download of data loggers
There are new technologies enabling to capture readings from multiple groundwater monitoring bores without the need to enter the site. Schlumberger Water Services have developed the Diver-NETZ, which is a completely wireless groundwater monitoring system. The Diver-NETZ enables downloading of data loggers within a 200 m radius that could be useful in areas with access problems such as on private property or boggy ground.
6.4 Telemetry
Data telemetry allows continuous measurement sites to be remotely monitored through a communication link. These links have traditionally been a cable, radio or cellular telephone system; however, this was not available in many areas of Western Australia.
Development in communication technologies has seen the introduction of commercial satellite services that extend voice and data link to all remote areas at reasonable cost. Satellite phones can now be installed at a field site and connected

Department of Water 53
to a data logger. A computer system can readily contact the site and recover the data.
The same telemetry approach has been used for many years to collection surface water data in support of flood protection. The Hydstra data system has been set up to recover and process the data, before posting onto the internet. Telemetry is considered expensive to install and operate; however, it may be cost effective in reducing field visits to remote areas.
Telemetry stations are vulnerable to acts of vandalism. In addition, lightning has the potential to destroy electronic equipment by direct strike, or damage it by inducing direct surges into the circuits of through connected cables. It is difficult and expensive to completely protect a site from lightning damage.
There is limited scope or need for widespread application of telemetry in groundwater measurement due to the small fluctuations in groundwater level. However, there may be site-specific or important management criteria bores that could be included in a real time groundwater monitoring system.
6.5 Trials using data loggers
The SGIP has been trialling data loggers in the Gingin Brook investigation. Non-vented Level Troll 100 data loggers were installed in all 32 bores to understand connectivity between aquifers and the brook.
The more frequent water level data has yielded some interesting results with hydrographs exhibiting very different water level responses to abstraction and rainfall. These different responses have demonstrated that the aquifers are not directly connected with the shallow bore (Fig. 13) responding to rainfall immediately and the deeper bore (Fig. 14) showing more subdued changes. The red, solid dots on Figures 13 and 14 indicate when monthly manual measurements would have normally been collected and highlight the difficulties in making interpretations and how much information is missed collecting time-discrete measurements.
Further trials of different data loggers are being supervised by Water Resource Assessment Branch using funding from the Bureau of Meteorology. This trial will evaluate four different types of data logger (vented and non-vented) and telemetry systems, in order to determine data accuracy, the ease and cost of installation, downloading and processing of data, as well as developing new standards for automated groundwater measurement such as levels of accuracy, indicative time intervals, quality control and processing requirements. The trial will help the Department to select the most efficient and cost-effective data loggers for its future network.
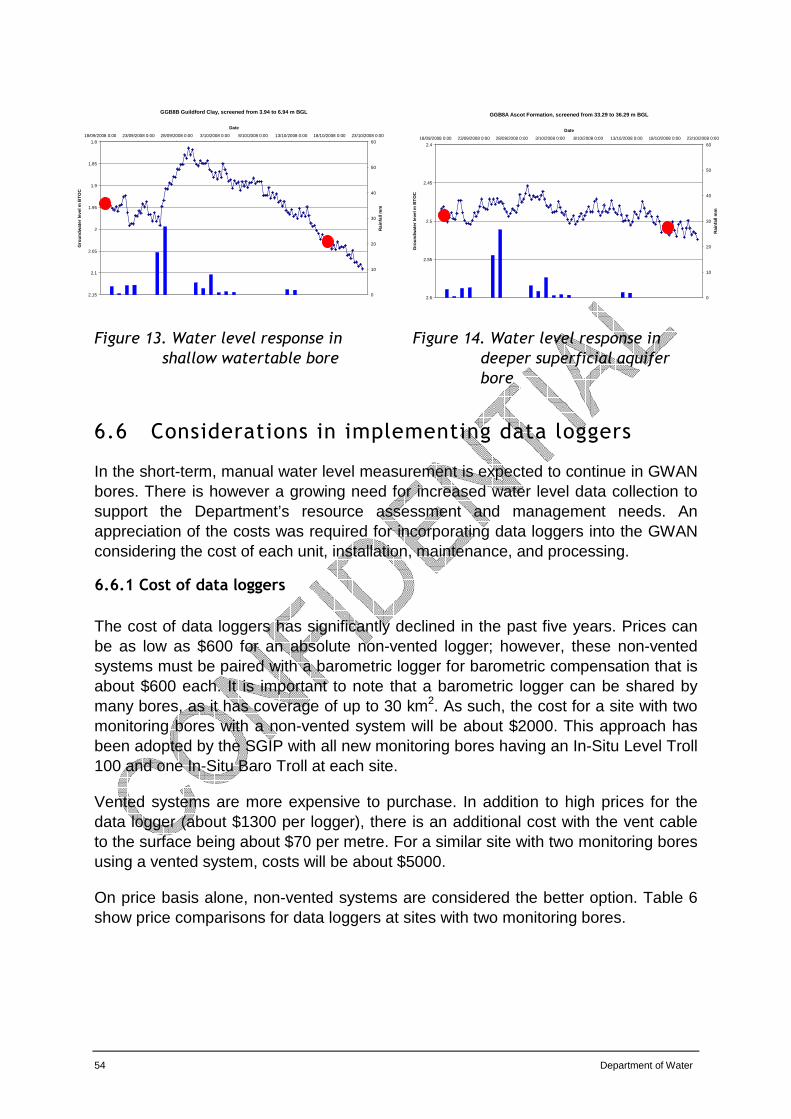
54 Department of Water
Figure 13. Water level response in
shallow watertable bore
Figure 14. Water level response in
deeper superficial aquifer
bore
6.6 Considerations in implementing data loggers
In the short-term, manual water level measurement is expected to continue in GWAN bores. There is however a growing need for increased water level data collection to support the Department’s resource assessment and management needs. An appreciation of the costs was required for incorporating data loggers into the GWAN considering the cost of each unit, installation, maintenance, and processing.
6.6.1 Cost of data loggers
The cost of data loggers has significantly declined in the past five years. Prices can be as low as $600 for an absolute non-vented logger; however, these non-vented systems must be paired with a barometric logger for barometric compensation that is about $600 each. It is important to note that a barometric logger can be shared by many bores, as it has coverage of up to 30 km2. As such, the cost for a site with two monitoring bores with a non-vented system will be about $2000. This approach has been adopted by the SGIP with all new monitoring bores having an In-Situ Level Troll 100 and one In-Situ Baro Troll at each site.
Vented systems are more expensive to purchase. In addition to high prices for the data logger (about $1300 per logger), there is an additional cost with the vent cable to the surface being about $70 per metre. For a similar site with two monitoring bores using a vented system, costs will be about $5000.
On price basis alone, non-vented systems are considered the better option. Table 6 show price comparisons for data loggers at sites with two monitoring bores.
GGB8B Guildford Clay, screened from 3.94 to 6.94 m B GL
1.8
1.85
1.9
1.95
2
2.05
2.1
2.15
18/09/2008 0:00 23/09/2008 0:00 28/09/2008 0:00 3/10/2008 0:00 8/10/2008 0:00 13/10/2008 0:00 18/10/2008 0:00 23/10/2008 0:00
Date
Gro
undw
ater
leve
l m B
TO
C
0
10
20
30
40
50
60
Rai
nfal
l mm
GGB8A Ascot Formation, screened from 33.29 to 36.29 m BGL
2.4
2.45
2.5
2.55
2.6
18/09/2008 0:00 23/09/2008 0:00 28/09/2008 0:00 3/10/2008 0:00 8/10/2008 0:00 13/10/2008 0:00 18/10/2008 0:00 23/10/2008 0:00
Date
Gro
undw
ater
leve
l m B
TO
C
0
10
20
30
40
50
60
Rai
nfal
l mm
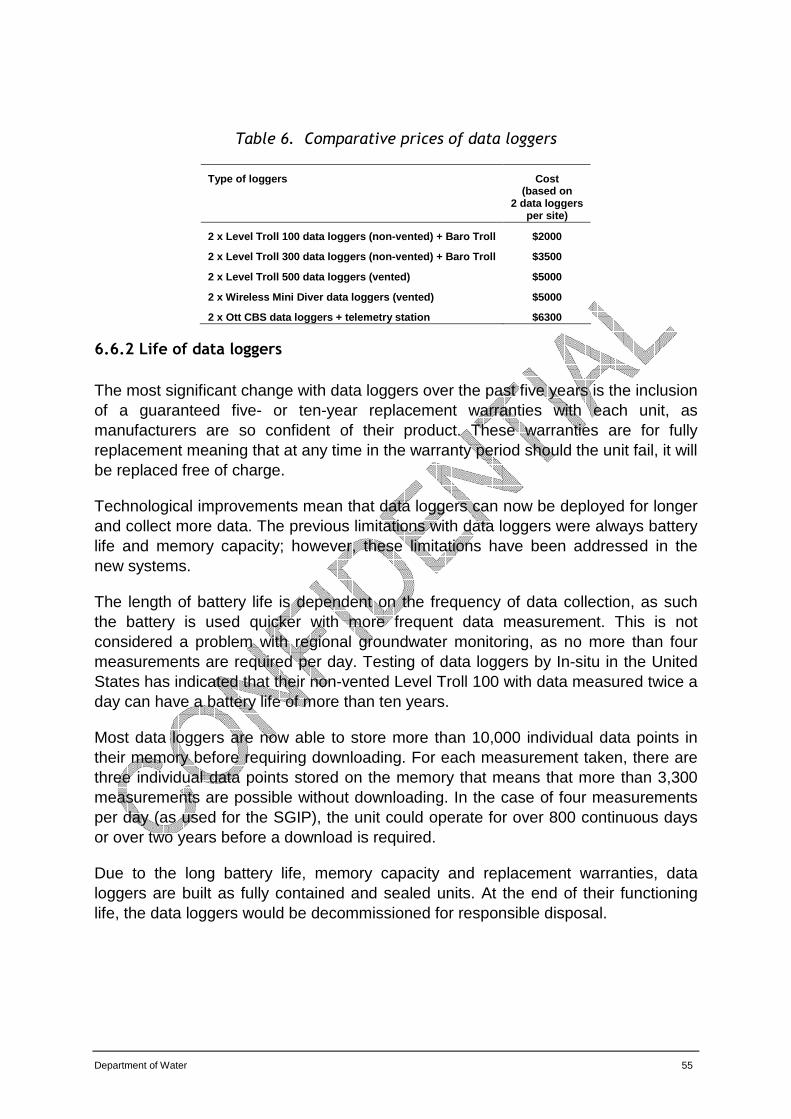
Department of Water 55
Table 6. Comparative prices of data loggers
Type of loggers Cost (based on
2 data loggers per site)
2 x Level Troll 100 data loggers (non-vented) + Bar o Troll $2000
2 x Level Troll 300 data loggers (non-vented) + Bar o Troll $3500
2 x Level Troll 500 data loggers (vented) $5000
2 x Wireless Mini Diver data loggers (vented) $5000
2 x Ott CBS data loggers + telemetry station $6300
6.6.2 Life of data loggers
The most significant change with data loggers over the past five years is the inclusion of a guaranteed five- or ten-year replacement warranties with each unit, as manufacturers are so confident of their product. These warranties are for fully replacement meaning that at any time in the warranty period should the unit fail, it will be replaced free of charge.
Technological improvements mean that data loggers can now be deployed for longer and collect more data. The previous limitations with data loggers were always battery life and memory capacity; however, these limitations have been addressed in the new systems.
The length of battery life is dependent on the frequency of data collection, as such the battery is used quicker with more frequent data measurement. This is not considered a problem with regional groundwater monitoring, as no more than four measurements are required per day. Testing of data loggers by In-situ in the United States has indicated that their non-vented Level Troll 100 with data measured twice a day can have a battery life of more than ten years.
Most data loggers are now able to store more than 10,000 individual data points in their memory before requiring downloading. For each measurement taken, there are three individual data points stored on the memory that means that more than 3,300 measurements are possible without downloading. In the case of four measurements per day (as used for the SGIP), the unit could operate for over 800 continuous days or over two years before a download is required.
Due to the long battery life, memory capacity and replacement warranties, data loggers are built as fully contained and sealed units. At the end of their functioning life, the data loggers would be decommissioned for responsible disposal.

56 Department of Water
6.6.3 Maintenance
The ongoing maintenance of any automated measurement system is often never truly estimated prior to installation. Understandably, there have been concerns about the ongoing cost of an automated groundwater measurement program.
As data loggers have five- or ten-year full replacement warranties, the ongoing maintenance of the loggers is considered negligible. If a data logger fails, it is simply returned to the manufacturer and replaced with a new one. The integrity of these warranties has been tested in the SGIP and SGS programs with the failing of a couple of units, which were fully replaced with new units provided within five working days. Failed units were returned to the manufacturer for testing to understand the failure and attempt to capture the missing data.
6.6.4 Downloading time
In addition to the increasing technology within data loggers, computing speed and software has also significantly evolved in recent years. This has meant that data stored in the data loggers can now be downloaded at very fast speeds in the field. The length of time required to download is largely dependent on communication links and data logger systems.
Non-vented systems require a manual measurement to be collected prior to removing logger from hole and afterwards for data calibration and verification. The logger is connected via a download portal to the field PC with the software taking about five minutes to download 10,000 data points. This process is repeated for each water level logger as well as the barometric logger. For a site with two water level loggers and a barometric logger, the downloading process generally takes about 45 minutes.
Obviously, downloading of data is quicker from systems with data connections above surface or more telemetry-like systems. This quicker data download speed is not considered a cost saving, as these systems are often three or four times more expensive.
6.6.5 Processing
The processing requirements of downloaded water level data for groundwater are considerably less than surface water. At present, there are no standards for the extent of processing including trace analysis. There will be further work undertaken as part of the BOM-funded trial to establish protocols for processing groundwater data from automated systems and submission into the Hydstra database.
In order to gain an indication of processing time, there have already been a number of downloads completed from data loggers installed by SGIP and SGS. It has been found that less than 5 minutes for each bore is required to merge the barometric data and verify the water levels with manual measurements.

Department of Water 57
The speed of data processing will probably increase once protocols are established and implemented. It is considered that most hydrographic processing would be undertaken in the regions with the implementation of a more automated system, as staff would be required to undertake less field visits.
The process and protocols for the uploading of groundwater level data into the Hydstra database is being assessed by the Water Information Branch. Issues of quality control and categorising of data are being considered. This work is important as there is a need to ensure that data can be captured easily and readily.
6.6.6 Cost benefit analysis
The benefits of an automated water level measurement approach have already been documented. It must however be again stressed that the Department will require better groundwater data to make more difficult groundwater resource management decisions in the future.
The greatest benefits will be noticeable in the Swan and South West regions, where there are large numbers of bores requiring more than six measurements per year. In the Swan Region, there are 570 GWAN bores monitored more than six times a year including 440 bores that are measured monthly. While in the South West Region, there are 677 bores that are monitored six times per year with data being missed for the remaining six months of the year.
Field visits may reduce to either two or four times per year resulting in improved efficiency of data collection, less use of vehicles with reduced carbon emissions, and better working conditions for field staff with less time away from family. Many of the benefits cannot be fully costed; however, it is considered that automated water level measurement is no more labour intensive than manual measurement.
A fully-costed manual water level monitoring program, estimated at about $800,000 per year, is capable of providing about 12,000 individual measurements. This equates to an individual costing of about $70 per manual measurement and aligns with estimates from this review. In comparison, assuming similar operational costs and an additional $1 million per year for data loggers, the cost of an individual measurement could be as low as $0.50 with four data measurements per day across the whole GWAN. This is considered excellent value for money and a more effective use of government funds.
6.6.7 Implementation approach
Automated water level measurement will only be successfully implemented with careful planning and a clear approach to data collection, verification and processing. Protocols and procedures must be as simple as possible, so that automated measurement is no more onerous than manual collection.

58 Department of Water
The installation of data loggers would be prioritised in the Perth and South-West regions, which are more frequently monitored on a manual basis. This would be followed by more remote areas of the Mid West and North West Regions.
The high humidity in the northern regions will require the use of non-vented systems, as there would be significant maintenance requirements in vented systems. Vented systems can only be considered in the Swan and South West Regions, probably to the south of Gingin.
Downloading data loggers at three monthly intervals is recommended for the first year to confirm performance and workload demands. Only after a review, can the frequency of downloading will be recommended; however, it is intended that twice a year would be most likely.
There will be significant efficiency improvements by using data loggers. Field work will be reduced from monthly and/or six times per year to twice per year, which is a substantial saving. While in bores that are currently monitored twice per year, there may be slight increase in workload but there will be a significant increase in the data collection from two water level points per year to potentially 1460 data points per year (when measured four times per day).
A manual water level measurement is still required prior to downloading for data calibration and verification. Also if the data logger has failed, there is still at least one recorded water level. In the event that there is data logger failure, this is not a concern with a replacement data logger installed immediately and the faulty logger returned to the manufacturer under warranty. It should be remembered that any continuous water level data is considered a bonus above and beyond the collection of just one-off manual data point.
The implementation of data loggers will reduce substantially the number of field visits. There will be a slight increase in the time at site for downloading data loggers and it has been estimated that ten data loggers can be downloaded per day. The time not spent in the field will be used for data verification and quality control, which is probably a better use of regional measurement staff rather than routine field data collection.
Department of Water 59
7 Improved groundwater monitoring – a staged approach
Groundwater resources across Western Australia are experiencing increasing demand and development, which will require a better understanding of the resources to support the Department of Water’s management decisions. There is a need to improve current monitoring activities to reflect groundwater use in Western Australia, particular as areas move towards or becoming fully allocated.
Improvements in the groundwater monitoring program are only possible through better management and coordination, integration with the Department’s strategic plan, providing technical direction, and addressing ongoing shortfall in funding. This is a critical in ensuring that groundwater monitoring is re-established within the core business of the Department.
The proposed groundwater monitoring program has an immediate focus to address the current deficiencies in manual measurement, as well as to provide a long-term strategy for future groundwater monitoring. This two staged approach will firstly enhance the existing manual measurement program by ensuring it is adequate and appropriately funded for current needs; and secondly the progressive utilisation of automated measurement, improved processing and better project coordination to meet future needs.

60 Department of Water
7.1 Existing monitoring practice
The Water Resources Assessment Branch is the scientific custodian of the groundwater monitoring network; however, its direct involvement in the setting of program objectives and distribution of funding has been limited. Groundwater monitoring is currently managed by the Regional Management and Water Information Division being responsible for distributing of funds for both groundwater and surface water measurement. Regional measurement staff are required to develop work programs and undertake field work to collect the necessary groundwater measurements.
7.1.1 Water level monitoring
Water level measurements are currently collected as discrete field measurements by manually dipping using water level probes. The frequency of monitoring relates to the proportion of allocation limits licensed and on statutory obligations, ranging between once and twelve times a year. This process of manual measurement is quite labour-intensive and involves substantial travelling time, particularly when monthly monitoring is required. Regional measurement staff spend a large proportion of their working year collecting monthly readings.
After measuring, the new water level data is captured onto paper ‘WIN forms’ in the field. The Swan Region transcribes the data onto region-specific forms (this enables comparison of the new data with previous measurements) prior to the ‘WIN forms’. The completed forms are sent to the Water Information Branch with the data typed into spreadsheets with the appropriate quality assurance (QA) controls and finally uploaded into the WIN database. In cases where there is a large backlog, the work is sometimes outsourced.
The Department of Water is currently testing and developing a system where field laptops (known as ‘Toughbook’) can be used to capture field results directly, in order to prevent duplication of work by using paper forms. This will improve quality control, and reduce time and costs; however, there are still some logistical issues that need to be resolved. This development is currently not funded and being undertaken by staff in the Water Information Branch when time permits.
7.1.2 Automated measurement
As part of investigations under the Shallow Groundwater Systems (SGS) and SGIP, new monitoring bores are being equipped with non-vented data loggers (such as Level Troll 100) to collect continuous water level data. These bores were initially monitored manually at monthly intervals; however, it was concluded that that more frequent (or continuous) water level measurements were required. Using monthly data, it was impossible to understand / quantify groundwater interactions between aquifers and GDEs, recharge responses from rainfall, observe changes in water levels due to abstraction, and support better model calibration.
Department of Water 61
Data loggers are capable of collecting many readings per day. The adopted standard for the SGIP has been four readings a day at six hourly intervals. The data loggers are currently downloaded at three-monthly intervals with manual measurements also collected for calibration and cross checking. This data is then integrated and stored in the Hydstra database.
At present, there are no automated water level systems being used as part of the regional groundwater monitoring program. This is due to concerns about large data processing requirements, data storage limitations and ongoing maintenance costs. Based on the trials within the SGIP and SGS, it is considered that there is scope for automated water level measurements using data loggers across part or the entire regional groundwater monitoring network.
7.1.3 Water quality monitoring
As highlighted in Section 2.3, there are major deficiencies in the collection of water quality data. Most of the data was collected in the Carnarvon irrigation district, as part of monitoring groundwater salinity with respect to groundwater abstraction in the alluvial aquifer. Although not part of this review, it is recommended that there is a comprehensive assessment of water quality monitoring required by the Department.
7.1.4 Data management
Access to reliable data (current and historical) is a critical component in understanding the performance and response of groundwater resources. The management of groundwater monitoring data in the Department is focused around two primary databases being WIN (Water Information) and Hydstra, which are managed by Water Information Branch. Storage, quality assurance and recovery of data from these databases are an important part of the groundwater monitoring program.
The WIN database is an Oracle data management system with a Java interface and Cognos Impromptu being the web-based reporting tool. It is the primary database for storing point or discrete sample data. These data include site details (such as location, depth, geological logs and bore construction) and discrete or one-off sample data being water levels and chemical analyses. The WIN database is the primary database for storing water level data that is collected manually.
Hydstra, a commercially-available data management software, is the Department’s primary database for the storing of continuous sample data. This database is used to store all data collected by data loggers.
As part of appropriate data management, there is need to undertake quality assurance and control to have confidence in the collected data and data management systems. The Department has documented quality assurance procedure for water level data collected in the field, and prior to entering data into WIN and Hydstra. These protocol procedures are contained in the Department’s
62 Department of Water
Water Information Bookshelf system. There is a need for further development of more specific protocols for handling groundwater data collected by data loggers.
7.2 Enhanced manual measurement – Stage 1
Groundwater monitoring of the new GWAN bores will continue to be collected by manual water level measurement. The process is well established in the regions but is considered the minimum amount of groundwater measurement required to meet current needs. It is seen that is an interim approach for two years (2009/10 and 2010/11), which will facilitate the transition and acquiring of funding for the longer-term solution.
A two-year transitional period is important as it will ensure that there is a commitment to undertake manual measurement, provide appropriate funding and rebuild capacity in the regions, and establish program coordination with improved communication and technical direction. It will provide time for regional measurement staff for training on the importance of collection groundwater data, as well as data collection and processing related to automated measurement. At the same time, simplified protocols for data collection and processing from data loggers will be developed.
The monitoring frequency for manual measurement for each GWAN monitoring bore has been set by the Water Resource Assessment Branch. Table 7 indicates the number of GWAN bores and required frequencies for each region. The frequency was based on an assessment of knowledge requirements, management objectives and statutory obligations of the groundwater resources. As a general guide, the minimum monitoring frequency for manual water level measurements is recommended as follows:
• Swan Region – twice to twelve times per year. Measurements twice a year to be undertaken in about October (end of the winter) and April (end of summer). Artesian Monitoring (AM) bores and bores near high-value wetlands will be monitored on a monthly basis.
• South West Region – six times per year. Measurements to be taken in March, April and May (end of summer), and September, October and November (end of winter).
• Mid West (Geraldton), North West Pilbara and Kimberley Regions. Measurements at the end of the dry season (October) and wet season (March/April).
• Mid West (Carnarvon) Region - four times per year with measurements in March, June, September and December.
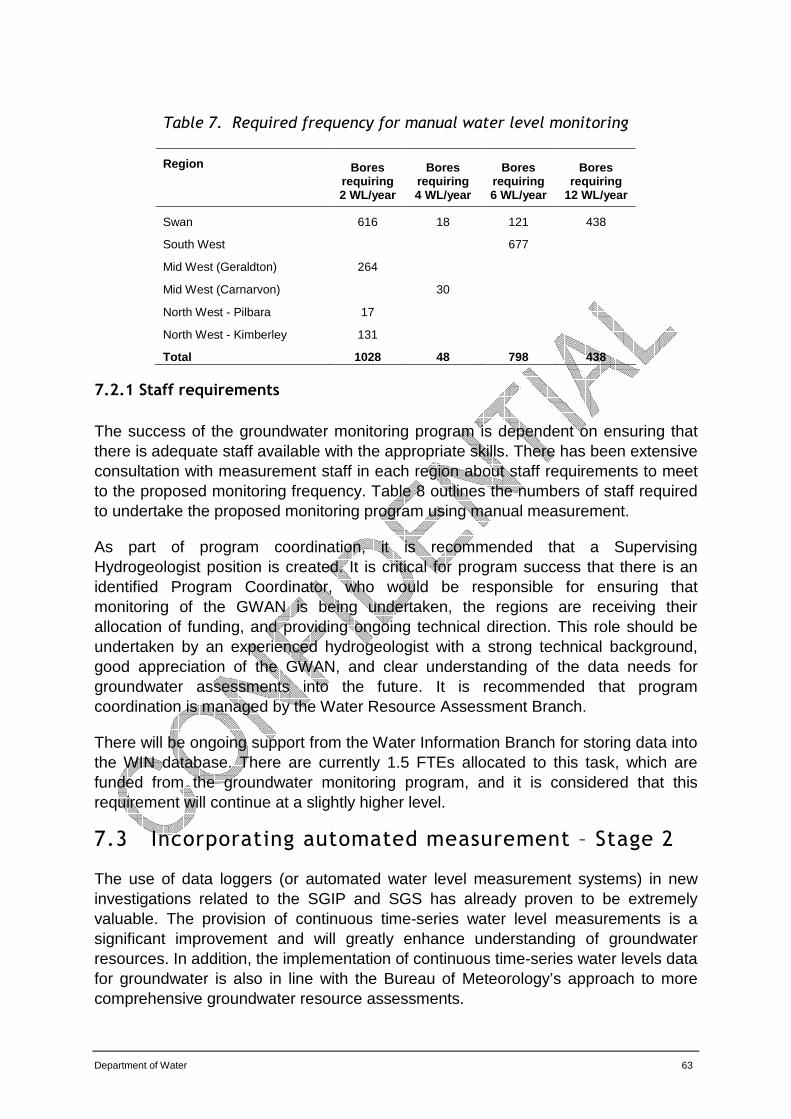
Department of Water 63
Table 7. Required frequency for manual water level monitoring
Region Bores requiring 2 WL/year
Bores requiring 4 WL/year
Bores requiring 6 WL/year
Bores requiring
12 WL/year
Swan 616 18 121 438
South West 677
Mid West (Geraldton) 264
Mid West (Carnarvon) 30
North West - Pilbara 17
North West - Kimberley 131
Total 1028 48 798 438
7.2.1 Staff requirements
The success of the groundwater monitoring program is dependent on ensuring that there is adequate staff available with the appropriate skills. There has been extensive consultation with measurement staff in each region about staff requirements to meet to the proposed monitoring frequency. Table 8 outlines the numbers of staff required to undertake the proposed monitoring program using manual measurement.
As part of program coordination, it is recommended that a Supervising Hydrogeologist position is created. It is critical for program success that there is an identified Program Coordinator, who would be responsible for ensuring that monitoring of the GWAN is being undertaken, the regions are receiving their allocation of funding, and providing ongoing technical direction. This role should be undertaken by an experienced hydrogeologist with a strong technical background, good appreciation of the GWAN, and clear understanding of the data needs for groundwater assessments into the future. It is recommended that program coordination is managed by the Water Resource Assessment Branch.
There will be ongoing support from the Water Information Branch for storing data into the WIN database. There are currently 1.5 FTEs allocated to this task, which are funded from the groundwater monitoring program, and it is considered that this requirement will continue at a slightly higher level.
7.3 Incorporating automated measurement – Stage 2
The use of data loggers (or automated water level measurement systems) in new investigations related to the SGIP and SGS has already proven to be extremely valuable. The provision of continuous time-series water level measurements is a significant improvement and will greatly enhance understanding of groundwater resources. In addition, the implementation of continuous time-series water levels data for groundwater is also in line with the Bureau of Meteorology’s approach to more comprehensive groundwater resource assessments.
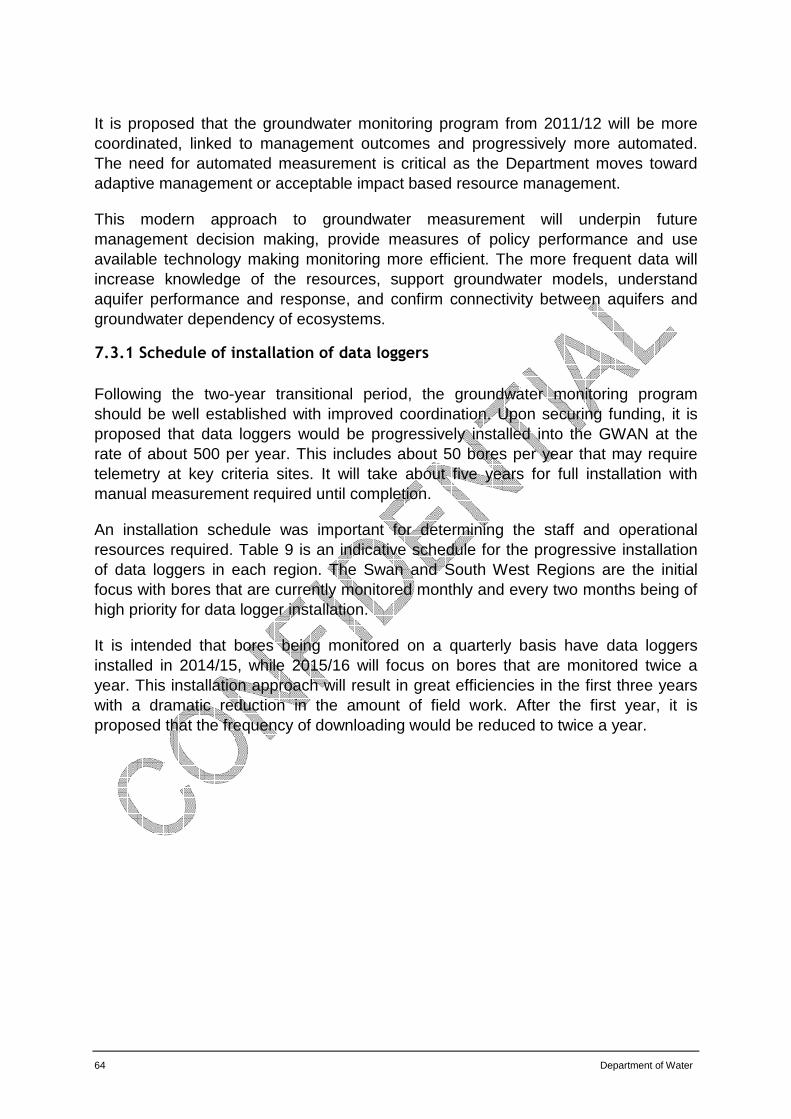
64 Department of Water
It is proposed that the groundwater monitoring program from 2011/12 will be more coordinated, linked to management outcomes and progressively more automated. The need for automated measurement is critical as the Department moves toward adaptive management or acceptable impact based resource management.
This modern approach to groundwater measurement will underpin future management decision making, provide measures of policy performance and use available technology making monitoring more efficient. The more frequent data will increase knowledge of the resources, support groundwater models, understand aquifer performance and response, and confirm connectivity between aquifers and groundwater dependency of ecosystems.
7.3.1 Schedule of installation of data loggers
Following the two-year transitional period, the groundwater monitoring program should be well established with improved coordination. Upon securing funding, it is proposed that data loggers would be progressively installed into the GWAN at the rate of about 500 per year. This includes about 50 bores per year that may require telemetry at key criteria sites. It will take about five years for full installation with manual measurement required until completion.
An installation schedule was important for determining the staff and operational resources required. Table 9 is an indicative schedule for the progressive installation of data loggers in each region. The Swan and South West Regions are the initial focus with bores that are currently monitored monthly and every two months being of high priority for data logger installation.
It is intended that bores being monitored on a quarterly basis have data loggers installed in 2014/15, while 2015/16 will focus on bores that are monitored twice a year. This installation approach will result in great efficiencies in the first three years with a dramatic reduction in the amount of field work. After the first year, it is proposed that the frequency of downloading would be reduced to twice a year.

Department of Water 65
Table 9. Schedule for installation of data loggers
Data loggers to be installed Region
Number
of bores 2011/12 2012/13 2013/14 2014/15 2015/16
Swan Region 1217 500 300 300 117
South West Region 677 200 200 301
Mid West Region - Geraldton 264 82 182
Mid West Region - Carnarvon 30 30
North West Region - Pilbara 17 17
North West Region - Kimberley 131 131
Total 2336 500 500 500 500 360
7.3.2 Staff requirements
The implementation of the automated system will require appropriately skilled and trained staff for installing, downloading, data processing and program coordination. The amount of staff required is largely dependent on the frequency of installation and rates of downloading.
The trialling of data loggers by Water Resource Assessment Branch, as part of the SGIP and SGS, has enabled a true and accurate estimation of time required for the various tasks. During this work, there have been many lessons learnt with data logger installation, downloading and data processing. These learnings will lead to improvements in future efficiency, and ensures that time and cost estimations are meaningful and realistic.
Installation
The installation of data loggers can be streamlined and more efficient by undertaking preparation prior to undertaking field installation. All data loggers are already pre-calibrated when purchased, so there is no requirement for calibration or testing. The main preparatory tasks include the prefabrication of installation cables and site registration of each data logger. It has been determined that these tasks can be completed at the rate of 25 data loggers per day, which equates to a work program of 18 working days for 450 data loggers.
Adequate preparation ensures that field installation or deployment of data loggers is time efficient and minimises problems. The main tasks in the field installation are manual water level measurement for calibration setting, starting the logger, and connecting the pre-fabricated unit and barometric logger to the bore casing. The rate of installation is dependent on the number of bores at any site and distance between bores. It has been estimated that field installation can be completed at the rate of 12 data loggers per day for one person or 20 data loggers per day with two people. The field installation of 450 data loggers requires about 40 working days.

66 Department of Water
In summary, the installation of 450 non-vented data loggers into the GWAN would require about 60 working days or equates to 0.3 FTE. It is considered that the installation of 450 data loggers without telemetry could be readily installed by Departmental staff. The installation could be undertaken by regional measurement staff; however, it is a better option to employ a dedicated technical officer. One task of this officer would be the installation and replacement of old or faulty data loggers.
The installation of the telemetry sites would probably be undertaken by an external hydrographic contractor. This approach is currently being evaluated by WRAB, as it is considered a cost and time efficient option. The main issue will be to ensure that data can be readily captured, verified and uploaded into the Hydstra database.
Downloading
As with the installation of the data loggers, the rate of download is dependent on the number of bores at any site and distance between bores. Another variable is the type of data logger and whether it can be downloaded in-situ or requires temporary removal. It has been estimated that field measurement staff could download about 10 data loggers per day in the Swan, South West and Mid West – Carnarvon Regions; however, this may reduce to 2 to 5 data loggers per day in the North West and other parts of the Mid West Regions.
The time required for an individual download may range from 5 minute with a wireless in-situ through to 30 minutes with manual download. There are obvious cost savings related to quicker downloading; however, these units are often two to three times more expensive at installation. It is considered that downloading of the cheaper, more manual data logger (such as the Level Troll 100) is more cost effective than the in-situ systems; however, an in-situ, non-vented logger with data communication cable (such as the Level Troll 200) may be cost neutral.
The frequency of download would initially be four times a year in the Swan, South West and Mid West (Carnarvon) Regions in the first year to check their performance. It is then proposed that the four times a year will continue for the Mid West (Carnarvon) Region, while the download frequency would be reduced to twice a year in the Swan and South West Regions. The use of data loggers will reduce substantially the number of field visits; however, the time spent at each bore may slightly increase from 15 minutes for manual measurement to 30 minutes for an automated system.
Tables 10a, 10b and 10c show the staff requirements for different download frequencies at one, two and four downloads per year respectively. There is a direct relationship between increasing the download frequency with staff requirement. It is important to note that the number of staff required for manual measurement (5.5 FTEs) is similar to the 5.8 FTEs required for two downloads per year using an automated system.
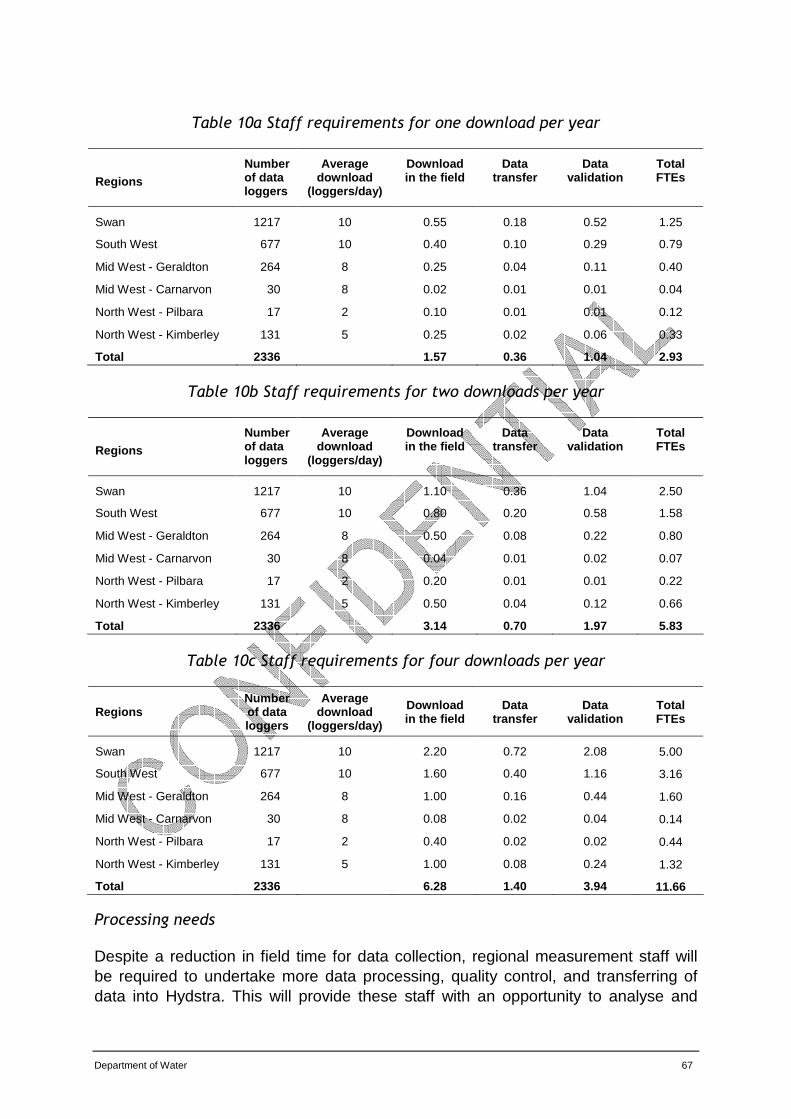
Department of Water 67
Table 10a Staff requirements for one download per year
Regions
Number of data loggers
Average download
(loggers/day)
Download in the field
Data transfer
Data validation
Total FTEs
Swan 1217 10 0.55 0.18 0.52 1.25
South West 677 10 0.40 0.10 0.29 0.79
Mid West - Geraldton 264 8 0.25 0.04 0.11 0.40
Mid West - Carnarvon 30 8 0.02 0.01 0.01 0.04
North West - Pilbara 17 2 0.10 0.01 0.01 0.12
North West - Kimberley 131 5 0.25 0.02 0.06 0.33
Total 2336 1.57 0.36 1.04 2.93
Table 10b Staff requirements for two downloads per year
Regions
Number of data loggers
Average download
(loggers/day)
Download in the field
Data transfer
Data validation
Total FTEs
Swan 1217 10 1.10 0.36 1.04 2.50
South West 677 10 0.80 0.20 0.58 1.58
Mid West - Geraldton 264 8 0.50 0.08 0.22 0.80
Mid West - Carnarvon 30 8 0.04 0.01 0.02 0.07
North West - Pilbara 17 2 0.20 0.01 0.01 0.22
North West - Kimberley 131 5 0.50 0.04 0.12 0.66
Total 2336 3.14 0.70 1.97 5.83
Table 10c Staff requirements for four downloads per year
Regions Number of data loggers
Average download
(loggers/day)
Download in the field
Data transfer
Data validation
Total FTEs
Swan 1217 10 2.20 0.72 2.08 5.00
South West 677 10 1.60 0.40 1.16 3.16
Mid West - Geraldton 264 8 1.00 0.16 0.44 1.60
Mid West - Carnarvon 30 8 0.08 0.02 0.04 0.14
North West - Pilbara 17 2 0.40 0.02 0.02 0.44
North West - Kimberley 131 5 1.00 0.08 0.24 1.32
Total 2336 6.28 1.40 3.94 11.66
Processing needs
Despite a reduction in field time for data collection, regional measurement staff will be required to undertake more data processing, quality control, and transferring of data into Hydstra. This will provide these staff with an opportunity to analyse and
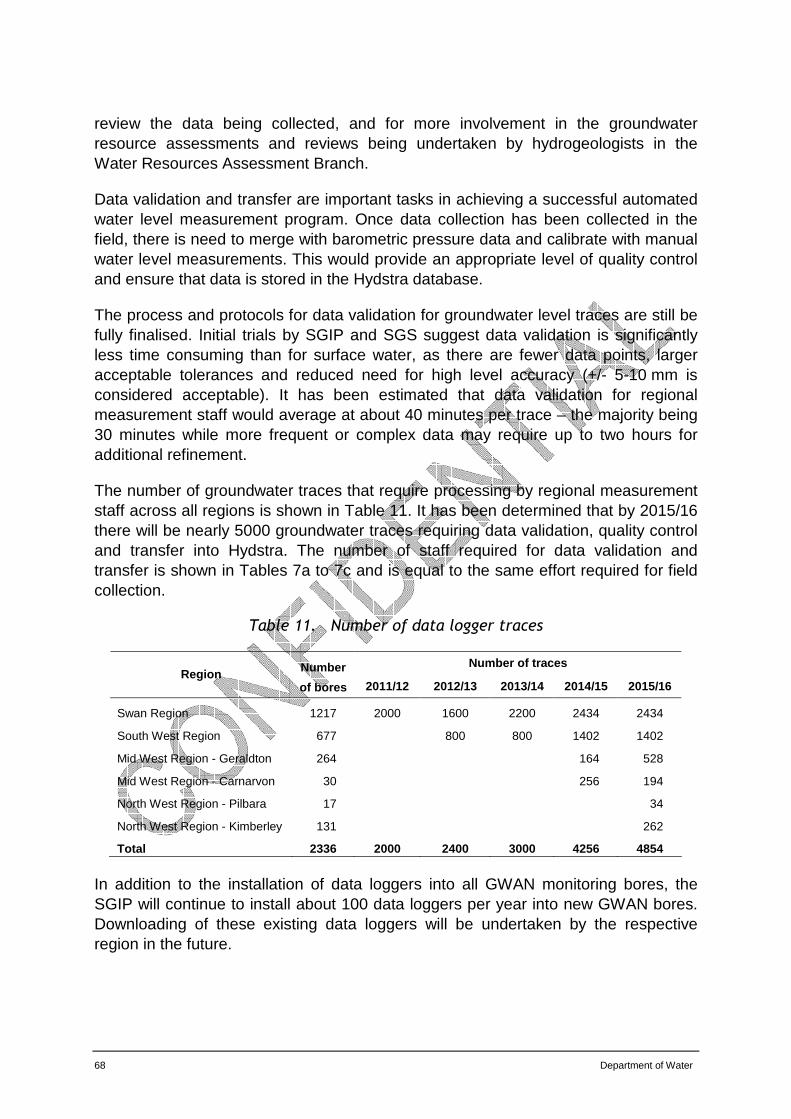
68 Department of Water
review the data being collected, and for more involvement in the groundwater resource assessments and reviews being undertaken by hydrogeologists in the Water Resources Assessment Branch.
Data validation and transfer are important tasks in achieving a successful automated water level measurement program. Once data collection has been collected in the field, there is need to merge with barometric pressure data and calibrate with manual water level measurements. This would provide an appropriate level of quality control and ensure that data is stored in the Hydstra database.
The process and protocols for data validation for groundwater level traces are still be fully finalised. Initial trials by SGIP and SGS suggest data validation is significantly less time consuming than for surface water, as there are fewer data points, larger acceptable tolerances and reduced need for high level accuracy (+/- 5-10 mm is considered acceptable). It has been estimated that data validation for regional measurement staff would average at about 40 minutes per trace – the majority being 30 minutes while more frequent or complex data may require up to two hours for additional refinement.
The number of groundwater traces that require processing by regional measurement staff across all regions is shown in Table 11. It has been determined that by 2015/16 there will be nearly 5000 groundwater traces requiring data validation, quality control and transfer into Hydstra. The number of staff required for data validation and transfer is shown in Tables 7a to 7c and is equal to the same effort required for field collection.
Table 11. Number of data logger traces
Number of traces Region Number
of bores 2011/12 2012/13 2013/14 2014/15 2015/16
Swan Region 1217 2000 1600 2200 2434 2434
South West Region 677 800 800 1402 1402
Mid West Region - Geraldton 264 164 528
Mid West Region - Carnarvon 30 256 194
North West Region - Pilbara 17 34
North West Region - Kimberley 131 262
Total 2336 2000 2400 3000 4256 4854
In addition to the installation of data loggers into all GWAN monitoring bores, the SGIP will continue to install about 100 data loggers per year into new GWAN bores. Downloading of these existing data loggers will be undertaken by the respective region in the future.

Department of Water 69
The increasing amount of data and need for better integration with the WIN and Hydstra databases will require a closer working relationship with the Water Information Branch. There are currently 1.5 FTEs funded under the existing 2008/9 budget for the groundwater monitoring program; however, it is considered that 2 FTEs will be required to manage the workload.
Program coordination
The implementation and operation of a successful automated water level measurement program will require technical program direction. As highlighted for the manual measurement, a Supervising Hydrogeologist position is critical for program success being responsible for ensuring that monitoring is being undertaken, the regions are receiving their allocation of funding, and providing ongoing technical direction.
There is need for an experienced hydrogeologist to undertake the regular reviewing of the groundwater monitoring network. The hydrogeologist would work with the Groundwater Asset Section to provide technical advice on bore replacement and work programs involving maintenance of the GWAN. This position is important for checking the accuracy of the groundwater traces being transferred into Hydstra and working closely with regional measurement staff to identify and rectify problems.
As previously mentioned, a dedicated Technical Officer is proposed to be responsible for installing data loggers and working closely with regional measurement staff to resolve any issues with data loggers. This position would also support the hydrogeologist by checking the accuracy of the groundwater traces being transferred into Hydstra.
It is again recommended that program coordination is managed by the Water Resource Assessment Branch. A new section is proposed named ‘Monitoring and Regional Support’ that will coordinate groundwater monitoring, and provide hydrogeological support to the regions through closer supervision of the regional hydrogeologists. The creation of this section will provide a focus for the groundwater monitoring program, and will ensure that the regions are appropriately supported.
Total staff required
Table 12 shows the total number of staff required for a progressive implementation and ongoing operation of the automated water level measurement program. Initially, the program includes three positions for program coordination, two positions for data management and the remaining 5.4 FTEs for regional measurement staff. It must be highlighted that there is no fundamental difference in staff numbers between automated and manual measurement, except for the additional staff for program coordination. However, it must be emphasised that program coordination and technical support is critical for program success.
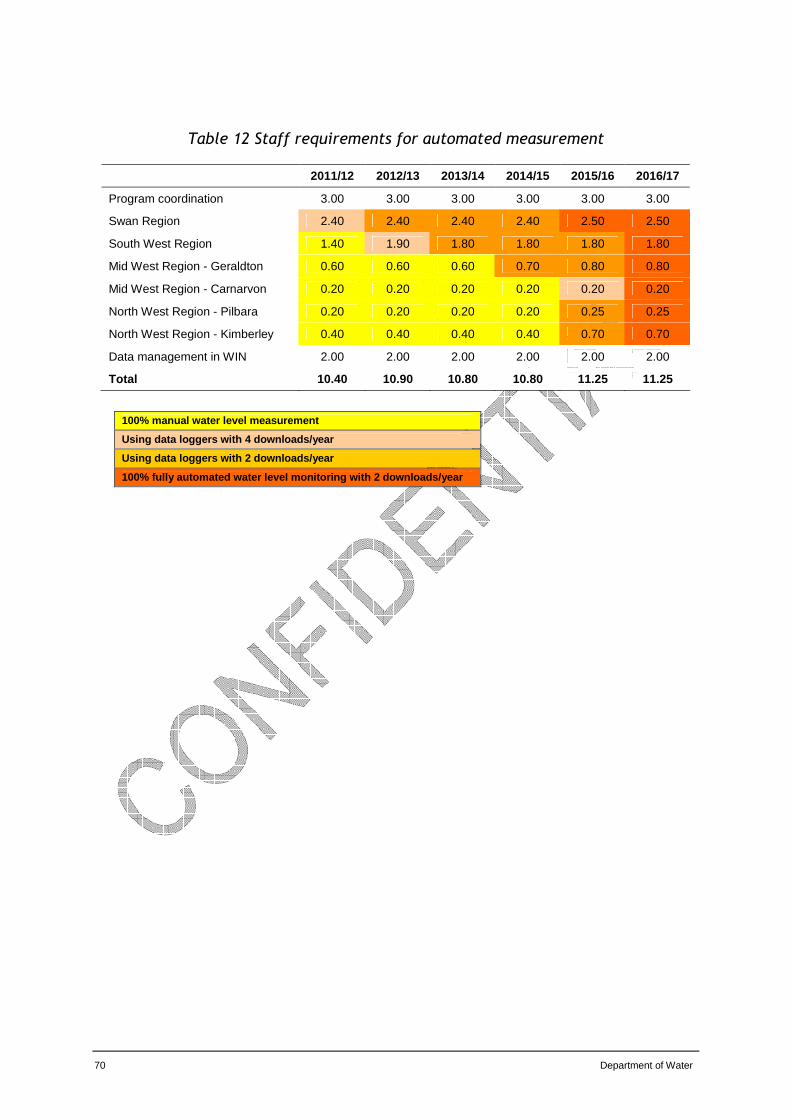
70 Department of Water
Table 12 Staff requirements for automated measurement
2011/12 2012/13 2013/14 2014/15 2015/16 2016/17
Program coordination 3.00 3.00 3.00 3.00 3.00 3.00
Swan Region 2.40 2.40 2.40 2.40 2.50 2.50
South West Region 1.40 1.90 1.80 1.80 1.80 1.80
Mid West Region - Geraldton 0.60 0.60 0.60 0.70 0.80 0.80
Mid West Region - Carnarvon 0.20 0.20 0.20 0.20 0.20 0.20
North West Region - Pilbara 0.20 0.20 0.20 0.20 0.25 0.25
North West Region - Kimberley 0.40 0.40 0.40 0.40 0.70 0.70
Data management in WIN 2.00 2.00 2.00 2.00 2.00 2.00
Total 10.40 10.90 10.80 10.80 11.25 11.25
100% manual water level measurement
Using data loggers with 4 downloads/year
Using data loggers with 2 downloads/year
100% fully automated water level monitoring with 2 downloads/year
Department of Water 71
8 The proposed groundwater monitoring program
8.1 Program cost and benefit
A rigorous financial analysis of the value to the entire State of current groundwater use has yet to be carried out. Marsden Jacob Associates (2006) determined that the annual value of groundwater of the Gnangara Mound is $0.91/kL, based on an economic value ($300 million per year) created from using 329 GL/yr of groundwater.
Most groundwater monitoring is required in the Perth Basin where there is about 500 GL/yr of groundwater use (Resource Economics Unit, 2009). Assuming a nominal value of $0.90/kL placed on that usage is $450 million per year, which is an approximately accounts for economic activity generated from that groundwater use. As such, the benefits in sustaining or increasing that level of use and potential to allocate additional groundwater by undertaking an appropriate level of monitoring will far outweigh any costs.
The progressive shift in water entitlements to higher value uses and the ability to manage water resources on the basis of a share of the available resources requires adequate knowledge of the resources. This knowledge can only be acquired through an ongoing process of groundwater investigations, assessment, review and monitoring. Unquantifiable benefit and cost analysis are as follows:
• better data will enable the agency to achieve its vision of sustainable use of natural resources;
• better groundwater management will assist the water utilities, and other natural resource management agencies, especially Agriculture, and Industry and Resources;
• most of the economy of Western Australia is underpinned by the availability of groundwater resources for domestic, agriculture, industry, and mining sector;
• the social implications of improved groundwater management are security of supply and long term sustainability; and
• the benefits of improved groundwater management and efficient use of the state’s groundwater resources will be primarily distributed across the community through the economic activity of the agricultural and mining sectors.
The concept of sustainable groundwater management can only be achieved with an adequate knowledge of groundwater resources and the ability to adequately monitor changes. It is therefore necessary for the Department to monitor the response and performance of groundwater resources, in order to make more-informed decisions in groundwater management and measure the success of its management approach.
72 Department of Water
The implementation of a strategic and suitably-funded groundwater monitoring program is critically important, as it underpins the entire groundwater management process.
8.2 Timing
The proposed monitoring program has been designed over an eight year period from 2009/10 to 2016/17. Although, it is considered that groundwater monitoring will be increasingly important and necessary into the future. Table 15 shows the timeline and related annual expenditure for the monitoring program.
The timeline has been developed to address the short-term deficiencies in the existing manual measurement program and to propose a future direction for groundwater monitoring. The automated measurement program requires the progressive installation of data loggers in the Swan and South West Regions, before moving into the more remote regions. The proposed monitoring program will complement the current and future management needs of the State’s groundwater resources.
8.3 Resources
8.4.1 Staff levels
In order to meet the proposed groundwater monitoring program, it is necessary that there be adequate staff available with the appropriate skills. Coordination and implementation of the monitoring program will require the employment of three new staff including a supervising hydrogeologist (Level SC4) being program coordinator, one hydrogeologist (Level SC2) and a technical officer (Level 4).
Program coordination is currently funded by the SGIP; however, this is not sustainable as it is impacting on the performance of this important program. It is recommended that the program coordinator is recruited as soon as possible. Initially, this could be a senior hydrogeologist before creating the supervising hydrogeologist position when the ‘Monitoring and Regional Support’ section is created and fully staffed. It may take two to three years to reach full staffing levels, which will enable thorough planning of the program.
The review has demonstrated that there will be no change in staff levels in the regions, but rather a change in work practice. Regional measurement staff will require training in the downloading of data loggers and processing of automated water level data into Hydstra. This training may be undertaken by the technical officer, who would be responsible for data logger installation.
The monitoring program will also require data management support to assist in data handling, storage and processing. All data that is generated from the program will be
Department of Water 73
entered and stored in either the Hydstra or WIN databases. Cost estimates related to this function have been incorporated into the project budget.
8.4.2 External contractors
The installation of data loggers with telemetry systems could be best undertaken by an external contractor. Initial discussions within the Department suggest that there is limited expertise and interest in installing groundwater telemetry As such, it is recommended that the 50 data loggers with telemetry are installed via an open tender process.
8.4 Program coordination
Since 1996 with the formation of the Water and Rivers Commission, the regional groundwater monitoring program has been suffering from lack of dedicated funding and resources. The groundwater and surface water measurement function is currently managed by the Regional Management and Water Information Division.
It is recommended that the regional groundwater monitoring program is managed by the Water Resource Assessment Branch within the Water Resource Management Division. The rationale being that the Water Resource Assessment Branch is the scientific custodian of the GWAN and main customer of the resultant groundwater monitoring data.
In order to manage the groundwater monitoring program more efficiently, it is proposed to create a new section within the Water Resource Assessment Branch with staff having the appropriate skills to manage, interpret and quality control the hydrological data. The new section named ‘Monitoring and Regional Support’ would coordinate groundwater monitoring, and provide hydrogeological support to the regions through closer supervision of the regional hydrogeologists.
This section would be responsible for analysing and interpreting the monitoring data on a regular basis. It will also verify the monitoring data before it is loaded in to WIN and Hydstra, which is an important quality control process. The staff will also verify interpret the monitoring data and provide updates on the performance of the GWAN. The monitoring data will be reviewed by the Groundwater Review Section in the Water Resource Assessment Branch to assess aquifer performance and regional water levels trends.
It would also undertake ongoing reviews of the GWAN to assess its extent and condition, as well as make recommendations for where additional monitoring bores made be required. These reviews will ultimately establish a rational cost-effective groundwater monitoring program that is providing the data required for groundwater resource management. The optimised network will provide data for predicting potential future groundwater levels and in the calibration of regional groundwater models.
74 Department of Water
Sampling and analysis plans will need to be developed for each region. These plans provide a concise and complete operational procedure, its justification and quality objectives, identify the key project personnel and define their roles. As part of program coordination, there is a need to liaise with the Water Resource Assessment and Water Allocation Planning Branches, as well as the relevant regions to establish adequate sampling programs.
8.5 Program outcomes and risks
Information from the monitoring program will generate individual bore hydrographs, which are valuable to other groundwater users. The monitoring data will assist the Department in its obligation to manage groundwater in a sustainable manner under statutory allocation plans. The additional data will result in improved decisions on allocation limits, granting of individual licences, and allowance of groundwater trades. Benefits from improved data should result in reduced costs associated with appeals against licence decisions, since with better data those decisions will be defensible.
The main risks involved in groundwater monitoring are related to occupational health safety with working in the field including sun exposure, road-fatigue and working in remote areas. These risks can be adequately identified and managed. In contrast, the risk for not undertaking groundwater monitoring is considered more significant by hindering economic development of the State.
8.6 Stakeholder awareness
Responsibility of the planning and implementation of the groundwater monitoring program will rest with the Water Resource Assessment Branch. The program will be reviewed in February to March of each year including consultation with the main stakeholders to ensure the relevance of the program to Department and State need.
8.7.1 Internal stakeholders
The coordination of the groundwater monitoring program will require support and consultation. Program success will be dependent on building and fostering closer working relationships throughout the Department. The main internal stakeholders are Water Resource Assessment Branch, Water Allocation Branch, Water Information Branch, Groundwater Asset Section and regional offices in the Department of Water.
Water Resource Assessment Branch
The three existing groundwater sections within the Water Resource Assessment Branch are the scientific custodians of the GWAN and primary clients of the groundwater monitoring data. The Groundwater Assessment Section requires monitoring data for calibrating and reviewing groundwater models, assessing groundwater resources and determining sustainable yields of aquifers. The Groundwater Investigation Section, who manages the SGIP, is responsible for

Department of Water 75
installing new GWAN bores where there are knowledge gaps. The Groundwater Review Section undertakes ongoing reviews using the monitoring data to assess trends and determine aquifer performance.
Regions
It will be important to develop and maintain communication with each regional office. This will ensure that monitoring programs are being undertaken, and any problems with resources are promptly addressed. There will be a need for staff training related to the increased use of data loggers, their downloading and processing of the data.
Water Information Branch
There is an ongoing need for database support in data handling and storage. All discrete information will stored in the WIN database, while all time-series data will be stored in the Hydstra database. As such, it will be important to ensure that the Water Information Branch is regularly updated on the progress towards automated measurements and ensuring quality controls / protocols are appropriate.
Bore Maintenance Program
An increased involvement in setting the work program for the Bore Maintenance Program is needed, including the determining of priorities for replacement and maintenance of GWAN bores. Additional work has been identified to address the significant data gaps in the WIN database for existing GWAN bores, particularly in determining bore depths and screen intervals. It is a high priority that these bores are either depth tagged or viewed using a down-hole camera to confirm screen interval.
Water Allocation Planning Branch
As part of water allocation management planning, programs of groundwater monitoring are recommended. Any monitoring outlined in these plans must be discussed and endorsed by Water Resource Assessment Branch, prior to inclusion in the documents. This will ensure that the groundwater monitoring is appropriately funded and is adequate for the intended management objectives. In the future, there will also be need to liaise with environmental officers in the Water Allocation Planning Branch to fund GDE monitoring programs.
Measurement Program Board
The Measurement Program Board provides direction and ensures that funds are made available to both surface and groundwater measurement. This program board will decide on the level on groundwater monitoring into the future, as such it is important that it is regularly briefed on progress and deficiencies. Given the importance of groundwater resources, it is considered critical that there is groundwater representation on this board.
76 Department of Water
8.7.2 External stakeholders
There will be a need for communication with a number of external stakeholders including Bureau of Meteorology (BOM), Water Corporation, CSIRO, Department of Agriculture and Food, Department of Mines and Petroleum, Department of Planning and Infrastructure, and selected groundwater consultants.
Given its new role in water resource assessment for Australia, the most significant of these external stakeholders is the Bureau of Meteorology. Under the Commonwealth Water 2007, the Bureau of Meteorology is tasked with a range of functions which require it to collect, hold, manage, interpret and disseminate Australia’s water information. Section 126 of the Act provides for the making of Regulation to support these functions.
The Water Regulations 2008 specify that the Department of Water is required to provide new, ongoing and historical water information including groundwater monitoring data to the Bureau of Meteorology. Ongoing consultation and liaison with the Bureau of Meteorology will be crucial to ensure that the proposed groundwater monitoring program aligns with their data requirements, and for requesting funds to support automated water level measurement.

Department of Water 77
9 Conclusions
Groundwater resources are considered the primary water source for Western Australia. Climate change has resulted in an increasing dependency on groundwater resources. This requires a better understanding of groundwater resources across the State, which involves an improved groundwater monitoring program.
A groundwater monitoring program in Western Australia is required; because of the variable distribution and quality of the State’s water resources to expedite planning; to encourage industrial and agricultural development; and to allow effective and sustainable water resource management. Groundwater monitoring is a core function of the Department of Water. The value of the water level monitoring data is essential for meeting groundwater management objectives, calibration of groundwater models and the evaluation of the condition of the groundwater resources. Groundwater monitoring is the only way to observe and truly evaluate aquifer performance.
Groundwater monitoring underpins the sustainable management of groundwater resources across the State. The acquisition and interpretation of monitoring data provides the scientific understanding of groundwater resource sustainability and measure of the Department’s management approach. Consequently, the Department’s role in sustainable assessment can only be maintained if there is appropriate data collection.
Using results from the Management Area Prioritisation (MAP) process, the different regions were ranked and prioritised for their groundwater monitoring needs. The Swan Region is considered the highest priority in the State. This is followed by the South West, Mid West (Geraldton), Mid West (Carnarvon), Pilbara, Kimberley and then the South Coast region. The review includes regional descriptions detailing groundwater resource pressures, current monitoring and gaps for each region.
There has been a comprehensive review and assessment of more than 9000 bores owned by the Department of Water. The review has determined that the regional groundwater monitoring network (or GWAN – Groundwater Assessment Network) comprises 2457 bores in total with 1978 bores (includes 68 staff gauges) currently monitored with all data , 312 bores currently monitored with data gaps and 167 new bores for inclusion. A further 586 bores require further assessment to determine inclusion, while 194 bores could be removed due to overlap or position within water supply borefields. There are about 6200 project bores that were installed as short-term investigation bores that have not been included in the GWAN.
New technology related to automated groundwater level measurement has been fully evaluated for future groundwater monitoring. The more frequent data will increase knowledge of groundwater resources by supporting groundwater models, understanding aquifer performance and response, and confirming connectivity between aquifers and groundwater dependent ecosystems.

78 Department of Water
Since the mid-1990s, the decline in groundwater level monitoring is counter to the trend of increasing groundwater abstraction and reflects an inability to adequately monitor the impacts of groundwater abstraction which the Department licenses. The existing budget for groundwater monitoring in 2008/09 is less than $300,000, which is inadequate to meet current needs.
A groundwater monitoring program has been formalised over an eight year period from 2009/10 to 2016/17. The program addresses the short-term, immediate concerns for the existing manual measurement program by confirming staff numbers, operational expenses and monitoring frequency. A longer-term direction has been proposed with the implementation of an automated water level measurement program to meet the future needs of the Department and State in groundwater resource assessment.
The first two years of the program will ensure regional measurement staff have adequate funding to undertake manual measurement at the desired monitoring frequency. There will be progressive installation of data loggers into the GWAN over the next six years, which provide the more frequent data required by the Department for the future. It is proposed that data loggers are initially installed in the Perth metropolitan area and South West region before moving to other parts of the State.
The improvement of the groundwater monitoring program will have unquantifiable benefits by improving knowledge of groundwater resource, providing confidence in monitoring data, and offering better monitoring data to stakeholders. In addition, automated groundwater level measurement is in line with the Bureau of Meteorology’s approach to more comprehensive groundwater resource assessments. The proposed groundwater monitoring program provides a thorough review of the existing network and outlines a long-term vision to address future data requirements of the Department as it moves towards adaptive management.

Department of Water 79
10 Recommendations
Recommendations for the improvement of the current groundwater monitoring network and program are as follows:
• Fully consider the proposed groundwater monitoring program, as the future direction for groundwater monitoring in the State.
• Ensure appropriate funding for the manual groundwater monitoring program.
• Investigate funding options for the implementation and operation of an automated water level measurement program.
• Create a ‘Monitoring and Regional Support’ section in the Water Resource Assessment Branch for improved program coordination and technical support to regions.
• Undertake further work into determine monitoring requirements for water quality and groundwater dependent ecosystems (GDEs)
• Develop work programs to address data gaps in the GWAN, particularly bore depth and screen intervals.
80 Department of Water
11 References
Allen, A.D., 1997, Groundwater: The strategic resource – a geological perspective of groundwater occurrence and importance in Western Australia; Western Australia Geological Survey, Report 50, 61 p.
Aquaterra, 2004, Review of groundwater monitoring on the Gnangara and Jandakot Mounds, prepared for Water and Rivers Commission (unpublished).
Auditor General of Western Australia, 2003, Second Public Sector Performance Report 2003, Government of Western Australia, Report No. 7, Perth, September 2003.
Department of Water 2008a, South West groundwater areas monitoring program, Water resource allocation planning series no. 32, Department of Water.
Department of Water 2008b, South West groundwater areas water management plan – allocation, draft for public comment, Water resource allocation planning series no. 21, Department of Water.
GHD, 2008, Report for the Perth superficial aquifer monitoring project – Final report, prepared for Swan Catchment Council.
Golder Associates, 2008, Groundwater level trends analysis for the South West groundwater areas – Volume 1 report text, prepared for Department of Water.
Johnson, S.L., Commander, D.P., O’Boy, C.A., and Lindsay, R.P., 2005, Groundwater investigation program in Western Australia (2005-2020), Department of Environment, Hydrogeological Record Series, Report HG10.
Kierath, P., and Hopkin, D., 1988, Review of groundwater monitoring metropolitan regions, Water Resources Directorate, Groundwater Branch, Water Authority of Western Australia, Report No WG71.
Lindsay, R.P., 2004, Water level monitoring results from the superficial aquifer in Perth urban area, Department of Environment, Hydrogeology report 225.
Maitland, A.G., 1913, The artesian water resources of Western Australia, in Report of the Interstate Conference on Artesian Water, Sydney, 1912 compiled by J.E. Slade: New South Wales, Government printer, Appendix, p. 115-129.
Marsden Jacob Associates, 2006, Identification of economic values associated with groundwater of the Gnangara Mound, Published consultants report to the Department of Water.
Resource Economics Unit, 2009, Water future for Western Australia: A water demand scenario modelling tool, a report prepared for Department of Water

Department of Water 81
Ryan, S., Hales, N. and Lemnell, K., in prep, Management Area Prioritisation, Department of Water, Hydrogeology report (unpublished).
Smith, A., Pollock, D. and McFarlane, D., 2005, Opportunity for additional self supply of groundwater from the superficial aquifer beneath metropolitan Perth, Client Report, CSIRO: Water for a healthy Country National research Flagship Canberra.
Water and Rivers Commission, 2000, Western Australia Water Assessment 2000 – Water availability and Use, Water and Rivers Commission Policy and Planning Division.