improved precision and accuracy in extended natural gas ... · improved precision and accuracy in...
TRANSCRIPT

Improved Precision and
Accuracy in Extended Natural
Gas Analysis
Richard R. Whitney, Ronald D. Snelling,
Clifford M. Taylor, Shimadzu Scientific
Instruments, Columbia, MD, USA

2
Refinery gas analysis is performed to characterize the components created from a process gas stream. The composition of this gas is often complex, requiring a chromatography system capable of high resolution and excellent reproducibility. Precision, in terms of retention times of closely eluting peaks as well as quantitative values, is essential when performing this application to avoid errors in analysis results.
A new system has been developed with improved retention time and quantitative precision, allowing more precise and accurate results to be performed. In this study we will evaluate the retention time repeatability and quantitative results. Reports will be evaluated in terms of mol% and BTU content.
Introduction
3
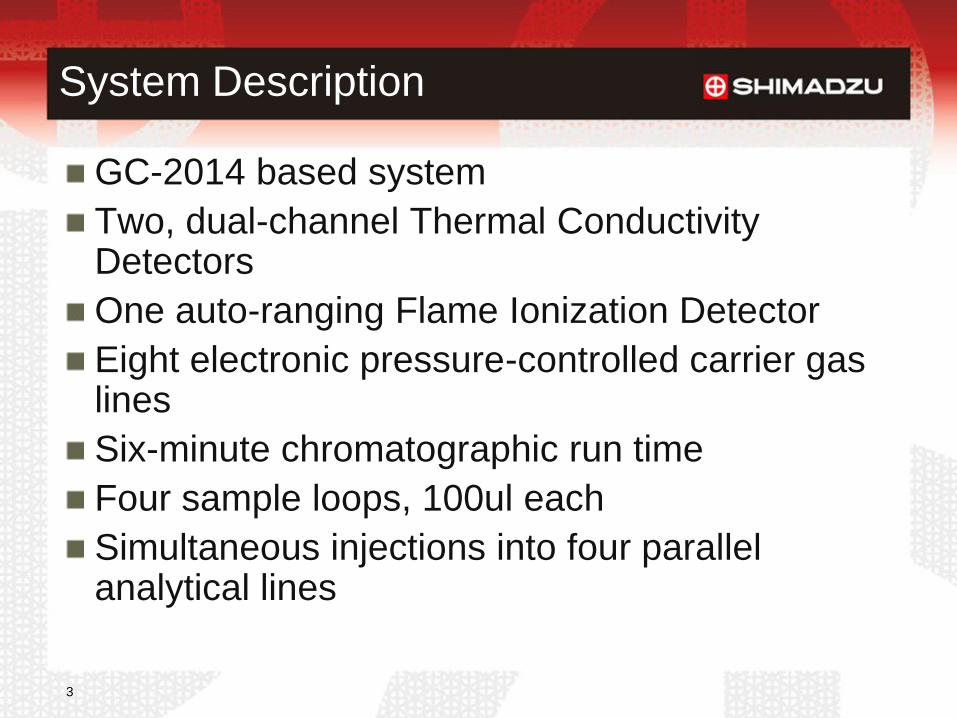
System Description
GC-2014 based system
Two, dual-channel Thermal Conductivity Detectors
One auto-ranging Flame Ionization Detector
Eight electronic pressure-controlled carrier gas lines
Six-minute chromatographic run time
Four sample loops, 100ul each
Simultaneous injections into four parallel analytical lines

4
System Description
One 6-port 1/16 inch micro-electric actuated valve
Four capillary PLOT columns and two micro-packed columns
Three 10 port 1/16 inch micro-electric actuated valves
Four valve heated enclosure

5
System Description
Columns:
Alumina Plot 30m X 0.53 X 6um (Restek)
Q-Plot 30M X 0.53 X 20um (Restek)
2X Mol Sieve 5A Plot 30m X 0.53 X 50um
(Restek)
Q-Plot 10M X 0.53 X 20um (Restek)
10% OV-1 Chromosorb W 80/100 mesh
1/8th inch X 3 feet
2x Hayesep N 80/100 mesh 1/8th in. X 3 feet

6
Plumbing Diagram: TCD 1
10 port
valve #1Loop sampling
and precolumn
backflush to vent
10 Port
valve #2Loop sampling
and precolumn
backflush to vent

7
10-port valve: Dual sample loop with simultaneous injection; one loop to the FID and one loop to TCD 2
6-port valve: Backflush of precolumn to FID for C6+ determination
Plumbing Diagram: FID
8
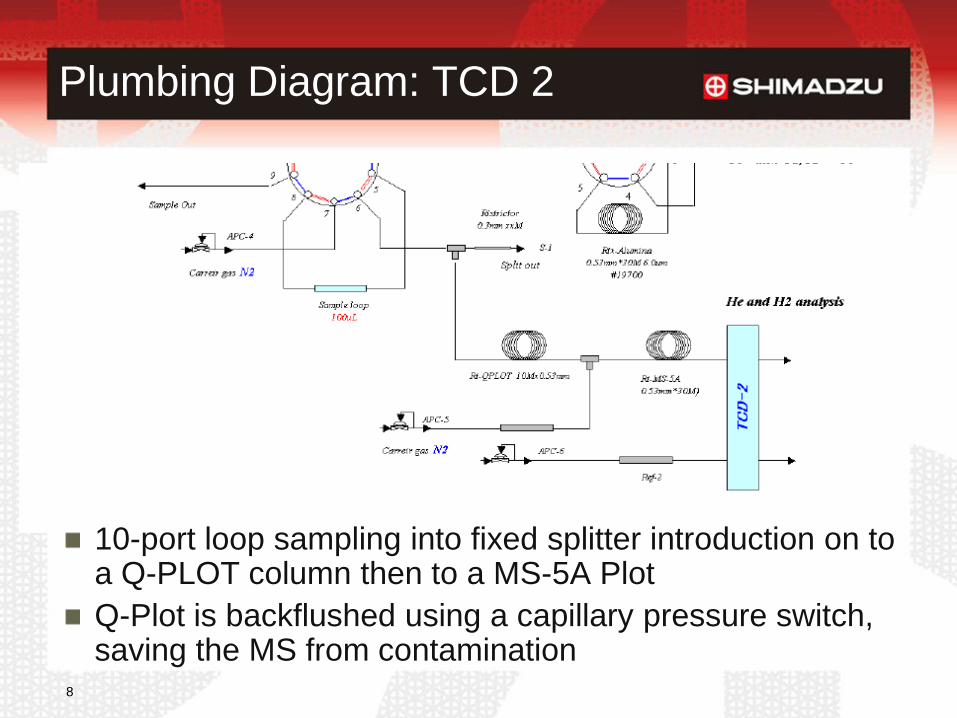
Plumbing Diagram: TCD 2
10-port loop sampling into fixed splitter introduction on to a Q-PLOT column then to a MS-5A Plot
Q-Plot is backflushed using a capillary pressure switch, saving the MS from contamination

9
Compound List
Name of Compound Concentration Range Detector
Low Conc. High Conc.
1 Hydrogen (H2) 0.01 % 80 % TCD-2
2 Oxygen 0.01 % 50 % TCD-1
3 Nitrogen (N2) 0.01 % 50 % TCD-1
4 Methane (CH4) 0.01 % 80 % TCD-1
5 Carbon Monoxide (CO) 0.01 % 10 % TCD-1
6 Carbon Dioxide (CO2) 0.01 % 30 % TCD-1
7 Ethylene (C2H4) 0.01 % 10 % TCD-1
8 Ethane (C2H6) 0.01 % 10 % TCD-1
9 Acetylene (C2H2) 0.01 % 10 % TCD-1
10 Hydrogen Sulfide (H2S) 0.3 % 30 % TCD-1
11 Propane (C3H8) 0.01 % 5 % FID
13 Propylene (C3H6) 0.01 % 5 % FID

10
Compound List cont..
Name of Compound Concentration Range Detector
Low Conc. High Conc.
14 Iso-butane (i-C4H10) 0.01 % 1 % FID
15 n-Butane (n-C4H10) 0.01 % 1 % FID
16 Propyldiene (C3H4) 0.01 % 1 % FID
17 Acetylene (C2H2) 0.01 % 1 % FID
18 trans-2-Butene (trans-
C4H8)
0.01 % 0.5 % FID
19 1-Butene (1-C4H8) 0.01 % 0.5 % FID
20 Iso-Butylene (i-C4H8) 0.01 % 0.5 % FID (Iso-Butene)
21 cis-2-Butene (cis-C4H8) 0.01 % 0.5 % FID
22 Iso-pentane (i-C5H12) 0.01 % 0.5 % FID
23 n-Pentane (n-C5H12) 0.01 % 0.5 % FID
24 1,3-Butadiene (1,3-
C4H6)
0.01 % 0.5 % FID
25 Propyne (C3H4) 0.01 % 0.5 % FID(Methylacethylene)
26 C6 plus 0.01 % 0.5 % FID

11
FID Chromatogram
0. 5 1. 0 1. 5 2. 0 2. 5 3. 0 3. 5 4. 0 4. 5 5. 0 5. 5 6. 0 6. 5 mi n-0. 50
-0. 25
0. 00
0. 25
0. 50
0. 75
1. 00
1. 25
1. 50
1. 75
2. 00
2. 25
2. 50
2. 75
3. 00
3. 25
3. 50
3. 75
4. 00
4. 25
4. 50
4. 75
5. 00uV(x10, 000)
C6+
C3H
8
C3H
6
i-C4H
10
n-C
4H10
C2H
2
t-2-C
4H8
1-C
4H8
iso-C
4H8
c-C
4H8
i-C5H
12
n-C
5H12
1,3-
C4H
6
C3H
4
C6+
C3H8
C3H6
i-C4H10
n-C4H10
C2H2
t-2-C4H8
n-C4H8
i-C4H8
cis-C4H8
i-C5H12
n-C5H12
1,3-C4H6
C3H4
12
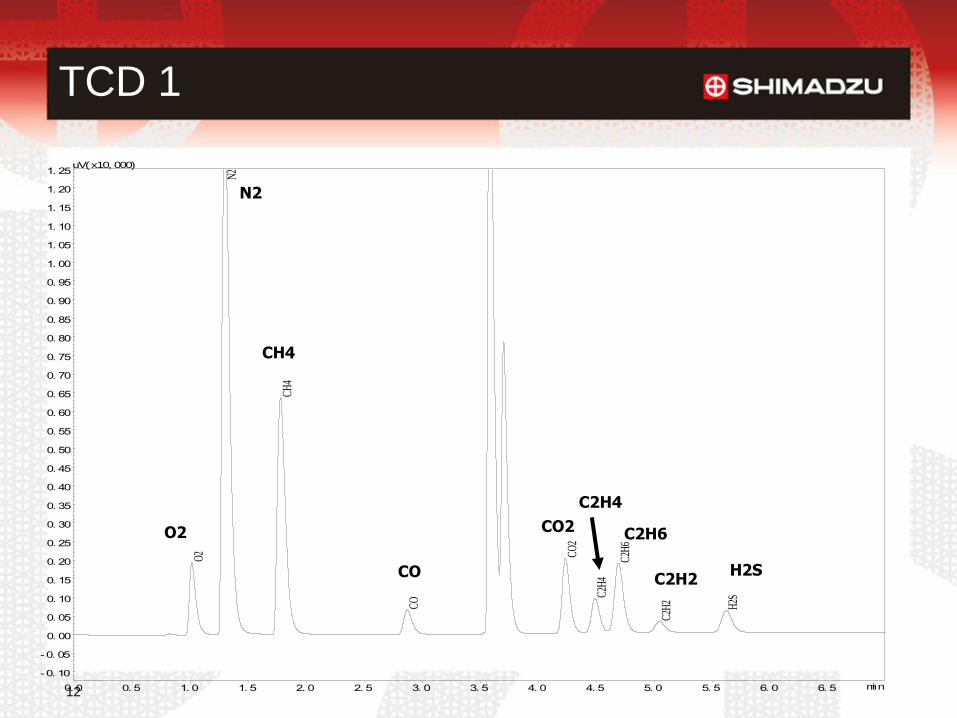
TCD 1
0. 0 0. 5 1. 0 1. 5 2. 0 2. 5 3. 0 3. 5 4. 0 4. 5 5. 0 5. 5 6. 0 6. 5 mi n
-0. 10
-0. 05
0. 00
0. 05
0. 10
0. 15
0. 20
0. 25
0. 30
0. 35
0. 40
0. 45
0. 50
0. 55
0. 60
0. 65
0. 70
0. 75
0. 80
0. 85
0. 90
0. 95
1. 00
1. 05
1. 10
1. 15
1. 20
1. 25uV(x10, 000)
O2
N2
CH
4
CO
CO
2
C2H
4
C2H
6
C2H
2 H2S
O2
N2
CH4
CO
CO2
C2H4
C2H6
C2H2H2S

13
TCD 2
0. 5 1. 0 1. 5 2. 0 2. 5 3. 0 3. 5 4. 0 4. 5 5. 0 5. 5 6. 0 6. 5 mi n-1. 0
-0. 5
0. 0
0. 5
1. 0
1. 5
2. 0
2. 5
3. 0
3. 5
4. 0
4. 5
5. 0
5. 5
6. 0
6. 5
7. 0
7. 5
8. 0
8. 5
9. 0
9. 5
10. 0uV(x10, 000)
H2
Hydrogen

14
Retention Time Repeatability: FID
Name Mean Stdev %RSD
HEXANE+ 1.126 0.000 0.031
Methane 2.458 0.001 0.043
Ethylene 2.659 0.001 0.045
Ethane 2.925 0.002 0.055
Propane 3.405 0.001 0.044
Propylene 4.424 0.003 0.068
I-Butane 4.867 0.002 0.042
N-Butane 5.051 0.002 0.047
ISOButylene 5.982 0.003 0.051
Trans-2-Butene 6.195 0.004 0.057
Cis-2-Butene 6.285 0.003 0.053
I-Pentane 6.606 0.003 0.040
N-Pentane 6.788 0.003 0.042
n=8 reps
Name Mean Stdev %RSD
Hydrogen 0.581 0.001 0.089
Argon 1.119 0.001 0.067
Nitrogen 1.470 0.001 0.051
Methane 1.945 0.001 0.073
Carbon
Monoxide
2.939 0.001 0.050
Carbon Dioxide 4.931 0.003 0.060
Acetylene 5.686 0.004 0.074
Hydrogen
Sulfide
6.291 0.005 0.072

15
Precision: Mol % Data
Name Mean Stdev %RSD
Hexanes+ 0.257 0.015 6.009
Methane 19.460 0.260 1.338
Ethylene 11.952 0.161 1.347
Ethane 13.520 0.183 1.357
Propane 9.767 0.130 1.327
Propylene 7.948 0.107 1.343
I-Butane 2.026 0.027 1.351
N-Butane 0.999 0.014 1.383
ISOButylene 0.499 0.007 1.325
Trans-2-Butene 0.504 0.006 1.262
Cis-2-Butene 0.498 0.007 1.427
I-Pentane 0.511 0.007 1.408
N-Pentane 0.513 0.008 1.512
Name Mean Stdev %RSD
Hydrogen 23.262 0.088 0.380
Argon 0.954 0.010 1.100
Nitrogen 1.297 0.018 1.380
Carbon
Monoxide
0.859 0.005 0.639
Carbon Dioxide 0.889 0.003 0.353
Acetylene 0.584 0.015 2.578
Hydrogen
Sulfide
0.967 0.021 2.200
n=7 reps

16
Accuracy: Mol % Data vs Theoretical
Name Avg Std %D
Hexanes+ 0.257 .265 -3.11%
Methane 19.460 19.912 -2.32%
Ethylene 11.952 12.230 -2.33%
Ethane 13.520 13.848 -2.43%
Propane 9.767 9.988 -2.26%
Propylene 7.948 8.134 -2.34%
I-Butane 2.026 2.072 -2.27%
N-Butane 0.999 1.022 -2.30%
ISOButylene 0.499 .510 -2.20%
Trans-2-Butene 0.504 .517 -2.58%
Cis-2-Butene 0.498 .506 -1.61%
I-Pentane 0.511 .522 -2.15%
N-Pentane 0.513 .523 -1.95%
Name Avg Std %D
Hydrogen 23.262 24.091 -3.56%
Argon 0.954 1.006 -5.45%
Nitrogen 1.297 1.37 -5.63%
Carbon
Monoxide
0.859 .894 -4.07%
Carbon Dioxide 0.889 .946 -6.41%
Acetylene 0.584 .637 -9.08%
Hydrogen
Sulfide
0.967 1.007 -4.14%
n=7 reps

17
Report Output from GCsolution Software
User-definable
formatting
Report as mole
% or area %
18
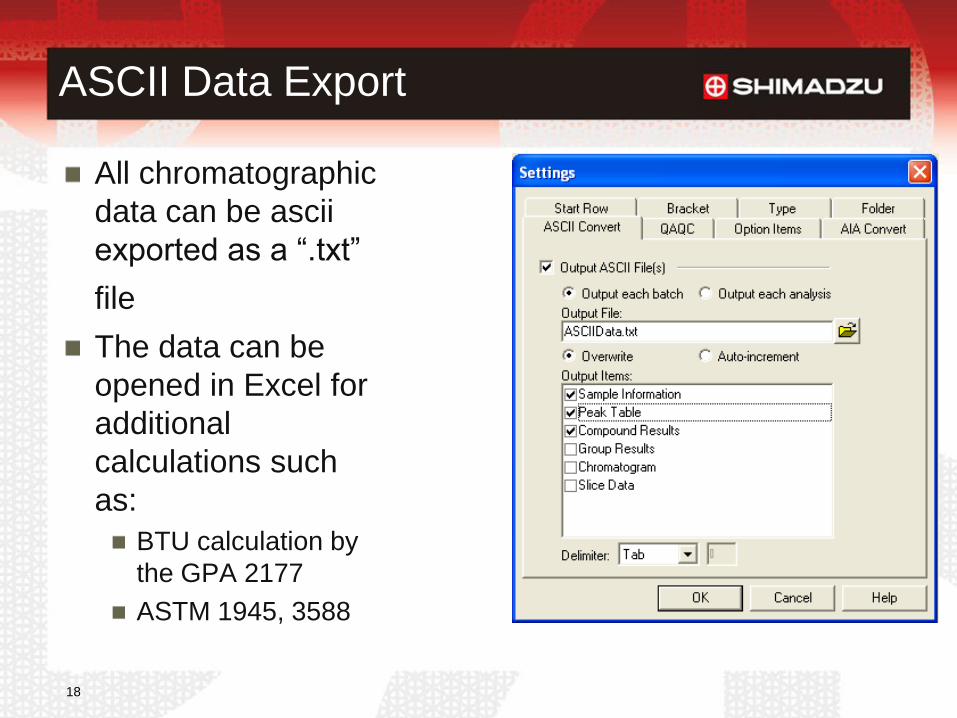
ASCII Data Export
All chromatographic
data can be ascii
exported as a “.txt”
file
The data can be
opened in Excel for
additional
calculations such
as:
BTU calculation by
the GPA 2177
ASTM 1945, 3588

19
Ascii Data Export Channel 1 (FID)
[Peak Table (Ch1)]
# of Peaks 13
Peak# R.Time I.Time F.Time Area Height A/H
Conc.
Mol % Mark Name
1 1.126 1.041 1.246 6872 3420 2.01 0.26327 V 1 HEXANE+
2 2.457 2.376 2.59 532123 165172 3.22 18.99915 2 Methane
3 2.658 2.59 2.847 751879 253790 2.96 11.67084 V 3 Ethylene
4 2.924 2.847 3.267 632045 206879 3.06 13.20773 SV 4 Ethane
5 3.404 3.267 3.822 800242 277011 2.89 9.54715 SV 5 Propane
6 4.422 4.35 4.802 621004 205597 3.02 7.77307 S 6 Propylene
7 4.866 4.802 4.984 212721 75736 2.81 1.98118 V 7 I-Butane
8 5.049 4.984 5.241 133177 46654 2.85 0.97812 V 8 N-Butane
9 5.98 5.908 6.128 51462 19027 2.7 0.48748 9 ISOButylene
10 6.193 6.128 6.244 48652 18061 2.69 0.49355 V 10 Trans-2-Butene
11 6.283 6.244 6.422 50613 18021 2.81 0.48414 V 11 Cis-2-Butene
12 6.604 6.534 6.716 65825 23530 2.8 0.49987 V 12 I-Pentane
13 6.786 6.72 6.907 60522 21344 2.84 0.50017 13 N-Pentane
20
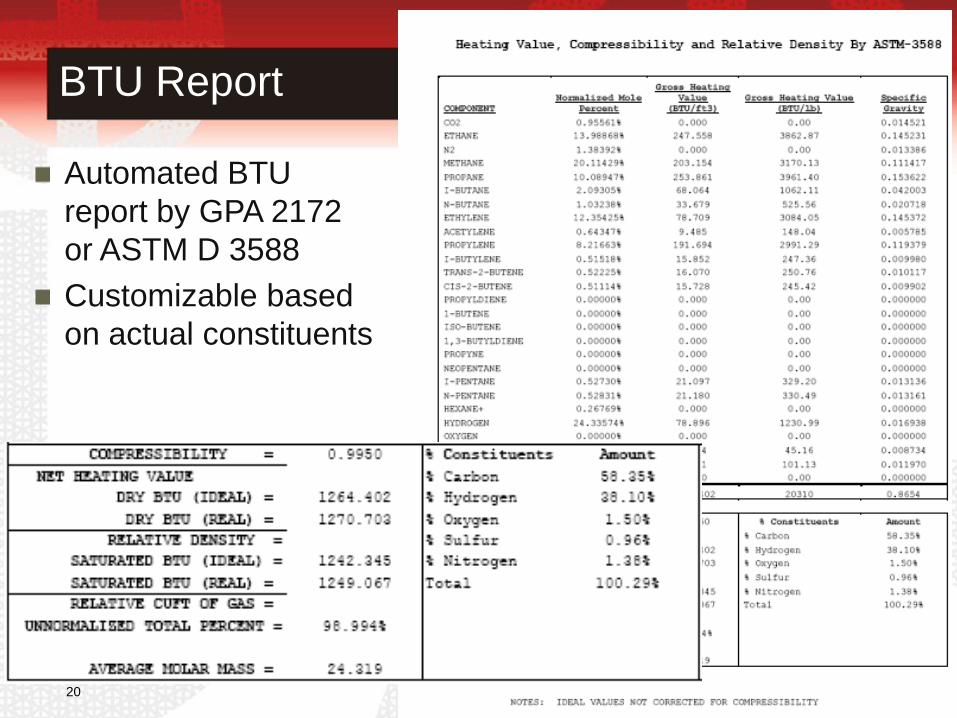
BTU Report
Automated BTU
report by GPA 2172
or ASTM D 3588
Customizable based
on actual constituents

21
Conclusion
A new system was developed with a 6-
minute analysis time
Exhibits a high level of precision and
accuracy for retention times and mol %
results
Versatile, automated reporting formats