improved protocol for classification and...
TRANSCRIPT

IMPROVED PROTOCOL FOR CLASSIFICATION AND ANALYSIS OF STORMWATER-BORNE SOLIDS
Larry A. Roesner,* Elizabeth M. Kidner**
*Colorado State University Campus Delivery 1372
Fort Collins, Colorado 80523-1372
**Golder Associates, Calgary, Ontario
ABSTRACT A large portion of water quality impaired waterways are located in or near urban areas and are adversely influenced by stormwater-borne solids. The solids have negative impacts on receiving water systems including loss of aquatic habitat, channel instability, and the transport of harmful pollutants potentially hazardous to human and ecosystem health. The current methods for sampling, handling, and analyzing stormwater solids do not lead to a good understanding of these effects on receiving waters. The purpose of this paper is to propose a consistent classification of stormwater solids and to recommend modifications to the analytical methods for determining stormwater-borne solids in order to improve assessment and monitoring protocols. Common definitions and standardized monitoring procedures are recommended to aid in understanding solid impacts and selection of stormwater best management practices. Stormwater solids should first be classified based on size into dissolved, fine, coarse and gross solids. These solids can further be classified as settleable or suspended by allowing a settling time in the analytical procedure for Total Suspended Solids. Obtaining a representative sample in the field is one of the biggest challenges in characterizing stormwater-borne solids because of temporal, geographic, and spatial variations. KEYWORDS Total suspended solids, suspended solids concentration, stormwater, water quality, stormwater solids. INTRODUCTION The more that is learned about the processes that affect the aquatic environment, the more detail that will be required to describe the water quality parameters that affect it. This is especially true for stormwater-borne solids. Stormwater-borne solids are a major contributor to surface water quality degradation in waterways. A large portion of water quality impaired surface waters is located in or near urbanized areas and stormwater is a major source of the contamination. In particular, the U.S. Environmental Protection Agency (2000) has identified sediment as the most
widespread pollutant in U.S. rivers and streams, affecting aquatic habitat, drinking water treatment processes, and recreational uses of rivers, lakes, and estuaries. Stormwater-borne solids have detrimental impacts on receiving waters. Typical symptoms of impacted urban streams include degradation in geomorphology, water quality, ecology, and biodiversity. Stormwater solids have been shown to change the bed material, increase suspended sediment loads, result in a loss of riparian habitat due to erosion and sedimentation, and change the variability of flow and sediment transport characteristics relative to aquatic life cycles (Roesner and Bledsoe, 2003). It is common to have increases in erosion and incision (Wolman, 1967; Roberts, 1989; Booth, 1991). An increase in contaminated load and concentrations of harmful constituents is also an observed result of increased solids in the runoff (Osborne and Wiley, 1988; Corbett et al. 1997; Hatt et al. 2004). There is likely to be an overall decrease in biodiversity, including genetic, species, and community levels (Richter et al. 1997; Chessman and Williams, 1999; Walsh et al. 2004). Plastic particles, soda rings and Styrofoam particles have been found in the stomachs of seabirds and other marine life (U.S. EPA, 1992; Blight and Burger, 1997). The establishment of consistent solids definitions, sampling, and measuring techniques for accurately characterizing stormwater solids and associated pollutants is currently a critical need for effective stormwater management. This paper reviews common problems in defining stormwater-borne solids and in current laboratory protocols used for solids characterization. A synthesis of the literature review provides a background for recommending a consistent method for defining stormwater solids in a format that meets the needs for effective stormwater management. OVERVIEW OF STORMWATER SOLIDS Stormwater solids include suspended sediment, dissolved solids, settleable and non-settleable solids, litter, debris, floatables, and coarse solids. These solids can have various negative impacts on the receiving waters and can pose a physical problem affecting geomorphology and ecologic habitats in addition to potentially transporting harmful chemicals from the urban environment into the natural ecosystems. Though the adverse impacts are generally recognized, there is still neither a common definition of solids nor a standardized procedure for their sampling and monitoring. This poses a significant impediment to the appropriate management and treatment of stormwater solids. Total Suspended Solids (TSS) is the hallmark water quality parameter for quantifying the concentration of solids in stormwater, and it is written into the stormwater discharge permits of numerous municipalities without much regard to the actual impacts of TSS on the receiving waters. The inclusion of TSS in stormwater permits is an extension of its use in municipal and industrial wastewater treatment, where it is used to aid in the design of sedimentation tanks for the removal of suspended solids. But its use in stormwater management has been extrapolated to serve as an indicator of many receiving water responses to stormwater discharge including scour and deposition potential, visibility impairment, benthic filter feeder clogging, and organic solids sedimentation rates. However, the analytical protocol is not well suited to give a valid estimation of the real effect that suspended solids have on the processes of interest.

Increasingly the use of TSS as an indicator of stormwater pollution has resulted in erroneous BMP solids removal estimates, inappropriate TMDLs and other water quality regulations that do not really solve the problem from an environmental standpoint. In order to make progress with this issue, it is necessary to have a better more detailed characterization of the solids historically called TSS. However, it is important that the methods of sampling and the analytical protocols be consistent, reproducible, pragmatic, and of reasonable cost so that municipalities and other water quality agencies can understand them and afford to carry out the collection and analysis. Standard Methods defines TSS as the portion of total solids (TS) retained by a 1-2 micron filter (APHA, 1998). TS is defined as the sum of TSS and Total Dissolved Solids (TDS) where TDS is determined as the filtrate residue left in a vessel after evaporation of a sample and subsequent drying in an oven at a defined temperature (SM 2540 B (TS) SM 2540 C (TDS), SM 2540 D (TSS)). So, strictly speaking, TSS includes litter, trash, gross solids in both organic and inorganic forms in addition to floating and sinking particles, sand and cohesive soil solids, and organic solids. In an effort to circumvent the problems with using TSS to describe all these types of particulate matter in stormwater, investigators have developed/proposed new descriptors and tests to better compartmentalize these solids. Some examples follow. Urban Litter is defined by Armitage and Rooseboom (2000a, 2000b) as visible solid waste emanating from the urban environment with an average dimension greater than about 10 mm and typically comprising: plastics, paper, metals, glass, vegetation, animals, construction material, miscellaneous articles such as clothing, pens and pencils, cigarette butts, old tires, etc. Lloyd and others (2001) define urban litter as manufactured items that can be retained by 6.35-mm mesh, while Kayhanian and others (2005) propose a more simple classification:
• Non-Biodegradable litter: litter waste that does not naturally degrade in the environment, such as metals and plastics.
• Biodegradable: litter waste that naturally degrades in the environment, such as paper. Gross pollutants are related to urban litter but have no standard definition either. Allison and others (1998) define gross pollutants as litter and debris greater than 5 mm in size. Rushton and England (2006 Draft Report) define gross pollutants as litter, debris and sediments larger than 4.75 mm that travel in suspension or bedload, and are subdivided into three types: 1) litter and, in general, human derived trash; 2) debris composed of organic material; and 3) coarse sediments composed of organic products from soil, pavement or building material. Dallmer’s (2002) definition is material larger than 2 mm in size, while Shaheen (1975) and Mudgway et al. (1997) define it as material larger than 2 or 3 mm in size. In Europe, where a primary contributor to gross solids is from combined sewer overflows, gross solids are defined as solids with a specific gravity close to 1.0 and can be captured by a 6 mm screen (Butler et al. 2002; Jefferies and Ashley, 1994). There is currently no standardized size range that constitutes gross solids. The California Department of Transportation defines gross solids as particles that are larger than 5 mm; Kayhanian and others (2005) defined litter as particles greater than 6.35 mm. A study by

AMAFCA/Albuquerque MS4 on floatable and gross pollutants in 2005 defined gross solids as particles greater than 1-3/4 in (45 mm) (Dodge, 2005). There are other problems associated with the measurement of gross solids. James (1999) notes four problems: 1) sampling protocols for such measurements require collection of large volumes of stormwater, 2) techniques for the continuous or on-line measurement of the wide range of particle sizes have not been used in stormwater monitoring, 3) commonly used peristaltic automatic sampling equipment is not capable of collecting representative samples of gross or total solids in stormwater runoff and 4) sampling points are placed above the bed to prevent clogging of automatic sampling equipment therefore excluding bedload from the sample. Floating material is also excluded in sampling because of the placement of sampling equipment. In addition to inconsistent classification schemes and definitions used in research and characterization studies, there are inconsistent regulatory definitions of these types of pollutants as well. Total Suspended Solids was originally defined for wastewater transport and urban runoff based on a filtration procedure according to Standard Methods (Standard Methods 2540). The suspended solids are the main vector of wet-weather pollution in combined sewers. For example, in an experimental urban catchment with combined sewers ‘Le Marais’, Chebbo and others (2005) found 60-95% of organic matter, 65-99% of zinc and hydrocarbons, 90-100% of cadmium, copper and lead for the same storm are linked to suspended solids, as defined by the standard tests. In urban runoff, solids are also often found to be a carrier of other pollutants such as nutrients, toxins, heavy metals and other organic and inorganic materials (Chebbo and Bachoc, 1992; Muthukaruppan et al. 2002). But currently, most water quality monitoring studies are concerned only with pollutant loads, and not with their association with the solids fraction. However, Muthukaruppan and others (2002) and many other researchers report that the particle size distribution of the solids and the pollutant load distribution across different particles sizes are critical in determining the pollutant transport capacity of these solids and the treatability of the runoff. Sansalone and Burcherger (1997) reported that the mass of solids, heavy metals and nutrients such as total phosphorous are associated with particles greater than 150 µm, which represents a diameter size that is not well measured with the current TSS analysis because these larger (heavier) particles tend to settle to the bottom of the sample. It has been reported that total surface area per unit of mass increases with decreasing particle size (Sansalone and Tribouillard, 1999; Sansalone et al. 1998) therefore the finer the particles, the larger the surface area per unit mass for sorbing chemicals, thus the higher the associated pollutant load (Ashley et al. 2004). Because of this high specific surface area, fine material has the potential to transport the majority of chemicals such as nutrients, metals, and harmful organic compounds. For example, a study by Ellis and Revitt (1982) found that 70% of the metallic pollution is attached to particles finer than 100 μm which represent less than 15% of the total solids mass accumulated on streets. Methods for determining the amount of suspended solid-phase material in the water include Total Suspended Solids (TSS) and Suspended Sediment Concentration (SSC). It is important to

note that even though SSC and TSS values are often used interchangeably, the analytical methods are very different and therefore the two terms should not be substituted for one another (Gray et al. 2000). Settleable solids are defined as the quantity of solids that will settle out of suspension in a water-solid mixture within a defined amount of time and can be determined by volumetric and gravimetric measurements. The ability for solids to settle out of suspension is a function of the particle density, shape, and size. In the United States, settleable solids are seldom reported in stormwater studies but have a huge impact on water quality, geomorphology, ecologic habitats, and treatability. Size and mass density are the main sediment characteristics that determine the movement of solids, whether as suspended, washload or bedload. If the sample contains a substantial amount of sand size particles stirring or mixing the sample using a magnetic stirrer will rarely produce a subsample that is representative of SSC because of the rapid settling characteristics of sand-size particles compared to those of silt and clay (Gray et al. 2000). Hijioka and others (2000) identified two fractions as separated by a size of 45 µm. This limit represents the difference in the dependence of the pollutant loads and the intensity of storm. This value also corresponds to the limit between sand and silt (62 µm), which represents the critical size to differentiate the results for Suspended Sediment Concentration (SSC) and TSS (Gray et al. 2000). Some researchers have advocated a sedimentation time before the TSS test, such as a study by Stahre and Urbonas (1990) which allowed a five minute sedimentation period to allow for the separation of coarse or heavy solids from the lighter solids before performing the TSS analysis. Suspended Solids vs. Settleable Solids in Suspension - The TSS analytical protocol does not distinguish between settleable and non-settleable solids, or between the “settleability potential” (i.e. density, size, and organic content/flocculation potential) of the solids that pass through the 1-2 micron filter. Yet, this distinction is extremely important in assessing the ecologic impact of stormwater discharges to streams and the potential of treating the runoff before discharge. The fundamental difference between the SSC and TSS analytical methods lies in the preparation of the sample for subsequent filtering, drying, and weighing. The method for determining SSC requires the filtration and analysis of the entire sample, while the method for TSS requires the withdrawal of an aliquot for filtration and analysis. Since heavier solids in a sample can settle before an aliquot is withdrawn, it has been suggested by some (see James, 1999; Gray et al. 2000) that the method for determining TSS may be fundamentally flawed for the analysis of natural water samples, such as stormwater discharges, particularly when sand-size material comprises a substantial percentage of the sediment in the sample. In contrast, the method for determining SSC (Gray, 2002) produces relatively reliable results for samples of natural water, regardless of the amount or percentage of sand-size material in the samples. Additionally, the percentage of sand-size and finer material can be determined as part of the SSC method, but not as part of the TSS method. Gray demonstrates that at similar flow rates, sediment discharge values from SSC data can be more than an order of magnitude larger than those from TSS data (Gray et al, 2000) due primarily to heavier particles that are often missed in the TSS method. The USGS has provided significant evidence to support the conclusion that the SSC test provides a more accurate estimate of the solids concentration in the water for geomorphic studies; but the new test does not necessarily indicate ecologic impacts.

Settleable Solids - The settleable portion of TSS, which is not reported in most stormwater studies, can settle to the bottom of water bodies and damage invertebrate populations, cause imbalances in stream biota, reduce spawning gravels, remove dissolved oxygen from the water, reduce the pH, reduce conveyance capacities and increase dredging frequencies and costs for treating the solids. Settleable trash and debris in stormwater runoff are more than an aesthetic problem despite being one of the main public concerns in regard to waterway health.
There is significant interest in the suspended versus settleable components of solids, as the definition greatly affects the expected impact on habitat and potential options for treatment. Suspended solids include organic matter and inorganic matter. Sediments typically make up the majority (by weight) of suspended solids in stormwater and may originate from soil erosion, including inorganic solids from weathering of rocks, or from locations where organic content has been reduced by decomposition. Organic solids tend to be less dense than inorganic solids because inorganic minerals are typically denser than organic carbon. In addition, fresh organic matter has high water content, causing its gross density very close to that of water (Chapra and Pelletier, 2004) and thus having a tendency to settle more slowly. Suspended solids are typically made up of fine material and solids with a high organic content.
A summary of the sizes commonly used to define TDS, TSS and Gross Solids is shown in Table 1. The ranges used to define the various solids classification reinforce the need to develop a consistent definition. Table 1. Summary of Size Limitations for Defining Stormwater Solids. Size Classification Total dissolved Solids Total Suspended Solids Gross Solidslower limit NA 0.45-2 μm 75 μm - 20 mmupper limit 0.45-2 μm 75 μm - 20 mm NA A clear method for consistent solids definitions, sampling, and measuring solids is deemed necessary for appropriate stormwater management. A WORD ABOUT SAMPLE COLLECTION Perhaps the largest problem with respect to sampling suspended solids in urban runoff may be obtaining a representative sample. Suspended solids vary with size, weight, time, and location. They also vary vertically with depth as well as horizontally. Larger particles, including gross solids (floating and suspended) and bed material, are often neglected in stormwater solids sampling because the equipment used cannot capture them. However, if the gross solids are not sampled, but remain in the capture facility, the organic fraction may decompose into smaller sizes and be monitored in the facility effluent perhaps introducing bias into the sampling results (Lenhart, 2006). Bed and gross pollutant loads may be twice the suspended solids load by mass and have significantly more volume because of their particle size (Hannah, 2005). Although bed and gross solids typically have a lower toxicity associated with them, they are important because they may cause premature failures of treatment devices that do not have a large enough storage capacity and may negatively impact stream habitats. Gross solids can also transport harmful chemical into receiving waterways impacting water quality.

SUMMARY OF LITERATURE REVIEW FINDINGS
Stormwater greatly impacts the environment by altering the natural geomorphology, changing aquatic habitats, and carrying chemicals into waterways. In order to minimize these impacts, it is important to have consistent definitions of solids such as suspended, settleable, and gross solids. Dependable sampling and analysis protocols are also needed in order to assist in stormwater management. The following summarizes the most immediate concerns with respect to stormwater solids.
• There is currently not a single internationally recognized standard for classification of solids (dissolved, suspended, gross, settleable, floatable). This makes it problematic to compare results from different research and to implement stormwater management techniques. In particular, data regarding gross solids sampling, handling and analysis is limited and often inconsistent. The size limitations in the literature vary between 75 μm to 20 mm. A common definition and method for sampling and analyzing of these solids is needed.
• Field sampling equipment and sample collection protocols are inconsistent from study to study (and often site to site) with respect to how bedload and larger diameter solids are dealt with, and therefore do not give an accurate representation of these solids in the water. The location of the sample collection point adds error because the type and concentration of solids are variable vertically as well as horizontally. Nozzle location and orientation are important factors to consider when sampling.
• Particle size distribution is important to analyze because smaller particles are often associated with high toxicity and pathogenic potential. The characterization of particles and associated pollutants throughout a range of PSD offers a new approach for the characterization of stormwater pollutants. The size distribution and quality characteristics of solids in stormwater are site specific and difficult to quantify because they are variable temporally and spatially. There is no one solution for characterizing and remediating all stormwater pollution.
• Suspended Sediment Concentration (SSC) provides a more consistent and reproducible result for the solids in water than Total Suspended Solids (TSS) because of the error associated with subsampling. TSS usually under-predicts the solids actually in the sample. But there is a problem with changing the standard test to SSC because a relatively small proportion of larger particles can comprise the majority of mass and volume of the total solids in the sample. Using SSC in place of TSS analysis may allow for percent removal efficiencies to be met by capturing only larger particles, which will not result in the same water quality impacts as removing the smaller particles that are associated with transporting harmful constituents to the waterways.
• The filter size used to distinguish “TSS” from “Total Dissolved Solids (TDS)” is not consistent. An inconsistent filter size is a problem because the use of a standard 2 micron filter will produce different results than using a 0.45 micron filter, but any size smaller than 2 µm is acceptable according to the APHA Standard methods for the Examination of Water and Wastewater (SM 2540) test protocol.
PROPOSED SOLIDS DEFINITION SYSTEM As stated earlier, stormwater-borne solids include many different types and sizes of solid material ranging from fine suspended sediment to bed-load; trash, coarse (gross) solids, and floating debris to grass clippings and leaves. Some are settleable, some floats and some are suspended; some are organic and some inert. As a result there is much variability in the way that stormwater solids are defined and characterized by different researchers, making it difficult to reconcile the findings of one study with another, and for regulatory agencies to develop meaningful regulations for solids management in urban runoff. Therefore, it is imperative to have consistent definitions and monitoring procedures to improve current stormwater management practices. The following is a proposed classification system that allows for consistent definitions of solids based on size and organic content. This classification scheme takes into account the environmental endpoints, practicality of sampling methods, and treatability. To begin, a reasonable approach is to divide stormwater solids into four major size classifications. Gross solids include trash, litter, debris, and gravel sized sediment that travel as floating, suspended, or bedload in stormwater. These larger solids degrade aquatic habitat, smother productive sediments, leach harmful pollutants into the water column, and are an aesthetic problem (Rushton and England, 2006). Aquatic organisms can become entangled or ingest gross solids causing fatalities. Coarse solids are largeer particles that travel in suspension or as bedload, depending on their specific gravity. Sediment deposition may alter spawning habitats, making them unsuitable for fish to lay eggs. Deposited particles may obscure sources of food, habitat, hiding places, and nesting sites (Wilber, 1983). However, the presence of coarse solids in urban stream may contribute positively to geomorphic stability, since they are less susceptible to scour than fine solids. Fine solids travel in suspension, but are typically settleable depending upon their density and size. Fine solids and coarse solids are often attributed to transporting harmful pollutants which can potentially bioaccumulate or cause chronic problems in organisms. In addition, fine solids degrade habitats by increasing turbidity which reduces light penetration. This negatively impacts photosynthetic organisms and can affect predator-prey relationships by decreasing visual abilities. Fine solids can also cause gill clogging, choke filter mechanisms on filter-feeding invertebrates, and clog feeding mechanisms of some zooplankton (McCabe and Sandretto, 1985). Finally, fine and coarse solids can infill spaces between larger solids in river beds needed for habitat (ASCE, 1992; Lenat et al. 1981; Lenat, 1984; Walters, 1995, Snodgrass et al. 1997, Simons and Senturk, 1991) resulting in less diverse aquatic populations (U.S. EPA 2003). Finally, solids that are classified as dissolved solids comprise fine clays, colloidal materials, microorganisms, and bacteria in addition to dissolved chemicals. Thus, solids that are classified as dissolved are not truly dissolved in the water column. It is generally difficult to remove dissolved solids from stormwater runoff using BMPs relying on filtration or sedimentation. Physical separation can be used to measure the size fractions of each of these four classes of solids in a stormwater sample. These solids can then be further classified as settleable and non-settleable, and volatile or non-volatile to further identify the impacts the solids have on receiving waters.
Gross solids are defined as the solid material that can be captured on a 5 mm screen. The No. 4 sieve in the US standard sieve size corresponds to 4.75 mm (close to 5 mm) and represents the separation between coarse sand and gravel (ASTM Standard D 2487-92). The size also is appropriate for sampling gross solids in the field using a net or screening device. Finally, visual separation can be performed on solids larger than 5 mm if the monitoring program requires it. A 5 mm size classification is consistent with studies in Australia (Allison et al. 1998) and California (Sullivan, 2005) on gross solids. Gross solids can further be divided into three classifications; litter, debris, and coarse sediment. Litter includes human derived trash, such as paper, plastic, Styrofoam, metal, and glass. Debris consists of organic material including leaves, branches, seeds, twigs, and grass clippings. Coarse sediments are inorganic breakdown of soils, pavement and building material (Rushton et al. 2006). Coarse solids are defined as the solid material greater than 75 μm and less than 5 mm. These solids are associated with sedimentation destroying habitat, smothering benthic organisms, and transporting toxic elements into the ecosystem. Often, particles larger than 75 μm are not effectively collected using automatic water quality samplers therefore a combination of bedload samplers and autosamplers may be needed to sample this size range. The No. 200 mesh in the U.S. standard sieve size corresponds with 75 μm and is considered the separation between clay and silt and fine sand (ASTM Standard D 2487-92). Fine solids are defined in this study as the material that passes through the No. 200 sieve (75 µm) but is retained by a 2 micron filter (Whatman grade 934AH or equivalent). Fine solids are commonly transported as suspended solids and attributed to increased turbidity, transporting harmful toxins into the ecosystem, and embeddedness characteristics.
1) Standard Methods for the Examination of Water and Wastewater allows several sizes with 2.0 µm as the maximum size. For standardization purposes, it is recommended that the 2 μm filter be selected because smaller size filters tend to clog and the residue itself affects the size of material that is retained above the filter. In addition, the 2 μm particle size represents the lower limit of particle size that will normally settle out in a typical stormwater detention pond.
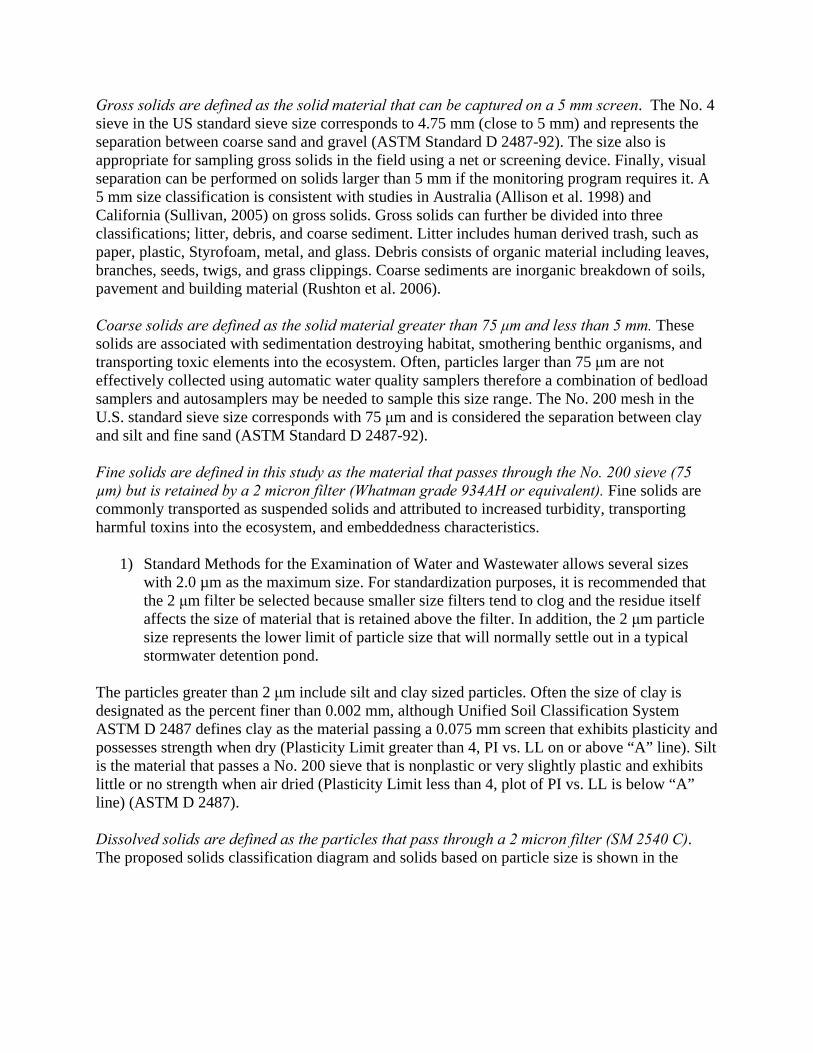
The particles greater than 2 μm include silt and clay sized particles. Often the size of clay is designated as the percent finer than 0.002 mm, although Unified Soil Classification System ASTM D 2487 defines clay as the material passing a 0.075 mm screen that exhibits plasticity and possesses strength when dry (Plasticity Limit greater than 4, PI vs. LL on or above “A” line). Silt is the material that passes a No. 200 sieve that is nonplastic or very slightly plastic and exhibits little or no strength when air dried (Plasticity Limit less than 4, plot of PI vs. LL is below “A” line) (ASTM D 2487). Dissolved solids are defined as the particles that pass through a 2 micron filter (SM 2540 C). The proposed solids classification diagram and solids based on particle size is shown in the
following Figures 1 and 2.
75 μm 2 μm filter
Fine Solids Gross Solids Dissolved Solids Coarse Solids
5 mm
Very fine sand Very fine gravel Detritus
Silt Course clay Organic fines Phytoplankton
Fine clays Colloids Bacteria Viruses
No. 4 Sieve No. 200 Sieve
Course sand Course gravel Trash Large debris
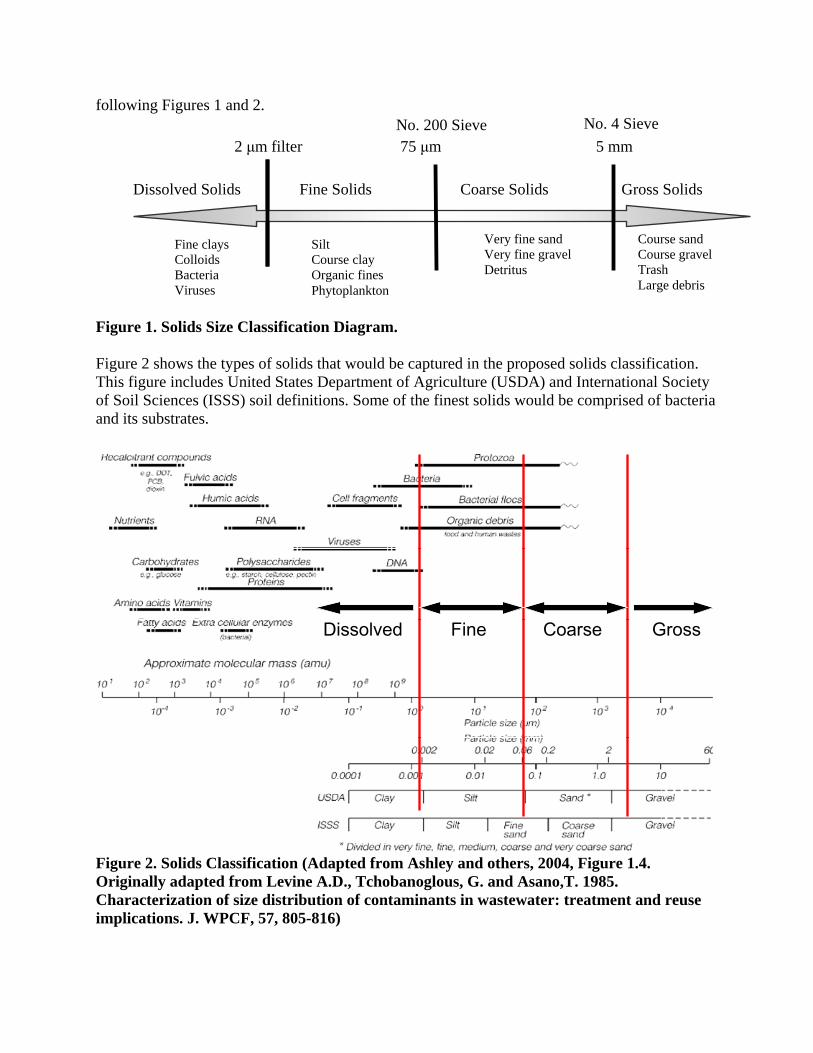
Figure 1. Solids Size Classification Diagram. Figure 2 shows the types of solids that would be captured in the proposed solids classification. This figure includes United States Department of Agriculture (USDA) and International Society of Soil Sciences (ISSS) soil definitions. Some of the finest solids would be comprised of bacteria and its substrates.
Dissolved Fine Coarse GrossDissolved Fine Coarse Gross
Figure 2. Solids Classification (Adapted from Ashley and others, 2004, Figure 1.4. Originally adapted from Levine A.D., Tchobanoglous, G. and Asano,T. 1985. Characterization of size distribution of contaminants in wastewater: treatment and reuse implications. J. WPCF, 57, 805-816)

DissolvSolid
ed
The above solids classifications can further be divided into volatile (relating to organic) and non-volatile (relating to inorganic) as illustrated in Figure 3. Organic material comes from a wide
Gross Solid
No. 2Sieve (75
00 μm)
Litter
Debris
Fine Solids
2 micron filter
Filtrate
Residue
Residue
Filtrate
Physical Characterization
settling time
Organic Dissolved Solids
Inorganic Dissolved Solids
Fine Solids in Suspension
Fine Settleable Solids
Gross Solids in Suspension
Organic Fine Solids in Suspension
Organic Gross Solids in Suspension
Gross Settleable Solids
Inorganic Fine Solids in Suspension
Inorganic Fine Settleable Solids
Organic Fine Settleable Solids
DissolvSolid
ed
Inorganic Gross Solids in Suspension
Organic
Gross Settleable Solids
Inorganic
Gross Settleable Solids
Coarse Solid
No. 4 Sieve (4.75 mm)
Coarse Settleable Solids
Coarse Solids in Suspension
Organic Coarse Solids in Suspension
Inorganic Coarse Solids in Suspension
Organic Coarse Settleable Solids
Inorganic Coarse Settleable Solids
settling time
Filtrate
Residue
Gross Solid
No. 2Sieve (75
00 μm)
Litter
Debris
Fine Solids
2 micron filter
Filtrate
Residue
Residue
Filtrate
Physical Characterization
settling time
Organic Dissolved Solids
Inorganic Dissolved Solids
Fine Solids in Suspension
Fine Settleable Solids
Gross Solids in Suspension
Organic Fine Solids in Suspension
Organic Gross Solids in Suspension
Gross Settleable Solids
Inorganic Fine Solids in Suspension
Inorganic Fine Settleable Solids
Organic Fine Settleable Solids
Inorganic Gross Solids in Suspension
Organic
Gross Settleable Solids
Inorganic
Gross Settleable Solids
Coarse Solid
No. 4 Sieve (4.75 mm)
Coarse Settleable Solids
Coarse Solids in Suspension
Organic Coarse Solids in Suspension
Inorganic Coarse Solids in Suspension
Organic Coarse Settleable Solids
Inorganic Coarse Settleable Solids
settling time
Filtrate
Residue
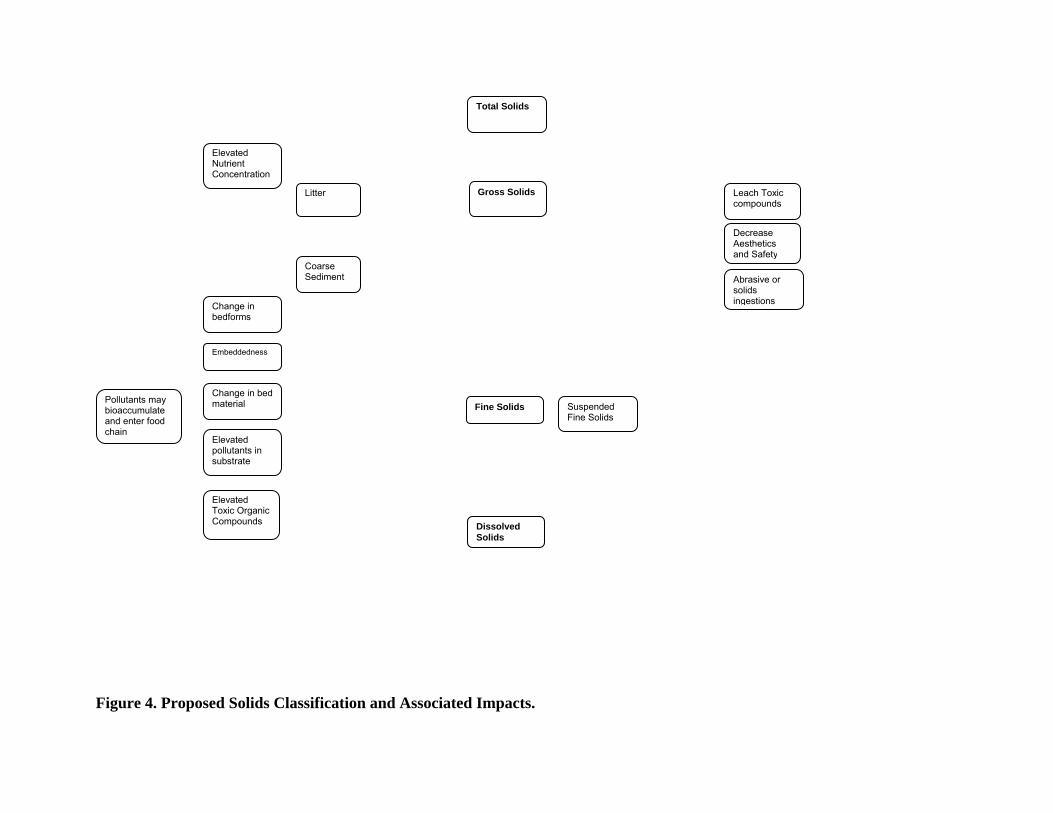
Figure 3. Solids Analytical Classification Diagram. range of sources including anthropogenic and natural sources. Examples of anthropogenic sources include paper, plastics, oil and grease, tire rubber, power plant, incinerators and pesticides and herbicides. Natural sources include organisms, leaves, grass, flower shatter, and pollen. Some examples of organics that are particularly harmful in the environment include oils, hydrocarbons, pesticides and herbicides. Additional negative impacts that increased organics may have are increased oxygen demand, phosphorus, ammonia, nitrite, and nitrate. Also, organics can serve as a substrate for bacterial growth. Increased bacteria and viruses in water can potentially be harmful to humans and aquatic life causing illness. The relationships of these proposed definitions for Gross, Coarse, Fine and Dissolved solids to receiving water impacts are illustrated in Figure 4.

PROTOCOL FOR ANALYSIS OF STORMWATER SOLIDS The solids types and concentrations in stormwater are highly variable, differing in size, density, and composition, both temporally and spatially, depending on many factors including rainfall intensity and duration, runoff peaks and volume, topography, particle characteristics, etc. Factors that affect the type and size of solids transported in urban runoff include intensity and duration of rainfall, duration of dry periods between storm events, and human activities within the catchment area (including litter, pet droppings, lawn care, traffic density, road maintenance, spills etc.). Other factors include catchment shape, land use, soil type, surface type and condition, etc. It is not surprising that there is not one commonly accepted size or density of particle that is problematic in stormwater. For example, Murray and others (1999) found the medium sand fraction to contribute the largest percentage to the total metal concentration in samples in the Detroit area. In contrast, Sartor and Boyd (1972) found that less than 10% of particulates are in the silt and clay soil size but they contain over half the phosphorus and 25% of other pollutants. These results support the recommendation for performing more than one solids test on water samples. There are many methods and analytical tests for classifying stormwater solids. Figure 3 shows the proposed analytical system for stormwater-borne solids based on this research. It is recommended to choose from these analytical tests the ones that will best suit the objectives of a given stormwater management program by targeting the solids of concern in the watershed and developing a detailed plan for sampling and analyzing the solids. The following sections provide guidance and recommendations for analytical determinations of the various types of solids identified in Figure 3 and 4. Gross Solids Each site is unique and the decision about which form of gross solids to analyze should be based on the purpose and goals of the monitoring program. The choice can range from minimal laboratory analysis to highly time consuming characterizations (Rushton et al. 2006). Guidelines for developing a gross solids analytical plan are outlined in this document, although a well thought out program should be prepared that is consistent with the stormwater management program goals. As with any analytical plan, it is important to keep accurate records throughout the monitoring and analysis program. The basic level of evaluation should include a volume measurement of gross solids collected and the time between cleanouts. Volume can be characterized in the gross solids trapping device by taking a depth measurement and multiplying it by the area. Alternative methods to calculate volume are to loosely place the gross solids in containers of known volume or record the volume occupied in the vacuum or haul truck needed at the time of cleanout.
Depending on the goals of the monitoring program, more detailed gross solids
characterization may be needed. Separation of litter from sediment and debris can be done by hand. Debris consists of natural organic material including leaves, branches, seeds, twigs and grass clippings (Rushton and others 2006). Litter can be further categorized by visual separation

into the groups indicated below. Characterizing litter may help in understanding the source of the litter and implementing pollution prevention plans.
• Cardboard/chipboard • Paper • Plastic • Glass • Styrofoam / Polystyrene • Metal • Wood - processed • Cloth / fabric • Cigarette butts • “other”
Mass and volume of the separated material can be determined. Litter can be characterized by weight, volume, and number of items; air-dried weight obtained using a digital scale; volume estimated by placing the litter samples into graduated containers; and the number of items determined by manual count. Air-dried weight can vary depending on humidity, temperature, and drying time. It is recommended that if weights are recorded to keep an accurate record of how the material was dried and report it with the data. The percent volatile organic matter of the gross solids can be determined using standard methods by igniting the solids at a constant 550º C (SM 2540 E) where the solids lost upon ignition represent the volatile (organic) matter. This procedure does not distinguish precisely between inorganic and organic matter because the loss on ignition is not strictly confined to organic matter, it may include losses due to decomposition or volatilization of some mineral salts. If more precise characterization of organic matter is desired, tests such as total organic carbon (SM 5310), biochemical oxygen demand (SM 5210), and chemical oxygen demand (SM 5220) could be performed. With an increase in program level and desired output detail, there will be a corresponding increase of effort and expense to more accurately separate the organic particles from the coarse sediment and determine the associated pollutants of each characterization. The chemical analysis and intensity of the study should be determined and a customized program designed to monitor targeted gross solids. Separation of sediment from debris and litter is time consuming and labor intensive. A guideline for possible gross solid analysis is described below.
1. Volume - Determine the appropriate volume and mass of the sample to ensure a representative sample recognizing that very large samples may be needed to represent the gross solids that persist in the catchment area. Volume estimations should be made at the time of collection and/or cleanout for the gross solids collected. Characteriz2. ation – Estimate the percent litter and debris. If desired, manually separate the litter (human derived trash) from organic debris and coarse sediment. More intense separation should be performed depending on monitoring goals. Mass3. - Record the mass of the solids collected. Keep accurate records on how the solids were dried, the length of drying time, temperature, and humidity.

4. Volatile Solids - Ignite solids at 550ºC for one hour in a muffle furnace using procedures described by standard methods. The difference in weight before and after combustion represents the fraction of solids that are volatile.
More intense studies may be needed to determine the percent of material that will float or the chemicals that will potentially leach into the water. If metals or other inorganic compounds are being tested, sampling and handling equipment should be suspended over a tub and rinsed from the top down with 10 percent nitric acid using a pump or squirt bottle (Rushton and others, 2006; ASTM, 2000). Gross Solids analyzed should be reported as a mass (kg) and/or volume (m3) over time, while the pollutants associated with Gross Solids should be reported as mg/kg. The time between collections should also be noted when reporting the mass of solids accumulated between cleanout events (kg/year). If the study includes separation of litter and debris, mass and volume of each category should be recorded. Suspended Solids The traditional method for determining suspended solids in a water-solids mixture is the Total Suspended Solid (TSS) test (EPA Method #160.2 or Standard Methods 2540D). This method was originally developed to quantify solids with respect to wastewater treatment efficiency and thus can be expected to exhibit deficiencies when applied to stormwater, and it may not be suitable for natural waters (Gray and others 2000). A modification of the test called Suspended Sediment Concentration (SSC), uses a similar laboratory method (ASTM Method D 3977-97), but the entire sample is filtered and analyzed. This procedure reduces the variability of the error associated with aliquot subsampling. However, because of the legacy standing of TSS as a controlled pollutant and the limitations of the SSC test itself in measuring the class of solids of concern in stormwater quality management, it is not recommended that other tests be substituted for the parameters, but rather that the laboratory analysis of TSS be modified to more accurately reflect the solids fraction in stormwater that the test was meant to characterize in wastewater. Refer to Chapter 10 for further discussion on the regulatory issues associated with TSS and SSC. Neither the TSS nor SSC analytical procedures address the settleability potential of the solids, which is important in describing the transport potential and fate of pollutants. Understanding how the particles settle may provide better understanding how they will be transported, their ecologic impact on receiving waters, and their treatability. The ability for a particle to settle is a function of the size, shape, density, and surface charge of the particle. Therefore, an analytical procedure is proposed herein to address the settleability of the solids by allowing a settling period to separate the total solids in the sample into a “settleable” fraction and a “suspended” fraction (determined using a modified TSS analytical procedure). Many particles greater than 75 μm have low densities, especially organic material. These particles will remain in suspension or float and add to the suspended solids. It is therefore recommended to include these particles (greater than 75µm, but less than 4.75 mm) in suspended solids testing. The separation of gross solids from coarse and fine solids should be done by sieving the entire sample through a No. 4 sieve (4.75mm). The solids that are retained

on this sieve should not be included in the suspended solids analysis. If the separation between coarse and fine solids is desired in the monitoring goals, additional separations are required and described in further detail later. Total Solids in Suspension (TSiS) with Mixing as an Alternate to SSC - Inconsistencies in the current methods to analyze TSS include mixing speed, pipette location, and pipette size. The TSS and settleable solids test were originally designed to analyze wastewater. Organic solids in wastewater typically have a specific gravity near 1.0, therefore requiring little agitation to become completely mixed. Particle density in urban runoff is much higher, ranging from 1.0-2.86 (Karamalegos et al. 2005), and in most cases, stormwater particulates have specific gravities in the range of 1.5 to 2.5 (Pitt, 1979). These particles with higher densities require more aggressive mixing to prevent solids settling. If the mixing speed is too slow the larger solids will readily settle out and be concentrated at the bottom of the beaker. The Standard Methods for Examining Water and Wastewater does not specify a mixing speed or pipette size before taking the aliquot. The Standard Methods protocol for TSS has several deficiencies. There are variations in pipette sampling point within the sample, sample mixing speed is not sufficient to keep heavier solids suspended, and the pipette orifice size limits the size of solids that can be sampled. If the subsample is withdrawn using a pipette that is too small it may clog and prevent a representative amount of solids to be sample. In contrast, if the pipette is too large, solids may settle out of the pipette when the energy of mixing is lost. These issues can markedly alter the total solids count recovered in the subsample. The current TSS method needs to be revised at least to include an identified mixing speed and pipette for standardization purposes. Based on findings of this study, it is recommended that the sample be mixed with a magnetic stirrer at a speed of 600 rpm in order prevent settling. Prolonged mixing may result in a change of particle size, therefore it is recommended to mix for no longer than one minute before taking the aliquot. Stenstrom (2006) conducted an experiment with a known concentration of solids with varying particle size distribution. A TSS analysis was performed at mixing speeds of 200 rpm to 1100 rpm. A comparison was made (% recovery) between the known concentration and the concentration obtained from the TSS analysis. It should be noted that as particle size increases, it is increasingly difficult to keep the solids well mixed. For example, solids with a diameter less than 100 µm have a higher percent recovery compared to the true solids in the water/solids mixture than solids with a diameter greater than 250 µm with the same density and mixing speed. The aliquot sampling should be performed with a wide bore pipette diameter or sewage pipette from mid-depth in the sample. The results of solids recovery at variable mixing speeds and pipette openings can be seen in Figure 5. TSS aliquots collected from the upper section tend to be biased low, while aliquots collected from the lower section tend to be biased high because of settling and the inability to maintain a well mixed sample (Kayhanian et al. 2006). In a study to improve the method of suspended solids measurements, Kayhanian and others (2006) observed a lateral concentration gradient with higher TSS concentrations near the wall of the sample container and lower TSS concentrations near the vortex. It was concluded that the sample should be taken midway between the vortex and the wall of the container. While not as accurate as SSC, better mixing and a large mouth

pipette dramatically improve recovery (Stenstrom et al. 2006, personal communication). Based on findings of this research, it is recommended that the TSS analysis be modified as follows:
• Mix the sample using a magnetic stirrer for one minute at 600 rpm • Use a large bore pipette. The tip opening of pipettes recommended for use is about 3
mm in diameter (Kimble-Contes, Inc., 2000). • Withdraw the aliquot from mid-depth and midway between the vortex and the wall of
the container.
Figure 5. Solids Recovery with Variable Mixing Speed and Pipettes. (Stenstrom and
others, 2006)

Total Suspended Solids with Settling as an Improved Estimate of the Traditional TSS Protocol - Settleable Solids (SM 2450 F) are currently measured by allowing not less than one liter of well-mixed sample to settle for one hour undisturbed. 250 ml is siphoned from the center of the vessel at a point halfway between the surface of the settled material and the liquid surface, and a TSS analysis is performed on this aliquot. The difference in concentration between the non-settled original aliquot and the siphoned supernatant aliquot yields the settleable solids concentration. The problem with this test is that the settling time (one hour) defines the particle size that will settle out and may not be appropriate for stormwater studies and removal practices. The settling velocity data for urban runoff indicate that a large fraction of TSS removed by sedimentation will settle out very rapidly (Driscoll, 1989).
Figure 6 shows a recommended method for solids testing that will result in the following parameters:
1. Suspended Sediment Concentration (SSC) 2. Total Suspended Solids (TSS) 3. Total Settleable Solids (TSTS) 4. Total Dissolved Solids (TDS)
Water Sample
Water Sample
Water Sample
USGS Suspended Sediment
Concentration Analysis
Standard Method Total Suspended
Solids
Settling time
No. 4 sieve (5 mm), Split Sample
TDS
TSSSSC
TDS Figure 6. Recommended Suspended Solids Analytical Procedure. The water sample that is obtained from the sampling device is sieved with a No. 4 sieve to remove gross solids, which could skew the analysis, and split into two equal samples using an appropriate churn or cone splitter. Care should be taken to obtain two equally representative samples. One water sample is then analyzed using ASTM Method D 3977-97 to determine the SSC, which represents all the solids greater than 2 μm for the entire sample (both fine solids and coarse solids).

The second sample, for TSS determination, should be well mixed (following the procedure described in the previous section above) and then allowed to sit undisturbed for five minutes to permit particles to settle or float out of suspension. A 5 minute settling time will allow for coarse separation and represents BMP processes relying on settling. Larger particles, with the same density, will fall at a faster rate than fine particles. As mentioned previously, fine particles are attributed with a greater negative impact on receiving waters due to increase specific surface area and the impacts fine solids have on ecology. A study by Contech Stormwater Solutions (2006) analyzed two water solids mixtures for TSS concentrations with settling times of 0-5 minutes. The results showed that there is a reduction of TSS with increasing time, but the rate of reduction begins to level out between 4-5 minutes. This indicates that the rapidly settleable solids have separated and that the solids that will remain in suspension are being sampled. Figure 7 shows a graphical representation of the experiment results.
Figure 7. Graphical Representation of Allowing a Settling Time prior to the TSS Analysis.
From Lenhart, James. Contech Stormwater Solutions. 2006 Many stormwater BMPs rely on settling for removal of solids in stormwater therefore the particle settling velocity should be investigated in the laboratory. To address the particles ability to settle out of suspension a short settling time is proposed to allow for separation. The specific gravity of discrete and agglomerate particles in stormwater is influenced by the presence of organic matter, which has specific gravities typically ranging from 1.1 to 1.5 (Minton, 2005). The solids in a study by Karamalegos and others (2005) showed that the densities of stormwater solids were highly variable, but it was concluded that the particle density in runoff ranged from 1.00-2.86 g/cm3. These differences in densities associated with urban runoff affects the ability of the particle to settle out of suspension.
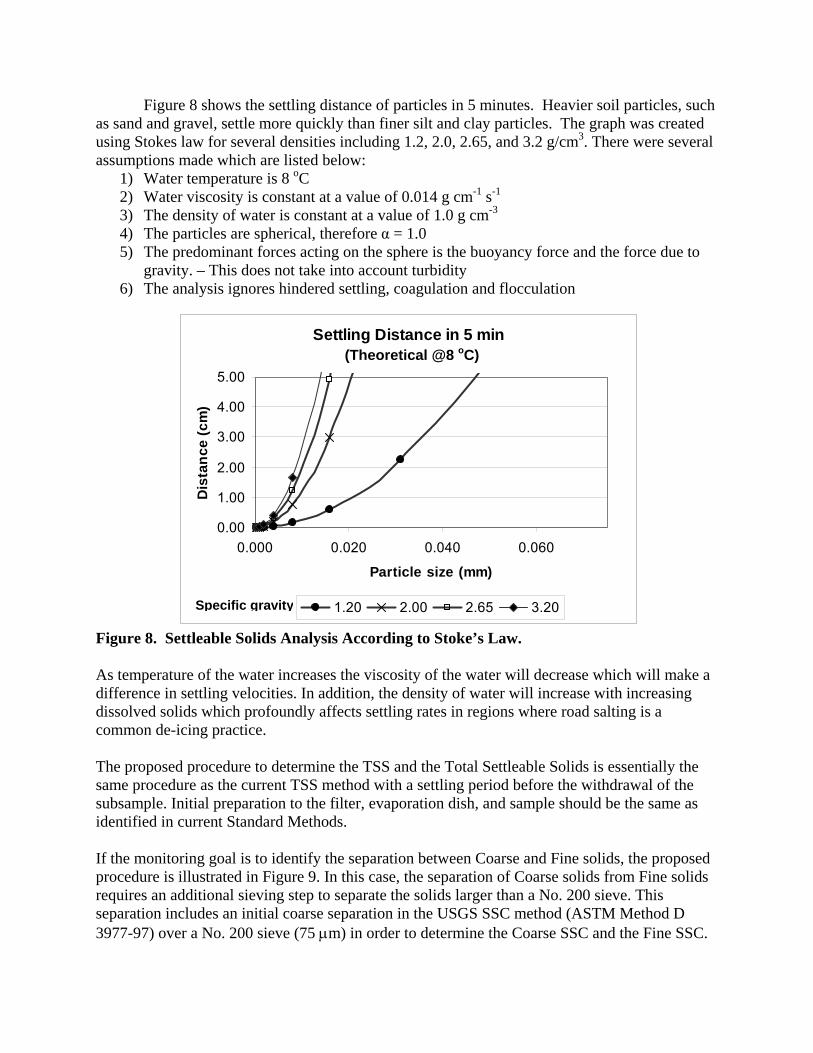
Figure 8 shows the settling distance of particles in 5 minutes. Heavier soil particles, such as sand and gravel, settle more quickly than finer silt and clay particles. The graph was created using Stokes law for several densities including 1.2, 2.0, 2.65, and 3.2 g/cm3. There were several assumptions made which are listed below:
1) Water temperature is 8 oC 2) Water viscosity is constant at a value of 0.014 g cm-1 s-1 3) The density of water is constant at a value of 1.0 g cm-3 4) The particles are spherical, therefore α = 1.0 5) The predominant forces acting on the sphere is the buoyancy force and the force due to
gravity. – This does not take into account turbidity 6) The analysis ignores hindered settling, coagulation and flocculation
Settling Distance in 5 min
0.00
1.00
2.00
3.00
4.00
5.00
0.000 0.020 0.040 0.060
Particle size (mm)
Dis
tanc
e (c
m)
1.20 2.00 2.65 3.20Specific gravity
(Theoretical @8 oC)
Figure 8. Settleable Solids Analysis According to Stoke’s Law. As temperature of the water increases the viscosity of the water will decrease which will make a difference in settling velocities. In addition, the density of water will increase with increasing dissolved solids which profoundly affects settling rates in regions where road salting is a common de-icing practice. The proposed procedure to determine the TSS and the Total Settleable Solids is essentially the same procedure as the current TSS method with a settling period before the withdrawal of the subsample. Initial preparation to the filter, evaporation dish, and sample should be the same as identified in current Standard Methods. If the monitoring goal is to identify the separation between Coarse and Fine solids, the proposed procedure is illustrated in Figure 9. In this case, the separation of Coarse solids from Fine solids requires an additional sieving step to separate the solids larger than a No. 200 sieve. This separation includes an initial coarse separation in the USGS SSC method (ASTM Method D 3977-97) over a No. 200 sieve (75 μm) in order to determine the Coarse SSC and the Fine SSC.
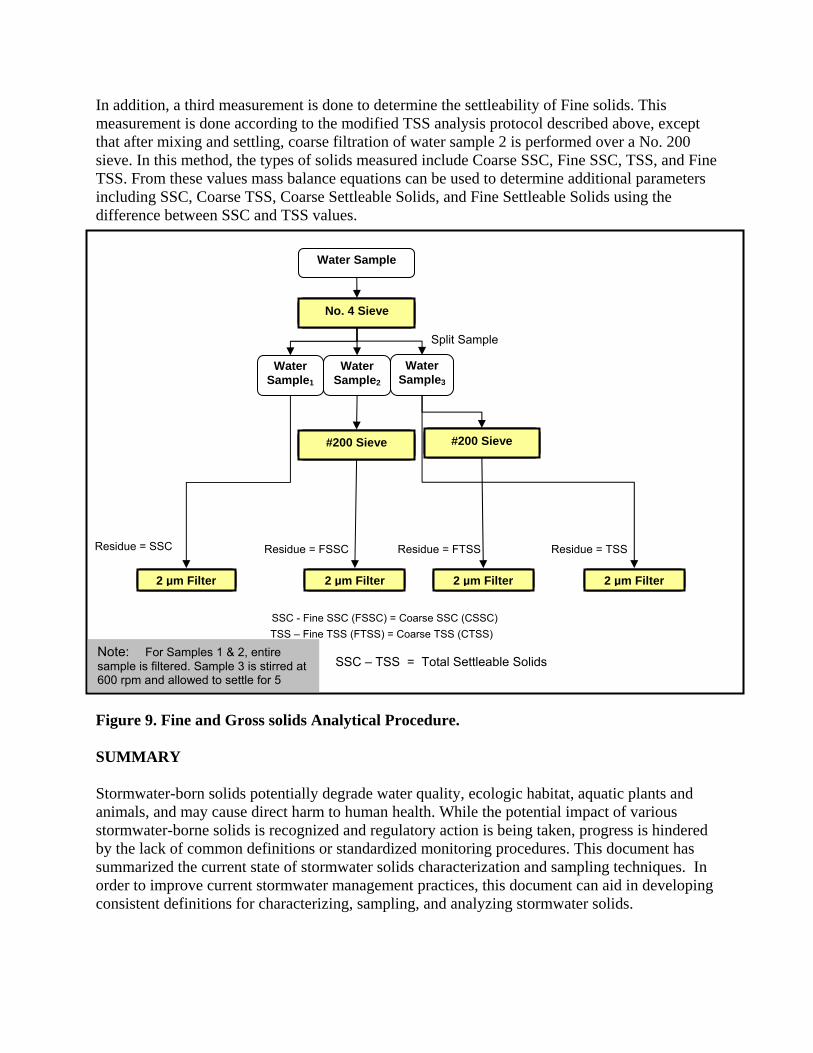
In addition, a third measurement is done to determine the settleability of Fine solids. This measurement is done according to the modified TSS analysis protocol described above, except that after mixing and settling, coarse filtration of water sample 2 is performed over a No. 200 sieve. In this method, the types of solids measured include Coarse SSC, Fine SSC, TSS, and Fine TSS. From these values mass balance equations can be used to determine additional parameters including SSC, Coarse TSS, Coarse Settleable Solids, and Fine Settleable Solids using the difference between SSC and TSS values.
Water Sample2
Water Sample1
#200 Sieve
Split Sample
Residue = FSSC
2 µm Filter
SSC - Fine SSC (FSSC) = Coarse SSC (CSSC)
Residue = FTSS
TSS – Fine TSS (FTSS) = Coarse TSS (CTSS)
Water Sample3
2 µm Filter
Residue = SSC
#200 Sieve
Residue = TSS
2 µm Filter2 µm Filter
No. 4 Sieve
Water Sample
Note: For Samples 1 & 2, entire sample is filtered. Sample 3 is stirred at 600 rpm and allowed to settle for 5
SSC – TSS = Total Settleable Solids
Figure 9. Fine and Gross solids Analytical Procedure. SUMMARY Stormwater-born solids potentially degrade water quality, ecologic habitat, aquatic plants and animals, and may cause direct harm to human health. While the potential impact of various stormwater-borne solids is recognized and regulatory action is being taken, progress is hindered by the lack of common definitions or standardized monitoring procedures. This document has summarized the current state of stormwater solids characterization and sampling techniques. In order to improve current stormwater management practices, this document can aid in developing consistent definitions for characterizing, sampling, and analyzing stormwater solids.

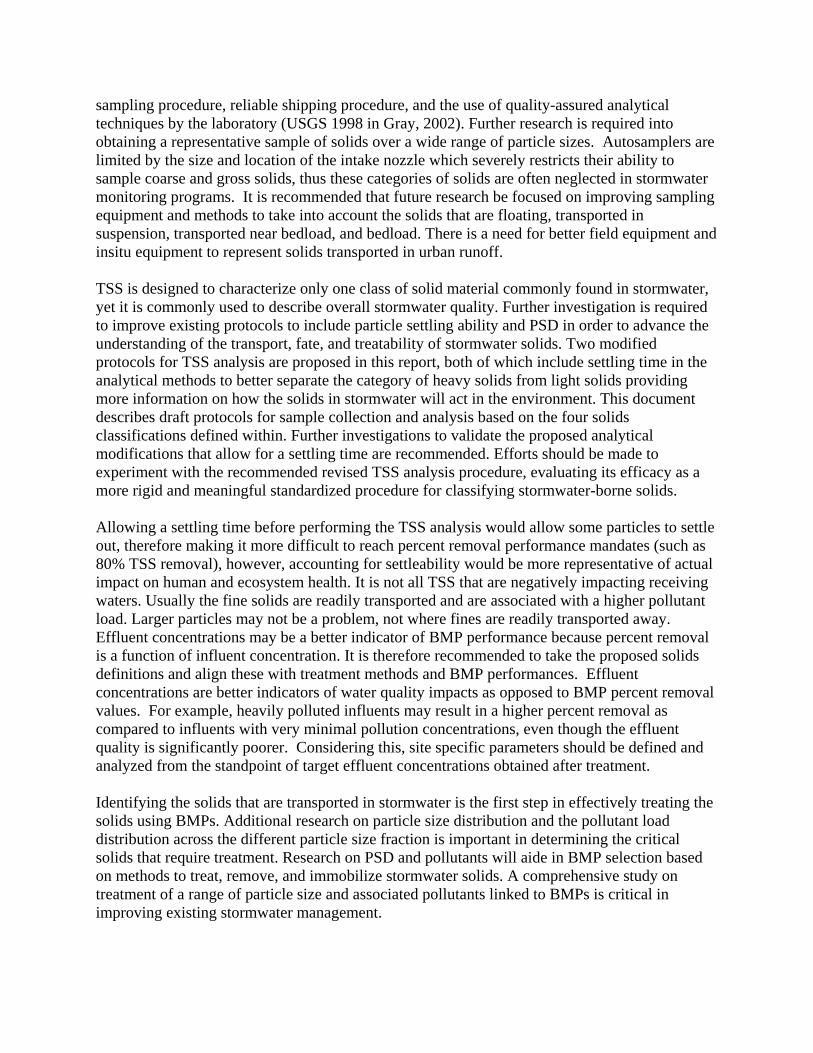
sampling procedure, reliable shipping procedure, and the use of quality-assured analytical techniques by the laboratory (USGS 1998 in Gray, 2002). Further research is required into obtaining a representative sample of solids over a wide range of particle sizes. Autosamplers are limited by the size and location of the intake nozzle which severely restricts their ability to sample coarse and gross solids, thus these categories of solids are often neglected in stormwater monitoring programs. It is recommended that future research be focused on improving sampling equipment and methods to take into account the solids that are floating, transported in suspension, transported near bedload, and bedload. There is a need for better field equipment and insitu equipment to represent solids transported in urban runoff. TSS is designed to characterize only one class of solid material commonly found in stormwater, yet it is commonly used to describe overall stormwater quality. Further investigation is required to improve existing protocols to include particle settling ability and PSD in order to advance the understanding of the transport, fate, and treatability of stormwater solids. Two modified protocols for TSS analysis are proposed in this report, both of which include settling time in the analytical methods to better separate the category of heavy solids from light solids providing more information on how the solids in stormwater will act in the environment. This document describes draft protocols for sample collection and analysis based on the four solids classifications defined within. Further investigations to validate the proposed analytical modifications that allow for a settling time are recommended. Efforts should be made to experiment with the recommended revised TSS analysis procedure, evaluating its efficacy as a more rigid and meaningful standardized procedure for classifying stormwater-borne solids. Allowing a settling time before performing the TSS analysis would allow some particles to settle out, therefore making it more difficult to reach percent removal performance mandates (such as 80% TSS removal), however, accounting for settleability would be more representative of actual impact on human and ecosystem health. It is not all TSS that are negatively impacting receiving waters. Usually the fine solids are readily transported and are associated with a higher pollutant load. Larger particles may not be a problem, not where fines are readily transported away. Effluent concentrations may be a better indicator of BMP performance because percent removal is a function of influent concentration. It is therefore recommended to take the proposed solids definitions and align these with treatment methods and BMP performances. Effluent concentrations are better indicators of water quality impacts as opposed to BMP percent removal values. For example, heavily polluted influents may result in a higher percent removal as compared to influents with very minimal pollution concentrations, even though the effluent quality is significantly poorer. Considering this, site specific parameters should be defined and analyzed from the standpoint of target effluent concentrations obtained after treatment. Identifying the solids that are transported in stormwater is the first step in effectively treating the solids using BMPs. Additional research on particle size distribution and the pollutant load distribution across the different particle size fraction is important in determining the critical solids that require treatment. Research on PSD and pollutants will aide in BMP selection based on methods to treat, remove, and immobilize stormwater solids. A comprehensive study on treatment of a range of particle size and associated pollutants linked to BMPs is critical in improving existing stormwater management.

Responsibilities of stormwater management to meet state and federal permitting are ever increasing. There is a need for information for stormwater managers and planners to better select and design BMPs based on improving impacts to water quality and comply with current and future TMDLs. TMDLs rely on BMPs to meet allocations by controlling stormwater solids. BMPs have been successful in improving receiving water quality, although there is not a comprehensive BMP program that is successful in meeting standards in all flow regimes. Research to link stormwater BMPs and the effectiveness of treating various particle sizes and controlling pollutant fate is a critical need given the increasing regulations being placed on stormwater. ACKNOWLEDGEMENTS This project was supported the Water Environment Research Foundation, Project No. 04-SW-4. The authors wish to express their thanks to the Project Steering Committee for their contributions to the research effort. Additional support for this project was provided by the Harold H. Short Chair endowment at Colorado State University. REFERENCES Allison, R.A., T.A. Walker, F.H.S. Chiew, I. C. O'Neill, and T. A. McMahon. 1998. From roads to rivers: gross pollutant removal from urban waterways. Cooperative Research Center for Catchment Hydrology. Report 98/6.Department of Civil Engineering, Monash University, Clayton, Victoria 3800, Australia. www.catchment.crc.org.au/
American Society of Civil Engineers (ASCE) and Water Environment Federation (WEF). 1992. Design and Construction of Urban Stormwater Management Systems. ASCE, Manuals and Report of Engineering Practice No. 77, New York. N.Y. WEF, Manual of Practice No. FD-20, Alexandria, VA.
APHA, AWWA, WPCF. 1998. Standard Methods for the Examination of Water and Wastewater. 20th Edition. American Public Health Association, American Water Works Association, Water Pollution Control Federation, Washington, D.C.
Armitage, N., and A. Rooseboom, 2000a. The Removal of Urban Litter from Stormwater Conduits and Streams: Paper 1 The Quantities Involved and Catchment Litter Management Options. Water South Africa. 26, 181.
Armitage, N., and A. Rooseboom, 2000b. The Removal of Urban Litter from Stormwater Conduits and Streams: Paper 2 Model Studies of Potential Trapping Structures. Water SA. 26, 189.
Ashley, R.M., J.L. Bertrand-Krajewski, T.Hvitved-Jacobsen, and M. Verbanck. 2004. Solids in Sewers – Characteristics, Effects and Control of Sewer Solids and Associated Pollutants. International Water Association Scientific and Technical Report No. 14 IWA publishing ISBN 1900222914
Blight, L.K. and A.E. Burger, 1997. Occurrence of plastic particles in seabirds from the eastern North Pacific. Marine Pollution Bulletin 3 (5): 323-325

Booth D.B. 1991. Urbanization and the natural drainage system – impacts, solutions and prognoses. Northwest Environmental Journal 7:93-118.
Butler, D., J.W. Davies, C. Jefferies, and M. Schutze. 2002. Gross Solids Transport in Sewers. Water & Maritime Engineering 156 IssueWM2 p 175-183.
Chapra, S.C. and G.J. Pelletier. 2004. QUAL2K: A Modeling Framework for Simulating River and Stream Water Quality, Version 1.3: Documentation and Users Manual. Civil and Environmental Engineering Department, Tufts University, Medford, MA.
Chebbo, G., and A. Bachoc, 1992. Characterization of suspended solids in urban wet weather discharges. Water Science and Technology Vol 25 No 8 pp 171-179.
Chebbo G.; M.G. Gromaire; and M. Kafi-Benvahia. 2005. Spatial variability of characteristics and origins of urban wet weather pollution in combined sewers. Water Science and Technology. Vol 52 pp 53-62.
Cheesman B.C., and S.A. Williams,1999. Biodiversity and conservation of river macroinvertebrates on an expanding urban fringe: western Sydney, New South Wales, Australia. Pacific Conservation Biology Vol 5 pp 36-55.
Corbett C.W., M. Wahl, D.E. Porter, D. Edwards, and C. Moise 1997. Nonpoint source runoff modeling: A comparison of a forested watershed and an urban watershed on the South Carolina coast. Journal of Experimental Marine Biology and Ecology Vol 213 pp 133-149.
Dallmer, L. 2002. SQIRTS- an On-site Stormwater Treatment and Reuse Approach to Sustainable Water Management in Sydney. Water Science and Technology, Vol 46 No 6 pp 151-158.
Dodge, C. 2005. AMAFCA/Albuquerque MS4. Floatable and Gross Pollutant Study. http://www.cabq.gov/flood/pdf/FINALREPORT-OCTOBER2005.pdf.
Dodson, R.D. 1999. Stormwater Pollution Control. 2nd edition. McGraw-Hill Companies Inc. New York. Chapter 9.
Driscoll, E.D. 1989. Long Term Performance of Water Quality Ponds. In: Design of Urban Runoff Quality Controls. Edited by Larry a. Roesner, Ben Urbonas and Michael B. Sonnen. Published by the American Society of Civil Engineers.
Ellis, J.B. and D.M. Revitt, 1982. Incidence of heavy metals in street surface sediments: solubility and grain size studies. Water, Air, and Soil Pollution. Volume 17, 87-100.
Gray, J.G; D. Glysson; L.M. Turcious; and G.E. Schwarz. 2000. Comparability of Suspended-Sediment Concentration and Total Suspended Solids Data. United States Geological Survey Water-Resources Investigation Report 00-4191.
Gray, J.R. 2002. The Need for Surrogate Technologies to Monitor Fluvial-Sediment Transport.http://water.usgs.gov/osw/techniques/TSS/listofabstracts.htm. Proceedings of the subcommittee on sedimentation’s “Turbidity and Other Sediment Surrogates Workshop” 2002. Reno, NV.
Hannah, M. 2005. Stormwater Bed Load & Gross Pollutant Export Rates and Their Implication for Treatment Devices. In Fourth South Pacific Conference on Stormwater and Aquatic Resource Protection 4-6 May 2005, Aukland, NZ .
Harper, H. 1998. An explanation of sources of stormwater pollution and pollutant loading rates for different land uses in Florida. Environmental Research and Design, In. Orlando.
Hatt B.E., T.D. Fletcher, C.J. Walsh . and S.L. Taylor 2004. The influence of urban density and drainage infrastructure on the concentrations and loads of pollutants in small streams. Environmental Management Vol 34 pp 112-124.
Hijioka, Y.; H. Frurumai, and F. Nakajima, 2000. Runoff Pollutant Load of Suspended Solids with Different Particle Sizes in a Separate Sewer System. Proc. 3rd JSWE Symposium, September 2000, Neyagawa, Japan. Japanese Society of Water Environment (JSWE).
James, R.B. 1999. Characteristics & Measurement of Solids in Stormwater Runoff. Paper presented at the Indiana Water Environment association.
Karamalegos, A.M., M.E. Barrett; D.F. Lawler; J.F. Malina. 2005. Particle Size Distribution of Highway Runoff and Modification through Stormwater Treatment. CRWR Online Report 05-10. http://www.crwr.utexas.edu/reports/pdf/2005/rtp05-10.pdf
Kayhanian, M., T.M. Young; and M.K. Stenstrom. 2005. Limitations of current solids measurements in stormwater runoff. Stormwater July/Aug.
Kayhanian, M. J.E. Leatherbarrow, and C.P. Alaimo. 2006. Improved method of Suspended Solid Measurements. Presented at Stormcon conference 2006. Denver CO.
Kimble-Contes, Inc., accessed May 1, 2000, at URL http://www.kimble-knotes.com/html/pg-37005.html and URL http://www.kimble-knotes.com/html/pg- 37034B.html.
Lenat D.R., D.L. Penrose and K.W. Eagleson. 1981. Variable effects of sediment addition on stream benthos. Hydrobiologial. Vol 79 pp.187-194.
Lenat, D.R. 1984. Agriculture and stream water quality, A biological evaluation of erosion control practices. Environmetnal Management. Vol 8 No. 4 pp. 333-344.
Lenhart, J. 2006. Affect of Variant Time to Sub-Sampling on Total Suspended Solids Results. Contech Stormwater Solutions Product evaluation. PE 38.09 Report
Lloyd, S. D., T.H.F. Wong, B. Porter. 2001 "Implementing an ecological sustainable stormwater drainage system in a residential development" Water Science and Technology 45: 1-7
McCabe, J.M., and C.L. Sandretto. 1985. Some Aquatic Impacts of Sediment, Nutrients, and Pesticides in Agricultural Runoff. Publication No. 201. Limnological Research Laboratory, Dept. of Fisheries and Wildlife, Michigan State University.
Minton, G.R. 2005. Stormwater Treatment: Biological, Chemical, and Engineering Principles. Second edition.
Mudgway, L.B., H.P. Duncan, T.A. McMahon, and F.H.S. Chiew,. 1997. Best Practice Environmental Management Guidelines for Urban Stormwater, Cooperative Research Centre for Catchment Hydrology
Murray, K.S., D. Cauvet, M. Lybeer, and J.C. Thomas, 1999. Particle Size and Chemical Control of Heavy Metals in Bed Sediment From the Rouge River, Southeast Michigan. Environment Science and Technology 33:987-992.
Muthukaruppan M., F. Chiew, T. Wong. 2002. Size Distribution and Partitioning of Urban Pollutants.
Osborne L.L. and M.J. Wiley 1988. Empirical relationships between land-use/cover and stream water quality in an agricultural watershed. Journal of Environmental Management Vol 26 pp 9-27.
Pitt, R. 1979 Demonstration of Nonpoint Pollution Abatement Through Improved Street Cleaning Practices. Untied States Environmental Protection Agency. Grant No. S-804432. EPA-600/2-79-161. 270 pages. Cincinnati
Richter B.D., J.V. Baumgartner Wigington and D.P. Braun. 1997. How much Water does a River Need? Freshwater Biology. Vol 37 pp 231-249.
Roberts, C.R. 1989. Flood frequency and urban-induced channel change: some British examples. Pages 57-82 in K. Beven and P.Carling, editors. Floods: hydrological, sedimentological and geomorphological implications. Wiley, New York.
Roesner, L.A. and B.P. Bledsoe. 2003. Physical effects of wet weather flows on aquatic habitats: present knowledge and research needs. Water Environment Research Foundation, Report 00-WSM-4, Alexandria, Virginia.
Rushton, B., G. England. 2006. ASCE Guidelines for Monitoring Stormwater Gross Solids. Working paper for the Task Committee on Gross Solids, UWRRC, ASCE. 20 pages.
Sansalone, J.J. and S.C. Buchberger. 1997. Characterization of particulate loading in the urban stormwater first flush. Water Science and Technology, Vol 36 No. 9 pp. 155-160.
Sansalone, J.J., J. Koran, S.G. Buchberger, and J. Smithson. 1998. Physical characteristics of highway solids transported during rainfall. ASCE Journal of Environmental Engineering Vol. 124 No. 5 pp 427-440.
Sansalone, J. and T. Tribouillard. 1999. Variation in characteristics of abraded roadway particles as a function of particle size – Implications for water quality and drainage. Transportation Research Record 1690.
Sartor, J.D. and G.B. Boyd. 1972. Water Pollution Aspects of Street Surface Contaminants, EPA-R2-72-081.
Shaheen, D.G. 1975. Contributions of Urban Roadway Usage to Water Pollution EPA 600/2-75-004.
Simons, D.B. and F. Senturk. 1991. Sediment Transport Technology. Water and Sediment Dynamics. Water Resources Publication, Littleton Colorado.
Snodgrass, W.J., B.W. Kilgour, M. Jones, J. Prish and K. Reid. 1997. Can environmental impact of watershed development be measured In: Roesner, L.A. eds. Effects of watershed development and management on aquatic ecosystems. Proceedings of an Engineering Foundation Conference. Published by ASCE, New York 1997
Stahre, P., B. Urbonas. 1990. Stormwater Detention for Drainage, Water Quality, and CSO Management. Prentice-Hall Inc. Englewood Cliffs, N.J.
Sullivan, J., F. McMasters, and T. Sobelman. 2005. LA River Cleanup. Stormwater online:http://www.gradingandexcavation.com/sw_0511_great.html
U.S. Environmental Protection Agency. 1992. Plastic Pellets in the Aquatic Environment: Sources and Recommendations. U.S. EPA 842-B-92-010. Washington, DC.

U.S. Environmental Protection Agency. 2000. National Water Quality Inventory. 1998 report to Congress U.W. Environmental Protection Agency.
U.S. Environmental Protection Agency. 2003. excerpted from U.S. EPA 2003. "Developing Water Quality Criteria for Suspended and Bedded Sediments (SABS): Potential Approaches (Draft, August 2003)." US EPA, Office of Water draft report. http://www.epa.gov/WARSSS/sedsource/sabs.htm
Walsh, C. J., A.W. Leonard, A.R. Ladson, T.D. and Fletcher. 2004. Urban Stormwater and the Ecology of Streams. CRC for Freshwater Ecology and CRC for Catchment Hydrology: Canberra.
Wilber, C.G. 1983. Selenium: A Potential Environmental Poison and a Necessary Food Constituent. Springfield: Charles C. Thomas Publisher.
Wilde, F.D., 2005, Preparations for water sampling: U.S. Geological Survey Techniques of Water-Resources Investigations, book 9, chap. A1; Urban Stormwater BMP Performance Monitoring: EPA-821-B-02-001 April 2002
Wolman, M.G. 1967. A cycle of sedimentation and erosion in urban river channels. Geografiska Annaler Vol. 49 pp. 385-395.