improved understanding of geogrid response to …...draft 1 improved understanding of geogrid...
TRANSCRIPT

Draft
Improved Understanding of Geogrid Response to Pullout Loading: Insights from Three-Dimensional Finite Element
Analysis
Journal: Canadian Geotechnical Journal
Manuscript ID cgj-2018-0384.R3
Manuscript Type: Article
Date Submitted by the Author: 02-Apr-2019
Complete List of Authors: Hussein, Mahmoud; McGill UniversityMeguid, Mohamed; McGill University
Keyword: geosynthetics, biaxial geogrid, pullout test, soil-geogrid interaction, frictional resistance
Is the invited manuscript for consideration in a Special
Issue? :Not applicable (regular submission)
https://mc06.manuscriptcentral.com/cgj-pubs
Canadian Geotechnical Journal

Draft
1
Improved Understanding of Geogrid Response to Pullout Loading: Insights from
Three-Dimensional Finite Element Analysis
Mahmoud G. Hussein Postdoctoral Fellow
Civil Engineering and Applied Mechanics
McGill University, Montreal, Quebec, Canada
Mohamed A. MeguidProfessor
Civil Engineering and Applied Mechanics
McGill University, Montreal, Quebec, Canada
(Corresponding author)
Page 1 of 59
https://mc06.manuscriptcentral.com/cgj-pubs
Canadian Geotechnical Journal

Draft
2
Improved Understanding of Geogrid Response to Pullout Loading: Insights from
Three-Dimensional Finite Element Analysis
Abstract
Soil reinforcement has rapidly become one of the most common soil improvement
techniques used in geotechnical engineering. Understanding the behavior of geogrid under pullout
loading is essential for the analysis and design of reinforced soil systems. The overall behavior of
reinforced soils is generally dependent on the properties of the geogrid material, the backfill soil
and the interface condition. Modeling the three-dimensional aspects of soil-geogrid interaction
under pullout loading condition is numerically challenging and requires special consideration to the
different modes of resistance that contribute to the pullout capacity of the geogrid reinforcement.
This study describes the results of a three-dimensional finite-element analysis that has been
developed to investigate the behavior of biaxial geogrid embedded in granular backfill material and
subjected to pullout loading. The modeling approach considers the non-continuous nature of the
geogrid geometry and the elasto-plastic response of the geogrid material. Model validation is
performed by simulating laboratory-size pullout test and comparing the experimental data with
analytical as well as the numerically calculated results. The detailed behavior of the geogrid and the
surrounding backfill is investigated using the proposed numerical approach. Conclusions are made
to highlight the suitability of this technique to analyze similar soil-structure interaction problems.
Keywords: geosynthetics; biaxial geogrid; pullout test; soil-geogrid interaction; frictional
resistance; bearing resistance; nonlinear contact.
Page 2 of 59
https://mc06.manuscriptcentral.com/cgj-pubs
Canadian Geotechnical Journal

Draft
3
INTRODUCTION
Geosynthetic reinforcements are used in various geotechnical engineering applications,
including reinforced earth fills, retaining walls, embankments, paved roads and foundations. The
use of geosynthetics is known to improve soil performance, increase the safety factor against shear
failure while reducing the construction cost of the project (Koerner 2012). In general, evaluating
soil-geosynthetic interaction response is relatively complex as it is affected by several factors
including: i) the geometrical and mechanical characteristics of the geosynthetic material, ii) the
mechanical properties of soil, and iii) boundaries and loading conditions. When using continuous
geotextile (sheet) to reinforce soils, skin friction is the only mechanism that develops at the soil-
geotextile interface, while for geogrids, and due to its open structure, the interaction becomes more
complex (Moraci et al. 2014). The interaction between granular soils and extensible geogrids used
in reinforced geotechnical systems has been the subject of extensive research (e.g. McGown et al.
1984). Soil-geogrid interaction involves three basic load transfer mechanisms: i) tangential/skin
friction, which is a three-dimensional frictional resistance between the geogrids elements
(longitudinal ribs and the transversal bars) and the surrounding backfill; ii) passive earth pressure
(bearing resistance) on the transversal bars; and iii) interlocking of grain particles inside the grid
openings (soil-to-soil friction). Depending on the loading condition and the geosynthetic geometry,
one or more of these interaction mechanisms can be mobilized.
Two design criteria are generally used for most reinforced-soil structures; i) the
reinforcement must not fail in tension (by rupture or excessive deformation), and ii) the
reinforcement must not pull out of the soil resistant zone (Lentz and Pyatt 1988). Designing against
tensile failure requires that tensile stresses in the reinforcement be less than the ultimate strength of
the material. To satisfy the pullout failure criterion, which is generally applied in reinforced walls
and slopes, it is required to determine the reinforcement anchorage capacity and the appropriate
Page 3 of 59
https://mc06.manuscriptcentral.com/cgj-pubs
Canadian Geotechnical Journal

Draft
4
reinforcement length and spacing to prevent pullout failure. In addition, connection failure between
the reinforcement layer and the wall-facing needs to be considered in the analysis.
Soil-Geogrid Interaction under Pullout Loading
Pullout tests generally provide capacity values for specific reinforcement, soil and load
conditions. They also allow for the coefficient of interaction, which is of primary interest in design,
to be accurately determined. According to AASHTO (2012), the coefficient of interaction is a mass
parameter that combines the effect of all interaction mechanisms.
Several Limit equilibrium-based models to estimate geogrid pullout capacity have been
developed by researchers (e.g. Jewell et al. 1984; Koerner et al. 1989; Palmeira and Milligan 1989;
Gurung and Iwao 1999; Perkins and Cuelho 1999; Moraci and Gioffrè 2006; Weerasekara et al.
2017; Zornberg et al. 2017). Most of these models calculate the pullout capacity of a geogrid as the
cumulative contribution of the mobilized bearing resistances at the transversal bars and frictional
resistances along the surface area of the geogrid (friction along the longitudinal and transversal
elements). The pullout resistance is generally expressed as follows:
𝑃 = 𝑃𝑠/𝑟 + 𝑃𝑝𝑏 (1)
where P is the pullout resistance, Ps/r is the frictional resistance between the soil and the in-plane
surface area of the reinforcement, and Ppb is the passive bearing resistance of the bearing members.
In addition to limit equilibrium models, pullout capacity models commonly used in North America
are based on both the AASHTO (2012) and the FHWA (Berg et al. 2009) design specifications. The
procedure lumps the contributions of both frictional and bearing resistance into a single non-
dimensional parameter called the pullout resistance factor, F*, also called the coefficient of
interaction parameter according to FHWA (2009). In this method, the pullout capacity is estimated
as:
Page 4 of 59
https://mc06.manuscriptcentral.com/cgj-pubs
Canadian Geotechnical Journal

Draft
5
P = 2 Le v F* (2)
where P is the pullout resistance per unit width of the geogrid, Le is the length of reinforcement in
the resisting zone (anchorage length), v is the normal stress at the reinforcement level, F* is the
pullout resistance factor (coefficient of interaction = tan), and is a scale effect correction factor 23
(0.8 for geogrids, and 0.6 for geotextiles).
Soil-Geogrid Interface
The shear stress-strain relationship along a given soil-geogrid interface, which is used to
determine the required anchorage length, is commonly characterized using direct shear and/or
pullout tests (Farrag et al. 1993). Direct shear tests are applicable for conditions involving a failure
plane that propagates mainly along the reinforcement (direct sliding mechanism) and are used to
determine the frictional bond between the backfill soil and the surface area of the geogrid (Fig. 1).
Pullout tests, on the other hand, are used to study the anchorage capacity of a geogrid reinforcement
and to understand the load transfer mechanism within the anchorage zone.
Another distinction between the two tests relate to how strains mobilize along the surface of
the reinforcement. For direct shear tests, the mobilized shear strains are postulated to be uniformly
distributed along the soil-geogrid interface. While in pullout tests, the mobilized strains are
combination of interface shear strains and geogrid extension. This coupled mechanism results in a
non-uniform shear strain-stress distribution along the geogrid.
Modeling Pullout Tests
In North America, ASTM/D6706-01 (2013) is used to quantify pullout capacity in the
laboratory. A large amount of literature related to the results and interpretation of pullout laboratory
tests is available (Palmeira and Milligan 1989; Farrag et al. 1993; Bakeer et al. 1998; Alagiyawanna
et al. 2001; Moraci and Recalcati 2006; Lopes and Silvano 2010; Hatami et al. 2013; Ferreira et al.
Page 5 of 59
https://mc06.manuscriptcentral.com/cgj-pubs
Canadian Geotechnical Journal

Draft
6
2015; Bathurst and Ezzein 2016; Cardile et al. 2016; Abdi and Mirzaeifar 2017; Kayadelen et al.
2018). The effects of several factors, such as the pullout box size, front and sidewall conditions,
sleeve length, soil and reinforcement properties, test speed and applied normal stress on the pullout
test results have been evaluated. In most of these investigations, the focus has been on
understanding the mechanisms of soil-structure interaction, development of pullout models of
varying complexity, and refining the test methodology to ensure consistent and reliable estimates of
the pullout capacity. However, the number of reported tests has been limited and often restricted to
one type of geosynthetic product or one product line.
Several attempts have been made to develop analytical models to estimate soil-geosynthetic
interaction under pullout loading conditions (e.g. Jewell et al. 1984; Koerner et al. 1989; Palmeira
and Milligan 1989; Gurung and Iwao 1999; Perkins and Cuelho 1999; Moraci and Gioffrè 2006;
Berg et al. 2009; Cardile et al. 2017). The theoretical expressions used in these models to evaluate
the pullout resistance and the associated soil-geogrid interaction coefficient show some limitations.
In particular, these models do not take into account the true reinforcement geometry and
extensibility, and the soil dilatancy that strongly affect the pullout behavior.
While it is possible to track the load-displacement response of a geogrid layer in pullout
experiments, the behavior of the backfill soil as it interacts with the geogrid material is hard to
evaluate experimentally (Meguid 2014). Numerical methods are, therefore, considered more
suitable for that purpose. The discrete element (DE) method has been used by several researchers to
model soil-geogrid interaction (McDowell et al. 2006; Zhang et al. 2008; Bhandari and Han 2010;
Chen et al. 2012; Wang et al. 2016; Miao et al. 2017; Xu and Liang 2018). In this approach, the
geogrid is simulated using a set of spherical particles bonded together to form the geogrid shape.
The interaction between the geogrid and the surrounding soil is obtained through the contact
between discrete particles. Although microscopic parameters of the bonded geogrid particles are
determined using index tests, the complex geogrid deformation may not be accurately calculated
Page 6 of 59
https://mc06.manuscriptcentral.com/cgj-pubs
Canadian Geotechnical Journal

Draft
7
due to the inflexibility of the discrete particles. Moreover, since bonded particles are used to model
the continuous nature of the geogrid, the strains and stresses developing in the geogrid may not be
accurately obtained.
Tran et al. (2013) introduced an approach to simulate the pullout test by coupling both the
finite element and discrete element methods. In this procedure, the reinforcement layer is modeled
using finite elements whereas the backfill soil is modeled using discrete elements. The coupling of
the two methods can efficiently model the behavior of both the geogrid backfill material. Although
the coupled model was able to capture the important features of the problem, the method was
limited in considering the geogrid as linear elastic material.
Finite element method (FE) has been extensively used to analyze soil-structure interaction
associated with pullout procedure (e.g.Yuan and Chua 1990; Wilson-Fahmy and Koerner 1993;
Shuwang et al. 1998; Perkins and Edens 2003; Sugimoto and Alagiyawanna 2003; Siriwardane et
al. 2008; Rong et al. 2011; Abdi and Zandieh 2014; Hegde and Roy 2017; Gu et al. 2018; Touahmia
et al. 2018). In these studies, the geogrid geometry is often simplified either as a truss structure (in
2D analysis) or as a continuous sheet (in 3D analysis). These simplifications make it difficult to
separate the contributions of the frictional and bearing resistances with respect to the overall pullout
capacity of a geogrid-reinforced system.
In an attempts to capture the detailed geometry of an embedded geogrid, Hussein and
Meguid (2009 and 2013)modelled the geogrid pullout test using 3D FE analysis. The geogrid was
simulated using nonlinear elasto-plastic constitutive model that separates the elastic and plastic
strains. The analysis was performed using 6-noded solid elements for the soil and 3-noded
triangular membrane elements for the geogrid. The details of the grid apertures were taken into
account to capture the discontinuous nature of the geogrid. Although the finite element analysis,
conducted using explicit 3D geogrid geometry, has reasonably captured the pullout response and
predicted a load-displacement relationship that is consistent with the experimental data, the model
Page 7 of 59
https://mc06.manuscriptcentral.com/cgj-pubs
Canadian Geotechnical Journal

Draft
8
response was only reliable at the front face of the box as stresses and displacements inside the
model were not consistent with the measured results.
The objective of this study is to introduce a finite element approach that is suitable to
analyze soil-geogrid interaction under pullout loading condition. This numerical framework aims at
simulating the detailed geometry and material properties of both the geogrid and the surrounding
backfill in three-dimensions. The model is capable of capturing the severe nonlinearity of the
system caused by the contact and the large relative movements at the soil-geogrid interface.
Although emphasis is placed in this study on evaluating the contributions of the frictional and
bearing components of the pullout resistance, displacements, stresses, and strain fields near the
geogrid are also evaluated. The results of the numerical analysis including the detailed response of
the geogrid and the surrounding soil are compared with experimental data. The 3D FE analyses
presented in this study have been performed using the general finite element software
ABAQUS/Standard, version 6.13 (ABAQUS 2013).
NUMERICAL ANALYSIS
The numerical approach presented in this study is an extension of that reported by Hussein
and Meguid (2016). A case study involving pullout experiments performed on a biaxial geogrid
(Sugimoto and Alagiyawanna (2003) is carefully selected and used throughout this investigation.
Description of the Pullout Tests
The test setup involved a soil container measuring 0.52 m in length, 0.3 m in width and
0.625 m in height. The front wall composed of six acrylic plates 0.3 m 0.1 m to reduce the soil-
wall friction. The soil used in the experiment was Silica Sand No. 5 with D50 = 0.34 mm and a peak
friction angle of 29.9o (Dr = 70%) which was determined using laboratory triaxial tests. A biaxial
geogrid sample of 500 mm in length and 300 mm in width was used in the experiments (with
Page 8 of 59
https://mc06.manuscriptcentral.com/cgj-pubs
Canadian Geotechnical Journal

Draft
9
material and geometry similar to that presented by Hussein and Meguid in 2016). The sand was
placed in layers using the raining technique and the pullout load was applied through a clamp
attached to the front side of the geogrid sheet. Vertical stresses 49 kPa and 93 kPa were applied
above and below the box using air bags to prevent vertical movement of the geogrid during the test.
The geogrid was pulled out at a constant rate of 1.0 mm/min and both the load and lateral
movement were measured using load cells and displacement gauges, respectively.
Model Generation
The numerical model has been developed such that it follows the geometry and test
procedure used in the experiment. Detailed related to the different aspects of the model are given
below.
Geogrid model
The exact geogrid geometry (8 longitudinal ribs and 19 transverse bars) was modeled using
8-noded linear brick elements with 8 integration points (Fig. 2). The elasto-plastic material model
developed by Hussein and Meguid (2016) for the biaxial geogrid is used throughout this analysis.
The geogrid properties are summarised in Table 1. A non-deformable clamp is introduced at the
front side of the geogrid. The clamp is treated as linear elastic material with density of 7850 kg/m3,
Poisson’s ratio of 0.3, and Young’s modulus of 200 GPa. The geogrid is simulated using over 6,430
finite elements as shown in Fig. 2. It should be noted that the local increase in joint thickness is not
considered in the geogrid model in order to simplify the nonlinear contact analysis. This
approximation is expected to cause a slight reduction in bearing resistance that would develop at
these particular locations.
Backfill model
Page 9 of 59
https://mc06.manuscriptcentral.com/cgj-pubs
Canadian Geotechnical Journal

Draft
10
The sand used in the experiment is modeled using elasto-plastic Mohr-Coulomb failure
criteria with non-associated flow rule and the soil domain was discretized using 8-noded linear
brick elements (C3D8). The input parameters used in the finite element analysis are summarised in
Table 2. Soil dilation is integrated into the model using the classical stress-dilatancy framework
proposed by (Bolton 1986).
The Extended Mohr-Coulomb (EMC) model available in ABAQUS is an extension of the
classical MC failure criterion. It is an elastoplastic model that uses the yield function of Mohr-
Coulomb form in addition to a hardening law and a flow rule. The yield function includes isotropic
cohesion hardening/softening. However, the model uses a flow potential that has a hyperbolic shape
in the meridional stress plane and a piecewise elliptic shape (with no corners) in the deviatoric
stress space. This flow potential, which is continuous and smooth in the deviatoric and meridional
stress planes, ensures that the flow direction is always uniquely defined in this plane.
Although soil material generally behaves non-linearly with stress-dependant stiffness, and
ABAQUS MC model may not consider the variation of elastic modulus with stress, the model is
considered to be acceptable for the current application. It should be noted that, during the pullout
process, particle interlocking can cause significant increase in normal stresses at the soil-
reinforcement interface. This behavior may not be accurately captured by the adopted model.
Modeling procedure
The model was divided into four main domains as shown in Fig. 3. The bottom soil domain
(BS) was first generated in three stages (around 10 cm each) and the geostatic stress state was
established for each stage. Then, the geogrid (GEO) was added and the soil elements needed to fill
the openings (SoilOPN, with a thickness of 0.8 mm) were introduced in a separate step. Finally, the
top soil domain (TS) of around 30 cm in thickness was generated in stages (around 10 cm each) to
Page 10 of 59
https://mc06.manuscriptcentral.com/cgj-pubs
Canadian Geotechnical Journal

Draft
11
reach the soil surface. A partial view of the 3D mesh is presented in Fig. 3 with half of the top soil
removed for illustration purposes. It is worth noting that soil elements located above and below the
geogrid can interact directly with each other through the soil elements present in the openings
(SoilOPN) leading to soil continuity, which closely models the geogrid embedment in the backfill
material. This is achieved numerically by merging the three soils domains together, using the
meshing merge tool in ABAQUS, to form one soil part.
Sensitivity analysis was first conducted using different element sizes to determine a suitable
mesh refinement that brings a balance between accuracy and computing time. The 3D FE mesh,
with over 153,170 elements, is shown in Fig. 3. The mesh size was adjusted in the vertical direction
around the geogrid to provide sufficient resolution in the interaction area. Boundary conditions were
defined such that nodes along the vertical boundaries may only translate freely in the vertical
direction (smooth rigid). Nodes at the base are fixed against displacements in all directions (rough
rigid). Details related to the development of the FE model can be found elsewhere (Hussein 2016).
Contact Analysis
Modeling soil-geogrid interaction is considered one of the challenging tasks in this analysis.
The pullout experiment generally involves large deformations that lead to relative movements
between the geogrid and the surrounding backfill. This results in a severe nonlinear response at the
contact in addition to other sources of material nonlinearity due to the adopted geogrid and soil
models. Moreover, modeling the contact interface in three-dimensions requires careful attention to
the details so that the analysis can be successfully completed within a reasonable time. Fig. 4 shows
the modeling approach used to simulate the soil-geogrid interaction in this study. This contact
interaction is enforced through the master-slave contact pair technique available in ABAQUS.
Additional model details are given below.
Page 11 of 59
https://mc06.manuscriptcentral.com/cgj-pubs
Canadian Geotechnical Journal

Draft
12
Master-slave contact pair
The master-slave contact pair approach is a surface-based contact simulation in which we
define surfaces for the bodies that could potentially be in contact during the analysis. Then, assign
the mechanical contact property models that will control the relationship between the contacting
bodies. In doing so, one surface in the contact pair is designated to be the slave surface and the
other is the master surface. It is suggested that the body with the finer mesh be treated as the slave
while the body with coarser mesh be the master. In the current study, the soil domain above (and
below) the geogrid and inside the apertures was coarser and therefore, the soil was taken as the
master surface and the geogrid as the slave surface.
Contact interaction
To define the contact between any pair of surfaces, three main aspects need to be addressed.
First, how the contact constraints are defined (discretized); then, how the constraints are enforced;
and third, how the constraints evolve upon sliding.
Contact discretization
ABAQUS offers two types of contact discretization, namely: i) surface-to-surface, and ii)
node-to-surface. In surface-to-surface formulation, the contact condition is enforced in an average
sense over regions in the vicinity of the slave nodes rather than only at individual nodes. On the
other hand, in node-to-surface discretization method, each contact condition involves a single slave
node and a group of nearby master nodes (master facet).
In the current study, we chose to simulate soil-geogrid interaction using surface-to-surface
contact discretization. Enforcing the contact in an average sense over a region surrounding each
Page 12 of 59
https://mc06.manuscriptcentral.com/cgj-pubs
Canadian Geotechnical Journal

Draft
13
slave node was found to produce more accurate contact stresses, and results in a better convergence
of the analysis.
Constraints enforcement
When surfaces are in contact, they usually transmit shear (tangential) as well as normal forces
across the interface. There is generally a relationship between these two force components. In a
mechanical contact simulation, the interaction between contacting bodies is usually defined by
assigning a contact property model to the concerned interaction. In this study, two types of
constitutive models are used; namely: i) friction model, and ii) contact pressure-overclosure
(penetration/clearance). The friction model is used to induce frictional stresses that resist sliding,
while the contact pressure-overclosure model controls the contact pressure that resists penetration in
the normal direction. Both models are used simultaneously for any contact pair involved in the
analysis. Detailed description of these constitutive models is given below.
i) Friction model
The friction model defines the force that resists the relative tangential motions of the contacting
surfaces. In ABAQUS, there are several options available to describe the stick/slip discontinuity
(frictional behavior) condition in the tangential direction. Among these options is the Coulomb
friction model with normal stress dependent friction coefficient. This model has been used in the
current study to simulate the frictional resistance between the soil and the geogrid.
Coulomb friction model
The basic concept of the Coulomb friction model is that every two contacting surfaces can
carry shear stresses up to a certain magnitude (critical) across their interface before they start sliding
relative to one another; this state is known as sticking (Fig. 5a). The model obeys the Mohr-
Coulomb failure criterion such that:
Page 13 of 59
https://mc06.manuscriptcentral.com/cgj-pubs
Canadian Geotechnical Journal
Draft
14
critical = c + n tan (3)
where critical is the shear strength at which the slip occurs for the first time, c is the apparent
cohesion, n is the normal stress, and is the interface friction angle at the yield/critical state.
The interface friction angle () between the sand and the geogrid can be obtained using
direct shear tests as shown in Fig. 5b. Hence, the friction interface coefficient ( ) can be 𝑓𝑑𝑠 = tan tan
calculated knowing the values of and the sand friction angle (). Subsequently, the value of the
coefficient of friction can be determined ( ). 𝑠𝑎𝑛𝑑/𝑔𝑒𝑜𝑔𝑟𝑖𝑑 = 𝑡𝑎𝑛
In ABAQUS Coulomb friction model, the sticking constraints at a given interface (Fig. 5a)
can be enforced using Lagrange multiplier contact algorithm. In this method, no relative motion
develops between the two closed surfaces until = critical. However, Lagrange multipliers increase
the computational cost of the analysis by adding more degrees of freedom to the model and often by
increasing the number of iterations required to obtain a converged solution. On the other hand, the
penalty function method (stiffness method) is also available in the Coulomb friction model and is
used in the present study. As shown in Fig. 5c, the penalty contact algorithm introduces a softer
constraint through a penalty parameter (tangential/shear stiffness, ks) that relates the frictional forces
to slip displacement. The method allows some relative motion of the surfaces (an elastic slip) when
they should be sticking. While the surfaces are sticking (i.e., < critical), the magnitude of sliding is
limited to this elastic slip (Eslip). Within this elastic stick condition, if the tangential load is removed,
the body returns to its original state. The advantage of using the penalty function method is that it is
easy to implement, and does not require solving nonlinear systems of equations in every time step.
The Coulomb friction model used in this study, in its simplest form, contains two material
properties, a friction coefficient (), and a tolerance parameter to calculate the elastic slip (Eslip).
Previous research recommends values of 0.9 to 1.0 for the frictional interface coefficient (fds)
Page 14 of 59
https://mc06.manuscriptcentral.com/cgj-pubs
Canadian Geotechnical Journal
Draft
15
between geogrid and sandy soils (Lopes et al. 2001; Liu et al. 2009). In the present analysis a value
of 0.9 was chosen, which corresponds to a coefficient of friction () equals to 0.51, knowing that
the friction angle () of the backfill is 29.9o.
ii) Contact pressure-overclosure model
This model is used to control the contact pressure that resists penetration. Open/closed
discontinuity in the normal direction is similar to the stick/slip discontinuity in the friction model.
Several models are available in ABAQUS to describe the contact behavior in the normal direction
(contact-pressure overclosure) of two contacting surfaces. Fig. 6 illustrates the most common
models used to simulate the contact pressure-overclosure relationship: the hard contact and the
softened contact models.
In this study, both models were simultaneously used at several locations along the soil-geogrid
interface. Constraints in the hard contact model (Fig. 6a) used in the analysis is enforced using the
augmented Lagrange method. No contact pressure develops until nodes are in contact (h = 0), and
once the contact has been established between the contacting surfaces, unlimited contact pressure
can be transmitted. The surfaces start to separate (h < 0) if the contact pressure reduces to zero (or if
the normal stress becomes tensile). The contact is re-established again when the clearance between
them reduces to zero.
Linear softened contact model is also used to enforce the contact in the normal direction using
the penalty stiffness method. This model describes a contact pressure-overclosure relationship in
which the contact pressure is a linear function of the penetration between the surfaces. The surfaces
transmit contact pressure when the overclosure/penetration, measured in the contact (normal
direction), is greater than zero. As depicted in Fig. 6b, the slope of this contact pressure-overclosure
relationship describes a constant penalty stiffness parameter (normal/contact stiffness, kn) in the
normal direction. The surfaces start to separate (h < 0) if the contact pressure reduces to zero or
Page 15 of 59
https://mc06.manuscriptcentral.com/cgj-pubs
Canadian Geotechnical Journal
Draft
16
tensile stresses started to develop. The softened contact model is preferred in cases of large
penetration as it makes it possible to resolve the contact condition. In addition, the numerical
softening associated with the penalty method can mitigate the over-constraint issues and reduce the
number of iterations required for model convergence.
Based on the above discussion, it is evident that hard contact model is preferred at particular
locations along the soil-geogrid interface where penetration is prevented in the normal direction.
The linear softened contact model with a specific contact stiffness value is used when penetration is
allowed in the normal direction (e.g. contact pressure developing along the transverse bars during
pullout while penetration of the geogrid into the soil is allowed in the pullout direction).
Evolution of surface contact
There are two tracking approaches available in ABAQUS to account for the relative motion
of two interacting surfaces. The first is a rigorous, nonlinear evolution (finite- sliding) while the
other is an approximate formulation (small- sliding).
Small-sliding contact assumes that there will be relatively little sliding of one surface along
the other and is based on linearized approximation. Although the approach brings less nonlinearity,
and is intended to reduce the solution cost and find a converged solution in a fewer iterations, the
method has a very limited applicability. This is due to the assumption that the relative tangential
motion should remain small throughout the analysis.
Finite-sliding contact, on the other hand, is the most general tracking approach and allows
for arbitrary relative separation, sliding, and rotation of the contacting surfaces. It includes
nonlinear geometric effects suitable for simulations that involve large deformations/rotations. As
the investigated pullout problem involves large deformation, the finite-sliding tracking formulation
is adopted in the analysis.
Page 16 of 59
https://mc06.manuscriptcentral.com/cgj-pubs
Canadian Geotechnical Journal

Draft
17
Assignment of contact models
When two bodies are in contact, normal as well as shear forces develop at the interface
between the contacting bodies. The formulation used to describe the tangential and normal behavior
should include separate constitutive models to simultaneously capture the two different behaviors.
This means that the contact formulation detects bodies that may come into contact at any time
during the course of the analysis and applies the constitutive models in the normal and tangential
directions to the interface. Based on this hypothesis, the current model incorporates the two
interface conditions (Fig. 7) as described below.
Horizontal soil-to-geogrid interface: this interface condition defines the contact between the
horizontal geogrid surfaces — on the longitudinal ribs (HL) and transverse bars (HT) — and the
horizontal surfaces of the top and bottom soils that will be in direct contact with geogrid surfaces
(Fig. 7a). During pullout loading, the applied vertical stresses (v = 49 kPa) will cause
normal/contact pressure on the horizontal interfaces. At the same time, the pullout loading creates
shear stresses on the same interface surfaces. Coulomb friction model with penalty contact
algorithm (Fig. 5c) is used to simulate the frictional behavior along the interface using a friction
coefficient () of 0.51. In addition, and on the same interface, a hard contact model (Fig. 6a) is
imposed to simulate the contact pressure in the normal direction. The hard contact is selected to
prevent penetration between the soil and the geogrid and maintain the geogrid in its vertical place
during the pullout process.
The frictional resistance on this horizontal soil-geogrid interface, which is dependent on the
contact pressure, is considered the frictional component of the total pullout capacity of the analyzed
model.
Page 17 of 59
https://mc06.manuscriptcentral.com/cgj-pubs
Canadian Geotechnical Journal

Draft
18
Vertical soil-to-geogrid interface: this interface condition defines the contact between the vertical
surfaces inside the geogrid apertures — on the longitudinal ribs and transverse bars — and the
vertical sides of the soil elements (SoilOPN) within the geogrid apertures (Fig. 7b).
As mentioned earlier, the contact formulation on each interface is simulated with frictional and
normal contact constitutive models. Within the geogrid apertures, there are two vertical interface
conditions (Fig. 7b) namely: i) vertical interface on the surfaces of the longitudinal ribs (VL), and
ii) vertical interface on the surfaces of the transverse bars (VT).
Longitudinal Ribs: For VL, the frictional resistance dominates the contact interaction that
contributes to the pullout resistance. This friction is simulated using Coulomb friction model similar
to that on HL for the same longitudinal elements ( = 0.51). However, contact pressure on the same
VL surfaces is modeled using hard contact to describe the confinement of the geogrid in the Y-Y
direction resulting from the soil interlocking within the geogrid aperture.
Transverse bars: The contact pressure developing on the transverse bars is described using the
softened contact pressure-overclosure model. As explained earlier, when the pullout load is applied,
frictional and bearing resistances will be mobilized along the interface between the soil and the
geogrid. During pullout, the geogrid slides on the horizontal interfaces between the soil and the
geogrid and frictional stresses are considered through the Coulomb friction model to resist slippage.
In addition, under pullout loading, the geogrid penetrates the soil and as a result, contact pressures
develop on the vertical surfaces of the transverse bars. Since the test includes large deformation
(around 25 mm applied displacement at the front side of the geogrid), the soft contact pressure-
overclosure model is considered suitable and used here to simulate the contact pressure on the
transverse bars. Using this model requires the definition of the contact stiffness (kn) values which
relate the contact pressure on the transverse bar to the penetration distance into the soil. This
parameter has to be calculated using the relative stiffness between the two contacting bodies. A
large value of contact stiffness can reduce penetration; however, it can also cause convergence
Page 18 of 59
https://mc06.manuscriptcentral.com/cgj-pubs
Canadian Geotechnical Journal

Draft
19
problems. Therefore, a proper contact stiffness value must be determined based on the allowable
penetration, which requires some user experience. Most FE programs recommend that users start
with a small initial kn value that can be gradually increased until a reasonable penetration is
achieved.
In this study, the propagation of the geogrid penetration into the soil is carefully
investigated considering the experimental results. Understanding the geogrid penetration during
pullout helps in selecting a proper kn value that can be used to simulate the behavior of the
transverse bars in the normal direction. The analysis involves 1,012 contact surfaces. This number
forms 506 contact pairs generated using the automatic contact detection tool available in ABAQUS,
and optimized according to the required configurations.
Modeling the Pullout Process
After the FE model was built, the vertical stress (v = 49 kPa) is applied simultaneously
above and below the soil sample to maintain the geogrid in place before the test. Fig. 8 shows the
displacement field of the model after the application of the vertical pressure (v = 49 kPa) at the top
and bottom of the soil. It could be seen that the deformation values decreased from the upper and
lower boundaries to reach zero at the mid-height of the box where the geogrid layer is located. It
should be highlighted that the vertical pressure is kept constant through the rest of the analysis.
Following the above step, the pullout load is introduced using a velocity control approach. Lateral
velocity was applied to the rigid clamp in 10 steps (2.5 mm each), using the same rate used in the
experiments (1 mm/min), to achieve a total frontal displacement (Ux) of 25 mm. Based on
experience in analyzing similar problems, the velocity control scheme is found to improve the
convergence of the analysis. It is worth noting that each pullout increment (step) was applied in 150
seconds with a velocity of 1.66e-05 m/sec (1mm/min loading rate) to complete a total of 2.5
mm/step (Ux = Vx time = 1.66e-05 150 = 0.0025m or 2.5mm/step).
Page 19 of 59
https://mc06.manuscriptcentral.com/cgj-pubs
Canadian Geotechnical Journal

Draft
20
RESULTS AND DISCUSSIONS
Validation of the Numerical Model
To validate the proposed model, the FE results are compared with the experimental data.
Fig. 9a shows the relationship between the pullout force and the frontal displacement obtained using
both the experimental data and numerical analysis. The numerical results generally agreed with the
experimental data except at low displacement level of less than 5 mm. This may be attributed to the
adopted simplification in modeling the thickness of the geogrid junction, which may result in
underestimating the interaction between the soil and the geogrid, particularly at the early stages of
the test.
To illustrate that the numerical model correctly calculates the geogrid response at the
frontal face as well as at other locations along the geogrid, Fig. 9b shows a comparison between the
calculated and measured displacements at different locations along the geogrid. Displacements
generally decreased with distance from the face up to the middle of the geogrid. Very small
displacements were calculated outside this region. The figure also confirms the agreement between
the experimental and numerical results obtained using the proposed modeling approach.
By examining the displacement reduction along the geogrid (Fig. 9b), it can be seen that the
rate of change in displacement is not constant. To shed some light on the role of kn on the response
of the system, a series of finite element analyses was conducted where the stiffness coefficient (kn)
was incrementally varied with distance along the geogrid and the values that correspond to the
observed response are determined. Fig. 10 illustrates these kn values which control the penetration at
each transverse bar. Four contact stiffness values have been chosen at different locations. In contrast
to the displacement distributions, the contact stiffness was found to increase with distance from the
face (where the pullout load is applied) indicating a stiffer response of the soil-geogrid system
Page 20 of 59
https://mc06.manuscriptcentral.com/cgj-pubs
Canadian Geotechnical Journal
Draft
21
inside the pullout box. It should be noted that kn is kept constant beyond the middle of the geogrid
length, which is consistent with the constant displacement found in this region.
Comparison with Analytical Solution
Several analytical methods are available to estimate the maximum pullout force (e.g.
Peterson and Anderson (1980). Although these methods can reasonably estimate the maximum
pullout force of a geosynthetic reinforcement, solutions specific to geogrid reinforcement are very
limited. Fig. 11 shows a summary of the measured and FE-calculated ultimate pullout resistance of
the geogrid as compared to analytical solutions. It is found that Peterson and Anderson (1980)
solution, which assumes general-failure mode for the passive bearing resistance, represents an upper
value of the pullout resistance whereas the analytical solution of Jewell et al. (1984), which assumes
punching-failure mode for the passive resistance, represents a lower bound for the pullout
resistance. In addition, the results are compared with two other analytical procedures that have been
developed for geotextile-reinforced soil (Weerasekara et al. 2017; Zornberg et al. 2017). The
methods, however, assume constant shear resistance along the interface and ignores the bearing
resistance of the transverse grid members. Therefore, the methods are expected to underestimate the
pullout force as compared to the measured value or that calculated using 3D FE analysis.
Fig. 11 also shows that both the experimental results and the finite element predictions are
located within the range of analytical solutions with tendency towards the upper bound line,
particularly at low overburden pressures. This is attributed to the fact that at low confining pressure
dilatancy can have a significant effect on the soil-geogrid interaction. This behavior also signifies
that general-failure mode of the passive resistance dominates the movement of the transverse
geogrid members. Additional details related to the analytical studies of pullout resistance can be
found elsewhere (Hussein 2016).
Page 21 of 59
https://mc06.manuscriptcentral.com/cgj-pubs
Canadian Geotechnical Journal

Draft
22
Response of the Geogrid
The deformed shape of the geogrid for a frontal displacement (Ux) of 10 mm and a vertical
pressure (v) of 49 kPa is shown in Fig. 12a. The largest geogrid deformation is found to occur near
the applied load and rapidly decrease with distance towards the rear side of the box. The
longitudinal elements of the geogrid experienced deformation in their axial direction with the
largest elongation occurring near the loaded side. It should be noted that part of the geogrid that is
directly connected to the loading clamp becomes unconfined right after the load application, which
results in a softer behavior and larger elongation in that region. Transverse members, on the other
hand, showed considerable bending deformation particularly near the loaded side. This bending
behavior originates from the frictional forces acting at the upper and lower surfaces of the
transverse bars as well as the bearing forces acting to resist the geogrid penetration into the soil.
Fig. 12b shows two additional patterns that describe the geogrid penetration into the soil located
within the apertures (SoilOPN). The transverse bars left its original locations and moved in the
pullout loading direction. The distribution of the stresses developing in the geogrid is shown in Fig.
13. In consistency with the displacement pattern, the stresses Sxx were maximum near the front side
and decreased with distance along the geogrid. It can be also realized that stresses in the
longitudinal members are much larger compared to the transverse bars.
The tensile force distributions in the longitudinal members for different frontal
displacements are illustrated in Fig. 14. At a given location along the geogrid, the average tensile
force (Txx) in all longitudinal members was found to increase with the increase in frontal
displacements. For the considered range of frontal displacements, the force Txx was large near the
front side and rapidly decreased towards the middle of the geogrid. Beyond the middle area, Txx
became negligibly small due to the insignificant displacement experienced by the rest of the
geogrid.
Page 22 of 59
https://mc06.manuscriptcentral.com/cgj-pubs
Canadian Geotechnical Journal

Draft
23
Contributions of Bearing and Frictional Resistances
The used geogrid comprises longitudinal and transverse members as well as junctions
connecting these members. Each of these components contributes to the total pullout force. Since
the resistance of the junctions is considered in the frictional resistance of the geogrid, the total
pullout resistance Fpull can be written as:
Fpull = Ffriction + Fbearing (4)
where, Ffriction is the frictional resistance component arising from the geogrid surface, Fbearing is the
bearing resistance of the transverse members.
To understand the separate contributions of the bearing and frictional resistances,
researchers usually test the geogrid in the laboratory with and without transverse bars by removing
the bars that are responsible for developing the bearing resistance (e.g. Alagiyawanna et al. 2001).
Similarly, researchers have followed this elimination procedure in numerical analysis (e.g. Wang et
al. 2016). This technique is not recommended by the authors as removing the transverse bars will
result in both frictional and passive bearing resistances being eliminated.
To assess the contribution of the bearing component in the present study, the transverse
bars are kept with their frictional resistance in the original geometry; however, kn (contact stiffness)
parameter that controls the bearing resistance is reduced. By reducing kn value, in the normal
direction (on the surfaces of the transverse bars VT) to zero, the bearing resistance developing on
these members will diminish. This technique will eliminate the bearing resistance only from the
transverse bars however the effect of the frictional resistance on the horizontal surfaces of the
transverse bars (HT) remains the same. Since a kn value of zero can cause numerical instability, a
value of kn = 0.0001 was selected for the analysis.
To understand the cumulative contributions of the 18 transverse bars towards the total
pullout resistance, a procedure that includes 6 different steps was developed and implemented
Page 23 of 59
https://mc06.manuscriptcentral.com/cgj-pubs
Canadian Geotechnical Journal

Draft
24
employing 6 separate analyses. In each step, the bearing resistance component is deactivated (i.e. kn
is set to 0.0001) for a group of three transverse bars along the geogrid. This procedure is illustrated
in Fig. 15.
The bearing resistance on the transverse bars are determined numerically using the previous
procedure and the cumulative contribution to the total pullout force is presented in Fig. 16. It is
evident that decreasing the number of transverse members in 6 equal steps (from 18 members in
step-1 to 0 members in step-6) decreases the total pullout load and increases the relative movement
of the geogrid.
Comparing the results of the original configuration with the results of step-6 where no
bearing members contribute to the total pullout force allows one to calculate the frictional resistance
component. The separate contributions to the total pullout resistance is shown in Fig. 17. It can be
seen that the contribution of the frictional resistance is less than that of the bearing resistance
leading to bearing component (Fbearing) dominating the pullout resistance Fpull. The frictional
component contributed about 28% of the total pullout load. Similar observations were made by
previous researchers (e.g. Milligan and Palmeira 1987; Bergado and Jin-Chun 1994; Lopes and
Lopes 1999) confirming that, in this class of problems, bearing resistance component is generally
larger than frictional component.
Another way to understand soil geogrid interaction mechanism is by comparing the pullout
response with that of an equivalent planer sheet with no openings. Modeling geogrid using planer
sheet generally requires extensive calibration in order to balance the increase in geometric stiffness
associated with the continuous nature of the sheet. This has been generally used by researchers to
simplify 3D models involving geogrid reinforced soils (Huang et al. 2005). In these cases, only
frictional resistance is mobilized in the reinforcement layer, which may not reflect the actual
geogrid response. To illustrate the level of inaccuracy associated with such simplification, a
numerical model was developed using a planer sheet (52 cm x 30 cm). The biaxial geogrid, used in
Page 24 of 59
https://mc06.manuscriptcentral.com/cgj-pubs
Canadian Geotechnical Journal
Draft
25
this study, involves an open area of about 70%. This corresponds to an equivalent sheet thickness of
0.175 mm as recommended by Hussein and Meguid (2016). The pullout response of the geogrid is
compared with the equivalent planer sheet as shown in Fig. 18. Modeling the biaxial geogrid as a
planer sheet resulted in a reduction in the total pullout resistance of about 30%. This confirms the
previous finding that the bearing component contribute significantly to the overall resistance. In
addition, it is found that the planer sheet initially exhibits a stiffer response at low deformation
range. This is attributed to the limited elongation experienced by the continuous sheet as compared
to that experienced by the longitudinal ribs before the bearing resistance of the transverse ribs is
activated.
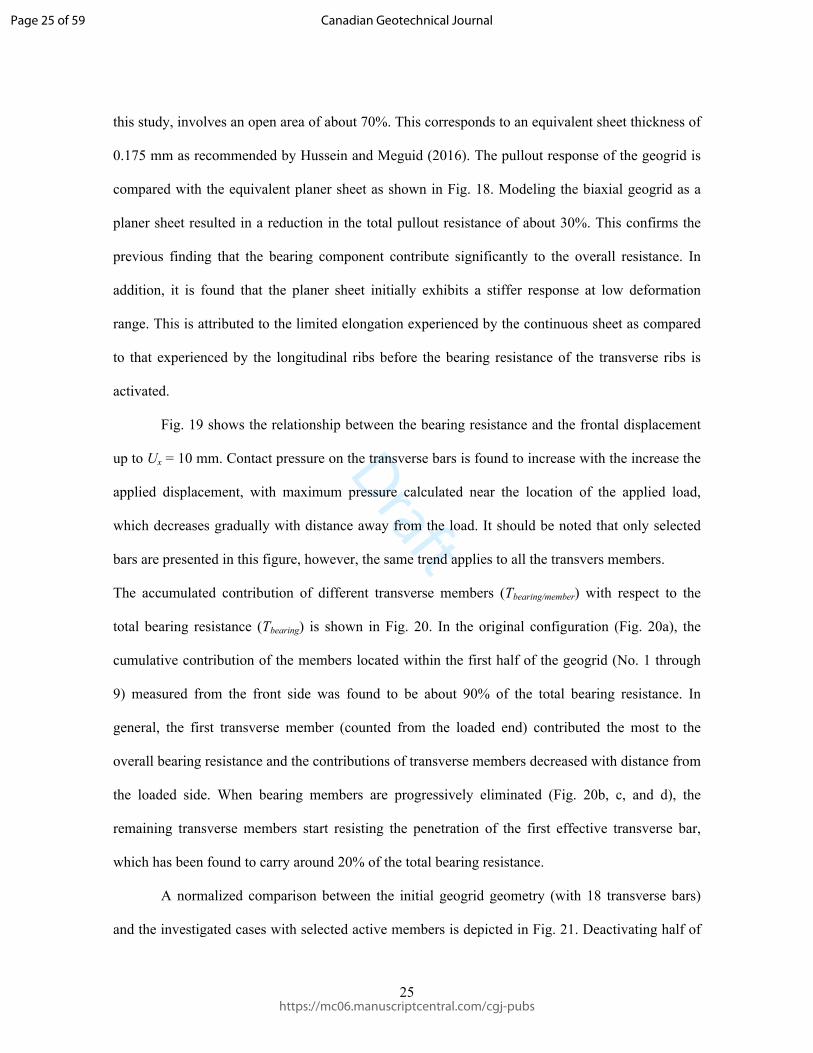
Fig. 19 shows the relationship between the bearing resistance and the frontal displacement
up to Ux = 10 mm. Contact pressure on the transverse bars is found to increase with the increase the
applied displacement, with maximum pressure calculated near the location of the applied load,
which decreases gradually with distance away from the load. It should be noted that only selected
bars are presented in this figure, however, the same trend applies to all the transvers members.
The accumulated contribution of different transverse members (Tbearing/member) with respect to the
total bearing resistance (Tbearing) is shown in Fig. 20. In the original configuration (Fig. 20a), the
cumulative contribution of the members located within the first half of the geogrid (No. 1 through
9) measured from the front side was found to be about 90% of the total bearing resistance. In
general, the first transverse member (counted from the loaded end) contributed the most to the
overall bearing resistance and the contributions of transverse members decreased with distance from
the loaded side. When bearing members are progressively eliminated (Fig. 20b, c, and d), the
remaining transverse members start resisting the penetration of the first effective transverse bar,
which has been found to carry around 20% of the total bearing resistance.
A normalized comparison between the initial geogrid geometry (with 18 transverse bars)
and the investigated cases with selected active members is depicted in Fig. 21. Deactivating half of
Page 25 of 59
https://mc06.manuscriptcentral.com/cgj-pubs
Canadian Geotechnical Journal

Draft
26
the transverse members (step-3) resulted in a reduction of the bearing resistance by about 50% and
hence only half of the pullout capacity becomes available in the system.
The change in tensile forces in the geogrid under different configurations, with references to Fig.
15, is further examined by plotting the changes in tensile forces for the investigated scenarios as
illustrated in Fig. 22. It can be seen that, for the original configuration, the tensile forces in the
longitudinal ribs decrease with distance along the geogrid. Deactivating transverse bars causes the
tensile forces to become constant for the distance where no transverse bars existed and then started
to decrease with distance towards the free end. This is attributed to the absence of confinement in
the areas where transverse bars are absent. For example, in step-4, the tensile force was constant at a
value of 0.2 kN up to a distance of 0.34 m then decreased to zero at the free end. This constant load
is similar to that of the tensile stresses that develop when a geogrid is tested in air where no
confinement existed and the role of the transverse ribs in carrying tensile load is very minimum
(Hussein and Meguid 2016).
Response of the Backfill Material
The vertical stress distribution is calculated on a horizontal plane located 50 mm above the
geogrid and the results are presented in Fig. 23. This location was chosen to avoid stress
concentration zones located at the geogrid location. Before the pullout starts (Ux = 0 mm/initial
condition), the vertical stress distribution was approximately constant and equal to the applied
vertical stress (v = 49 kPa). With the increase in frontal displacement, an increase in the vertical
stress is calculated with a maximum value developing at the front face. Similar observations were
made by (Tran et al. 2013; Wang et al. 2016). This increase in pressure is attributed to the fact that
geogrid movement towards the front wall generates additional horizontal forces, which restrain the
soil dilatancy near the boundary.
Page 26 of 59
https://mc06.manuscriptcentral.com/cgj-pubs
Canadian Geotechnical Journal

Draft
27
Fig. 24 shows the displacement field in the soil domain at a frontal displacement of 10 mm.
It can be seen that most of the soil movement is concentrated near the front face of the box leading
to soil densification in that area. Away from the pullout zone, soil movement was mostly vertical
pointing towards the geogrid. This displacement pattern changed at the geogrid location where
movements became more horizontal pointing to the pullout direction. At the front wall, vertical
movement was found where soil particles started to move away from the geogrid. These
observations agree well with the results of the X-ray radiographs reported by (Sugimoto et al.
2001). Similar soil movement pattern in pullout tests has also been reported by Jewell (1980) and
Dyer (1985).
Fig. 25 illustrates the AC YIELD (ACtively yielding) zone, which is a scalar quantity denoting the
onset of soil yielding. A value of 0 indicates that the soil has not yielded, and a value of 1.0
indicates that the soil has yielded and plastic strains developed during that loading increment. The
shape of the plastic strain in this figure represents the plasticity developing immediately in front of
the bearing members which is consistent with the theoretical bearing resistance mechanism
described by Jewell et al. (1984) and Dyer (1985). The size of the developed plasticity zone was
found to increase with the increase in applied frontal displacement.
SUMMARY AND CONCLUSIONS
This study investigated the pullout behavior of a biaxial geogrid embedded in granular soil
using 3D finite element analysis. In developing the FE model, the details of the geometrical features
of the geogrid are explicitly simulated. The geogrid was modeled using an elasto-plastic constitutive
model that has been previously developed and validated by the authors. The backfill material was
simulated using Mohr-Coulomb failure criterion. A detailed procedure of the contact modeling
technique used in the analysis is described. This includes the contact constitutive models in both the
tangential and the normal directions, the contact discretization, and the constraints evolution. A
Page 27 of 59
https://mc06.manuscriptcentral.com/cgj-pubs
Canadian Geotechnical Journal

Draft
28
softened contact pressure-overclosure model is used to simulate the behavior of the transverse
members. This model is governed by a penalty stiffness parameter that has been calibrated in this
study using the actual displacement distributions obtained from the experimental data. The
displacements and stresses developing in the geogrid were calculated and the backfill movements
and plastic strains developing in the soil were investigated.
Most of the geogrid stresses and displacements occurred near the front side of the box with
rapid decrease with distance towards the middle of the geogrid. The load transfer mechanism has
been investigated by examining the distribution of the tensile forces, contact pressures, and the
displacements along the geogrid while progressively deactivating selected transverse members. This
was achieved in six separate steps and the contributions of the frictional and bearing resistance
components to the total pullout load is evaluated. For the investigated geogrid and soil conditions,
the contribution of the bearing resistance to the total pullout capacity was found to be larger than
the frictional resistance. The contribution of the bearing resistance was found to increase as the
geogrid displacement increased and the total capacity decreased with reduction in the number of
bearing members. The accumulated contribution of the different transverse members to the total
bearing resistance was also evaluated. The first transverse member contributes the largest to the
total bearing resistance and the contributions of the transverse members decreased with distance
from the loaded side.
Soil movement and stresses agreed reasonably well with experimental observations. An
increase in soil stresses was found near the front face. The calculated plastic strain patterns are
found to be consistent with the theoretical approaches. Finally, the proposed FE approach has
proven efficient in modeling the pullout experiment in three-dimensions and capturing the response
of both the geogrid and the surrounding backfill material.
Page 28 of 59
https://mc06.manuscriptcentral.com/cgj-pubs
Canadian Geotechnical Journal

Draft
29
ACKNOWLEDGEMENTS
This research is supported by the Natural Sciences and Engineering Research Council of Canada
(NSERC) grant number RGPIN-2016-05263.
REFERENCES
AASHTO, American Association of State Highway and Transportation Officials. 2012. LRFD Bridge Design Specifications. 6th ed. Washington, D.C., USA, p. 1661.
ABAQUS, Version 6.13. 2013. ABAQUS User's Manuals. Dassault Systems Simulia Corp., USA. Providence,
Abdi, M.R., and Mirzaeifar, H. 2017. Experimental and PIV Evaluation of Grain Size and Distribution on Soil–Geogrid Interactions in Pullout Test. Soils and Foundations, 57(6): 1045-1058.
Abdi, M.R., and Zandieh, A.R. 2014. Experimental and Numerical Analysis of Large Scale Pull Out Tests Conducted on Clays Reinforced with Geogrids Encapsulated with Coarse Material. Geotextiles and Geomembranes, 42(5): 494-504.
Alagiyawanna, A.M.N., Sugimoto, M., Sato, S., and Toyota, H. 2001. Influence of Longitudinal and Transverse Members on Geogrid Pullout Behavior During Deformation. Geotextiles and Geomembranes, 19(8): 483-507.
ASTM/D6706-01. 2013. Standard Test Method for Measuring Geosynthetic Pullout Resistance in Soil. ASTM International. West Conshohocken, PA, USA.
Bakeer, R.M., Sayed, S.M., Cates, P., and Subramanian, R. 1998. Pullout and Shear Tests on Geogrid Reinforced Lightweight Aggregate. Geotextiles and Geomembranes, 16(2): 119-133.
Bathurst, R.J., and Ezzein, F.M. 2016. Geogrid Pullout Load-Strain Behaviour and Modelling using a Transparent Granular Soil. Geosynthetics International, 23(4): 271-286.
Berg, R.R., Christopher, B.R., and Samtani, N.C. 2009. Design of Mechanically Stabilized Earth Walls and Reinforced Soil Slopes - Volume I. U.S. Department of Transportation - FHWA, Report No. FHWA-NHI-10-024. NHI - National Highway Institute, Woodbury, Minnesota, USA, p. 332.
Bergado, D.T., and Jin-Chun, C. 1994. Pullout Force/Displacement Relationship of Extensible Grid Reinforcements. Geotextiles and Geomembranes, 13(5): 295-316.
Bhandari, A., and Han, J. 2010. Investigation of Geotextile-Soil Interaction under a Cyclic Vertical Load using the Discrete Element Method. Geotextiles and Geomembranes, 28(1): 33-43.
Bolton, M.D. 1986. The Strength and Dilatancy of Sands. Geotechnique, 36(1): 65-78.Cardile, G., Gioffrè, D., Moraci, N., and Calvarano, L.S. 2017. Modelling Interference Between the
Geogrid Bearing Members under Pullout Loading Conditions. Geotextiles and Geomembranes, 45(3): 169-177.
Cardile, G., Moraci, N., and Calvarano, L.S. 2016. Geogrid Pullout Behaviour According to the Experimental Evaluation of the Active Length. Geosynthetics International, 23(3): 194-205.
Chen, C., McDowell, G.R., and Thom, N.H. 2012. Discrete Element Modelling of Cyclic Loads of Geogrid-Reinforced Ballast under Confined and Unconfined Conditions. Geotextiles and Geomembranes, 35: 76-86.
Dyer, M.R. 1985. Observation of the Stress Distribution in Crushed Glass with Applications to Soil Reinforcement. A Ph.D. thesis, Department of Engineering Science, University of Oxford, Oxford, UK, p. 222.
Page 29 of 59
https://mc06.manuscriptcentral.com/cgj-pubs
Canadian Geotechnical Journal
Draft
30
Farrag, K., Acar, Y.B., and Juran, I. 1993. Pull-Out Resistance of Geogrid Reinforcements. Geotextiles and Geomembranes, 12(2): 133-159.
Ferreira, F.B., Vieira, C.S., Lopes, M.L., and Carlos, D.M. 2015. Experimental Investigation on the Pullout Behaviour of Geosynthetics Embedded in a Granite Residual Soil. European Journal of Environmental and Civil Engineering-(ahead of print issue), pp. 1-34.
Gu, J., Zhang, M., and Dai, Z. 2018. Numerical and Experimental Investigation of Tensile Behavior of Geogrids with Circular and Square Apertures. in: GeoShanghai 2018: International Conference in Ground Improvement and Geosynthetics. Springer, Singapore,
Gurung, N., and Iwao, Y. 1999. Comparative Model Study of Geosynthetic Pull-Out Response. Geosynthetics International, 6(1): 53-68.
Hatami, K., Mahmood, T., Ghabchi, R., and Zaman, M. 2013. Influence of In-Isolation Properties of Geogrids on Their Pullout Performance in a Dense Graded Aggregate. Indian Geotechnical Journal, 43(4): 303-320.
Hegde, A., and Roy, R. 2017. A Comparative Numerical Study on Soil–Geosynthetic Interactions Using Large Scale Direct Shear Test and Pullout Test. International Journal of Geosynthetics and Ground Engineering, 4(1): 2.
Huang, J., Han, J., and Collin, J. 2005. Geogrid-Reinforced Pile-Supported Railway Embankments: A Three-Dimensional Numerical Analysis. Transportation Research Record, 1936, 221-229.
Hussein, M.G. 2016. Numerical Modeling Framework for Soil-Geosynthetics Interaction Problems. A Ph.D. thesis, Department of Civil Engineering and Applied Mechanics, McGill University, Montreal, Canada, p. 222.
Hussein, M.G., and Meguid, M.A. 2009. On the 3D Modelling of Soil-Geogrid Interaction. in: GeoHalifax 2009, the 62nd Canadian Geotechnical Conference. Canadian Geotechnical Society, Halifax, Canada, Paper No. 138, pp. 986-991.
Hussein, M.G., and Meguid, M.A. 2013. Three-Dimensional Finite Element Analysis of Soil-Geogrid Interaction under Pull-out Loading Condition. in: GeoMontreal 2013, the 66th Canadian Geotechnical Conference. Canadian Geotechnical Society, Montreal, Canada, Paper No. 260, pp. 452-458.
Hussein, M.G., and Meguid, M.A. 2016. A Three-Dimensional Finite Element Approach for Modeling Biaxial Geogrid with Application to Geogrid-Reinforced Soils. Geotextiles and Geomembranes, 44(3): 295-307.
Jewell, R.A. 1980. Some Effects of Reinforcement on the Mechanical Behaviour of Soils. A Ph.D. thesis, Department of Engineering: Civil Engineering Devision, University of Cambridge, Cambridge, England, p. 309.
Jewell, R.A., Milligan, G.W.E., Sarsby, R.W., and Dubois, D. 1984. Interaction Between Soil and Geogrid. in: Polymer Grid Reinforcement. Thomas Telford, London, UK, pp. 18-30.
Kayadelen, C., Önal, T.Ö., and Altay, G. 2018. Experimental Study on Pull-out Response of Geogrid Embedded in Sand. Measurement, 117: 390-396.
Koerner, R.M., (2012). Designing with Geosynthetics, 6th ed. Xlibris Corporation, USA, Vol. 1 & Vol. 2.
Koerner, R.M., Wayne, M.H., and Carroll, R.G. 1989. Analytic Behavior of Geogrid Anchorage. in: Geosynthetics '89. IFAI San Diego, San Diego, California, USA, pp. 525-536.
Lentz, R.W., and Pyatt, J.N. 1988. Pull-Out Resistance of Geogrids in Sand. Transportation Research Record-(1188), pp. 48-55.
Liu, C., Zornberg, J., Chen, T., Ho, Y., and Lin, B. 2009. Behavior of Geogrid-Sand Interface in Direct Shear Mode. Geotechnical and Geoenvironmental Engineering, 135(12): 1863-1871.
Lopes, M.J., and Lopes, M.L. 1999. Soil-Geosynthetic Interaction-Influence of Soil Particle Size and Geosynthetic Structure. Geosynthetics International, 6(4): 261-282.
Page 30 of 59
https://mc06.manuscriptcentral.com/cgj-pubs
Canadian Geotechnical Journal

Draft
31
Lopes, M.L., and Silvano, R. 2010. Soil/Geotextile Interface Behaviour in Direct Shear and Pullout Movements. Geotechnical and Geological Engineering, 28(6): 791-804.
Lopes, P.C., Lopes, M.L., and Lopes, M.P. 2001. Shear Behaviour of Geosynthetics in the Inclined Plane Test – Influence of Soil Particle Size and Geosynthetic Structure. Geosynthetics International, 8(4): 327-342.
McDowell, G.R., Harireche, O., Konietzky, H., Brown, S.F., and Thom, N.H. 2006. Discrete Element Modelling of Geogrid-Reinforced Aggregates. Proceedings of the ICE-Geotechnical Engineering, 159(1): 35-48.
McGown, A., Andrawes, K.Z., Yeo, K.C., and DuBois, D. 1984. The Load-Strain-Time Behaviour of Tensar Geogrids. in: Polymer Grid Reinforcement. Thomas Telford, London, UK, pp. 11-17.
McLay, M.J. 1993. Pullout Testing of Geogrid Reinforcement. An M.Sc. thesis, Department of Civil Engineering, Royal Military College of Canada, Kingston, Ontario, Canada, p. 143.
Meguid, M.A. 2014. Recent Developments in Numerical Modelling of Composite Systems with Geogrid Inclusions. in: The International Workshop on Advanced Composites for Engineering Applications (ACEA 2014). The German University in Cairo, Cairo, Egypt, pp. 13-26.
Miao, C., Zheng, J., Zhang, R., and Cui, L. 2017. DEM Modeling of Pullout Behavior of Geogrid Reinforced Ballast: The Effect of Particle Shape. Computers and Geotechnics, 81: 249-261.
Milligan, G.W.E., and Palmeira, E.P. 1987. Prediction of Bond Between Soil and Reinforcement. in: International Symposium on Prediction and Performance in Geotechnical Engineering. Calgary, Canada, pp. 147–153.
Moraci, N., Cardile, G., Gioffrè, D., Mandaglio, M., Calvarano, L., and Carbone, L. 2014. Soil Geosynthetic Interaction: Design Parameters from Experimental and Theoretical Analysis. Transportation Infrastructure Geotechnology, 1(2): 165-227.
Moraci, N., and Gioffrè, D. 2006. A Simple Method to Evaluate the Pullout Resistance of Extruded Geogrids Embedded in a Compacted Granular Soil. Geotextiles and Geomembranes, 24(2): 116-128.
Moraci, N., and Recalcati, P. 2006. Factors Affecting the Pullout Behaviour of Extruded Geogrids Embedded in a Compacted Granular Soil. Geotextiles and Geomembranes, 24(4): 220-242.
Palmeira, E.M., and Milligan, G.W.E. 1989. Scale and Other Factors Affecting the Results of Pull-out Tests of Grids Buried in Sand. Geotechnique, 39(3): 511-524.
Perkins, S.W., and Cuelho, E.V. 1999. Soil-Geosynthetic Interface Strength and Stiffness Relationships From Pullout Tests. Geosynthetics International, 6(5): 321-346.
Perkins, S.W., and Edens, M.Q. 2003. Finite Element Modeling of a Geosynthetic Pullout Test. Geotechnical and Geological Engineering, 21(4): 357-375.
Peterson, L.M., and Anderson, L.R. 1980. Pullout Resistance of Welded Wire Mesh Embedded in Soil. Research Report Submitted to Hilfiker Pipe Co. Department of Civil Engineering at Utah State University, Logan, Utah, USA.
Rong, C., Maotian, L., and Dongxue, H. 2011. Improved Simulation Method for Soil-Geogrid Interaction of Reinforced Earth Structure in FEM. Transactions of Tianjin University, 17(3): 220-228.
Shuwang, Y., Shouzhong, F., and Barr, B. 1998. Finite-Element Modelling of Soil-Geogrid Interaction Dealing with the Pullout Behaviour of Geogrids. Acta Mechanica Sinica, 14(4): 371-382.
Siriwardane, H., Gondle, R., Kutuk, B., and Ingram, R. 2008. Experimental Investigation and Numerical Analysis of Reinforced Geologic Media. in: The 12th International Conference of International Association for Computer Methods and Advances in Geomechanics (IACMAG). Goa, India, pp. 4369-4376.
Sugimoto, M., and Alagiyawanna, A. 2003. Pullout Behavior of Geogrid by Test and Numerical Analysis. Geotechnical and Geoenvironmental Engineering, 129(4), 361-371.
Page 31 of 59
https://mc06.manuscriptcentral.com/cgj-pubs
Canadian Geotechnical Journal

Draft
32
Sugimoto, M., Alagiyawanna, A.M.N., and Kadoguchi, K. 2001. Influence of Rigid and Flexible Face on Geogrid Pullout Tests. Geotextiles and Geomembranes, 19(5): 257-277.
Touahmia, M., Rouili, A., Boukendakdji, M., and Achour, B. 2018. Experimental and Numerical Analysis of Geogrid-Reinforced Soil Systems. Arabian Journal for Science and Engineering, 34(10): 5295–5303.
Tran, V.D.H., Meguid, M.A., and Chouinard, L.E. 2013. A Finite-Discrete Element Framework for the 3D Modeling of Geogrid-Soil Interaction Under Pullout Loading Conditions. Geotextiles and Geomembranes 37: 1-9.
Wang, Z., Jacobs, F., and Ziegler, M. 2016. Experimental and DEM Investigation of Geogrid-Soil Interaction under Pullout Loads. Geotextiles and Geomembranes, 44(3): 230-246.
Weerasekara, L., Hall, B., and Wijewickreme, D. 2017. A New Approach for Estimating Internal Stability of Reinforced Soil Structures. Geosynthetics International 24(4): 419-434.
Wilson-Fahmy, R.F., and Koerner, R.M. 1993. Finite Element Modelling of Soil-Geogrid Interaction with Application to the Behavior of Geogrids in a Pullout Loading Condition. Geotextiles and Geomembranes, 12(5): 479-501.
Xu, C., and Liang, C. 2018. DEM Simulation of Pullout Tests of Geogrid-Reinforced Gravelly Sand. in: GeoShanghai 2018: International Conference in Ground Improvement and Geosynthetics. Springer, Singapore,
Yuan, Z., and Chua, K.M. 1990. Numerical Evaluation of the Pullout Box Method for Studying Soil-Reinforcement Interaction. Transportation Research Record-(1278), p. 116-124.
Zhang, J., Yasufuku, N., and Ochiai, H. 2008. Discrete Element Modelling of Geogrid Pullout Test. in: The 4th Asian Regional Conference on Geosynthetics. Shanghai, China, pp. 11-14.
Zornberg, J.G., Roodi, G.H., and Gupta, R. 2017. Stiffness of Soil-Geosynthetic Composite under Small Displacements: I. Model Development. Journal of Geotechnical and Geoenvironmental Engineering, 143(10): 1-13.
Page 32 of 59
https://mc06.manuscriptcentral.com/cgj-pubs
Canadian Geotechnical Journal

Draft
33
Figure Captions
Fig. 1. Pullout and direct sliding mechanisms
Fig. 2. Plan view of the geogrid mesh and geometry for the pullout model
Fig. 3. Details of the 3D mesh geometry for pullout modeling
Fig. 4. Details of soil-geogrid interaction (After Hussein and Meguid 2016)
Fig. 5. Description of the used Coulomb friction models
Fig. 6. Contact behavior in the normal direction
Fig. 7. Horizontal and vertical interface conditions
Fig. 8. Displacement field of the soil and the geogrid layer at (v = 49 kPa)
Fig. 9. Pullout response of the geogrid (v = 49 kPa)
Fig. 10. Suggested changes of kn values on the transverse bars along the geogrid
Fig. 11. Comparison between analytical and numerical results of pullout resistance
Fig. 12. Geogrid deformation and relative movements
Fig. 13. Geogrid stresses Sxx at Ux = 10 mm and v = 49 kPa
Fig. 14. Average tensile force Txx in the longitudinal members (v = 49 kPa)
Fig. 15. Procedure to assess the accumulative contributions of the bearing members
Fig. 16. Cumulative contribution of the bearing members to the total pullout resistance
Fig. 17. Components of the pullout resistance (v = 49kPa)
Fig. 18. Comparison of pullout force for actual geogrid and planer sheet
Fig. 19. Contact pressure developed on T-bars versus frontal displacement
Fig. 20. Contribution of the transverse members to the total bearing resistance (Ux = 10mm)
Fig. 21. Effect of removing transverse bars
Fig. 22 Change in tensile forces under different conditions at Ux = 10 mm
Fig. 23 Distribution of the vertical stresses (Szz) in the backfill material
Fig. 24. Displacement field of the soil specimen at Ux = 10 mm
Fig. 25. Contour plot of AC YIELD in the backfill soil at Ux = 10 mm
Page 33 of 59
https://mc06.manuscriptcentral.com/cgj-pubs
Canadian Geotechnical Journal

Draft
Table 1Properties of the biaxial geogrid
Aperture size (mm)
Specimen size(mm)
No. of members
Ult. strength (kN/m)
Stiffness @ 2% strain (kN/m)
Long. Trans. L W Long. Trans. Long. Trans. Long. Trans.
Mass/unit area (g/m2)
29 37 500 300 8 19 12 20 204 292 215
Table 2 Soil input parameters used in the FE analysis of pullout test
Elastic Modulus Poisson’s ratio Friction anglea Dilatancy angleb Cohesion
E (MPa) /cv (MPa)
50 0.3 29.9/28 3 1E-05
a = peak friction angle & cv = critical state friction angleb Determined using Bolton’s equation (1986)
Page 34 of 59
https://mc06.manuscriptcentral.com/cgj-pubs
Canadian Geotechnical Journal

Draft
1
potential failure plane
pullout mechanism
direct slide mechanismreinforcement
soil
direct shear test
pullout test
Fig. 1. Pullout and direct sliding mechanisms
Page 35 of 59
https://mc06.manuscriptcentral.com/cgj-pubs
Canadian Geotechnical Journal

Draft
2
Clamp
Pullout load10
cm
52 c
m
30 cm
0.8 mmthickness
33mm
25mm
4mm
1 2
34
5 6
78
8-nodelinear brick element
C3D8
Longitudinal ribs
Transvers bars
Fig. 2. Plan view of the geogrid mesh and geometry for the pullout model
Page 36 of 59
https://mc06.manuscriptcentral.com/cgj-pubs
Canadian Geotechnical Journal

Draft
3
ZY
X
BS
BS & GEO
BSGEOSoilOPN
BSSoilOPN
31 c
m31
cm
30 cm
52 cm
TS
BS
CLAMPPullout load
1 2
34
5 6
78
8-nodelinear brick element
C3D8
Fig. 3. Details of the 3D mesh geometry for pullout modeling
Page 37 of 59
https://mc06.manuscriptcentral.com/cgj-pubs
Canadian Geotechnical Journal
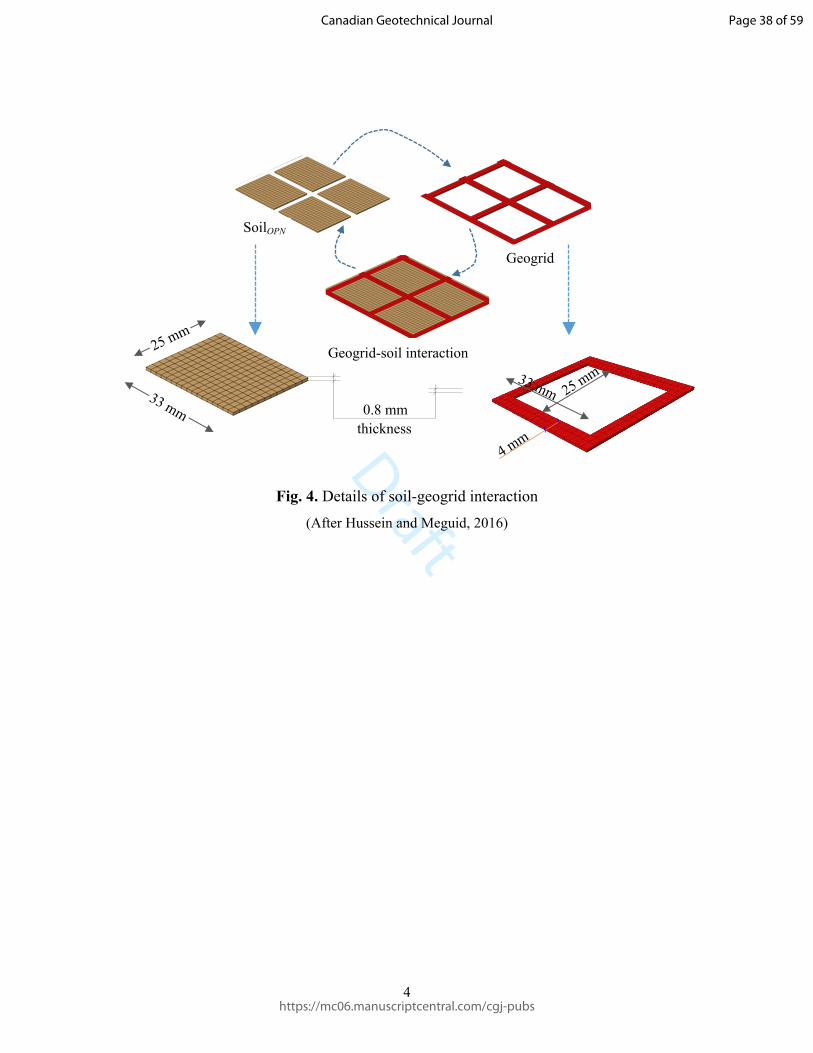
Draft
4
Geogrid
SoilOPN
Geogrid-soil interaction25 mm
33 mm25 mm33 mm
4 mm
0.8 mmthickness
Fig. 4. Details of soil-geogrid interaction
(After Hussein and Meguid, 2016)
Page 38 of 59
https://mc06.manuscriptcentral.com/cgj-pubs
Canadian Geotechnical Journal

Draft
5
critical
relative displacement/slip
shear stress
sticking
slipping
critical/cohesionless = n tan = n
a) Coulomb friction model in its basic form
shear stress
n normal stress
3
2
1
n1 n2 n3
sand/geogrid
𝑠𝑎𝑛𝑑/𝑔𝑒𝑜𝑔𝑟𝑖𝑑 = 𝑡𝑎𝑛 = 𝑛
𝑓𝑑𝑠 = 𝑡𝑎𝑛 𝑡𝑎𝑛
is the soil-geogrid interface friction angle is the soil friction anglefds is the friction interface coefficient
b) Parameters of direct shear test on soil-geogrid interface
shear stress
relative displacement/slip
critical
ks
slippingsticking
Eslip
c) Coulomb friction model using the penalty contact algorithm
Fig. 5. Description of the used Coulomb friction models
Page 39 of 59
https://mc06.manuscriptcentral.com/cgj-pubs
Canadian Geotechnical Journal

Draft
6
penetration distance, h
n contact pressure
h = 0
any pressure possible when in contact
Clearance/gap distanceh < 0
penetration distance, h
n contact pressure
h = 0
Clearance/gap distanceh < 0
a) Hard contact model(Constraints enforced with Lagrange multiplier method in the normal direction)
b) Linear softened contact model(Constraints enforced with the penalty method in the normal direction)
constraint stiffness
finite constraint stiffness
kn
Fig. 6. Contact behavior in the normal direction
Page 40 of 59
https://mc06.manuscriptcentral.com/cgj-pubs
Canadian Geotechnical Journal

Draft
7
direction of pullout loading
a) Horizontal surfaces of interface
longitudinal ribs
b) Vertical surfaces of interface
trans
vers
al b
ar
Z
XY
VT on transverse
VL on longitudinalHT on transverse
HL on longitudinal
Fig. 7. Horizontal and vertical interface conditions
Page 41 of 59
https://mc06.manuscriptcentral.com/cgj-pubs
Canadian Geotechnical Journal
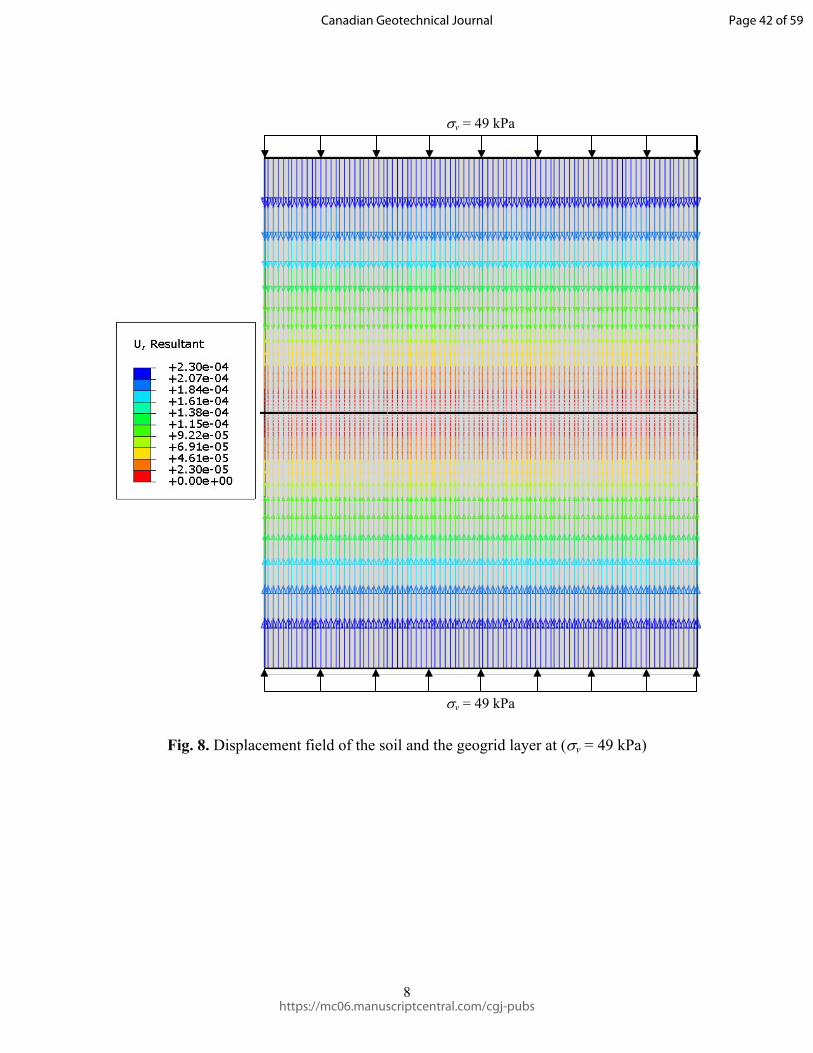
Draft
8
v = 49 kPa
v = 49 kPa
Fig. 8. Displacement field of the soil and the geogrid layer at (v = 49 kPa)
Page 42 of 59
https://mc06.manuscriptcentral.com/cgj-pubs
Canadian Geotechnical Journal

Draft
9
0 5 10 15 20 250
1
2
3
4
5
Sugimoto and Alagiyawanna (2003)
FEM
Frontal displacement (mm)
Pullo
ut fo
rce
(kN
)
a) Pullout load-frontal displacement relationship
0.0 0.1 0.2 0.3 0.4 0.5 0.60
5
10
15
20
25Sugimoto and Alagiyawanna (2003)FEM
Position along the geogid (m)
Dis
plac
emen
t (m
m)
b) Horizontal displacement along the geogrid
Fig. 9. Pullout response of the geogrid (v = 49 kPa)
Page 43 of 59
https://mc06.manuscriptcentral.com/cgj-pubs
Canadian Geotechnical Journal
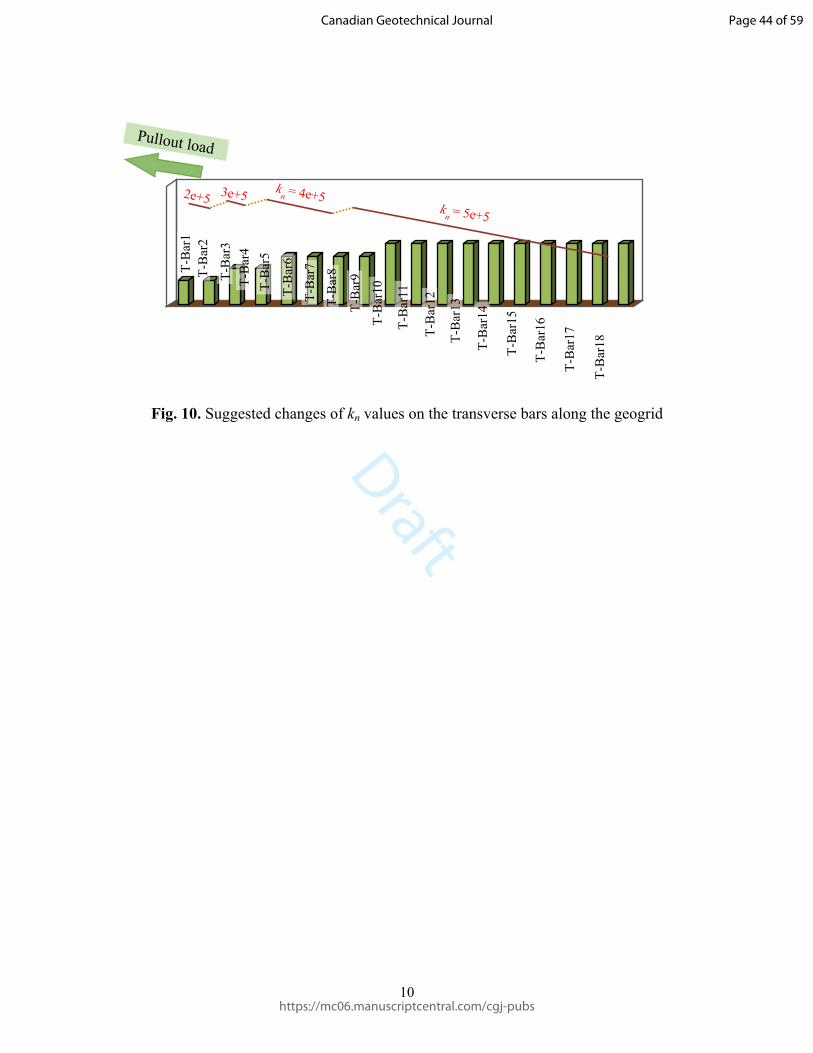
Draft
10
Fig. 10. Suggested changes of kn values on the transverse bars along the geogrid
2e+5 3e+5 kn = 4e+5
kn = 5e+5
Pullout load
T-B
ar1
T-B
ar2
T-B
ar3
T-B
ar4
T-B
ar5
T-B
ar6
T-B
ar7
T-B
ar8
T-B
ar9
T-B
ar10
T-B
ar11
T-B
ar12
T-B
ar13
T-B
ar14
T-B
ar15
T-B
ar16
T-B
ar17
T-B
ar18
Page 44 of 59
https://mc06.manuscriptcentral.com/cgj-pubs
Canadian Geotechnical Journal

Draft
11
5.07 kNFEA (current study)
Measured (2003)
Weerasekara et al. (2017)
Zornberg et al. (2017)
2.97 kN
0 10 20 30 40 50 60 700
1
2
3
4
5
6Peterson and Anderson (1980)
FEA (current numerical study)
Measured (Sugimoto and Alagiyawanna (2003)
Weerasekara et al. (2017)
Zornberg et al. (2017)
Jewell et al. (1984)
Confining Pressure, v (kPa)
Pullo
ut fo
rce
(kN
)
Jewel et al. (1984) lower boundPeterson an
d Anderson (1980) - u
pper bound
Fig. 11. Comparison between analytical and numerical results
Page 45 of 59
https://mc06.manuscriptcentral.com/cgj-pubs
Canadian Geotechnical Journal
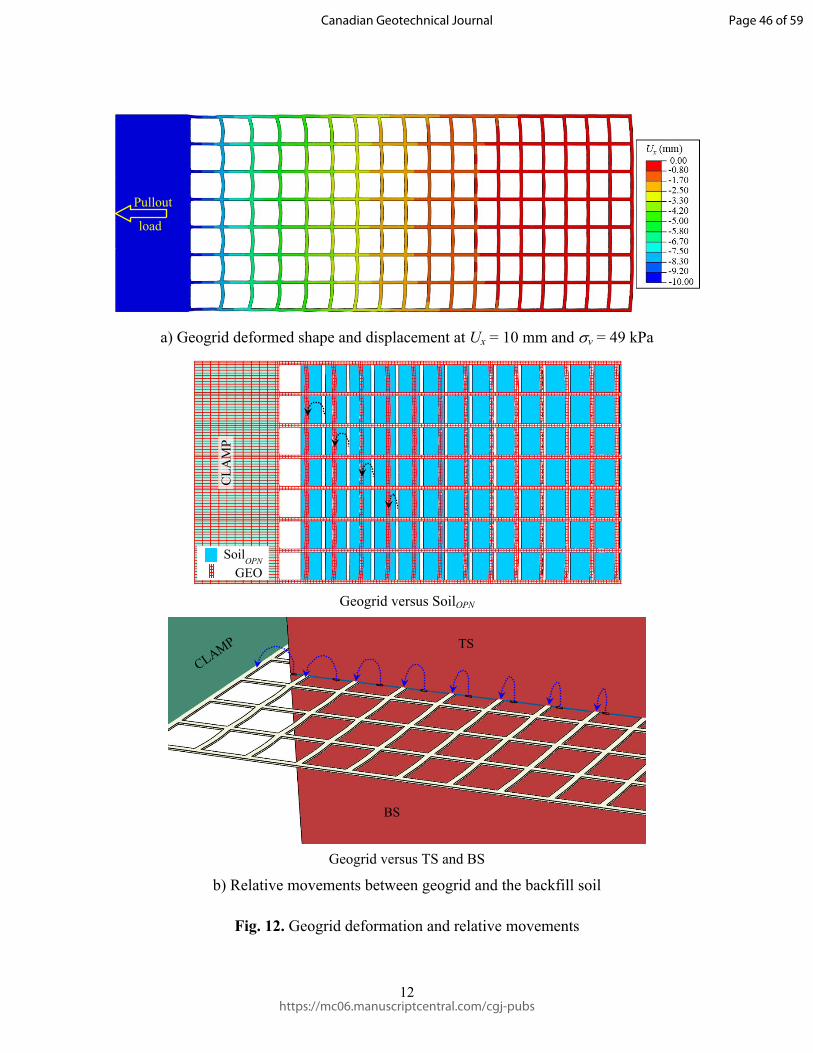
Draft
12
Pullout
load
a) Geogrid deformed shape and displacement at Ux = 10 mm and v = 49 kPa
SoilOPNGEO
CLA
MP
Geogrid versus SoilOPN
TS
BS
CLAMP
Geogrid versus TS and BS
b) Relative movements between geogrid and the backfill soil
Fig. 12. Geogrid deformation and relative movements
Page 46 of 59
https://mc06.manuscriptcentral.com/cgj-pubs
Canadian Geotechnical Journal

Draft
13
Pulloutload
Fig. 13. Geogrid stresses Sxx at Ux = 10 mm and v = 49 kPa
Page 47 of 59
https://mc06.manuscriptcentral.com/cgj-pubs
Canadian Geotechnical Journal
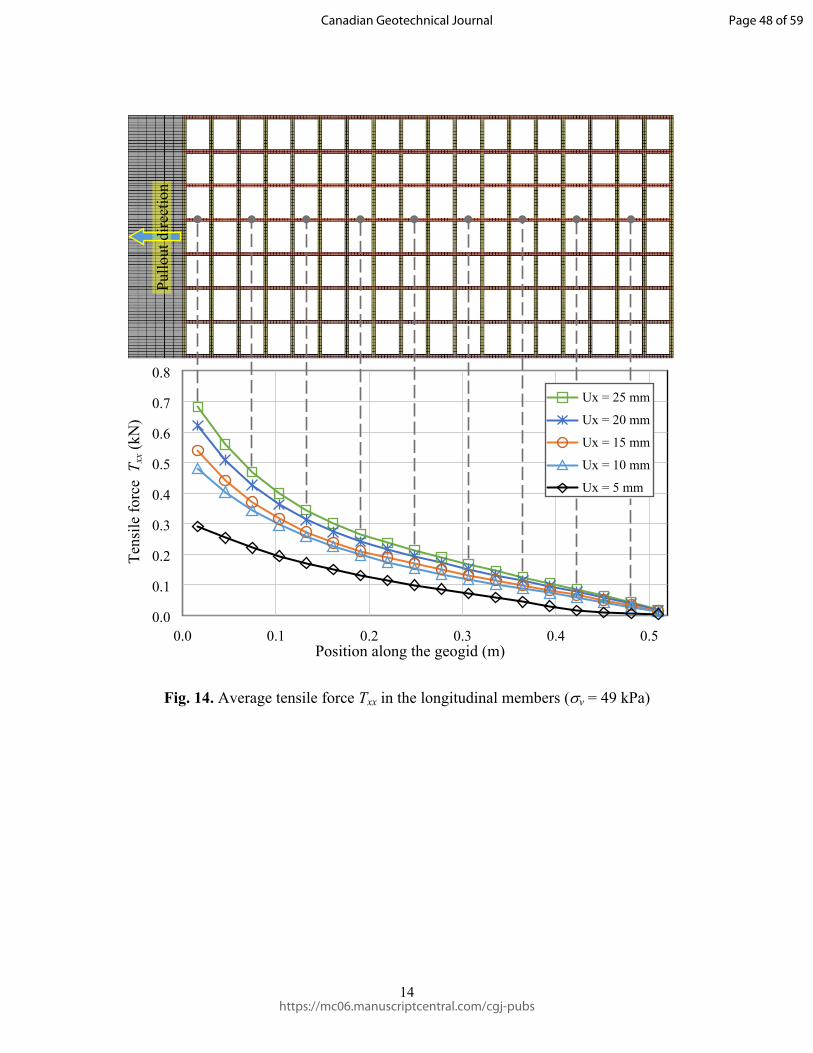
Draft
14
0.0 0.1 0.2 0.3 0.4 0.50.0
0.1
0.2
0.3
0.4
0.5
0.6
0.7
0.8
Ux = 25 mm
Ux = 20 mm
Ux = 15 mm
Ux = 10 mm
Ux = 5 mm
Position along the geogid (m)
Tens
ile fo
rce
Txx
(kN
)
Pullo
ut d
irect
ion
Fig. 14. Average tensile force Txx in the longitudinal members (v = 49 kPa)
Page 48 of 59
https://mc06.manuscriptcentral.com/cgj-pubs
Canadian Geotechnical Journal
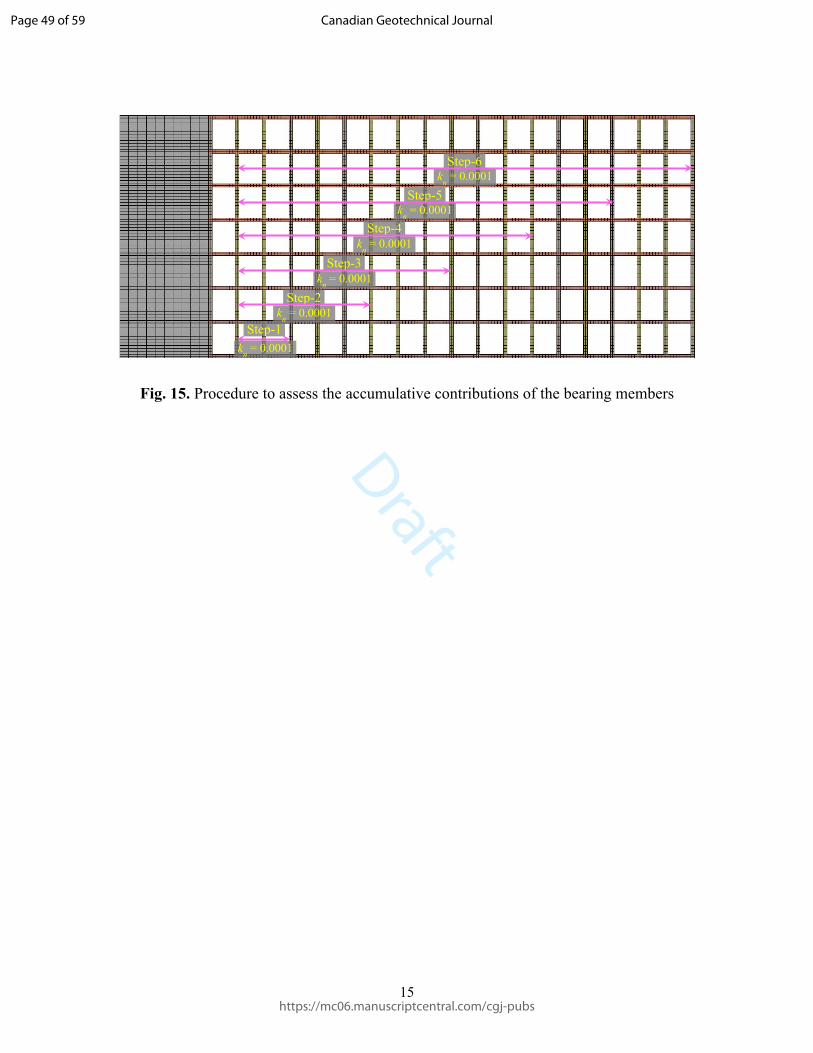
Draft
15
Step-1kn = 0.0001
Step-2kn = 0.0001
Step-3kn = 0.0001
Step-4kn = 0.0001
Step-5kn = 0.0001
Step-6kn = 0.0001
Fig. 15. Procedure to assess the accumulative contributions of the bearing members
Page 49 of 59
https://mc06.manuscriptcentral.com/cgj-pubs
Canadian Geotechnical Journal

Draft
16
0 5 10 15 20 250
1
2
3
4
5
Frontal displacement (mm)
Pullo
ut fo
rce
(kN
)
Total pullout Step-1
Step-2Step-3
Step-5
Step-4
Step-6/No bearing
(a)
(b)
Reducing the
number of T-Bars
0.0 0.1 0.2 0.3 0.4 0.50
5
10
15
20
25
Position along the geogid (m)
Dis
plac
emen
t (m
m)
Step-6/No bearing
Step-5
Step-4
Step-3Step-2
Step-1
Total pullout
Fig. 16. Cumulative contribution of the bearing members to the total pullout resistance
Reducing the
number of T-Bars
Page 50 of 59
https://mc06.manuscriptcentral.com/cgj-pubs
Canadian Geotechnical Journal

Draft
17
0 5 10 15 20 250
1
2
3
4
5
Frontal displacement (mm)
Pullo
ut fo
rce
(kN
)
Total pullout
Fbearing
Ffriction
Fpull
Step-6/No bearing
Fig. 17. Components of the pullout resistance (v = 49 kPa)
Page 51 of 59
https://mc06.manuscriptcentral.com/cgj-pubs
Canadian Geotechnical Journal

Draft
18
0 5 10 15 20 250
1
2
3
4
5
Original configuration
Planer sheet
Displacement (mm)
Tota
l pul
lout
resi
stan
ce (k
N)
30% reduction3.10 kN
4.42 kN
Fig. 18. Comparison of the calculated pullout force for a geogrid vs. a planer sheet
Page 52 of 59
https://mc06.manuscriptcentral.com/cgj-pubs
Canadian Geotechnical Journal
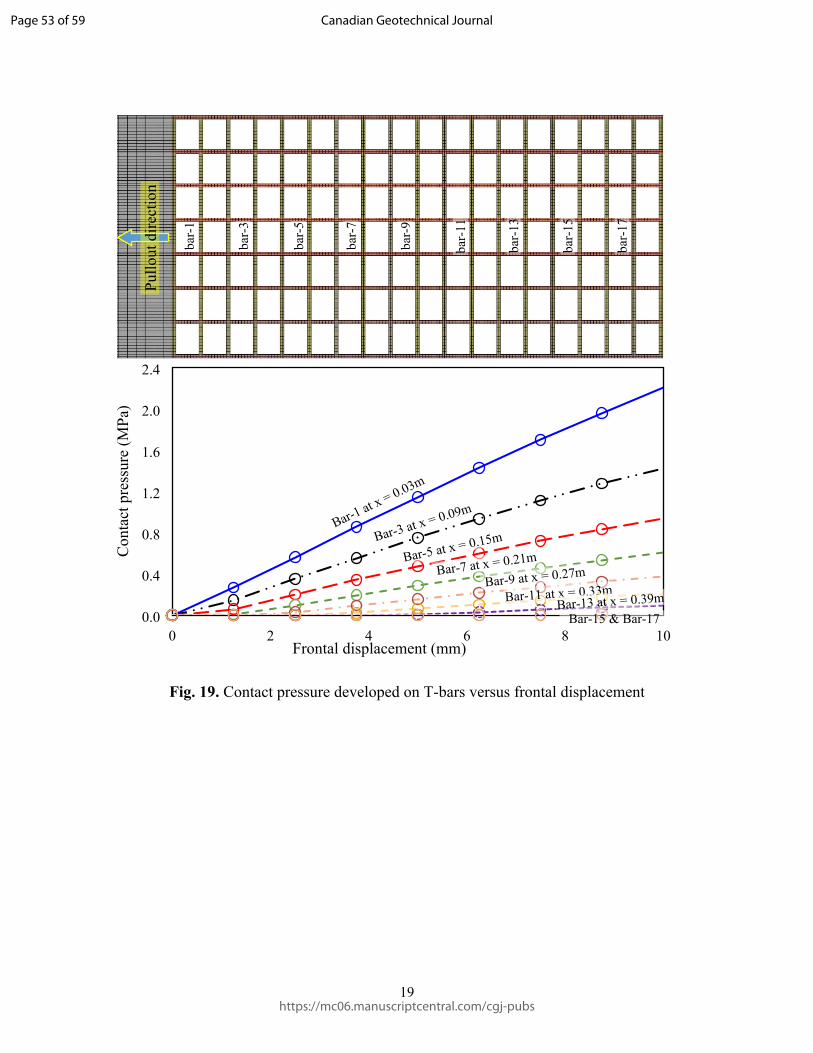
Draft
19
0 2 4 6 8 100.0
0.4
0.8
1.2
1.6
2.0
2.4
Frontal displacement (mm)
Con
tact
pre
ssur
e (M
Pa)
Bar-1 at x = 0.03m
Bar-3 at x = 0.09m
Bar-5 at x = 0.15m
Bar-7 at x = 0.21m
Bar-9 at x = 0.27m
Bar-11 at x = 0.33mBar-13 at x = 0.39m
Bar-15 & Bar-17
bar-
1
bar-
3
bar-
5
bar-
7
bar-
9
bar-
11
bar-
13
bar-
15
bar-
17
Pullo
ut d
irect
ion
Fig. 19. Contact pressure developed on T-bars versus frontal displacement
Page 53 of 59
https://mc06.manuscriptcentral.com/cgj-pubs
Canadian Geotechnical Journal

Draft
20
Pullout directionPosition along the geogrid (m)
a) Original configuration (18 members)
Transverse member number
2117
14 11 9 7 6 5 4 3 2 1.4 0.9 0.6 0.3 0.1 0.02 0.020.
03
0.06
0.09
0.12
0.15
0.18
0.21
0.24
0.27
0.30
0.33
0.36
0.39
0.42
0.45
0.48
0.51
0.54
0
10
20
301 2 3 4 5 6 7 8 9 10 11 12 13 14 15 16 17 18
Pullout directionPosition along the geogrid (m)b) Step-1 (two members removed)
Transverse member number
2117
1411 9 7 6 4 3 2.5 1.8 1.2 0.7 0.4 0.24 0.32
0.03
0.06
0.09
0.12
0.15
0.18
0.21
0.24
0.27
0.30
0.33
0.36
0.39
0.42
0.45
0.48
0.51
0.54
0
10
20
301 2 3 4 5 6 7 8 9 10 11 12 13 14 15 16 17 18
Pullout directionPosition along the geogrid (m)c) Step-2 (five members removed)
Transverse member number
2016
13 11 9 7 5.6 4.5 3.6 2.9 2.4 2.1 2.17
0.03
0.06
0.09
0.12
0.15
0.18
0.21
0.24
0.27
0.30
0.33
0.36
0.39
0.42
0.45
0.48
0.51
0.54
0
10
20
301 2 3 4 5 6 7 8 9 10 11 12 13 14 15 16 17 18
Position along the geogrid (m)d) Step-3 (eight members removed)
Transverse member number
1916
13 10.9 9.2 7.9 6.9 6.2 5.7 5.7
0.03
0.06
0.09
0.12
0.15
0.18
0.21
0.24
0.27
0.30
0.33
0.36
0.39
0.42
0.45
0.48
0.51
0.54
0
10
20
301 2 3 4 5 6 7 8 9 10 11 12 13 14 15 16 17 18
Fig. 20. Contribution of the transverse members to the total bearing resistance (Ux = 10mm)
Page 54 of 59
https://mc06.manuscriptcentral.com/cgj-pubs
Canadian Geotechnical Journal

Draft
21
100%
73.1%
56%49.2%
42.1%
18.1%
0.0%
18 T
-bar
s
15 T
-bar
s
12 T
-bar
s
9 T-
bars
6 T-
bars
3 T-
bars
0 T-
bars
Orig
inal
geo
grid
Step
-1
Step
-2
Step
-3
Step
-4
Step
-5
Step
-6
Fig. 21. Effect of removing transverse bars
Page 55 of 59
https://mc06.manuscriptcentral.com/cgj-pubs
Canadian Geotechnical Journal

Draft
22
0.0 0.1 0.2 0.3 0.4 0.50.0
0.1
0.2
0.3
0.4
0.5Total pulloutStep-1Step-2Step-3Step-4Step-5Step-6
Position along the geogid (m)
Tens
ile fo
rce
(kN
)
constant tensile forces
Step-4: distribution of tensile forces along the geogridStep-4
kn = 0.0001
Fig. 22 Change in tensile forces under different conditions at Ux = 10mm
Page 56 of 59
https://mc06.manuscriptcentral.com/cgj-pubs
Canadian Geotechnical Journal
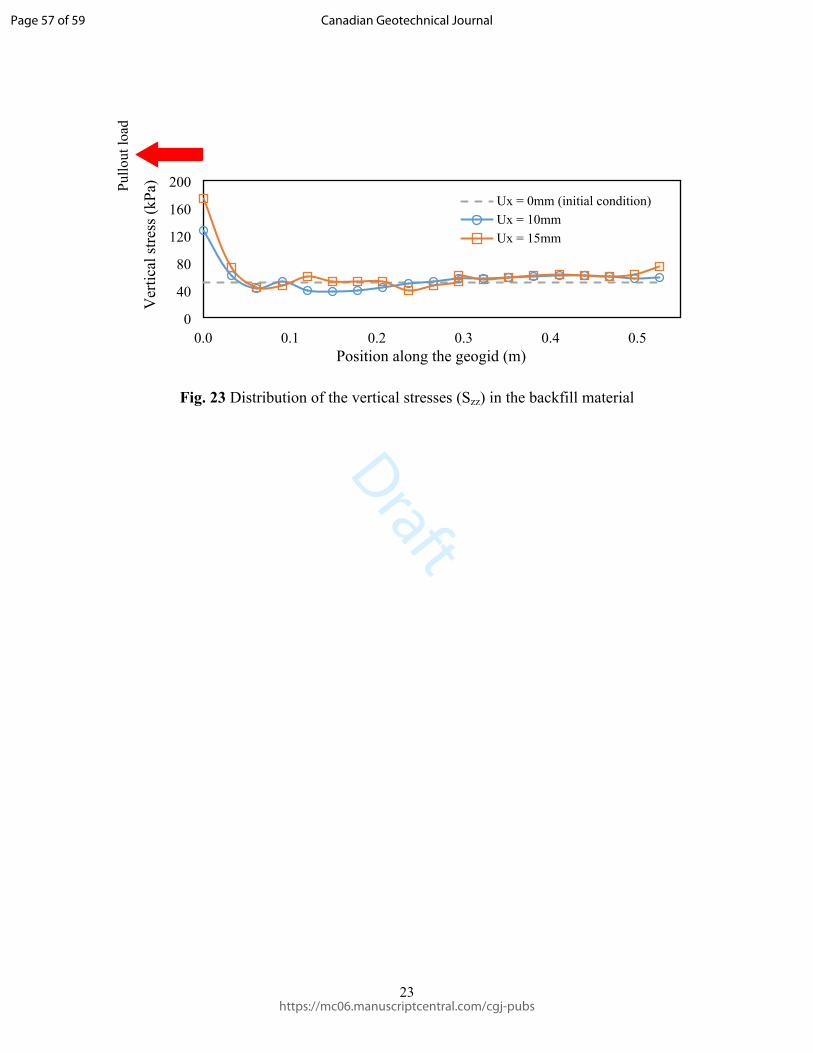
Draft
23
Pullo
ut lo
ad
0.0 0.1 0.2 0.3 0.4 0.50
40
80
120
160
200Ux = 0mm (initial condition)Ux = 10mmUx = 15mm
Position along the geogid (m)
Ver
tical
stre
ss (k
Pa)
Fig. 23 Distribution of the vertical stresses (Szz) in the backfill material
Page 57 of 59
https://mc06.manuscriptcentral.com/cgj-pubs
Canadian Geotechnical Journal

Draft
24
0.0 0.1 0.2 0.3 0.4 0.5Distance from the loading face (m)
0.0
0.2
0.1
0.4
0.5
0.6
Bac
kfill
hei
ght (
m)
0.3
Fig. 24. Displacement field of the soil specimen at Ux = 10 mm
Page 58 of 59
https://mc06.manuscriptcentral.com/cgj-pubs
Canadian Geotechnical Journal
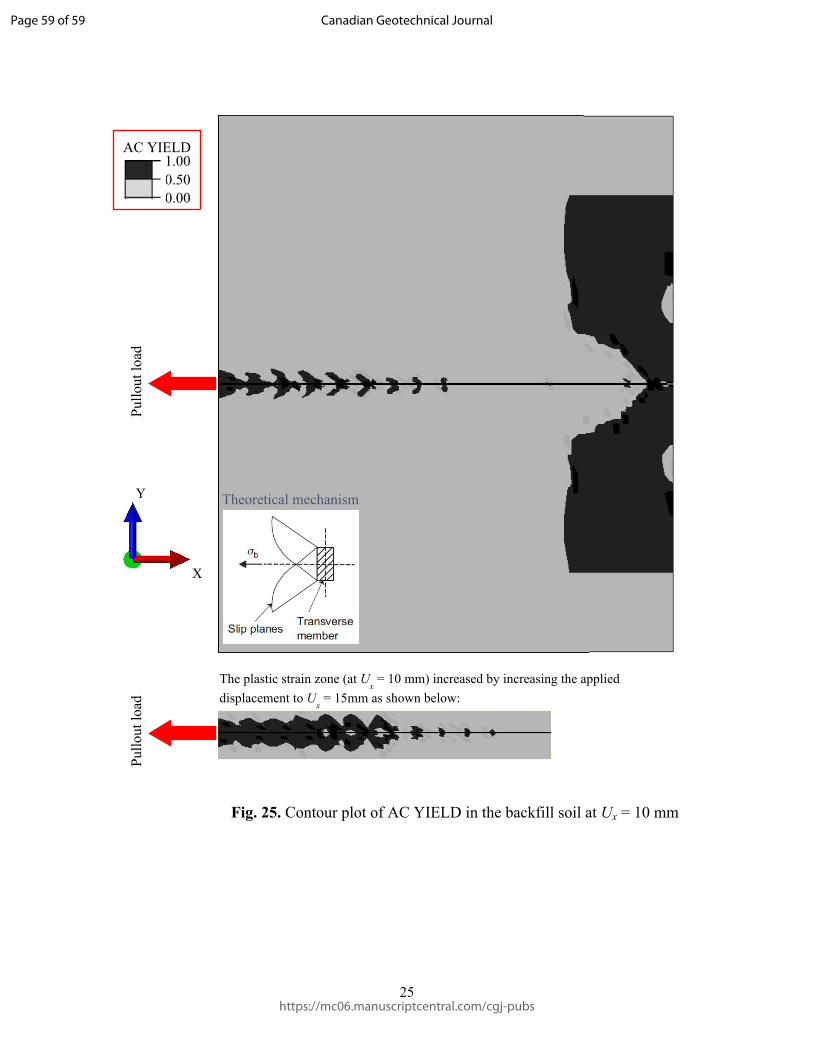
Draft
25
AC YIELD1.000.500.00
Pullo
ut lo
adPu
llout
load
X
Y
The plastic strain zone (at Ux = 10 mm) increased by increasing the applied
displacement to Ux = 15mm as shown below:
Theoretical mechanism
Fig. 25. Contour plot of AC YIELD in the backfill soil at Ux = 10 mm
Page 59 of 59
https://mc06.manuscriptcentral.com/cgj-pubs
Canadian Geotechnical Journal